the lost benefits of ineffective transport regulation in asia · the lost benefits of ineffective...
TRANSCRIPT

The Lost Benefits of Ineffective Transport Regulation in Asia: Quantifying the Impacts of Governance Failures
Markus Amann, Zbigniew Klimont1, Jens Borken-Kleefeld1, Chris Heyes1, Wolfgang Schöpp1 Eric Zusman, Naoko Matsumoto2, Katsuya Kasai2, Kai Po Jenny Law2, Ryoko Nakano2, Sudarmanto Budi Nughroho2, Andreas Jaeger2, Akiko Miyatsuka2, Nanda Kumar Janardhanan2, So-Young Lee2 Robert Earley, Alvin Mejia3, Chee Anne Roño3, Sameera Kumar3, Kaye Patdu3 Supat Wangwongwatana International Institute for Applied Systems Analysis, Laxenberg, Austria Institute for Global Environmental Strategies, Hayama, Japan Clean Air Asia, Manila, Philippines, Beijing, China, and New Delhi, India Regional Resource Centre for Asia and the Pacific, Bangkok, Thailand

Outline
• Why Diesel?
• Core Elements of a Clean Diesel Strategy
• Integrating Governance into Modelling
• Modelling Results
• Conclusions

The UNEP Studies on SLCPs

Source: WHO, 2012

Technological Solutions Exist
But No Silver Bullets

Three Core Elements of a Diesel Control Strategy

Non-Cost Barriers Arguably Most Formidable
PM Mitigation Option Health Impacta
Climate Impactb Costc Non-Cost Barriers Notes
Institutional
New Vehicle Emissions Standards + / $$
Technological challenge to make durable low-emitting engines
Low turn-over of rolling stock, deteriorating control technologies
Fuel Standards: ultra-low sulfur diesel ++ + $$ Refinery costs and
equipment Technology Enabler
Inspection/Maintenance (I/M) Programs +++ ++ $ Institutional barriers and
technical capacity In conjunction with ambient monitoring
Age Limits / Vehicle Retirement Programs ++ + $ Institutional barriers Equity considerations
Fuel Testing for Adulteration ++ + $ Institutional barriers Systemic-level
intervention needed Exhaust After-treatment
Oxidation Catalyst + / $ May require low sulfur diesel
Diesel Particulate Filter (DPF) ++ + $$ Can only be installed on
modern engines Requires low sulfur diesel
Catalyzed, Continuously Regenerating DPF +++ ++ $$$ Generally only supplied
with new engines Requires ultra-low sulfur diesel
Source: Reynolds, Kandlikar, and Grieshop, 2012
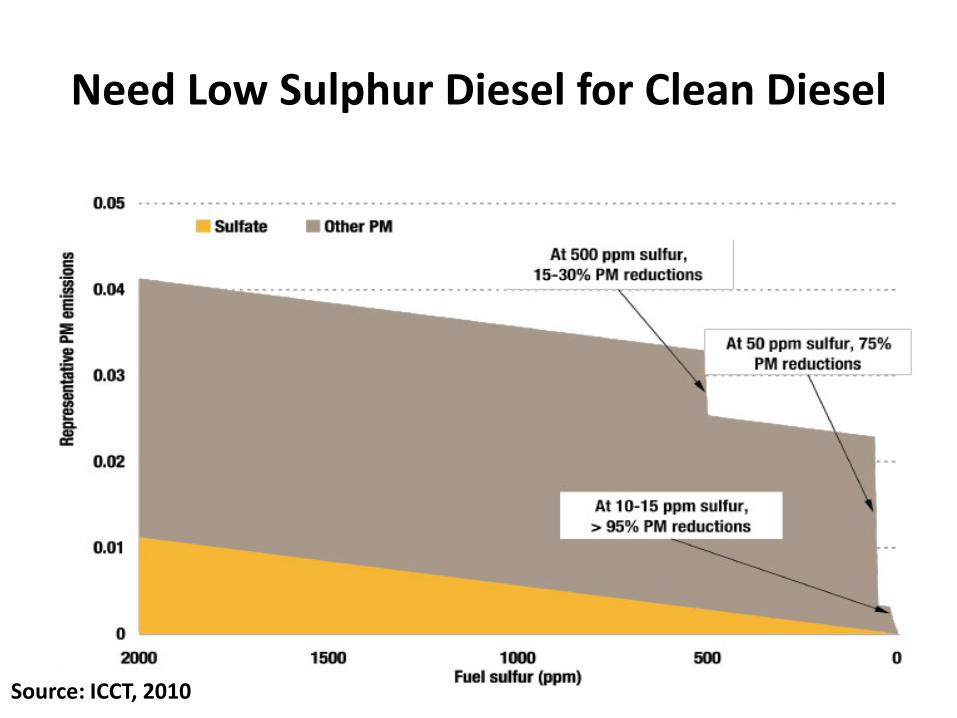
Need Low Sulphur Diesel for Clean Diesel
Source: ICCT, 2010

Sulphur Levels are Coming Down in Some Countries But Remain High in Others in Asia
Source: Clean Air Asia, 2014

Sulphur Levels Vary Within Countries
Source: Palguna and Safrudin, 2010

Subsidies for Diesel Fuels Remain High

Implementing I/M Diesel Programs is Challenging

Limited Information on I/M Diesel Programs
Location Program Type GVWR Test Procedure
Exhaust Constituents Measured
Percentage Failed
United Kingdom Decentralized >7700 J1667 Opacity 1.3
Arizona-Tucson Centralized >8500 LC Opacity 3.5
Washington/Pudget Sound Centralized >8500 J1667 Opacity 4
Washington/Vancouver Centralized >8500 J1667 Opacity 4
Utah/Utah County Decentralized >8500 J1667 Opacity 4.5 New York-Metropolitan Area Counties Decentralized >8500 J1667 Opacity 5.5
Nevada-Las Vegas and Reno Decentralized >8500 J1667 Opacity 7
Arizona-Phoenix Centralized >8500 J1667 Opacity 8.6
New Hampshire Roadside >10,000 J1667 Opacity 9
Nevada-Las Vegas and Reno Roadside >8500 J1667 Opacity 30 Canada/Vancouver-British Columbia Roadside
>11000 J1667 Opacity 48

Clean diesel can be an uphill battle for environment agencies
Subsidies
Fuel Quality
Standards
Emissions Standards
I/M Programmes
Ministry of Environment

Governance Matters
Non Gov
INGOs
NGOs/CSOs
Local NGOs/CSOs
Public
IOs
Nat Govs
Loc Gov
Private
TNCs
Nat Industry
SMEs
Global
National
Local


Key points
• Governance failures often undercut regulatory implementation
• How can these failures be integrated into models
• Two problems – Lags in implementation of standards
– Ineffective I/M programs

Analyze Three Scenarios
1. “original policy plans” the letter of emission control legislation
2. “current practices” • Lag in standards • I/M programmes
actual implementation schedules and enforcement practices
3. “leapfrog” direct transition from the current emission standards to Euro-6/VI equivalent standards

Pollutants Analyzed
• Pollutants from mobile sources – fine particulate matter (PM2.5) – nitrogen oxides (NOx) – black carbon
• for health impacts • co-controls on other ozone precursors
(NMVOC and CO) are also considered
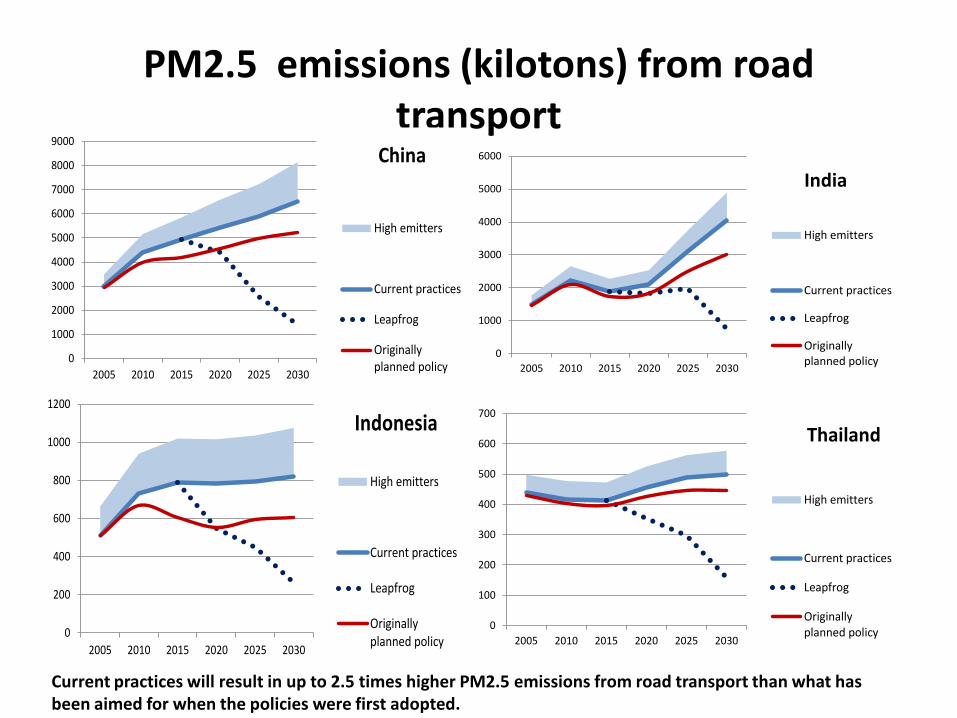
PM2.5 emissions (kilotons) from road transport
0
1000
2000
3000
4000
5000
6000
7000
8000
9000
2005 2010 2015 2020 2025 2030
China
High emitters
Current practices
Leapfrog
Originallyplanned policy
0
1000
2000
3000
4000
5000
6000
2005 2010 2015 2020 2025 2030
India
High emitters
Current practices
Leapfrog
Originallyplanned policy
0
200
400
600
800
1000
1200
2005 2010 2015 2020 2025 2030
Indonesia
High emitters
Current practices
Leapfrog
Originallyplanned policy
0
100
200
300
400
500
600
700
2005 2010 2015 2020 2025 2030
Thailand
High emitters
Current practices
Leapfrog
Originallyplanned policy
Current practices will result in up to 2.5 times higher PM2.5 emissions from road transport than what has been aimed for when the policies were first adopted.

NOx emissions (kilotons) from road transport
0
20
40
60
80
100
120
140
160
180
200
2005 2010 2015 2020 2025 2030
India
High emitters
Current practices
Leapfrog
Originallyplanned policy
0
10
20
30
40
50
60
70
80
90
2005 2010 2015 2020 2025 2030
Indonesia
High emitters
Current practices
Leapfrog
Originallyplanned policy 0
5
10
15
20
25
30
35
2005 2010 2015 2020 2025 2030
Thailand
High emitters
Current practices
Leapfrog
Originallyplanned policy
By 2030, NOx emissions from road traffic would then be 80% higher than in 2010 in India, 50% in China, 20% in Thailand and 10% in Indonesia.

BC emissions (kilotons) from road transport
0
50
100
150
200
250
300
350
400
450
500
2005 2010 2015 2020 2025 2030
China
High emitters
Current practices
Leapfrog
Originallyplanned policy
0
50
100
150
200
250
300
350
400
450
2005 2010 2015 2020 2025 2030
India
High emitters
Current practices
Leapfrog
Originallyplanned policy
0
20
40
60
80
100
120
140
160
2005 2010 2015 2020 2025 2030
Indonesia
High emitters
Current practices
Leapfrog
Originallyplanned policy 0
10
20
30
40
50
60
70
2005 2010 2015 2020 2025 2030
Thailand
High emitters
Current practices
Leapfrog
Originallyplanned policy
Increases in black carbon (BC) emissions from road traffic a little below 70% in Indonesia and below 50% in India.

The costs of delayed/ ineffective enforcement in 2010 resulted in between 8,000 and 24,000 premature deaths in China; and 5,000 and 14,000 premature deaths in India in 2010
Continuation of current practices would lead to 30,000 and 55,000 premature deaths in both countries annually by 2030.
2005
2005
2030
2030

Conclusions • Diesel emissions warm climate and pose grave threat to public
healthco-benefits
• Achieving co-benefits requires well designed control strategy, especially important in Asia
• Experience has shown difficult to implement such a strategy – Delays with standards – Ineffective I/M programmes
• Possible to integrate governance failures into modelling
• Look at three scenarios in four countries

Conclusions • PM2.5 emissions were 50% higher than would have resulted from
effective policy implementation in 2010
• BC emissions and NOx emissions were 40% and 30% higher relative to more effective enforcement regimes.
• The costs of delayed and ineffective enforcement in 2010 resulted in between 8,000 and 24,000 premature deaths in China; and 5,000 and 14,000 premature deaths in India in 2010.
• Continuation of current practices would lead to 30,000 and 55,000 premature deaths in both countries annually by 2030.

Historic fuel consumption for road transport and projections for 2030
0
5000
10000
15000
20000
25000
2000 2010 2030
Peta
joul
e
Buses - Diesel
Heavy duty trucks - Diesel
Cars and light duty trucks - Diesel
Cars and light duty trucks - Gasoline
Motorcycles
0
1000
2000
3000
4000
5000
6000
7000
8000
2000 2010 2030
Peta
joule
Buses - Diesel
Heavy duty trucks - Diesel
Cars and light duty trucks - Diesel
Cars and light duty trucks - Gasoline
Motorcycles
0
500
1000
1500
2000
2500
2000 2010 2030
Peta
joul
e
Buses - Diesel
Heavy duty trucks - Diesel
Cars and light duty trucks - Diesel
Cars and light duty trucks - Gasoline
Motorcycles
0
200
400
600
800
1000
1200
1400
1600
1800
2000 2010 2030
Peta
joul
e
Buses - Diesel
Heavy duty trucks - Diesel
Cars and light duty trucks - Diesel
Cars and light duty trucks - Gasoline
Motorcycles
China India
Indonesia Thailand

• For the past (i.e., 2005-2010), the analysis employs statistics on fuel consumption and fleet composition published by the International Energy Agency (IEA).
• The future evolution up to 2030 follows the trajectory developed by the Energy Technology Projections (ETP) project of OECD/IEA (IEA 2012),

Appendix ‘Original policy’ case ‘Current practices’ scenario Powered two-wheelers (LD2/M4)
Euro 3 from 2009, full compliance
Euro 3 from 2009, 75% compliance
Nationwide Beijing Shanghai Guangzhou
Passenger cars and light trucks, gasoline (LD4C/LD4T-GSL)
China 3 from 2007,
China 4 from 2010
China 5 from 2018.01, full compliance
China 1 from 2000.07/2001.10
China 2 from 2005.07/2006.07
China 3 from 2008.07/2009.07/2011.07
China 4 from 2011.07
China 5: n/a ICCT & Dieselnet,
90% effectiveness assumed
1999.01
2003.01
2006.01
2008.12
2013.02
1999.07
2003.03
2007
2009.11
2014.05
n/a
2005.07
2006.09
2010.06
n/a Passenger cars and light trucks, diesel (LD4C/LD4T-MD)
China 3 from 2007,
China 4 from 2010
China 5 from 2018.01 full compliance
China 1 from 2000.07/2001.10
China 2 from 2005.07/2006.07
China 3 from 2008.07/2009.07/2011.07
China 4 from 2013.07
China 5: n/a ICCT & Dieselnet,
90% effectiveness assumed
1999.01
2003.01
2006.01
(2008.07)a
2013.02
1999.07
2003.03
2007
2009.11
2014.05
n/a
2005.07
2006.09
2010.06
n/a Heavy duty trucks and buses, diesel (HDT/HDB-MD)
Euro III from 2007
Euro IV from 2010.07 full compliance,
China I from 2001.09
China II from 2004.09
China III from 2008.06 China IV from 2013.7 China 3 from
60% compliance as local producers might not be ready with the technology.
1999.01
2003.01
2006.01
2008.12
2013.02
1999.07
2003.03
2007
2009.11
2014.05
n/a
2005.07
2006.09
2010.06
n/a

Appendix
‘Original policy’ case ‘Current practices’ scenario Powered two-wheelers (LD2/M4)
Bharat II from 2005, Bharat III from 2010 onwards, 100% compliance
Bharat II from 2005, Bharat III from 2010 onwards, but in-use compliance only 50%
Passenger cars and light trucks, gasoline (LD4C/LD4T-GSL)
Bharat 3 from 2010 and Bharat 4 nationwide from 2015, full compliance
Bharat 3 from 2010 ICCT & Dieselnet plus Bharat 4 in Delhi, assume 75% compliance (e.g. due to catalyst removal/inactivation)
Passenger cars and light trucks, diesel (LD4C/LD4T-MD)
Bharat 3 from 2010 and Bharat 4 nationwide from 2015, full compliance
Bharat 3 from 2010 ICCT & Dieselnet plus Bharat 4 in Delhi, 90% effectiveness for Bharat 3 and 75% for Bharat 4 due to problems with provision of low sulfur fuel.
Heavy duty trucks and buses, diesel (HDT/HDB-MD)
Bharat 3 from 2010 and Bharat 4 nationwide from 2015, full compliance
Bharat 3 from 2010. Delhi: Bharat 3 from 2005 and Bharat 4 from 2010 onwards ICCT & Dieselnet. 60% effectiveness as local producers might not be ready with the technology and/or lack of low-sulfur diesel.

Appendix
‘Original policy’ case ‘Current practices’ scenario
Powered two-wheelers (LD2/M4)
Euro 2 from 2007, full compliance.
Euro 3 from 2013
Despite legal requirement for Euro 3 from 2013, it is assumed that in reality ~80% of control devices are removed, only 20% are assumed to work in practice.
Passenger cars and light trucks, gasoline (LD4C/LD4T-GSL)
Euro 2 from 2007, full compliance
Euro 4 from 2012, full compliance (Delphi 2014/15)
Euro 2 from 2015, 75% compliance (e.g. due to catalyst removal/inactivation)
Passenger cars and light trucks, diesel (LD4C/LD4T-MD)
Euro 2 from 2007, full compliance
Euro 4 from 2012, full compliance (Delphi 2014/15)
Euro 2 from 2015, 90% effectiveness as not much tampering options
Heavy duty trucks and buses, diesel (HDT/HDB-MD)
Euro II from 2007, full compliance
Euro II from 2015, 60% compliance as local producers might not be ready with the technology