the lifecycle of exchange-traded derivatives - · pdf filethe lifecycle of exchange-traded...
TRANSCRIPT
The Lifecycle of Exchange-traded Derivatives
Grant Cavanaugh Ph.D.Praedicat
Michael PenickUS Commodity Futures Trading Commission
June 28, 2014
The research presented in this paper was co-authored by a CommodityFutures Trading Commission (CFTC) economist Michael Penick with co-author, Grant Cavanaugh, a former CFTC contractor who performed workunder CFTC OCE contract (contract CFOCE-12-CO-0194). The analysesand conclusions expressed in this paper are those of the authors and do notreflect the views of other members of the Office of Chief Economist, otherCommission staff, or the Commission itself. The CFTC’s economists produceoriginal research on a broad range of topics relevant to the CFTC’s mandateto regulate commodity future markets, commodity options markets, and theexpanded mandate to regulate the swaps markets pursuant to the Dodd-Frank Wall Street Reform and Consumer Protection Act. These papers areoften presented at conferences and many of these papers are later publishedby peer-review and other scholarly outlets.
Abstract
This article provides a statistical description of the lifecycle of exchange-traded derivatives in the United States. Using annual volumes for mostderivatives reported to US exchanges since 1954, we present distribu-tional estimates of the rate at which derivative trading volumes rise
1

and fall. Our results suggest that the lifecycle of cleared derivativeschanged fundamentally in the 2000’s. In that decade, derivatives withlow trading volumes moved to modest volumes with increased proba-bility. Prior to the 2000’s, low volume contracts were more likely toremain stuck at low volumes or be delisted altogether. This additionalresilience from low levels of trading meant that the expected tradingvolume for a new cleared derivative after ten years of trading actuallygrew between the 1990s and 2000’s. This is surprising given that manynew contracts were launched in the last decade and a historically largepercentage of contracts traded at low volume in any year. The resultssuggest that trading volumes varied more decade to decade than fromexchange to exchange or product type to product type.
JEL classification: G12, N22, G17.
Keywords : Derivatives; Innovation; Financial History.
1. Introduction
Every year, financial innovators launch new derivatives markets in the
hope of serving unmet risk management needs stemming stemming from on-
going economic activity. Many of those new markets fail to attract the liquid
trading that is necessary both to generate profits for derivatives exchanges
and to drive down transaction costs for their customers. A handful of new
markets will host large volumes of trading, enjoying network effects that will
sustain further trading in the future.
This article is intended to answer the fundamental question facing finan-
cial innovators as they consider whether or not to offer a new derivative
contract for trading on their platform: what are the chances that a new
derivative will reach a sustainable level of liquidity?
Silber (1981) and Carlton (1984) provided the first summary statistics
on the survival of new futures contracts and they suggested that most new
derivatives fail, usually soon after their launch. However, since their pub-
lication, technological innovation and organizational changes at derivatives
exchanges altered the economics of derivatives trading in ways that may have
upended long standing patterns in product lifecycles (Gorham and Singh,
2009).
Recently, Gorham and Kundu (2012) used a large dataset from the Fu-
tures Industry Association (FIA) to demonstrate a steep increase in the rate
at which new futures contracts are launched. They also provide point esti-
mates of multiple metrics for the success of new futures contracts.
Here we extend the more recent work in Gorham and Kundu (2012),
providing distributional estimates of exchange-traded derivatives contracts’
movement between states of annual trading volume using a dataset that
includes cleared derivatives and options as well as many historic futures con-
tracts absent from most electronic databases. The analysis presented is com-
prehensive, covering all US exchange-traded derivatives contracts launched
since the mid-1950’s. The analysis is also presented in a simple and novel
1
form, as a non-stationary Markov model estimated using Bayesian methods.
1.1. Derivatives reform and lifecycle statistics
Basic statistics on the lifecycle of derivatives are particularly valuable now
because ongoing policy debates on derivatives regulation in the US and Eu-
rope have hinged on projections of how new regulations will impact liquidity
and trading patterns. Better baseline statistics of the lifecycle of derivatives,
particularly statistics that take into account recent shifts in the dynamics of
exchange reported derivatives trading, can inform that debate.
Title VII of the Dodd-Frank reforms focuses on swaps markets1 2, the
hitherto unregulated derivatives markets that, since the first publicly dis-
closed swaps trade in 1981, had grown to a notional outstanding value of
USD 639 trillion by June 2012. (By contrast, options and futures had a
combined notional outstanding value of USD 60 trillion (Bank of Interna-
tional Settlements, 2012).) Title VII mandates that swaps markets adopt
practices related to many critical market functions, including information
dissemination, counter-party risk, and margining, that are comparable to
those of exchange-traded futures and options.
This regulatory change suggests that the coming years will see conver-
gence between previously unregulated swaps markets and standard exchange-
traded derivatives markets. This convergence, in turn, raises both normative
1Swaps trades have generally been negotiated bilaterally, often over the phone throughor with large swap dealers, rather than via the central limit order book system used byexchange-traded derivatives. In theory, markets using bilateral negotiation and centralorder books trade contracts that imply equivalent cash flows (Mello and Reilly, 2012).However, Duffie (2012) presents evidence that informational asymmetries persist in evenhighly liquid bilateral markets.
2In practice, the distinction between swaps and futures is often murky. For example,some swaps trades are negotiated bilaterally and then converted into futures trades onmarkets such as the CME Group’s ClearPort. Those trades are reported to exchanges andare consequently included in the dataset used in this article. The CME and ICE, the twolargest US futures exchanges, have recently announced plans to convert many of their mostpopular swaps markets into futures markets with physical delivery of swaps contracts atsettlement (i.e. futures trades that become swaps), providing yet another hybrid model.
2

questions (How desirable is the move toward increased clearing, public dis-
closure of pricing information, and greater standardization of margins?) and
positive questions (What will the likely costs or regulation be in terms of
trading volume?) that would benefit from reliable statistical descriptions of
the lifecycle of derivatives.
The relative scarcity of basic statistics on the lifecycle of derivatives has
already introduced confusion into the policy debate surrounding Title VII.
In one prominent example, the International Swaps and Derivatives Associa-
tion (ISDA) released a position paper on regulations mandating price trans-
parency and clearing in swaps markets comparable to that in exchange-traded
derivatives markets in late 2011 (ISDA Research Staff and NERA Economic
Consulting, 2011). The paper highlights previous research showing high rates
of failure among exchange-traded derivatives. Assuming a connection be-
tween those failure rates and exchanges’ price transparency and clearing, the
paper goes on to argue that swaps contracts subject to proposed regulations
would subsequently lose their liquidity and begin to fail. That suggestion is
misleading. First, it ignore the comparable failure rates for bilateral swaps,
which are difficult to quantify. Second, it relies on the assumption tested
here - that derivatives continue to fail at the rates documented decades ago.
Our results suggest that assumption is not robust to recent changes in the
underlying structure of cleared derivatives markets.
In addition to providing common ground for policy debates, we hope that
the following analysis will inform the decisions of derivatives innovators. In
general, contracts are showing greater flexibility, moving up from low levels
of annual trading. This may have implications for how exchanges allocate
their limited budgets for marketing and education. Contracts previously
considered too uneven in their year-to-year trading to succeed may indeed
have substantial growth potential given proper marketing and educational
support.
3
2. Data
Our analysis is based on annual volume figures for US exchange-traded
derivatives (primarily futures, options, and cleared swaps). These figures
are/were freely available to the public through trade publications, directly
from exchanges, in newspapers, and from the website of the Commodity
Futures Trading Commission (CFTC). For ease of access, we used:
• An electronic database maintained by the CFTC aggregating basic,
market-level daily trade data (such as volume and open interest) regu-
lated futures and options exchanges, called designated contract markets
(DCMs), This dataset covers all recent trading volumes reported to US
exchanges of futures, options and swaps, cleared pursuant to DCM
rules. Most contracts in that database have volume figures dating back
to the early 1980s.
• We supplemented this basic dataset by adding in futures trading figures
compiled by hand from historical publications released by derivatives
exchanges. The resulting dataset includes many short-lived contracts
listed on now-defunct exchanges that are unlikely to appear in most
electronic databases of trading statistics.
The merger of these resources may represent the most comprehensive
dataset on derivatives trading volume to date.
3. Markov model for the lifecycle of deriva-
tives
We present our primary results in the form of a Markov model. That
model begins by imagining that a derivative contract moving between discrete
states (x) of trading volume at discrete times (t as in xt)according to a
discrete-time Markov chain, defined generally as in equation 1.
4

P (Xt = xt|Xt−1 = xt−1, Xt−2 = xt−2, . . . , X0 = x0) = P (Xt = xt|Xt−1 = xt−1)
(1)
In the context of derivatives, the left side of equation 1 can be restated
as in equation 2.
P (Volume levelyear t+1|Volume levelyear t) (2)
Contract are assigned a martix (P as in equation 3) that describes the
probability of moving to any of a set of discrete states (time j) of annual
trading volume in the following year given their state of trading volume
today (time i). This is the transition matrix commonly used to describe a
Markov process (Page, 2012).
P =
p1,1 p1,2 . . . p1,j . . .
p2,1 p2,2 . . . p2,j . . ....
.... . .
.... . .
pi,1 pi,2 . . . pi,j . . ....
.... . .
.... . .
(3)
Volume level for any given contract-year is equivalent to the common
logarithm of the annual trading, rounded down to the nearest integer. (For
example, annual trading of 10, 500 is assigned a volume level that groups it
with all contract-years with volume ≥ 10, 000 and < 100, 000.) We assigned
a special level for annual trading of 0.
For ease of estimation we work with the rows of the transition matrix P
which we denote as θ. Those rows sum to 1, so, assuming that row entries are
randomly distributed, each row can be assigned a Dirichlet distribution, com-
monly used for the probability of ending in an exhaustive set of categorical
states. That assignment is defined in equation 4.
5
Volume levelyear t+1|Volume levelyear t ∼ Categorical(θ)
θ ∼ Dirichlet(xvol level 0, xvol level 1, . . . , xvol level 108)(4)
We modeled these transition probabilities via Bayesian Gibbs sampling
through R and the Bayesian statistical package JAGS (Plummer, 2003). (We
used the “rjags” package (Plummer, 2013).) These methods treat the under-
lying probabilities of moving between states of trading volume as randomly
distributed parameters, as in equation 4.
After estimation, we combine the vectors θ to reconstruct the transition
matrix for a Markov model P . As with any Markov model, we can multiply
a vector, π0 describing the probability that a new derivative will start in
any given state (at time 0) by the transition matrix to produce a vector of
probabilities that a new market will be in any state over an arbitrary number
of periods (k) as in equation 5.
π0Pk = πk. (5)
We can multiply the vector πk by yet another vector of annual trading
volumes corresponding to each possible state to get an approximation of the
expected trading volume in that arbitrary year. We present all our expected
trading volumes at a ten year horizon (setting k = 10), but the Markov
model is flexible in this regard.
Note that we do not assume that the transition matrix P is stationary
across time. We measure transition matrices for various contract groupings
including decades, product categories, and exchanges to test whether they
are distinct. Given that we do not assume stationarity our expected value
estimates do not describe an equilibrium, only the general direction of the
market.
6

3.1. Prior probabilities on moving between states of annual vol-
ume
Our model presumes that the data on the volume level next year (Volume levelyear t+1)
is segregated by the volume this year (Volume levelyear t) and we assigned
each of those subsets prior probabilities (corresponding to parameter x in
equation 4) of moving to any volume level in the next year. Those priors
came from an informal survey of economists at the CFTC.
That survey found beliefs corresponding roughly to:
• Pr(Volume levelyear t+1 = Volume levelyear t−1) = 0.16
• Pr(Volume levelyear t+1 = Volume levelyear t) = 0.63
• Pr(Volume levelyear t+1 = Volume levelyear t+1) = 0.14
The probability of a contract jumping more than one order of magnitude
up or down was assigned a value of 0.01. In edge cases (Volume levelyear t =
0 and Volume levelyear t = 108) where a move up or down would take the
contract below annual trading of 0 or to annual trading ≥ 109, we combined
the probabilities of moving up or down with the probability of remaining in
the same state. Table 2 at the end of this article shows the full matrix of
transition probability priors.
We chose to assign informative priors on transition probabilities because
flat priors (equal weighting to the probability of a transition to any state)
unfairly biased the estimation, giving exchanges or product subgroups with
few observations a relatively high probability of jumping to extraordinary
levels of trading.
7

0.00
0.25
0.50
0.75
1.00
0e+00 2e+08 4e+08 6e+08Annual volume
Em
piric
al C
DF
Fig. 1. Empirical cumulative distribution function of annual trading volumesby contract
4. Derivatives volumes over time
4.1. Concentration of trading volume over time
Figures 1 and 2 display the empirical cumulative distribution function
(ECDF) of annual trading volumes by contract for every year in the sample.
In each figure, individual lines represent the ECDFs for a single year, with
lines approaching a right angle showing greater concentration of trading vol-
ume in a few contracts. Figure 1 clearly shows that most contracts trade at
low volumes in any given year, with roughly 80 percent of contracts showing
little or no volume in any given year since 1954.
8
However, figure 1 obscures substantial variation in the concentration of
volume over time. Figure 2 zooms in on the same annual ECDFs displayed
in figure 1. The ECDF for each year is colored chronologically, with the lines
representing the oldest years in the sample in red and the most recent years
in purple. Each panel of figure 1 shows the same ECDFs, but the years in a
specific decade are highlighted (in black) to give a sense of how concentration
has varied from decade to decade.
In this graphic we see clear patterns in concentration over time. Mar-
kets grew steadily less concentrated between the 1950s and 1990s (perhaps
with some retrenchment between the 1980s and 1990s), shown by flattening
ECDFs for each succeeding decade. That trend reversed sharply in the 2000s,
with the annual ECDFs approaching a right angle. In the 1980s the range
of 15,000 to 30,000 roughly marked the 50th percentile for annual trading
volumes, with half of the listed contracts trading above that range and half
below. By the 2000s that range had fallen to between 300 and 8,000.
Figure 2 itself highlights one likely cause of this shift - the explosion
of innovation during the 2000s. The ECDFs for the 2000s are appreciably
smoother than those of previous decades, with 2011 looking almost like a
continuous function. This smoothness is due to the inclusion of additional
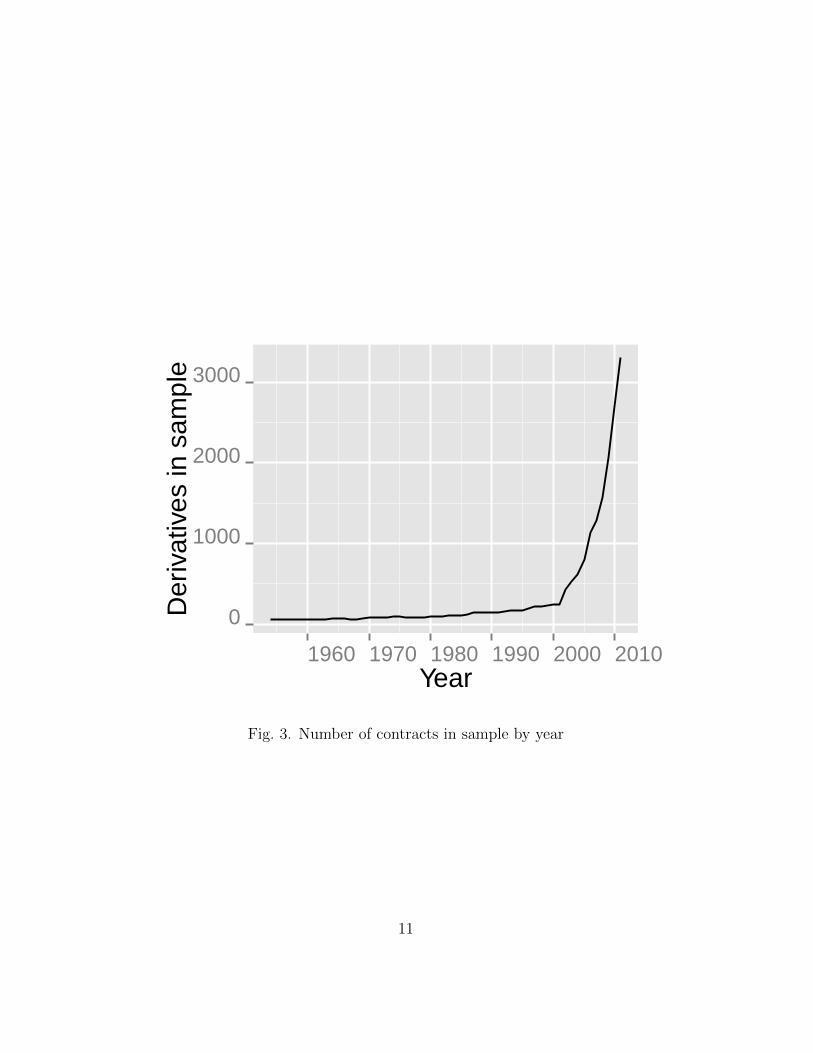
contracts. Figure 3 directly displays the number of contracts with annual
reported volume (which is allowed be zero) in the sample by year. It shows the
same explosive trend in innovation discussed in Gorham and Kundu (2012),
with over 3000 derivatives contracts reporting annual volume in 2011.
4.2. Probability of individual contracts moving to different lev-
els of trading by decade
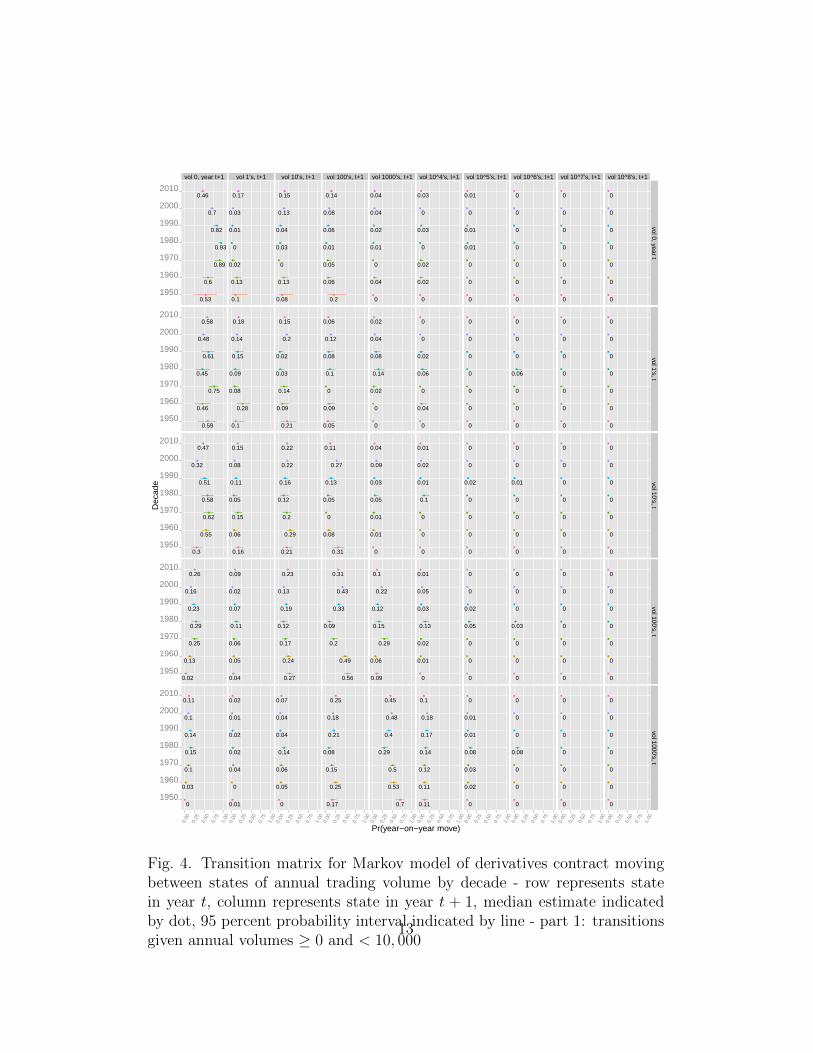
Figures 4 and 5 give the probabilities of individual contracts moving be-
tween volume levels in a given year t (indicated by the row of estimates)
and volume levels in year t+1 (indicated by the column of estimates). These
probabilities, estimated separately for each decade in the sample via equation
9

0.50.60.70.80.91.0
0.50.60.70.80.91.0
0.50.60.70.80.91.0
0.50.60.70.80.91.0
0.50.60.70.80.91.0
0.50.60.70.80.91.0
0.50.60.70.80.91.0
1950's1960's
1970's1980's
1990's2000's
2011
0e+00 1e+06 2e+06 3e+06 4e+06 5e+06Annual volume
Em
piric
al C
DF
1960
1970
1980
1990
2000
2010Year
Fig. 2. Empirical cumulative distribution function (ECDF) of annual tradingvolumes by contract with scale adjusted to distinguish between decades -Each line represents the ECDF for a different year. Each of the stackedpanels highlights the years in a particular decade in black. Note that anECDF approaching a right angle represents a year in which volume wasconcentrated in a few contracts. Hence, with some exceptions in the 1990sthe market as a whole becomes less concentrated, until the 2000s when itabruptly becomes highly concentrated.
10
0
1000
2000
3000
1960 1970 1980 1990 2000 2010Year
Der
ivat
ives
in s
ampl
e
Fig. 3. Number of contracts in sample by year
11

4, combine to form the transition matrix for a Markov model of a contract
emerging over time.
The parameter estimates indicate that there is substantial inertia across
every decade keeping contracts with a given level of trading volume at that
same volume in the following year. In virtually all decades in the sample,
contracts trading at or above 1,000 in annual volume were more likely to
remain at their trading volume level than to move up or down. This dynamic
is particularly strong at higher levels of trading. In most decades where
relevant observations were available, contracts with annual volume of one
million or above remained in that range the following year with probabilities
between ∼80 and ∼90 percent (see lower right-hand corner of figure 5).
We also see substantial historical evidence of inertia at very low levels of
trading. From 1970 until 2000, the median probability that a contract with
trading volume of zero would remain at zero the next year, ranged between
80 and 95 percent (see upper left-hand corner of figure 4).
The transition matrix begins to depart from the prevailing story in Silber
(1981) and Carlton (1984) when you look at contracts at lower levels of
trading in the 2000s. (See the top rows of figure 4.) The inertia for those
contracts is lower than in previous decades, with the median probability of a
contract at an annual volume of zero remaining at zero falling to 70 percent
(figure 7). While zero volume contracts remained unlikely in absolute terms
to rise to higher volume levels, the 95 percent probability interval for the
transition probability for the 2000s does not overlap with those for recent
decades, meaning that the difference holds with high probability.
During the decade of the 2000s, contracts were substantially more likely
to jump from an annual trading volume of 0 to trading volumes between 10
and 1000 than in previous decades. (See top row of figure 4 and 8.) Combined
with the apparent trend toward maintaining rather than delisting contracts,
this suggests that there was less path-dependence for trading volumes in the
2000s. While more contracts traded at a volume of 0 in any given year (see
12
vol 0, year t+1 vol 1's, t+1 vol 10's, t+1 vol 100's, t+1 vol 1000's, t+1 vol 10^4's, t+1 vol 10^5's, t+1 vol 10^6's, t+1 vol 10^7's, t+1 vol 10^8's, t+1
●
●
●
●
●
●
●
0.53
0.6
0.89
0.93
0.82
0.7
0.46
●
●
●
●
●
●
●
0.59
0.46
0.75
0.45
0.61
0.48
0.58
●
●
●
●
●
●
●
0.3
0.55
0.62
0.58
0.51
0.32
0.47
●
●
●
●
●
●
●
0.02
0.13
0.25
0.29
0.23
0.16
0.26
●
●
●
●
●
●
●
0
0.03
0.1
0.15
0.14
0.1
0.11
●
●
●
●
●
●
●
0.1
0.13
0.02
0
0.01
0.03
0.17
●
●
●
●
●
●
●
0.1
0.28
0.08
0.09
0.15
0.14
0.18
●
●
●
●
●
●
●
0.16
0.06
0.15
0.05
0.11
0.08
0.15
●
●
●
●
●
●
●
0.04
0.05
0.06
0.11
0.07
0.02
0.09
●
●
●
●
●
●
●
0.01
0
0.04
0.02
0.02
0.01
0.02
●
●
●
●
●
●
●
0.08
0.13
0
0.03
0.04
0.13
0.15
●
●
●
●
●
●
●
0.21
0.09
0.14
0.03
0.02
0.2
0.15
●
●
●
●
●
●
●
0.21
0.29
0.2
0.12
0.16
0.22
0.22
●
●
●
●
●
●
●
0.27
0.24
0.17
0.12
0.19
0.13
0.23
●
●
●
●
●
●
●
0
0.05
0.06
0.14
0.04
0.04
0.07
●
●
●
●
●
●
●
0.2
0.06
0.05
0.01
0.06
0.08
0.14
●
●
●
●
●
●
●
0.05
0.09
0
0.1
0.08
0.12
0.06
●
●
●
●
●
●
●
0.31
0.08
0
0.05
0.13
0.27
0.11
●
●
●
●
●
●
●
0.56
0.49
0.2
0.09
0.33
0.43
0.31
●
●
●
●
●
●
●
0.17
0.25
0.15
0.08
0.21
0.18
0.25
●
●
●
●
●
●
●
0
0.04
0
0.01
0.02
0.04
0.04
●
●
●
●
●
●
●
0
0
0.02
0.14
0.08
0.04
0.02
●
●
●
●
●
●
●
0
0.01
0.01
0.05
0.03
0.09
0.04
●
●
●
●
●
●
●
0.09
0.06
0.29
0.15
0.12
0.22
0.1
●
●
●
●
●
●
●
0.7
0.53
0.5
0.29
0.4
0.48
0.45
●
●
●
●
●
●
●
0
0.02
0.02
0
0.03
0
0.03
●
●
●
●
●
●
●
0
0.04
0
0.06
0.02
0
0
●
●
●
●
●
●
●
0
0
0
0.1
0.01
0.02
0.01
●
●
●
●
●
●
●
0
0.01
0.02
0.13
0.03
0.05
0.01
●
●
●
●
●
●
●
0.11
0.11
0.12
0.14
0.17
0.18
0.1
●
●
●
●
●
●
●
0
0
0
0.01
0.01
0
0.01
●
●
●
●
●
●
●
0
0
0
0
0
0
0
●
●
●
●
●
●
●
0
0
0
0
0.02
0
0
●
●
●
●
●
●
●
0
0
0
0.05
0.02
0
0
●
●
●
●
●
●
●
0
0.02
0.03
0.08
0.01
0.01
0
●
●
●
●
●
●
●
0
0
0
0
0
0
0
●
●
●
●
●
●
●
0
0
0
0.06
0
0
0
●
●
●
●
●
●
●
0
0
0
0
0.01
0
0
●
●
●
●
●
●
●
0
0
0
0.03
0
0
0
●
●
●
●
●
●
●
0
0
0
0.08
0
0
0
●
●
●
●
●
●
●
0
0
0
0
0
0
0
●
●
●
●
●
●
●
0
0
0
0
0
0
0
●
●
●
●
●
●
●
0
0
0
0
0
0
0
●
●
●
●
●
●
●
0
0
0
0
0
0
0
●
●
●
●
●
●
●
0
0
0
0
0
0
0
●
●
●
●
●
●
●
0
0
0
0
0
0
0
●
●
●
●
●
●
●
0
0
0
0
0
0
0
●
●
●
●
●
●
●
0
0
0
0
0
0
0
●
●
●
●
●
●
●
0
0
0
0
0
0
0
●
●
●
●
●
●
●
0
0
0
0
0
0
0
1950
1960
1970
1980
1990
2000
2010
1950
1960
1970
1980
1990
2000
2010
1950
1960
1970
1980
1990
2000
2010
1950
1960
1970
1980
1990
2000
2010
1950
1960
1970
1980
1990
2000
2010
vol 0, year tvol 1's, t
vol 10's, tvol 100's, t
vol 1000's, t
0.00
0.25
0.50
0.75
1.00
0.00
0.25
0.50
0.75
1.00
0.00
0.25
0.50
0.75
1.00
0.00
0.25
0.50
0.75
1.00
0.00
0.25
0.50
0.75
1.00
0.00
0.25
0.50
0.75
1.00
0.00
0.25
0.50
0.75
1.00
0.00
0.25
0.50
0.75
1.00
0.00
0.25
0.50
0.75
1.00
0.00
0.25
0.50
0.75
1.00
Pr(year−on−year move)
Dec
ade
Fig. 4. Transition matrix for Markov model of derivatives contract movingbetween states of annual trading volume by decade - row represents statein year t, column represents state in year t + 1, median estimate indicatedby dot, 95 percent probability interval indicated by line - part 1: transitionsgiven annual volumes ≥ 0 and < 10, 000
13

vol 0, year t+1 vol 1's, t+1 vol 10's, t+1 vol 100's, t+1 vol 1000's, t+1 vol 10^4's, t+1 vol 10^5's, t+1 vol 10^6's, t+1 vol 10^7's, t+1 vol 10^8's, t+1
●
●
●
●
●
●
●
0.01
0.01
0.03
0.05
0.05
0.04
0.05
●
●
●
●
●
●
●
0
0
0
0.01
0.01
0.01
0.01
●
●
●
●
●
●
●
0
0
0
0.01
0.01
0.01
0
●
●
●
●
●
●
●
0
0
0
0
0.03
0
0
●
●
●
●
●
●
●
0
0
0
0
0
0
0
●
●
●
●
●
●
●
0
0
0
0
0
0
0
●
●
●
●
●
●
●
0
0
0
0.01
0
0
0
●
●
●
●
●
●
●
0
0
0
0
0
0
0
●
●
●
●
●
●
●
0
0
0
0
0
0
0
●
●
●
●
●
●
●
0
0
0
0
0
0
0
●
●
●
●
●
●
●
0
0
0.01
0.02
0.01
0.01
0.01
●
●
●
●
●
●
●
0
0
0
0
0
0
0
●
●
●
●
●
●
●
0
0
0
0
0
0
0
●
●
●
●
●
●
●
0
0
0
0
0
0
0
●
●
●
●
●
●
●
0
0
0
0
0
0
0
●
●
●
●
●
●
●
0
0.01
0.04
0.04
0.02
0.04
0.04
●
●
●
●
●
●
●
0
0
0
0.01
0.01
0
0
●
●
●
●
●
●
●
0
0
0
0.01
0
0
0
●
●
●
●
●
●
●
0
0
0
0.01
0
0
0
●
●
●
●
●
●
●
0
0
0
0
0
0
0
●
●
●
●
●
●
●
0.09
0.13
0.09
0.13
0.13
0.21
0.25
●
●
●
●
●
●
●
0
0
0.01
0.04
0.02
0.02
0.01
●
●
●
●
●
●
●
0
0
0
0.02
0
0
0
●
●
●
●
●
●
●
0
0
0
0
0
0
0
●
●
●
●
●
●
●
0
0
0
0
0
0
0
●
●
●
●
●
●
●
0.85
0.7
0.58
0.61
0.71
0.61
0.56
●
●
●
●
●
●
●
0.12
0.11
0.05
0.07
0.09
0.17
0.22
●
●
●
●
●
●
●
0
0
0
0.02
0
0.01
0
●
●
●
●
●
●
●
0
0
0
0
0
0
0
●
●
●
●
●
●
●
0
0
0
0
0
0
0
●
●
●
●
●
●
●
0.05
0.15
0.24
0.1
0.07
0.09
0.1
●
●
●
●
●
●
●
0.84
0.83
0.84
0.7
0.81
0.72
0.67
●
●
●
●
●
●
●
0.77
0.15
0.04
0.08
0.05
0.08
0.19
●
●
●
●
●
●
●
0
0
0
0
0
0
0
●
●
●
●
●
●
●
0
0
0
0
0
0
0
●
●
●
●
●
●
●
0
0
0
0.04
0
0
0
●
●
●
●
●
●
●
0.03
0.06
0.1
0.14
0.06
0.07
0.09
●
●
●
●
●
●
●
0.15
0.83
0.94
0.8
0.91
0.81
0.78
●
●
●
●
●
●
●
0.02
0.02
0.02
0.17
0.02
0.02
0.07
●
●
●
●
●
●
●
0
0
0
0
0
0
0
●
●
●
●
●
●
●
0
0
0
0
0
0
0
●
●
●
●
●
●
●
0
0
0
0
0
0
0
●
●
●
●
●
●
●
0
0
0.02
0.05
0.02
0.09
0.02
●
●
●
●
●
●
●
0.74
0.74
0.74
0.81
0.91
0.92
0.93
●
●
●
●
●
●
●
0.02
0.02
0.02
0.02
0.84
0.08
0.06
●
●
●
●
●
●
●
0
0
0
0
0
0
0
●
●
●
●
●
●
●
0
0
0
0
0
0
0
●
●
●
●
●
●
●
0
0
0
0
0
0
0
●
●
●
●
●
●
●
0.01
0.01
0.01
0
0.04
0.04
0
●
●
●
●
●
●
●
0.92
0.92
0.92
0.92
0.14
0.92
0.94
1950
1960
1970
1980
1990
2000
2010
1950
1960
1970
1980
1990
2000
2010
1950
1960
1970
1980
1990
2000
2010
1950
1960
1970
1980
1990
2000
2010
1950
1960
1970
1980
1990
2000
2010
vol 10^4's, tvol 10^5's, t
vol 10^6's, tvol 10^7's, t
vol 10^8's, t
0.00
0.25
0.50
0.75
1.00
0.00
0.25
0.50
0.75
1.00
0.00
0.25
0.50
0.75
1.00
0.00
0.25
0.50
0.75
1.00
0.00
0.25
0.50
0.75
1.00
0.00
0.25
0.50
0.75
1.00
0.00
0.25
0.50
0.75
1.00
0.00
0.25
0.50
0.75
1.00
0.00
0.25
0.50
0.75
1.00
0.00
0.25
0.50
0.75
1.00
Pr(year−on−year move)
Dec
ade
Fig. 5. Transition matrix for Markov model of derivatives contract movingbetween states of annual trading volume by decade - row represents statein year t, column represents state in year t + 1, median estimate indicatedby dot, 95 percent probability interval indicated by line - part 2: transitionsgiven annual volumes ≥ 10, 000
14

vol 0, year t+1
●
●
●
●
●
●
●
0.53
0.6
0.89
0.93
0.82
0.7
0.46
1950
1960
1970
1980
1990
2000
2010
vol 0, year t
0.00 0.25 0.50 0.75 1.00Pr(year−on−year move)
Dec
ade
Fig. 6. Probability of remaining at annual volume of zero from year to yearby decade
15

vol 0, year t+1
●
●
●
●
●
●
●
0.53
0.6
0.89
0.93
0.82
0.7
0.46
1950
1960
1970
1980
1990
2000
2010
vol 0, year t
0.00 0.25 0.50 0.75 1.00Pr(year−on−year move)
Dec
ade
Fig. 7. Probability of remaining at annual volume of zero from year to yearby decade
vol 1's, t+1
●
●
●
●
●
●
●
0.1
0.13
0.02
0
0.01
0.03
0.17
1950
1960
1970
1980
1990
2000
2010
vol 0, year t
0.00 0.25 0.50 0.75 1.00Pr(year−on−year move)
Dec
ade
vol 10's, t+1
●
●
●
●
●
●
●
0.21
0.09
0.14
0.03
0.02
0.2
0.15
1950
1960
1970
1980
1990
2000
2010
vol 1's, t
0.00 0.25 0.50 0.75 1.00Pr(year−on−year move)
Dec
ade
Fig. 8. Probability of transition from annual volume of 0 to annual volume inthe single digits (left) and from annual volume in the single digits to annualvolume ≥ 10, < 100 (right)
16

vol 100's, t+1
●
●
●
●
●
●
●
0.31
0.08
0
0.05
0.13
0.27
0.11
1950
1960
1970
1980
1990
2000
2010
vol 10's, t
0.00 0.25 0.50 0.75 1.00Pr(year−on−year move)
Dec
ade
vol 1000's, t+1
●
●
●
●
●
●
●
0.09
0.06
0.29
0.15
0.12
0.22
0.1
1950
1960
1970
1980
1990
2000
2010
vol 100's, t
0.00 0.25 0.50 0.75 1.00Pr(year−on−year move)
Dec
ade
Fig. 9. Probability of transition from annual volume in the hundreds to an-nual volume in the thousands (left) and from annual volume in the thousandsto annual volume tens of thousands (right)
figure 2), contracts were substantially more likely to jump up from such low
trading volumes in the 2000s.
Having reached annual trading volumes in the 10s or 100s (see 9), con-
tracts in the decade of the 2000s were again substantially more likely to
continue increasing their trading volume in the 2000s than in the 1980s or
1990s. Only after reaching trading volumes in the 1000s (figure 10) did the
probability of an individual contract progressing to higher levels of annual
trading volume fall roughly back within the same range as those from previ-
ous decades. In the 2000s, contracts generally moved up to annual trading
in the thousands with an ease not seen in previous decades.
Contracts trading in the tens of thousands were 8 percent more likely
to fall back to lower levels of annual volumes in the 2000s than in previous
decades, a difference that holds with high probability. This indicates that
some of the flexibility gained for contracts at lower levels of trading may have
come at the expense of contracts at mid to high levels of trading. (However,
as we see in figure 13, discussed below, that retrenchment from trading in
the tens of thousands was not enough, on balance, to lower the prospects of
a new contract over the course of ten years.)
Annual trading in the 10,000s appears to represent an important mile-
stone for contracts across the sample. Having reached this level of trading,
17

vol 10^4's, t+1
●
●
●
●
●
●
●
0.11
0.11
0.12
0.14
0.17
0.18
0.1
1950
1960
1970
1980
1990
2000
2010
vol 1000's, t
0.00 0.25 0.50 0.75 1.00Pr(year−on−year move)
Dec
ade
Fig. 10. Probability of transition from annual volume in the tens of thousandsto annual volume in the hundreds of thousands
18

volume level vol 0’s, t+1 1 10 100 1000 104 105 106 107 108
vol 0’s, t 0.66 0.08 0.11 0.09 0.03 0.02 0.00 0.00 0.00 0.001 0.56 0.16 0.16 0.08 0.03 0.01 0.00 0.00 0.00 0.0010 0.42 0.12 0.21 0.18 0.06 0.02 0.00 0.00 0.00 0.00100 0.20 0.05 0.17 0.38 0.17 0.03 0.00 0.00 0.00 0.001000 0.10 0.01 0.05 0.20 0.47 0.15 0.01 0.00 0.00 0.00104 0.04 0.00 0.01 0.03 0.19 0.62 0.10 0.00 0.00 0.00105 0.01 0.00 0.00 0.00 0.02 0.14 0.74 0.08 0.00 0.00106 0.01 0.00 0.00 0.00 0.01 0.01 0.08 0.84 0.04 0.00107 0.01 0.00 0.00 0.00 0.00 0.00 0.00 0.05 0.90 0.03108 0.00 0.00 0.00 0.00 0.00 0.00 0.00 0.00 0.13 0.87
Table 1: [
180pt]Median estimates of transition matrix between volume states on fullsample - with annual trading volume state in year t denoted by row, tradingvolume state in year t denoted by column
the likelihood of outright collapse (annual trading volume falling to 0 in the
next year) fell to very low levels and was largely indistinguishable across the
decades (figure 11). Table 1 presents the median estimates of transition prob-
abilities estimated across the full sample (i.e. aggregating across decades).
They show clearly that having reached annual trading of in the 10,000s, a full
collapse becomes relatively unlikely (4 percent). In fact, for contracts that
achieve annual trading in the 10,000s, the probability of falling more than
one volume level is below 10 percent. (See the sixth row of table 1.) Note
that these full sample estimates are biased toward recent decades because
the sample contains more observations from recent decades.
As suggested above, one hypothesis regarding the recent shift in deriva-
tives lifecycles is that the additional flexibility that low volume contracts
enjoyed in the 2000s came directly at the expense of mid-range to higher
volume contracts. In volatile markets, hedgers might be choosing niche con-
tracts with lower basis risk over more liquid cross-hedges. What would that
mean for the overall outlook for lifetime trading of derivatives? We test this
19

vol 0, year t+1
●
●
●
●
●
●
●
0.01
0.01
0.03
0.05
0.05
0.04
0.05
1950
1960
1970
1980
1990
2000
2010
vol 10^4's, t
0.00 0.25 0.50 0.75 1.00Pr(year−on−year move)
Dec
ade
Fig. 11. Probability of transition from annual volume in the tens of thousandsto annual volume of 0
20

by looking at the expected trading volume of a new derivative over the course
of ten years.
Combining draws from the transition matrix in figures 4 and 5 with draws
from a vector representing the probability of a contract starting in each of
the available states of annual trading volume (estimated using the same basic
model presented in equation 4) we can get the probability that a new contract
will be in any given state of volume after ten years of trading. Those values
are displayed in figure 12. Figure 12 makes clear the resilience of contracts
trading at low levels in the 2000s. Only 32 percent of contract that debuted
with zero volume were still trading at zero volume after ten years in the
simulation representing the 2000s. Those probabilities were 46, 48, and 52
percent in the 1990s, 1980s and 1970s respectively (See the first column
of boxes in figure 12).3 Instead of languishing, contracts simulated from the
2000s were more likely to migrate over ten years to moderate levels of trading.
(See the columns of boxes in figure 12 corresponding to annual trading volume
between 100 and 10,000.) Those same contracts were, however, less likely to
reach the highest levels of trading (≥ 100, 000) than contracts from other
decades. The 1980s appears to be the best decade for such blockbuster
contracts, as suggested in Gorham and Kundu (2012).
Simply comparing the raw probabilities of reaching various levels of vol-
ume after ten years, it is difficult to discern which decade provided a better
overall environment for new contracts. To make that comparison, we normal-
ize the probabilities in figure 12 by the lower bound of each trading range (i.e.
multiplying the probability of being in the trading state ≥ 100 and < 1, 000
by 100). This give an approximation of the expected trading volume of a
new contract after ten years, displayed in figure 13. Based on that graph, we
can conclude:
3Note these simulated values simply describe the dynamics of the transition matriceswhen compounded. They ignore delisting. If we accounted for delisting, a practice thatwas more common in previous decades, the probabilities of failure would likely be higherfor those decades.
21

●●●●●●●●●●●●●●●●●●●●●●●●●●●●●●●●●●●●●●●●●●●●●
●
●●●●●●●●●●●●●●●●●●●●●●●●●●●●●●●●●●●●
●●●●●●●●●●●
●
●●●●●●●●●●●●●●●●●●●●●●●●●●●●●●●●●●●●●●●●●●●●●●●●●●●●●●●●●●●●●●●●●●●●●●●●●●
●●●●●●●●●●●●●●●●●●●●●●●●●●●●●●●●●●●●●●●●●●●●●●●●●●●●●●●●●●●●●●●●●●●●●●●●●●●●●●●●●●●●●●●●●●●●●●●●●●●●●●●●●●●●●●●●●●●●●●●●●●●●●●●●●●●●●●●●●●●●●●●●●●●●●●●●●●●●●●●●●●●●●
●●●●●●●●●●●●●●●●●●●●●●●●●●
●
●●●
●
●●●●●●●●●●●●●●●●●●●●●●●●●●●●●●●●●●●●●●●●●●●●●●●●●●●●●●●●●●●●●●●●●●●●●●●●●●●●●●●●●●●●●●
●
●●●●●●●●●●●●●●●●
●●●
●
●
●
●●●●●●●●●●●●●●●●●●●●●●●●●●●●●●
●
●
●
●●●●●●●●●●●●●●●●●●●
●
●●●●●
●●
●●●●●●●●●●●●●●●●●●●●●
●
●●●●●●●
●
●●●●●
●●
●
●●●●●
●
●●●●●●●●●●●●●●●●●●●●●●
●●
●●●●●●●●●●●●●●
●
●●
●
●●●●●●●●●●●●●●●
●
●●●●●
●
●
●●
●●●
●
●●
●●●●●●
●
●●
●
●●●●●●
●
●●●●●
●●
●●●●
●
●●●●●●●●●●●●●●●
●
●
●
●
●
●●●
●
●●●●●●●●
●
●●●●●●●●●
●
●●
●●●
●●
●●●●●●●●●●●●●●●●●●●●●●●●●●●●●●●●
●
●●●●●●●●●●●●●●●●●●●●●●●●●●●●●●●●●●●●●
●
●●●●●●
●●●●●●●●●●●●●●●●●●●●●●●●●●●●●●●●●●●●●●●●●●●●●●●●●●●●●●●●●●●●●●●●●●●●●●●●●●●●●●●●●●●●●●●●●●●●●●●●●●●●●●●●●●●●●●●●●●●●●●●●●●●●●●●●●●●●●●●●●●●●●●●●●●●●●●●●●●●●●●●●●●●●●●●●●●●●●●●●●●●●●●●●●●●●●●●●●●●●●●●●●●●●●●●●●●●●●●●●●●●●●●●●●●●●●●●●●●●●●●●●●●●●●●●●●●●●●●●●●●●●●●●●●●●●●●●●●●●●●●●●●●●●●●●●●●●●●●●●●●●●●●●●●●●●●●●●●●●●●●●●●●●●●●●●●●●●●● ●●●●●●●●●●●●●●
●●●●●●●●●●●●●●●●●●●●●●●●●●●●●●●●●●●●●●●●●●●●●●●●●●●●●●●●●●●●●●●●●●●●●●●●●●●●●●●●●●●●●●●●●●●●●●●●●●●●●●●●●●●●●●●●●●●●●●●●●●●●●●●●●●●●●●●●●●●●●●●●●●●●●●●●●●●●●●●●●●●●●●●●●●●●●●●●●●●●●●●●●●●●●●●●●●●●●●●●●●●●●●●●●●●●●●●●●●●●●●●●●●●●●●●●●●●●●●●●●●●●●●●●●●●●●●●●●●●●●●●●●●●●●●●●●●●●●●●●●●●●●●●●●●●●●●●●●●●●●●●
●
●●●●●●●●●●●●●●●●●●●●●●●●●●●●●●●●●●●●●●●●●●●●●●●●●●●●●●●●●●●●●●●●●●●●●●●●●●●●●●●●●●●●●●●●●●●●●●●●●●●●●●●●●●●●●●●●●●●●●●●●●●●●●●●●●●●●●●●●●●●●●●●●●●●●●●●●●●●●●●●●●●●●●●●●●●●●●●●●●●●●●●●●●●●●●●●●●●●●●●●●●●●●●●●●●●●●●●●●●●●●●●●●●●●●●●●●●●●●●●●●●●●●●●●●●●●●●●●●●●●●●●●●●●●●●●●●●●●●●●●●●●●●●●●●●●●●●●●●●●●●●●●●●●●●●●●●●●●●●●●●●●●●●●●●●●●●●●●●●●● ●●●●●●●●●●●●●●●●●●●●●●●●●●●●●●●●●●
●●●●●●●●●●●●●●●●●●●●●●●●●●●●●●●●●●●●●●●●●●●●●●●●●●●●●●●●●●●●●●●●●●●●●●●●●●●●●●●●●●●●●●●●●●●●●●●●●●●●●●●●●●●●●●●●●●●●●●●●●●●●●●●●●●●●●●●●●●●●●●●●●●●●●●●●●●●●●●●●
●
●●●●●●●●●●●●●●●●●●●●●●●●●●●●●●●●●●●●●●●●●●●●●●●
●●●●●●●●●●●●●●●●●●●●●●●●●●●●●●●●●●●●●●●●●●●●●●●●●●●●●●●●●●●●●●●●●●●●●●●●●●●●●●●●●●●●●●●●●●●●●●●●●●●●●●●●●●●●●●●●●●●●●●●●●●●●●●●●●●●●●●●●●●●●●●●●●●●●●●●●●●●●●●●●●●●●●●●●●●●●●●●●●●●●●●●●●●●●●●●●●●●●●●●●●●●●●●●●●●●●●●●●●●●●●●●●●●●●●●●●●●●●●●●●●●●●●●●●●●●●●●●●●●●●●●●●●●●●●●●●●●●●●●●●●●●●●●●●●●●●●●●●●●●●●●●●●●●●●●●●●●●●●●●●●●●●●●●●●●●●●●●●●●
●●●●●●●●●●●●●●●●●●●●●●●●●●●●●●●●●●●●●●●●●●●●●●●●●●●●●●●●●●●●●●●●●●●●●●●●●●●●●●●●●●●●●●●●●●●●●●●●●●●●●●●●●●●●●●●●●●●●●●●●●●●●●●●●●●●●●●●●●●●●●●●●●●●●●●●●●●●●●●
0.150.05
0.110.21
0.140.22
0.10.01 0 0
●●
●●●●
●●
●●●●
●●●●●●
●●●
●●●●●●●●●
●
●●●●
●
●●●●●●●
●●
●●
●
●
●●
●●●●
●
●●
●●●
●
●
●●●●
●●●●●●●●●●●●●●●●●●●●●●●●●●●●●●●●●●●●●●●●●●●●●●●●●●●●●●●●●●●●
●
●●●
●
●●●●●●●●●●●●●●●●●●●●●●●●●●●●●●●●●●●●●●●●●●●●●●●
●●●●●
●
●●
●
●●●●●●●●●●●●●●
●
●●●●●
●
●●●●●●●●●●
●
●●●●●●●
●
●●
●
●●●●●●●●●●●●●
●
●●●●●●●●
●
●
●
●●●●●●●●● ●
●
●●●●●●●●●●●●●●●●●●●●●●●●
●●
●●●●●●●●●●●●●●●●●●●●●
●
●●●●●●●●●●●
●
●●●●●●●●●●●●●●●●●●●●●●●
●
●
●
●●●●
●
●●●●●●●●●●●●●●●●●●●●●●●●●●●●●●●●●●
●
●
●●●●●●●●●●●●●●●●●●●●●●●●●●●●●●●●●●●●●●●●●●●●●●●●●●●●●●●●●●●●●●●●●●●●●●●●●●●●●●●●●●●●
●
●●●●●●●●●●●●●●●●●●●●●●●●●●●●●●●●●●●●●●●●●●●●●●●●●●●●
●
●●●●●●●●●●●●●●●●
●
●●●●●●●●●●●●●●●●
●
●●●●●●●●●●●●●●●●●●●●●●●●●●●●●●●●●●●●●●●●●
●●●
●●●●●●●●●●●●●●●●●●●●
●
●●●●●●●●●●●●●
●
●● ●●●●●●●
●
●
●●
●●
●
●●
●
●●●●●●●●
●
●●●
●
●●●●●●●●●●●●●●●●●●●●●●●●●●●●●●●●●●●●●●●●●●●●●●●●●●●
●
●●●●
●
●●●●●●●●●●●●●●
●●●●●●●●●●●●●●●●●●●●●●●●●●●●●●●●●●●●●●●●●●●●●●●●●●●●●●●●●●●●●●●●●●●●●●●●●●●●●●●●●●●●●●●●●●●●●●●●●●●●●●●●●●●●●●●●●●●●●●●●●●●●●●●●●●●●●●●●●●●●●●●●●●●●●●●●●●●●
●●●●●●●●●●●●●●●●●●●●●●●●●●●●●●●●●●●●●●●●●●●●●●●●●●●●●●●●●●●●●●●●●●●●●●●●●●●●●●●●●●●●●●●●●●●●●●●●●●●●●●●●●●●●●●●●●●●●●●●●●●●●●●●●●●●●●●●●●●●●●●●●●●●●●●●●●●●●●●●●●●●●●●●●●●●●●●●●●●●●●●●●●●●●●●●●●●●●●●●●●●●●●●●●●●●●●●●●●●●●●●●●●●●●●●●●●●●●●●●●●●●●●●●●●●●●●●●●●●●●●●●●●●●●●●●●●●●●●●●●●●●●●●●●●●●●●●●●●●●●●●●●●●●●●●●●●●●●●●●●●●●●●●●●●●●●●●●●●●●●●●●●●●●●●●●●●●●●●●●●●●●●●●●●●●●●●●●●●●●●●●●●●●●●●●●●●●●●●●●●●●●●●●●●●●●●●●●●●●●●●●●●●●●●●●●●●●●●●●●●●●●●●●●●●●●●●●●●●●●●●●●●●●●●●●●●●●●●●●●●●●●●●●●●●●●●●●●●●●●●●●●●●●●●●●●●●●●●●●●●●●●●●●●●●●●●●●●●●●●●●●●●●●●●●●●●●●●●●●●●●●●●●●●●●●●●●●●●●●●●●●●●●●●●●●●●●●●●●●●●●●●●●●●●●●●●●●●●●●●●●●●●●●●●●●●●●●●●●●●●●●●●●●●●●●●●●●●●●●●●●●●●●●●●●●●●●●●●●●●●●●●●●●●●●●●●●●●●●●●●●●●●●●●●●●●●●●●●●●●●●●●●●●●●●●●●●●●●●●●●●●●●●●●●●●●●●●●●●●●●●●●●●●●●●●●●●●●●●●●●●●●●●●●●●●●●●●●●●●●● ●●●●●●●●●●●●●●●●●●●●●●●●●●●●●●●●●●●●●●●●●●●●●●●●●●●●●●●●●●●●●●●●●●●●●●●●●●●●●●●●●●●●●●●●●●●●●●●●●●●●●●●●●●●●●●●●●●●●●●●●●●●●●●●●●●●●●●●●●●●●●●●●●●●●●●●●●●●●●●●●●●●●●●●●●●●●●●●●●●●●●●●●●●●●●●●●●●●●●●●●●●●●●●●●●●●●●●●●●●●●●●●●●●●●●●●●●●●●●●●●●●●●●●●●●●●●●●●●●●●●●●●●●●●●●●●●●●●●●●●●●●●●●●●●●●●●●●●●●●●●●●●●●●●●●●●●●●●●●●●●●●●●●●●●●●●●●●●●●●●●●●●●●●●●●●●●●●●●●●●●●●●●●●●●●●●●●●●●●●●●●●●●●●●●●●●●●●●●●●●●●●●●●●●●●●●●●●●●●●●●●●●●●●●●●●●●●●●●●●●●●●●●●●●●●●●●●●●●●●●●●●●●●●●●●●●●●●●●●●●●●●●●●●●●●●●●●●●●●●●●●●●●●●●●●●●●●●●●●●●●●●●●●●●●●●●●●●●●●●●●●●●●●●●●●●●●●●●●●●●●●●●●●●●●●●●●●●●●●●●●●●●●●●●●●●●●●●●●●●●●●●●●●●●●●●●●●●●●●●●●●●●●●●●●●●●●●●●●●●●●●●●●●●●●●●●●●●●●●●●●●●●●●●●●●●●●●●●●●●●●●●●●●●●●●●●●●●●●●●●●●●●●●●●●●●●●●●●●●●●●●●●●●●●●●●●●●●●●●●●●●●●●●●●●●●●●●●●●●●●●●●●●●●●●●●●●●●●●●●●●●●●●●●●●●●●●●●●●●●●●●●●●●●●●●●●●●●●●●●●●●●●●●●●●●●●●●●●
0.33
0.08 0.13 0.13 0.09 0.11 0.10.02 0 0
●●●●●●●●●●●●●●
●●
●●●
●●
●●●●
●
●●
●
●●●●●
●
●
●
●●●
●
●●●●
●
●●
●●
●●●●
●●●●●●●●●●●●●●●●●●●●●●●●●●●●●●●●●●●●●●●●●●●●●●●●●●●●●●●●●●●●●●●●●●●●●●●●●●●●●●●●●●●●●●●●●●●●●●●●●●●●●●●●●●●●●●●●●●●●●●●●●●●●●●●●●●●●●●●●●●●●●●●●●●●●●●●●●●●●●●●●●●●●●●●
●●●●●●●●●●●●●●●●●●●●●●●●●●●
●●●●●●●●●●●●●●●●●●
●●●●●●●●●●●●●●●●●●●●●●●●●●●●●●●●●●●●●●●
●
●●●●●●●●●●●●●●●
●●●●●●●●●●
●●●●●●●●●●●●●●●●●
●
●●●●●●●●●●●●●●●●●●●●●●●●●●●●●●●●●●●●●●●●●●●●●●●●●●●●●●●●●●●●●●●●●●●●●●●●●●●●●●●●●●●●●●●●●●●●●●●●●●●●●●●● ●●●●●●●●●●●●●●●●●●●●●●●●●●●●●●●●●●●●●●●●●●●●●●●●●●●●●●●●●●●●●●●●
●●●●●●●●●●●●●●●●●●●●●●●●●●●●●●●●●●●●●●●●●●●●●●●●●●●●●●●●●●●●●●●●●●●●●●●●●●●●●●●●●●●●●●●●●●●●●●●●●●●●●●●●●●●●●●●●●●●●●●●●●●●●●●●●●●●●●●●●●●●●●●●●●
●●●●●●●●●●●●●●●●●●●●●●●●●●●●●●●●●●●●●●●●●●●●●●●●●●●●●●●●●●●●●●●●●●●●●●●●●●●●●●●●●●●●●●●●●●●●●●●●●●●●●●●●●●●●●●●●●●●●●●●●●●●●●●●●●●●●●●
●●●●●●●●●●●●●●●●●●●●●●●●●●●●●●●●●●●●●●●●●●●●●●●●●●●●●●●●●●●●●●●●●●●●●●●●●●●●●●●●●●●●●●●●●●●●●●●●●●●●●●●●●●●●●●●●●●●●●●●●●●●●●●●●●●●●●●●●●●●
●●●●●●●●●●●●●●●●●●●●●●●●●●●●●●●●●●●●●●●●●●●●●●●●●●●●●●●●●●●●●●●●●●●●●●●●●●●●
●
●●●●●●●●●●●●●●●●●●●●●●●●●●●●●●●●●●●●●●●●●●●●●●●●●●●●●●●●●●●
●●●●●●●●●●●●●●●●●●●●●●●●●●●●●●●●●●●●●●●
●
●●●●●●●●●●●●●●●●●●●●●●●●●●●●●●●●●●●●●●●●●●●●●●●●●●●●●●●●●●●●●●●●●●●●●●●●●●●●●●●●●●●●●●●●●●●●●●●●●●●●●●●●●●●●●●●●●●●●●●●●●●●●●●●●●●●●●●●●●●●●●●●●●●●●●●●●●●●●●●●●●●●●●●●●●●●●●●●●●●●●●●●●●●●●●●●●●●●●●●●●●●
●●●
●
●●●
●
●●
●
●●●●●●
●
●●●●●
●
●
●
●●●●●●●●●●●●●●●
●
●
●
●●●●●●●●●●●●●●●●
●
●
●
●●●●●●
●
●●●●●●
●
●●●●●●
●
●●●●●●●●●
●●
●●●●
●
●●●
●
●●●●●●●●●●●●●●●●
●
●●●●●●●●
●
●●●●●●●●●
●
●●●●●●●●●●●●●●
●
●●●●●●●●●●●●●●●●●
●
●●●●●●●●●●●●●●●●●
●
●●
●
●●●●
●
●
●
●
●●●●●●●●●●●●●●●●●●●●●●●●●●●●●●●●●●●●●●●●●●●●●●●●●●●●●●●●●●●●●●●●●●●●●●●●●●●●●●●●●●●●●●●●●●●●●●●●●●●●●●●●●●●●●●●
●
●●●●●●●●●●●●●●●●●●●●●●●●●●●●●●●●●●●●●●●●●●●●●●●●●●●●●●●●●●●●●●●●●●●●●●●●●●●●●●●●●●●●●●●●●●●●●●●●●●●●●●●●●●●●●●●●●●●●●●●●●●●●●●●●●●●●●●●●●●●●●●●●●●●●●●●●●●●●●●●●●●●●●●●●●●●●●●●●●●●●●●●●●●●●●●●●●●●●●●●●●●●●●●●●●●●●●●●●●●●●●●●●●●●●●●●●●●●●●●●●●●●●●●●●●●●● ●●●●●●●●●●●●●●●●●●●
●●●●●●●●●●●●●●●●●●●●●●●●●●●●●●●●●●●●●●●●●●●●●●●●●●●●●●●●●●●●●●●●●●●●●●●●●●●●●●●●●●●●●●●●●●●●●●●●●●●●●●●●●●●●●●●●●●●●●●●●●●●●●●●●●●●●●●●●●●●●●●●●●●●●●●●●●●●●●●●●●●●●●●●●●●●●●●●●●●●●●●●●●●●●●●●●●●●●●●●●●●●●●●●●●●●●●●●●●●●●●●●●●●●●●●●●●●●●●●●●●●●●●●●●●●●●●●●●●●●●●●●●●●●●●●●●●●●●●●●●●●●●●●●●●●●●●●●●●●●●●●●●●●●●●●●●●●●●●●●●●●
●●●●●●●●●●●●●●●●●●●●●●●●●●●●●●●●●●●●●●●●●●●●●●●●●●●●●●●●●●●●●●●●●●●●●●●●●●●●●●●●●●●●●●●●●●●●●●●●●●●●●●●●●●●●●●●●●●●●●●●●●●●●●●●●●●●●●●●●●●●●●●●●●●●●●●●●●●●●●●●●●●●●●●●●●●●●●●●●●●●●●●●●●●●●●●●●●●●●●●●●●●●●●●●●●●●●●●●●●●●●●●●●●●●●●●●●●●●●●●●●●●●●●●●●●●●●●●●●●●●●●●●●●●●●●●●●●●●●●●●●●●●●●●●●●●●●●●●●●●●●●●●●●●●●●●●●●●●●●●●●●●●●●●●●●●●
0.52
0.02 0.02 0.05 0.05 0.070.15
0.10 0
●
●●
●
●
●
●●
●
●●
●
●●
●
●●
●●●
●
●
●●
●
●●●
●
●●●●
●
●
●
●●●
●
●
●
●
●●
●
●●●
●●●●●●
●●
●
●
●●●
●
●●●
●●●●
●
●●●●●●●●●●●●●●●●●●●●●●●●●●●●●●●●●●●●●●●●●●●●●●●●●●●●●●●●●●●●●●●●●●●●●●●●●●●●●●●●●●●●●●●●●●●●●●●●●●●●●●●●●●●●●●●●●●●●●●●●●●●●●●●●●●●●●●●●●●●●●●●●●●●●●●●●●●●●●●●●●●●●●●●●●●●●●●●●●●●●●●●●●●●●●●●●●●●●●●●●●●●●●●●●●●●●●●●●●●●●●●●●●●●●●●●●●●●●●●●●●●●●●●●●●●●●●●●●●●●●●●●●●●●●●●●●●●●●●●●●●●●●●●●●●●●●●●●●●●
●●●●●●●●●●●●●●●●●●●●●●●●●●●●●●●●●●●●●●●●●●●●●●●●●●●●●●●●●●●●●●●●●●●●●●●●●●●●●●●●●●●●●●●●●●●●●●●●●●●●●●●●●●●●●●●●●●●●●●●●●●●●●●●●●●●●●●●●●●●●●●●●●●●●●●●●●●●●●●●●●●●●●●●●●●●●●●●●●●●●●●●●●●●●●●●● ●●●●●●●●●●●●●●●●●●●●●●●●●●●●●●●●●●●●●●●●●●●●●●●●●●●●●●●●●●●●●●●●●●●●●●●●●●●●●●●●●●●●●●●●●●●●●●●●●●●●●●●●●●●●●●●●●●●●●●●●●●●●●●●●●●●●●●●●●●●●●●●●●●●●●●●●●●●●●●●●●●●●●●●●●●●●●●●●●●●●●
●●●●●●●●●●●●●●●●●●●●●●●●●●●●●●●●●●●●●●●●●●●●●●●●●●●●●●●●●●●●●●●●●●●●●●●●●●●●●●●●●●●●●●●●●●●●●●●●●●●●●●●●●●●●●●●●●●●●●●●●●●●●●●●●●●●●●●●●●●●●●●●●●●●●●●●●●●●●●●●●●●●●●●●●●●●●●●●●●●●●●●●●●●
●●●●●●●●●●●●●●●●●●●●●●●●●●●●●●●●●●●●●●●●●●●●●●●●●●●●●●●●●●●●●●●●●●●●●●●●●●●●●●●●●●●●●●●●●●●●●●●●●●●●●●●●●●●●●●●●●●●●●●●●●●●●●●●●●●●●●●●●●●●●●●●●●●●●●●●●●●●●●●●●●●●●●●●●●●●●●●●●●●●●●●●●●●●●●●●●●●●●●●●●●●●●●●●●●●●●●●●●●●●●●●●●
●●●●●●●●●●●●●●●●●●●●●●●●●●●●●●●●●●●●●●●●●●●●●●●●●●●●●●●●●●●●●●●●●●●●●●●●●●●●●●●●●●●●●●
●●●●●●●●●●●●●●●●●●●●●
●
●●●●●●●●●●●●●●●●●●●●●
●
●
●
●●●●
●
●●●●●●●●●●●●●●●●
●●●●●●●
●
●●●●
●
●●●●●●●
●
●●●●●●●●●●
●●●●●●●
●
●●●●●●●
●
●
●
●●
●
●●
●●●
●
●
●●●●●●
●●
●●●●●●
●
●●●
●
●●●●
●●
●
●●
●
●
●●●
●
●
●●
●●
●●
●●●●●●●●●●●●●●●●●●●●●●●●●●●●●●●●●●●●●●●●●●●●●●●●●●●●●●●●●●●●●●●●●●●●●●●●●●●●●●●●●●●●●●●●●●●●●●●●●●●●●●●●●●●●●
●●●●●●●●●●●●●●●●●●●●●●●●●●●●●●●●●●●●●●●●●●●●●●●●●●●●●●●●●●●●●●●●●●●●●●●●●●●●●●●●●●●●●●●●●●●●●●●●●●●●●●●●●●●●●●●●●●●●●●●●●●●●●●●●●●●●●●●●●●●●●●●●●●●●●●●●●●●●●●●●●●●●●●●●●●●●●●●●●●●●●●●●●●●●●●●●●●●●●●●●●●●●●●●●●●●●●●●●●●●●●●●●●●●●●●●●●●●●●●●●●●●●●●●●●●●●●●●●●●●●●●●●●●●●●●●●●●●●●●●●●●●●●●●●●●●●●●●●●●●●●●●●●●●●●●●●●●●●●●●●●●●●●●●●●●●●●●●●●●●●●●●●●●●●●●●●●●●●●●●●●●●●●●●●●●●●●●●●●●●●●●●●●●●●●●●●●●●●●●●●●●●●●●●●●●●●●●●●●●●●●●●●●●●●●●●●●●●●●●●●●●●●●●●●●●●●●●●●●●●●●●●●●●●●●●●●●●●●●●●●●●●●●●●●●●●●●●●●●●●●●●●●●●●●●●●●●●●●●●●●●●●●●●●●●●●●●●●●●●●●●●●●●●●●●●●●●●●●●●●●●●●●●●●●●●●●●●●●●●●●●●●●●●●●●●●●●●●●●●●●●●●●●●●●●●●●●●●●●●●●●●●●●●●●●●●●●●●●●●●●●●●●●●●●●●●●●●●●●●●●●●●●●●●●●●●●●●●
0.48
0.01 0.03 0.02 0.04 0.08 0.120.17
0.04 0
●●
●
●●●●
●●
●
●●●
●●
●
●●●●●
●
●●●
●
●
●
●●●●●●●
●●
●●
●●●●
●
●●
●
●
●●●●
●●
●●●●●●
●
●
●
●●●●●●●●●●●●●●●●●●●●●●●●●●●●●●●●●●●●●●●●●●●●●●●●●●●●●●●●●●●●●●●●●●●●●●●●●●●●●●●●●●●●●●●●●●●●●●●●●●●●●●●●●●●●●●●●●●●●●●●●●●●●●●●●●●●●●●●●●●●●●●●●●●●●●●●●●●●●●●●●●●●●●●●●●●●●●●●●●●●●●●●●●●●●●
●●●●●●●●●●●●●●●●●●●●●●●●●●●●●●●●●●●●●●●●●●●●●●●●●●●●●●●●●●●●●●●●●●●●●●●●●●●●●●●●●●●●●●●●●●●●●●●●●●●●●●●●●●●●●●●●●●●●
●●●●
●
●●●●●●
●
●●●●●●●●●●●●●●●●●●●●●●●●●●●●●●●●●●●●●●●●●●●●●●●●●●●●●●●●●●●●●●●●●●
●
●●●●●●●●●●●●●●●●●●●●●●●●●● ●●●●●●●●●●●●●●●●●●●●●●●●●●●●●●●●●●●●●●●●●●●●●●●●●●●●●●●●●●●●●●●●●●●●●●●●
●●●●●●●●●●●●●●●●●●●●●●●●●●●●●●●●●●●●●●●●●●●●●● ●
●
●
●●●●●●●
●●
●●●●●●●●
●
●●●●
●
●●●●●●
●●
●●●
●
●●●●●●●●
●
●●●●●●●●●●
●
●●●●●●●
●
●●●●●●●●●●●●●●●●●●●●●●●●●●●●●●●●●●●●●●●●●●●●●●●
●
●●●●●●●●●●●●●●●●●●●●●●●●●●●●●●●●●●●●●●●●●●●
●●●●●●●
●●●●●●●●●●●●●●●●●●●●●●●●●●●●●●●●●●●●●●●●●●●●●●●●●●●●●●●●●●●●●●●●●●●●●●●●●●●●●●●●●●●●●●●●
●●●●●●●●●●●●●●●●●●●●●●●●●●●●●●●●●●●●●●●●●●●●●●●●●●●●●●●●●●●●●●●●●●●●●●●●●●●●●●●●●●●●●●●●●●●●●●●●●●●●●●●●●●●●●●●●●●●●●●●●●●●●●●●●●●●●●●●●●●●●●●●●●●●●●●●●●●●●●●●●●●●●●●●●●●●●●●●●●●●●●●●●●●●●●●●●●●●●●●●●●●●●●●●●●●●●●●●●●●●●●●●●●●●●●●●●●●●●●●●●●●●●●●●●●●●●●●●●●●●●●●●●●●●●●●●●●●●●●●●●●●●●●●●●●● ●●●●●●●●●●●●●●●●●●●●●●●●●●●●●●●●●●●●●●●●●●●●●●●●●●●●●●●●●●●●●●●●●●●●●●●●●●●●●●●●●●●●●●●●●●●●●●●●●●●●●●●●●●●●●●●●●●●●●●●●●●●●●●●●●●●●●●●●●●●●●●●●●●●●●●●●●●●●●●●●●●●●●●●●●●●●●●●●●●●●●●●●●●●●●●●●●●●●●●●●●●●●●●●●●●●●●●●●●●●●●●●●●●●●●●●●●●●●●●●●●●●●●●●●●●●●●●●●●●●●●●●●●●●●●●●●●●●●●●●●●●●●●●●●●●●●●●●●●●●●●●●●●●●●●●●●●●●●●●●●●●●●●●●●●●●●●●●●●●●●●●●●●●●●●●●●●●●●●●●●●●●●●●●●●●●●●●●●●●●●●●●●●●●●●●●●●●●●●●●●●●●●●●●●●●●●●●●●●●●●●●●●●●●●●●●●●●●●●●●●●●●●●●●●●●●●●●●●●●●●●●●●●●●●●●●●●●●●●●●●●●●●●●●●●●●●●●●●●●●●●●●●●●●●●●●●●●●●●●●●●●●●●
0.46
0.02 0.05 0.09 0.080.15
0.10.04 0.01 0
●●●●●●●●●●●●●●●●●●●●
●●●●●●●●●●●●●●●●●●●●●●●●●●●●●●●●●●●●●●●●●●●●●●●
●●●●●●●●●●●●●●●●●●●●●●●●●●●●●●●●●●●●●●●●●●●●●●●●●●●●●●●●●●●●●●●●●●●●●●●●●●●●●●●●
●●●●●●●●●●●●●●●●●●●●●●●●●●●●●●●●●●●●●●●●●●●●●●●●●●●●●●●●●●●●●●●●●●●●●●●●●●
●●●●●●●●●●●●●●●●●●●●●●●●●●●●●●●●●●●●●●●●●●●●●●●●●●●●●●●●●●●●●●●●●●
●●●●●●●●●●●●●●●●●●●●●●●●●●●●●●●●●●●●●●●●●●●●●●●●●●●●●●●●●●●●●●●●●● ●●●●●
●●●●●●●●●●●●●●●●●●●●●●●●●●●●●●●●●●●●●●●●●●●●●●●●●●●●●●●●●●●●●●●●●●●●●●●
●●●●●●●●●●●●●●●●●●●●●●●●●●●●●●●●●●●●●●●●●●●●●●●●●●●●●●●●●●●●●●●●●●●●●●●●●●●●●●●●●●● ●●●●●●●●●●●●●●●●●●●●●●●●●●●●●●●●●●●●●●●●●●●●●●●●●●●●●●●●●●●●●●●●●●●●●●●●●●●●● ●●●●●●●●●●●●●●●●●●●●●●●●●●●●●●●●●●●●●●●●●●●●●●●●●●●●●●●●●●●●●●●●●●●●●●●●●●●●●●●●●●●●●●●●●●●●●●●●●●●●●●●●●●●●●●●●●●●●●●●●●●●●●●●●●●●●●●●●●●●●●● ●●●●●●●●●●●●●●●●●●●●●●●●●●●●●●●●●●●●●●●●●●●●●●●●●●●●●●●●●●●●●●●●●●●●●●●●●●●●●●●●●●●●●●●●●●●●●●●●●●●●●●●●●●●●●●●●●●●●●●●●●●●●●●●●●●●●●●●●●●●●●●●●●●●●●●●●●●●●●●●●●●●●●●●●●●●●●●●●●●●●●●
0.32
0.030.1
0.16 0.17 0.130.05 0.02 0.01 0
●
●●
●
●●●
●
●
●●
●●●
●●●●
●●
●●
●
●●
●●●
●
●
●
●
●
●
●●●●
●●
●
●●
●
●●●
●
●
●●●
●
●
●●●
●●●●
●●
●
●
●●●●●●●●●●●●●●●●●●●●●●●●●●●●●●●●●●●●●●●●●●●●●●●●●●●●●●●●●●●●●●●●●●●●●●●●●●●●●●●●●●●
●●●●●●●●●●●●●●●●●●●●●●●●●●●●●●●●●●●●●●●●●●●●●●●●●●●●●●●●●●●●●●●●●●●●●● ●
●●●●●●●●●●●●●●●●●●●●●●●●●●●●●●●●●●●●●●●●●●●●●●●●●●●●●●●●●●●●●●●●●●●●●●●
●●●●●●●●●●●●●●●●●●●●●●●●●●●●●●●●●●●●●●●●●●●●●●●●●●●●●●●●●●●●●●●●●●●●●●●●●
●●●●●●●●●●●●●●●●●●●●●●●●●●●●●●●●●●●●●●●●●●●●●●●●●●●●●●●●●●●●●●●●●●●●●●●●●●●●●●●
●●●●●●●●●●●●●●●●●●●●●●●●●●●●●●●●●●●●●●●●●●●●●●●●●●●●●●●●●●●●●●●●●●●●●●●●●●●●●●●●●●●●●●●●●●●●●●●●●●● ●●●●●●●●●●●●●●●●●●●●●●●●●●●●●●●●●●●●●●●●●●●●●●●●●●●●●●●●●●●●●●●●●●●●●●●● ●●●●●●●●●●●●●●●●●●●●●●●●●●●●●●●●●●●●●●●●●●●●●●●●●●●●●●●●●●●●●●●●●●●●●●●●●●●●●●●●●●●●●●●●●●●●●●●●●●●●●●●●●●●●●●●●●●●●●●●●●●●●●●●●●●●●●●●●●●●●●●●●●●●●●●●●●●●●●●●●●●●●●●●●●●●●●●●●●●●●●●●●●●● ●●●●●●●●●●●●●●●●●●●●●●●●●●●●●●●●●●●●●●●●●●●●●●●●●●●●●●●●●●●●●●●●●●●●●●●●●●●●●●●●●●●●●●●●●●●●●●●●●●●●●●●●●●●●●●●●●●●●●●●●●●●●●●●●●●●●●●●●●●●●●●●●●●●●●●●●●●●●●●●●●●●●●●●●●●●●●●●●●●●●●●●●●●●●●●●●●●●●●●●●●●●●●●●●●●●●●●●●●●●●●●●●●●●●●●●●●●●●●●●●●●●●●●●●●●●●●●●●●●●●●●●●●●●●●●●●●●●●●●●●●●●●●●●●●●●●●●●●●●●●●●●●●●●●●●●●●●●●●●●●●●●●●●●●●●●●●●●●●●●●●●●●●●●●●●●●●●●●●●●●●●●●●●●●●●●●●●●●●●●●●●●●●●●●●●●●●●●●●●●●●●●●●●●●●●●●●●●●●●●●●●●●●●●●●●●●●●●●●●●●●●●●●●●●●●●●●●●●●●●●●●●●●●●●●●●●●●●●●●●●●●●●●●●●●●●●●●●●●●●●●●●●●●●●●●●●●●●●●●●●●●●●●●●●●●●●●●●●●●●●●●●●●●●●●●●●●●●●●●●●●●●●●●●●●●●●
0.35
0.12 0.14 0.150.1 0.07 0.04 0.02 0 0
0.0
0.2
0.4
0.6
0.0
0.2
0.4
0.6
0.0
0.2
0.4
0.6
0.0
0.2
0.4
0.6
0.0
0.2
0.4
0.6
0.0
0.2
0.4
0.6
0.0
0.2
0.4
0.6
19501960
19701980
19902000
2010
vol 0, year 10
vol 1's, year 10vol 10's, year 10vol 100's, year 10vol 1000's, year 10vol 10^4's, year 10vol 10^5's, year 10vol 10^6's, year 10vol 10^7's, year 10vol 10^8's, year 10
Volume level
Pr(
Bei
ng in
a g
iven
sta
te a
fter
10 y
ears
Fig. 12. Box and whiskers plot of probability of a new contract being atdifferent levels of trading after 10 years by decade - median simulated prob-ability marked in text, upper and lower hinges of the box plot correspond tothe first and third quartiles (the 25th and 75th percentiles)
22

• The expected trading volume after 10 years for a contract has varied
substantially from decade to decade;
• There is no clear trend that emerges from these variations over time;
• The expected trading volume at year ten for a contract in the 2000s
was firmly in the middle of the historical range - the 2000s were lower
than the 1980s, higher than the 1990s, and all three decades showed
substantial overlap with the earlier decades in the sample;
• In the 2000s, low volume contracts tended to rise to modest levels of
trading, balancing any fall in the probability of reaching the highest
trading levels.
●
●
●
●
●
●
●
1960
1980
2000
1e+05 1e+06Expected volume after 10 years
Dec
ade
Fig. 13. Expected trading volume over ten years by decade
While a larger percentage of contracts were at low volumes in the 2000s
23

than in previous decades (figure 1), individual contracts were considerably
more likely to jump up from very low volumes to moderate volumes (figure
8). The net effect of these trends set the expected volume of contracts at
year ten well within the historical range of earlier decades (figure 13). This is
remarkable given the explosion in the number of contracts launched (figure 3).
It suggests that the marginal value of an innovative contract (approximated
by its expected trading volume at year ten) did not fall in the 2000s, despite
exponentially higher rates of innovation than in past decades.
This shift is consistent with the hypothesis that electronic trading made
trading activity more mobile across derivatives markets and substantially
cut the costs of launching and sustaining a derivatives contract. But changes
went above and beyond the introduction of electronic trading on US and
European exchanges in the 2000s, making it difficult to identify the causes of
product lifecycle shifts in aggregate statistics. For example, many of the new
contracts launched in the 2000s (and included in this sample) are bilaterally-
negotiated, but centrally-cleared swaps. In the wake of Enron’s collapse,
which threatened energy firms with counter-party defaults on their swaps
trades, exchanges launched popular new facilities devoted to these cleared-
swaps, including the CME’s ClearPort. While those contracts benefited from
a suite of tools associated with electronic trading, they were not subject to
electronic trading in the narrow sense of actually having buy and sell orders
matched on an electronic platform.
To isolate the influence of electronic trading, we look at contracts trading
on the New York Mercantile Exchange (NYMEX), where electronic trading
was introduced suddenly. The NYMEX does not offer an ideal natural exper-
iment. Its trading patterns were likely influenced by the shift toward cleared
swaps throughout the 2000s. However, the abruptness of the exchange’s
switch to electronic trading does offer some scope for teasing out the relative
import of electronic trading.
24

5. Derivatives volumes by exchange
Differences in trading volume patterns over the life of a derivatives con-
tract may be influenced by the exchange offering the contract. Carlton (1984)
hypothesized that economies of scale in designing and launching a contract
gave those on larger exchanges a relative advantage in terms of trading vol-
umes. Similarly, there may be network effects stemming from an exchange’s
ability to cross-margin trades.
Cuny (1993) and Holland and Fremault (1997) suggest that innovative
exchanges may enjoy a first-mover advantage, capturing a disproportionate
share of trading on those contracts that they launch. Gorham and Kundu
(2012) tests this hypothesis and finds little persistent advantage. In the
context of a Markov model of trading volumes, if indeed there is a first-
mover advantage, then we would expect innovative exchanges to distinguish
themselves with higher expected trading in year ten.
Figure 14 presents expected volume in year ten for contracts on all ex-
changes in the sample. Contracts show greater distinction across decades (as
in figure 13) than across exchanges. It is possible to distinguish individual
exchanges from one another. For example, contracts on the Chicago Board of
Trade have an advantage over those on the NYMEX in expected value terms.
But no exchanges clearly distinguish themselves from the general tendency
with greater than 95 percent probability. Possible exceptions include:
• the single-stock futures traded on OneChicago which show particularly
low expected trading volumes over ten years
• the two registered exchanges in the IntercontinentalExchange group,
marked ICE and ICEU in figure 14, which likely have higher expected
trading volumes than most other exchanges. It is important to note
that these exchanges specialize in OTC markets, only a handful of
which have been reported to the CFTC as futures. Consequently, some
25

of their performance may represent selection bias.4
5.1. CME acquisitions test the important of exchange to life-
cycles
Recent exchange acquisitions offer the chance to test the effects of par-
ticular exchanges on trading volumes. Gorham and Kundu (2012) singled
out the CME as the exchange with a persistent advantage over its rivals -
leading other major exchanges in mean volume in the 5th year of trading,
mean lifetime volume, and their approximations of present value discounted
fee generation. In the late 2000s, the CME Group effectively5 took over both
the New York Mercantile Exchange (designated in the database as NYME
but commonly referred to as the NYMEX) and the Chicago Board of Trade
(CBT). After the acquisitions, the exchanges’ contracts continued to be re-
ported as before (i.e. NYMEX contracts continued to be reported in the
dataset as NYMEX contracts).
If indeed the CME did enjoy a persistent advantage on multiple volume
metrics, then presumably the transition matrices for NYMEX and CBOT
contracts, calculated using the Markov models profiled here, would improve
following their acquisitions. These acquisitions could also test a weaker
form of that same hypothesis. If exchange management is important to
contract lifecycles, then the CBOT and NYMEX’s contracts’ transition ma-
trices should converge to the CME’s, regardless of whether the CME has an
advantage over other exchanges or not.
Figures 15 and 16 for the NYMEX and ??’s figures ?? and ?? present
the transition matrices for each of the merged exchanges in the years before
4In late 2012, the IntercontinentalExchange announced that many of its most popularOTC contracts will begin trading as futures.
5Technically, the CME and CBOT merged. However, the CME was the dominant firmin the merger, initiating the transaction and retaining most of the key staff positions.Olson (2010) provides an inside account of the fight between the CME and ICE for controlof the CBOT.
26

●
●
●
●
●
●
●
●
●
●
●
●
●
●
●
●
●
●
●
●
●
●
●
●
●
●
●
●
●
●
●
●
●
●
●
●
ACE
BCC
C
CBT
CCX
CME
CMX
CRCE
E
ELX
EUR
EUS
GE
ICE
ICEU
ICEX
ICUS
IEPA
KCBT
MCE
MESL
MGE
Memphis
MilGX
N
NOCE
NYBOT
NYL
NYL2
NYME
NYPE
PANY
PBOT
PCE
Seattle
West Coast
1e+05 1e+07Expected volume after 10 years
Exc
hang
e
Fig. 14. Expected trading volume over ten years by exchange
27

and after the merger.6
The CBT’s transition matrices (??’s figures ?? and ??) show no consistent
trends in post-merger years relative to the earlier years in the sample. Post-
merger years with strong performance (contracts showing a high probability
of advancing to a higher level of liquidity - such as 2010, where many of the
contracts previously trading with annual volumes in the thousands advanced
to the tens of thousands) do not stand out relative to the pre-merger era. To
the extent that the CBT shows any post-merger trend, it stems from 2010,
an especially volatile year for the CBT, where many contracts advanced to
trading in the tens of thousands and a particularly large percentage fell back
from annual volumes in the tens of thousands.
Unlike the transition matrix for the CBT, the NYMEX shows a clear trend
in its transition probabilities. On the rows in figures 15 and 16 indicating
trading volume between ≤ 10 and < 1, 000, 000 (rows three through five in
figure 15 and rows one and two in figure 16), a gradual pattern in volume
level transitions emerges that is strong enough, by the end of the decade,
to hold with high probability. Starting roughly in 2006, the 10s, 100s, and
1000s became sinks (rows three through five in figures 15). The probability
of staying at these levels year on year increases gradually. The probability
of rising out of that range falls. At levels immediately above that sink (rows
one and two in figures 16), the probability of falling into the sink rises at the
clear expense of the probability of staying put or rising. This trend predates,
and is uninterrupted by, the CME merger.
Neither transition matrix support the hypothesis that exchange manage-
ment is an important factor in lifecycle patterns, much less the hypothesis
that CME’s systems and network effects boost trading volumes substantially
relative to competing exchanges.
6We chose to present the full transition matrix for the exchange-year comparisons ratherthan the expected value figures because we believe that the former provide more robustinference. Expected value calculations are sensitive to the initial trading volumes of thecontracts that happened to launch after the merger.
28

vol 0, year t+1 vol 1's, t+1 vol 10's, t+1 vol 100's, t+1 vol 1000's, t+1 vol 10^4's, t+1 vol 10^5's, t+1 vol 10^6's, t+1 vol 10^7's, t+1 vol 10^8's, t+1
●
●
●
●
●
●
●
●
●
●
0.98
0.35
0.94
0.98
0.46
0.69
0.81
0.58
0.35
0.43
●
●
●
●
●
●
●
●
●
●
0.02
0.02
0.02
0.77
0.53
0.36
0.55
0.66
0.66
0.45
●
●
●
●
●
●
●
●
●
●
0
0
0.5
0.31
0.27
0.36
0.19
0.29
0.32
0.44
●
●
●
●
●
●
●
●
●
●
0
0.21
0.11
0.06
0.19
0.29
0.3
0.18
0.3
0.25
●
●
●
●
●
●
●
●
●
●
0.04
0
0
0
0.1
0.05
0.08
0.16
0.11
0.16
●
●
●
●
●
●
●
●
●
●
0
0
0.01
0
0
0
0
0
0.07
0.05
●
●
●
●
●
●
●
●
●
●
0.73
0.73
0.74
0.15
0.07
0.15
0.39
0.13
0.03
0.21
●
●
●
●
●
●
●
●
●
●
0.01
0.01
0.01
0
0
0
0.09
0.03
0
0.04
●
●
●
●
●
●
●
●
●
●
0
0
0
0
0
0
0
0.01
0
0
●
●
●
●
●
●
●
●
●
●
0
0
0
0
0
0
0
0
0
0
●
●
●
●
●
●
●
●
●
●
0
0
0
0
0.5
0.08
0.05
0
0.23
0.08
●
●
●
●
●
●
●
●
●
●
0.01
0.01
0.01
0
0.34
0
0
0
0.18
0.29
●
●
●
●
●
●
●
●
●
●
0.25
0.25
0.25
0.07
0.25
0.05
0.22
0.35
0.26
0.34
●
●
●
●
●
●
●
●
●
●
0
0
0.13
0.11
0.1
0.07
0.03
0.09
0.12
0.11
●
●
●
●
●
●
●
●
●
●
0.04
0.06
0
0
0
0
0
0
0.01
0.01
●
●
●
●
●
●
●
●
●
●
0
0
0
0
0
0.18
0.11
0.22
0.15
0.2
●
●
●
●
●
●
●
●
●
●
0
0
0
0
0
0.29
0
0.07
0.07
0
●
●
●
●
●
●
●
●
●
●
0
0
0
0.53
0.28
0.44
0.3
0.22
0.27
0.16
●
●
●
●
●
●
●
●
●
●
0.07
0.39
0.21
0.31
0.28
0.33
0.37
0.41
0.44
0.49
●
●
●
●
●
●
●
●
●
●
0
0
0.15
0.1
0.16
0.13
0.08
0.09
0.15
0.22
●
●
●
●
●
●
●
●
●
●
0
0.5
0
0
0
0
0
0.13
0.11
0.02
●
●
●
●
●
●
●
●
●
●
0
0
0
0
0
0
0
0.07
0
0
●
●
●
●
●
●
●
●
●
●
0
0
0
0
0.1
0.11
0.04
0.06
0.13
0
●
●
●
●
●
●
●
●
●
●
0.34
0
0.13
0.41
0.4
0.24
0.29
0.28
0.13
0.13
●
●
●
●
●
●
●
●
●
●
0.07
0.19
0.56
0.48
0.4
0.42
0.48
0.56
0.56
0.52
●
●
●
●
●
●
●
●
●
●
0
0
0
0
0
0
0
0.03
0.03
0.14
●
●
●
●
●
●
●
●
●
●
0
0
0
0
0
0
0
0
0
0
●
●
●
●
●
●
●
●
●
●
0.5
0
0
0
0.04
0
0.09
0
0
0
●
●
●
●
●
●
●
●
●
●
0.32
0.21
0.27
0.06
0
0.04
0
0.02
0.01
0.01
●
●
●
●
●
●
●
●
●
●
0.37
0.71
0.21
0.39
0.33
0.39
0.31
0.19
0.15
0.07
●
●
●
●
●
●
●
●
●
●
0
0
0
0
0
0
0
0
0
0.02
●
●
●
●
●
●
●
●
●
●
0
0
0
0
0
0
0
0
0
0
●
●
●
●
●
●
●
●
●
●
0
0.5
0
0
0
0
0
0
0
0
●
●
●
●
●
●
●
●
●
●
0.13
0
0
0
0
0
0
0
0
0
●
●
●
●
●
●
●
●
●
●
0.42
0
0.04
0
0
0
0.04
0
0
0
●
●
●
●
●
●
●
●
●
●
0
0
0
0
0
0
0
0
0
0
●
●
●
●
●
●
●
●
●
●
0
0
0
0
0
0
0
0
0
0
●
●
●
●
●
●
●
●
●
●
0
0
0
0
0
0
0
0
0
0
●
●
●
●
●
●
●
●
●
●
0
0
0
0
0
0
0
0
0
0
●
●
●
●
●
●
●
●
●
●
0
0
0
0.02
0
0
0
0
0
0
●
●
●
●
●
●
●
●
●
●
0
0
0
0
0
0
0
0
0
0
●
●
●
●
●
●
●
●
●
●
0
0
0
0
0
0
0
0
0
0
●
●
●
●
●
●
●
●
●
●
0
0
0
0
0
0
0
0
0
0
●
●
●
●
●
●
●
●
●
●
0
0
0
0
0
0
0
0
0
0
●
●
●
●
●
●
●
●
●
●
0
0
0
0
0
0
0
0
0
0
●
●
●
●
●
●
●
●
●
●
0
0
0
0
0
0
0
0
0
0
●
●
●
●
●
●
●
●
●
●
0
0
0
0
0
0
0
0
0
0
●
●
●
●
●
●
●
●
●
●
0
0
0
0
0
0
0
0
0
0
●
●
●
●
●
●
●
●
●
●
0
0
0
0
0
0
0
0
0
0
●
●
●
●
●
●
●
●
●
●
0
0
0
0
0
0
0
0
0
0
NYME−2001
NYME−2002
NYME−2003
NYME−2004
NYME−2005
NYME−2006
NYME−2007
NYME−2008
NYME−2009
NYME−2010
NYME−2001
NYME−2002
NYME−2003
NYME−2004
NYME−2005
NYME−2006
NYME−2007
NYME−2008
NYME−2009
NYME−2010
NYME−2001
NYME−2002
NYME−2003
NYME−2004
NYME−2005
NYME−2006
NYME−2007
NYME−2008
NYME−2009
NYME−2010
NYME−2001
NYME−2002
NYME−2003
NYME−2004
NYME−2005
NYME−2006
NYME−2007
NYME−2008
NYME−2009
NYME−2010
NYME−2001
NYME−2002
NYME−2003
NYME−2004
NYME−2005
NYME−2006
NYME−2007
NYME−2008
NYME−2009
NYME−2010
vol 0, year tvol 1's, t
vol 10's, tvol 100's, t
vol 1000's, t
0.00
0.25
0.50
0.75
1.00
0.00
0.25
0.50
0.75
1.00
0.00
0.25
0.50
0.75
1.00
0.00
0.25
0.50
0.75
1.00
0.00
0.25
0.50
0.75
1.00
0.00
0.25
0.50
0.75
1.00
0.00
0.25
0.50
0.75
1.00
0.00
0.25
0.50
0.75
1.00
0.00
0.25
0.50
0.75
1.00
0.00
0.25
0.50
0.75
1.00
Pr(year−on−year move)
Exc
hang
e−Ye
ar
Fig. 15. Transition matrix for Markov model of derivatives contract movingbetween states of annual trading volume by decade - NYMEX before and afterCME merger (announced March 2008, finalized September 2009) and beforeand after switch to electronic trading (September 2006) - part 1: transitionsgiven annual volumes ≥ 0 and < 10, 000
29
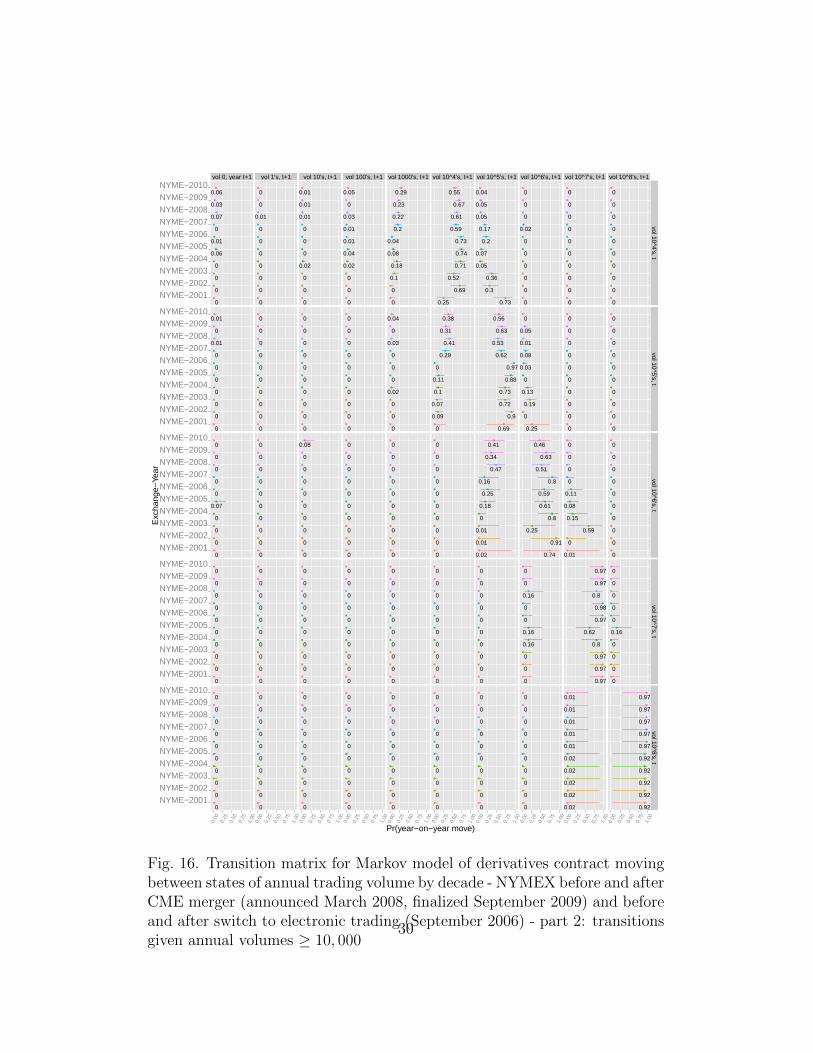
vol 0, year t+1 vol 1's, t+1 vol 10's, t+1 vol 100's, t+1 vol 1000's, t+1 vol 10^4's, t+1 vol 10^5's, t+1 vol 10^6's, t+1 vol 10^7's, t+1 vol 10^8's, t+1
●
●
●
●
●
●
●
●
●
●
0
0
0
0
0.06
0.01
0
0.07
0.03
0.06
●
●
●
●
●
●
●
●
●
●
0
0
0
0
0
0
0
0.01
0
0.01
●
●
●
●
●
●
●
●
●
●
0
0
0
0
0.07
0
0
0
0
0
●
●
●
●
●
●
●
●
●
●
0
0
0
0
0
0
0
0
0
0
●
●
●
●
●
●
●
●
●
●
0
0
0
0
0
0
0
0
0
0
●
●
●
●
●
●
●
●
●
●
0
0
0
0
0
0
0
0.01
0
0
●
●
●
●
●
●
●
●
●
●
0
0
0
0
0
0
0
0
0
0
●
●
●
●
●
●
●
●
●
●
0
0
0
0
0
0
0
0
0
0
●
●
●
●
●
●
●
●
●
●
0
0
0
0
0
0
0
0
0
0
●
●
●
●
●
●
●
●
●
●
0
0
0
0
0
0
0
0
0
0
●
●
●
●
●
●
●
●
●
●
0
0
0
0.02
0
0
0
0.01
0.01
0.01
●
●
●
●
●
●
●
●
●
●
0
0
0
0
0
0
0
0
0
0
●
●
●
●
●
●
●
●
●
●
0
0
0
0
0
0
0
0
0
0.08
●
●
●
●
●
●
●
●
●
●
0
0
0
0
0
0
0
0
0
0
●
●
●
●
●
●
●
●
●
●
0
0
0
0
0
0
0
0
0
0
●
●
●
●
●
●
●
●
●
●
0
0
0
0.02
0.04
0.01
0.01
0.03
0
0.05
●
●
●
●
●
●
●
●
●
●
0
0
0
0
0
0
0
0
0
0
●
●
●
●
●
●
●
●
●
●
0
0
0
0
0
0
0
0
0
0
●
●
●
●
●
●
●
●
●
●
0
0
0
0
0
0
0
0
0
0
●
●
●
●
●
●
●
●
●
●
0
0
0
0
0
0
0
0
0
0
●
●
●
●
●
●
●
●
●
●
0
0
0.1
0.18
0.08
0.04
0.2
0.22
0.23
0.29
●
●
●
●
●
●
●
●
●
●
0
0
0
0.02
0
0
0
0.03
0
0.04
●
●
●
●
●
●
●
●
●
●
0
0
0
0
0
0
0
0
0
0
●
●
●
●
●
●
●
●
●
●
0
0
0
0
0
0
0
0
0
0
●
●
●
●
●
●
●
●
●
●
0
0
0
0
0
0
0
0
0
0
●
●
●
●
●
●
●
●
●
●
0.25
0.69
0.52
0.71
0.74
0.73
0.59
0.61
0.67
0.55
●
●
●
●
●
●
●
●
●
●
0
0.09
0.07
0.1
0.11
0
0.29
0.41
0.31
0.38
●
●
●
●
●
●
●
●
●
●
0
0
0
0
0
0
0
0
0
0
●
●
●
●
●
●
●
●
●
●
0
0
0
0
0
0
0
0
0
0
●
●
●
●
●
●
●
●
●
●
0
0
0
0
0
0
0
0
0
0
●
●
●
●
●
●
●
●
●
●
0.73
0.3
0.36
0.05
0.07
0.2
0.17
0.05
0.05
0.04
●
●
●
●
●
●
●
●
●
●
0.69
0.9
0.72
0.73
0.88
0.97
0.62
0.53
0.63
0.56
●
●
●
●
●
●
●
●
●
●
0.02
0.01
0.01
0
0.18
0.25
0.16
0.47
0.34
0.41
●
●
●
●
●
●
●
●
●
●
0
0
0
0
0
0
0
0
0
0
●
●
●
●
●
●
●
●
●
●
0
0
0
0
0
0
0
0
0
0
●
●
●
●
●
●
●
●
●
●
0
0
0
0
0
0
0.02
0
0
0
●
●
●
●
●
●
●
●
●
●
0.25
0
0.19
0.13
0
0.03
0.08
0.01
0.05
0
●
●
●
●
●
●
●
●
●
●
0.74
0.91
0.25
0.8
0.61
0.59
0.8
0.51
0.63
0.46
●
●
●
●
●
●
●
●
●
●
0
0
0
0.16
0.16
0
0
0.16
0
0
●
●
●
●
●
●
●
●
●
●
0
0
0
0
0
0
0
0
0
0
●
●
●
●
●
●
●
●
●
●
0
0
0
0
0
0
0
0
0
0
●
●
●
●
●
●
●
●
●
●
0
0
0
0
0
0
0
0
0
0
●
●
●
●
●
●
●
●
●
●
0.01
0
0.59
0.15
0.08
0.11
0
0
0
0
●
●
●
●
●
●
●
●
●
●
0.97
0.97
0.97
0.8
0.62
0.97
0.98
0.8
0.97
0.97
●
●
●
●
●
●
●
●
●
●
0.02
0.02
0.02
0.02
0.02
0.01
0.01
0.01
0.01
0.01
●
●
●
●
●
●
●
●
●
●
0
0
0
0
0
0
0
0
0
0
●
●
●
●
●
●
●
●
●
●
0
0
0
0
0
0
0
0
0
0
●
●
●
●
●
●
●
●
●
●
0
0
0
0
0
0
0
0
0
0
●
●
●
●
●
●
●
●
●
●
0
0
0
0
0.16
0
0
0
0
0
●
●
●
●
●
●
●
●
●
●
0.92
0.92
0.92
0.92
0.92
0.97
0.97
0.97
0.97
0.97
NYME−2001
NYME−2002
NYME−2003
NYME−2004
NYME−2005
NYME−2006
NYME−2007
NYME−2008
NYME−2009
NYME−2010
NYME−2001
NYME−2002
NYME−2003
NYME−2004
NYME−2005
NYME−2006
NYME−2007
NYME−2008
NYME−2009
NYME−2010
NYME−2001
NYME−2002
NYME−2003
NYME−2004
NYME−2005
NYME−2006
NYME−2007
NYME−2008
NYME−2009
NYME−2010
NYME−2001
NYME−2002
NYME−2003
NYME−2004
NYME−2005
NYME−2006
NYME−2007
NYME−2008
NYME−2009
NYME−2010
NYME−2001
NYME−2002
NYME−2003
NYME−2004
NYME−2005
NYME−2006
NYME−2007
NYME−2008
NYME−2009
NYME−2010
vol 10^4's, tvol 10^5's, t
vol 10^6's, tvol 10^7's, t
vol 10^8's, t
0.00
0.25
0.50
0.75
1.00
0.00
0.25
0.50
0.75
1.00
0.00
0.25
0.50
0.75
1.00
0.00
0.25
0.50
0.75
1.00
0.00
0.25
0.50
0.75
1.00
0.00
0.25
0.50
0.75
1.00
0.00
0.25
0.50
0.75
1.00
0.00
0.25
0.50
0.75
1.00
0.00
0.25
0.50
0.75
1.00
0.00
0.25
0.50
0.75
1.00
Pr(year−on−year move)
Exc
hang
e−Ye
ar
Fig. 16. Transition matrix for Markov model of derivatives contract movingbetween states of annual trading volume by decade - NYMEX before and afterCME merger (announced March 2008, finalized September 2009) and beforeand after switch to electronic trading (September 2006) - part 2: transitionsgiven annual volumes ≥ 10, 000
30

5.2. Recent trends in NYMEX lifecycles and the importance of
electronic trading
While they do not show a strong influence from the CME acquisition,
figures 15 and 16 may speak to the influence of electronic trading. Pro-
nounced lifecycle trends on the NYMEX seem to begin in 2006, when the
exchange abruptly switched from open-outcry to electronic trading. These
trends mirror the more general tendency across derivatives markets over the
last decade, with more flexible trading at low volumes, more contracts mov-
ing up to modest volumes, and a small decline in the probability of trading
at high levels.
As mentioned above, it is difficult to separate out the effects of electronic
trading per se from those of the whole suite of new tools that arrived with
electronic trading, such as clear swaps platforms. NYMEX, within its spe-
cialization in energy contracts threatened by Enron, was a pioneer in cleared
swaps transactions. In 2003, it launched ClearPort, the platform now used
for all of the CME’s cleared swaps trades. ClearPort was marketed as an
electronic trading system because it disseminated information about special-
ized swaps trades via screens (Reuters News, 2003). However, most cleared
swaps transactions are negotiated bilaterally, over the phone. That means
that ClearPort trades are supported by electronic infrastructure, but they are
not fully electronic. So, while NYMEX’s abrupt shift from pit-based to elec-
tronic trading offers a prime opportunity to isolate the influence of electronic
trading on derivatives volumes, the advent of cleared swaps complicates both
the analysis of NYMEX data and the definition of electronic trading.
To the extent that we can identify the influence of fully electronic trading
on its own, then 2006, the year that NYMEX abruptly closed pit trading,
should produce discontinuities in ongoing lifecycle trends. 2006 does indeed
show evidence of a discontinuity. That evidence is not overwhelming, but it
does support the hypothesis that the large changes in derivatives markets in
the 2000s were driven specifically by the switch to electronic trading.
31

6. Derivatives volumes by product type
Figure 17 shows expected value estimates for trading at year ten for each
product type. Derivatives based on US treasuries, and, to a lesser extent,
derivatives based on natural gas and stock indexes enjoy higher expected
volumes than other product types.
The distinction between these strong performers and most of the other
product types in the sample is appreciable but does not hold with high prob-
ability. The 95 percent probability interval for each of those high expected
volume product types sits within the upper tails of the distributions for other
product types. The long upper tails that shadow the three top performers are
largely a function of uncertainty in estimating the parameter for relatively
uncommon product types rather than stellar historical performance. They
reflect the fact that we have relatively few observations of derivatives based
on wood products, for example, and so our model allows for the possibility
that out-of-sample wood products may show high trading volumes in the
future.
Major currencies, grains, precious metals, petroleum-related products,
and interest rates not derived from US treasuries define the middle of the pack
for expected year ten volumes. They are joined by a large group of product
types whose expected volumes are subject to great uncertainty, thanks to a
scarcity of data.
Among these average performers, plastics and chemicals may be promis-
ing niches for innovation. While their estimated expected volumes are subject
to considerable uncertainty, the data points we have indicate that they are
relatively strong performers.
On the low end of our expected year ten volume estimates are single-
stock futures7 and weather derivatives. Both are relatively new product
7This is consistent with figure 14 which shows OneChicago, the exchange specializingin single-stock futures as a relative under-performer in expected trading volume at yearten.
32

●
●
●
●
●
●
●
●
●
●
●
●
●
●
●
●
●
●
●
●
●
●
●
●
●
●
●
●
BASE METALS
CHEMICALS
CURRENCY
CURRENCY(NON−MAJOR)
DAIRY PRODUCTS
ELECTRICITY AND SOURCES
EMISSIONS
FIBER
FOODSTUFFS/SOFTS
Fertilizer
GRAINS
Interest Rates − U.S. Treasury
Interest Rates − non U.S. Treasury
LIVESTOCK/MEAT PRODUCTS
NARROW BASED INDICES
NATURAL GAS AND PRODUCTS
OILSEED and PRODUCTS
OTHER AGRICULTURAL
OTHER FINANCIAL INSTRUMENTS
PETROLEUM AND PRODUCTS
PLASTICS
PRECIOUS METALS
REAL ESTATE
SINGLE STOCK FUTURES
STOCK INDEX
WEATHER
WOOD PRODUCTS
Yield Insurance
1e+05 1e+07Expected volume after 10 years
Sub
grou
p
Fig. 17. Expected trading volume over ten years by product type
33
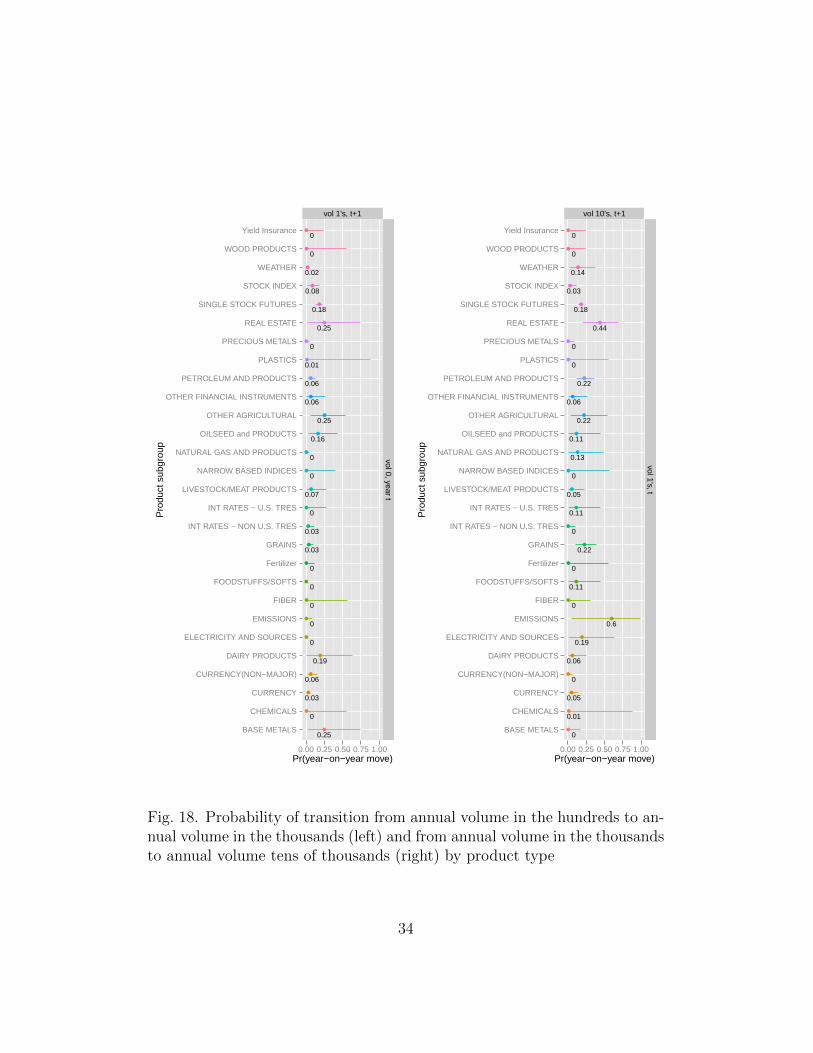
vol 1's, t+1
●
●
●
●
●
●
●
●
●
●
●
●
●
●
●
●
●
●
●
●
●
●
●
●
●
●
●
●
0.18
0
0.06
0.08
0.03
0
0
0
0
0
0
0.25
0.02
0
0.03
0.06
0.03
0
0.07
0.19
0.25
0.06
0.25
0
0.16
0
0.01
0
BASE METALS
CHEMICALS
CURRENCY
CURRENCY(NON−MAJOR)
DAIRY PRODUCTS
ELECTRICITY AND SOURCES
EMISSIONS
FIBER
FOODSTUFFS/SOFTS
Fertilizer
GRAINS
INT RATES − NON U.S. TRES
INT RATES − U.S. TRES
LIVESTOCK/MEAT PRODUCTS
NARROW BASED INDICES
NATURAL GAS AND PRODUCTS
OILSEED and PRODUCTS
OTHER AGRICULTURAL
OTHER FINANCIAL INSTRUMENTS
PETROLEUM AND PRODUCTS
PLASTICS
PRECIOUS METALS
REAL ESTATE
SINGLE STOCK FUTURES
STOCK INDEX
WEATHER
WOOD PRODUCTS
Yield Insurance
vol 0, year t
0.00 0.25 0.50 0.75 1.00Pr(year−on−year move)
Pro
duct
sub
grou
p
vol 10's, t+1
●
●
●
●
●
●
●
●
●
●
●
●
●
●
●
●
●
●
●
●
●
●
●
●
●
●
●
●
0.18
0.01
0.22
0.03
0
0.13
0.11
0.6
0
0.19
0
0
0.14
0
0.05
0
0.22
0.11
0.05
0.06
0.22
0.06
0.44
0
0.11
0
0
0
BASE METALS
CHEMICALS
CURRENCY
CURRENCY(NON−MAJOR)
DAIRY PRODUCTS
ELECTRICITY AND SOURCES
EMISSIONS
FIBER
FOODSTUFFS/SOFTS
Fertilizer
GRAINS
INT RATES − NON U.S. TRES
INT RATES − U.S. TRES
LIVESTOCK/MEAT PRODUCTS
NARROW BASED INDICES
NATURAL GAS AND PRODUCTS
OILSEED and PRODUCTS
OTHER AGRICULTURAL
OTHER FINANCIAL INSTRUMENTS
PETROLEUM AND PRODUCTS
PLASTICS
PRECIOUS METALS
REAL ESTATE
SINGLE STOCK FUTURES
STOCK INDEX
WEATHER
WOOD PRODUCTS
Yield Insurance
vol 1's, t
0.00 0.25 0.50 0.75 1.00Pr(year−on−year move)
Pro
duct
sub
grou
p
Fig. 18. Probability of transition from annual volume in the hundreds to an-nual volume in the thousands (left) and from annual volume in the thousandsto annual volume tens of thousands (right) by product type
34
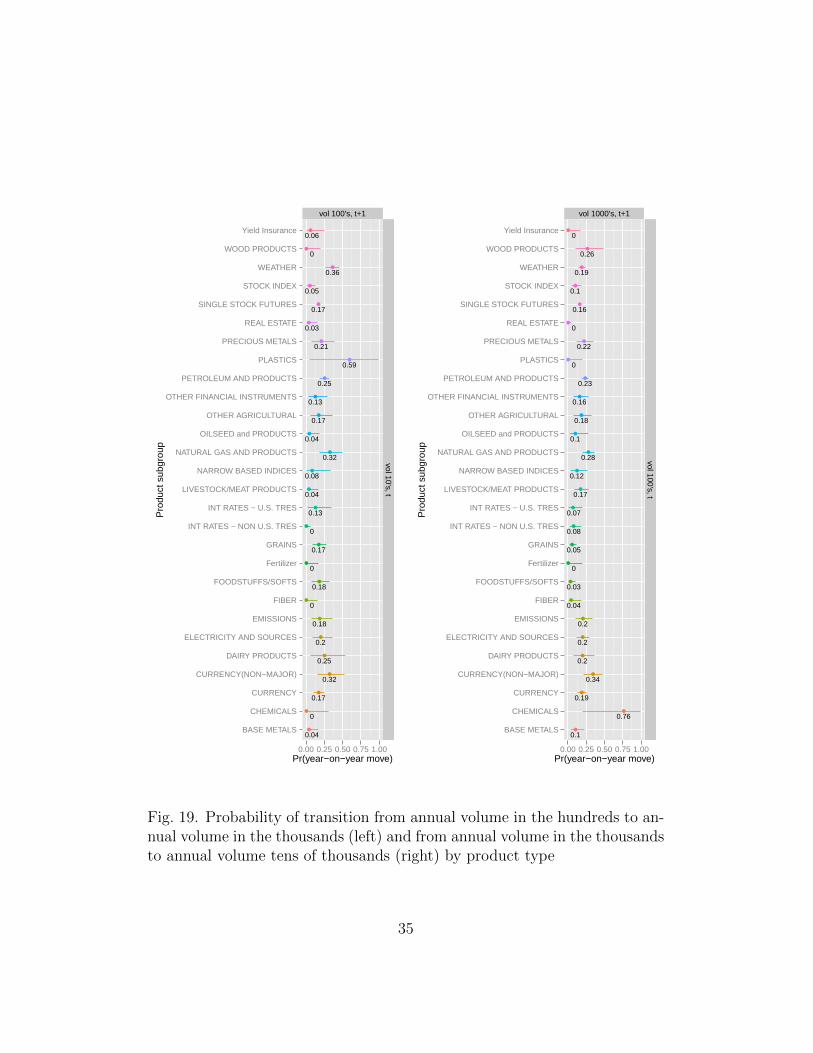
vol 100's, t+1
●
●
●
●
●
●
●
●
●
●
●
●
●
●
●
●
●
●
●
●
●
●
●
●
●
●
●
●
0.17
0
0.25
0.05
0
0.32
0.13
0.18
0.21
0.2
0.08
0.04
0.36
0
0.17
0.32
0.17
0.18
0.04
0.25
0.17
0.13
0.03
0
0.04
0
0.59
0.06
BASE METALS
CHEMICALS
CURRENCY
CURRENCY(NON−MAJOR)
DAIRY PRODUCTS
ELECTRICITY AND SOURCES
EMISSIONS
FIBER
FOODSTUFFS/SOFTS
Fertilizer
GRAINS
INT RATES − NON U.S. TRES
INT RATES − U.S. TRES
LIVESTOCK/MEAT PRODUCTS
NARROW BASED INDICES
NATURAL GAS AND PRODUCTS
OILSEED and PRODUCTS
OTHER AGRICULTURAL
OTHER FINANCIAL INSTRUMENTS
PETROLEUM AND PRODUCTS
PLASTICS
PRECIOUS METALS
REAL ESTATE
SINGLE STOCK FUTURES
STOCK INDEX
WEATHER
WOOD PRODUCTS
Yield Insurance
vol 10's, t
0.00 0.25 0.50 0.75 1.00Pr(year−on−year move)
Pro
duct
sub
grou
p
vol 1000's, t+1
●
●
●
●
●
●
●
●
●
●
●
●
●
●
●
●
●
●
●
●
●
●
●
●
●
●
●
●
0.16
0.76
0.23
0.1
0.08
0.28
0.07
0.2
0.22
0.2
0.12
0.1
0.19
0
0.19
0.34
0.05
0.03
0.17
0.2
0.18
0.16
0
0.04
0.1
0.26
0
0
BASE METALS
CHEMICALS
CURRENCY
CURRENCY(NON−MAJOR)
DAIRY PRODUCTS
ELECTRICITY AND SOURCES
EMISSIONS
FIBER
FOODSTUFFS/SOFTS
Fertilizer
GRAINS
INT RATES − NON U.S. TRES
INT RATES − U.S. TRES
LIVESTOCK/MEAT PRODUCTS
NARROW BASED INDICES
NATURAL GAS AND PRODUCTS
OILSEED and PRODUCTS
OTHER AGRICULTURAL
OTHER FINANCIAL INSTRUMENTS
PETROLEUM AND PRODUCTS
PLASTICS
PRECIOUS METALS
REAL ESTATE
SINGLE STOCK FUTURES
STOCK INDEX
WEATHER
WOOD PRODUCTS
Yield Insurance
vol 100's, t
0.00 0.25 0.50 0.75 1.00Pr(year−on−year move)
Pro
duct
sub
grou
p
Fig. 19. Probability of transition from annual volume in the hundreds to an-nual volume in the thousands (left) and from annual volume in the thousandsto annual volume tens of thousands (right) by product type
35

types with many correlated contracts launched in recent years. Interestingly,
these contract types appear to under-perform relative to some product types
like yield insurance and emissions in which trading was effectively smothered
by external events (the proliferation of subsidized crop insurance in the US in
the case of yield insurance and the failure of the US to consistently promote
cap-and-trade legislation in the case of emissions).
Interestingly, single-stock futures and weather derivatives were more likely
than most other product types to climb up from low levels of trading volume.
Figures 18 and 19 present the probability of any contract moving to higher
levels of annual trading volume for each product type in the sample. Single-
stock futures are particularly likely to recover from years of zero trading
volume and weather derivatives are particularly likely to move up to annual
trading volumes in the thousands. (See ??’s figures 25 and 26 for additional
details.) Insofar as these product types move fluidly up and down from
low levels of annual trading volumes they are representative of recent trends
across derivatives markets.
7. Conclusions
In this article we have presented a comprehensive analysis of trading
volumes for derivatives reported to exchanges in the United States. Looking
across decades, exchanges, and product types we see multiple trends that
challenge or significantly modify findings of existing studies.
While a larger percentage of contracts had little or no volume in any given
year of the 2000s, contracts did not fail at the high rates noted in previous
analyses. Instead, they remained at low levels of trading until they were
needed, transitioning back into active trading with greater probability than
in previous decades. Interestingly, this flexibility from low levels of trading
meant that the long term outlook for a new contract did not erode despite
remarkable levels of new contract innovation. During the 2000s the expected
36
volume of a new contract after ten years was above that of the 1990s and
within the range of previous decades. On balance, the explosion of innovation
catalyzed by electronic trading did not hurt the prospects for the marginal
contract.
We find that expected year ten trading volumes varied more decade to
decade than from exchange to exchange or product type to product type. In
particular, the lifecycle of a derivative on any given exchange was largely in-
distinguishable from that on any other, with the likely exception of OneChicago,
which specializes in single-stock futures.
We find evidence that the decadal changes in derivative lifecycles were
driven by the switch to electronic trading rather than the consolidation of
exchanges by looking at trends on the New York Mercantile Exchange. The
effects of electronic trading are difficult to separate from the the related in-
novation of cleared swaps. However, trends in NYMEX volumes following
the 2006 launch of widespread electronic trading tentatively support the hy-
pothesis that electronic trading is indeed driving recent trends in derivatives
lifecycles across all sampled markets.
7.1. The statistical characteristics of derivative volumes
In addition to facilitating quick distributional comparisons across various
contract groupings (decade, exchange, and product type), our framework
(Markov models) allows us to explore some basic questions about derivative
markets in general. For example, based on our Markov models it appears
that trading volumes do not follow a normal or log-normal random walk over
time. In figures 4 and 5 it is clear that the probability of remaining at a given
level of annual volume varies dramatically from one level to the next. These
differences hold with greater than 95 percent probability as do variations
in the volume dynamics across time (indicating that normal or log-normal
models of trading volume would suffer from stationarity problems as well).
Furthermore, switches to higher and lower levels of trading are often not
37

symmetric. In particular, an outright crash to zero trading volume appears
more likely than would be predicted by a symmetrically distributed random
walk.
However, our analysis does affirm the common observation that it is un-
usual for a contract to experience initial popularity and to crash subsequently
(Johnston and McConnell, 1989). After reaching a trading volume in the tens
of thousands, the probability that a contract will have annual trading volume
of zero in the subsequent year drops appreciably.
7.2. Optimal contract innovation
Much of the literature on derivative innovation focuses on the problem of
choosing the optimal derivatives contract to launch next. This analysis does
not directly address that question, but it does present some trends relevant
to previous theoretical work which could inform further investigation.
One interpretation of Duffie and Jackson (1989) provides that revenue
maximizing marginal innovations are uncorrelated with existing contracts.
However, recent trends suggest that one of the key assumptions underlying
this finding only holds weakly. Historically, correlated contract innovations
have not shown diminishing marginal volumes. In general, innovation in
derivatives markets has exploded in the last decade seemingly without drag-
ging down expected trading volumes at year ten. Indeed, some of the highest
volume product types (in expected volume terms) are highly correlated both
to other derivatives of their product category but also to the average returns
of the economy as a whole (US treasuries and stock indexes).
Tashjian and Weissman (1995) explains the proliferation of correlated
(and often redundant) contracts as a form of price discrimination. They as-
sume, that an exchange can charge higher fees on the transaction for parties
with larger and more concentrated exposure to a given underlying index.
This framework for understanding product innovation holds up well in light
of recent trends. As we have discussed, many recently launched contracts are
38

cleared swaps, which tend to be more specialized than conventional futures
or options. As Tashjian and Weissman (1995) predicted, exchanges charge a
substantial premium on these specialized transactions. Fees on CME’s Clear-
Port platform were more than 350 percent those on conventional electronic
futures trades as of late 2012 (CME Group, 2012). However, Tashjian and
Weissman (1995) suggested that exchanges would charge more for single-
asset-based derivatives (such as gold) than for derivatives that represented
the holding of multi-product firms (like the crack-spreads used to reproduce
petroleum refiners’ returns). In practice, cleared-swaps contracts, with their
relatively high fees, appear to be biased toward the latter.
A third explanation of recent patterns in derivative innovation is psycho-
logical. Based on Tversky, Kahneman, et al. (1981), Shiller (1994) suggests
that a hedge “appears more attractive when it’s presented as the elimination
of risk rather than when it is described as the reduction of risk.” This ten-
dency to overvalue hedges tailored to the needs of specific firms may explain
the proliferation of correlated contracts (and their relative success) above and
beyond the price discrimination suggested in Tashjian and Weissman (1995).
7.3. What kind of economic goods are derivatives?
The present analysis could also suggest new ways of understanding the
economic value of derivatives. If indeed derivatives are simply contingent
contracts that move cash flows across time and states of nature, then they
should derive all their value from the way that they mesh with hedger’s risk
preferences. It follows from that idea, that if risk preferences remain stable
over time, then derivative trading patterns should also remain stable.
But trading patterns have not been stable over the last decade. Instead,
they bear a striking qualitative resemblance to those of information goods,
particularly media:
• Each class of economic goods was, until recently, simple to classify:
normal goods with elastic demand and network effects.
39

• Starting a new derivatives market, just like producing a new music al-
bum or launching a magazine, was a high risk, high reward proposition.
• In the last decade both saw paradigm shifts in their marginal cost
structure (i.e. there were fundamental changes in supply).
• At the same time, new technologies allowed consumers ubiquitous ac-
cess to goods (i.e. there were also fundamental changes in demand).
• After those twin revolutions, markets:
- Rewarded specialty products more than in the past;
- Hosted blockbusters as large as/larger than ever;
- Did not offer the same opportunities for strong but less-than-
blockbuster products.
In media (and informational goods more generally) this transition has
upended many long-profitable business models and catalyzed a great deal of
innovation. In derivatives it has certainly opened up the door to many new
entrants like ICE, which now is one of two large futures exchanges in the US
today. But it is not clear whether those new entrants are using fundamentally
new business models.
How strong is the parallel? Should economists study derivatives along-
side informational goods? What does the possible connection suggest for
the future of derivatives? We believe that these questions provide a solid
foundation for future research.
References
Bank of International Settlements, 2012. Statistical release: OTC derivatives
statistics at end-june 2012.
Carlton, D., 1984. Futures markets: Their purpose, their history, their
growth, their successes and failures. Journal of Futures Markets 4, 237–271.
CME Group, 2012. Press release: CME Group volume averaged 11.9 million
40
contracts per day in september 2012, up 16 percent from august 2012.
Thanks to Silla Brush of Bloomberg for directing us to this press release.
Cuny, C., 1993. The role of liquidity in futures market innovations. Review
of Financial Studies 6, 57–78.
Duffie, D., 2012. Dark Markets: Asset Pricing and Information Transmission
in Over-the-Counter Markets. Princeton University Press.
Duffie, D., Jackson, M., 1989. Optimal innovation of futures contracts. Re-
view of Financial Studies 2, 275–296.
Gorham, M., Kundu, P., 2012. A half-century of product innovation and
competition at U.S. futures exchanges. The Review of Futures Markets 20,
105–140.
Gorham, M., Singh, N., 2009. Electronic Exchanges: The Global Transfor-
mation From Pits to Bits. Elsevier Science.
Holland, A., Fremault, A., 1997. Features of a successful contract: Financial
futures on LIFFE. Bank of England Quarterly Bulletin 37, 181–186.
ISDA Research Staff, NERA Economic Consulting, 2011. Costs and benefits
of mandatory electronic execution requirements for interest rate products.
Discussion Paper 2, International Swaps and Derivatives Association.
Johnston, E., McConnell, J., 1989. Requiem for a market: An analysis of the
rise and fall of a financial futures contract. Review of Financial Studies 2,
1–23.
Mello, A., Reilly, J., 2012. Margins, liquidity and the cost of hedging. Tech.
rep., MIT’s Center for Energy and Environmental Policy Research.
Olson, E. S., 2010. Zero-Sum Game: The Rise of the World’s Largest Deriva-
tives Exchange. Wiley.
41
Page, S., 2012. Model thinking: Markov models. Video lectures.
Plummer, M., 2003. JAGS: A Program For Analysis of Bayesian Graphical
Models Using Gibbs Sampling.
Plummer, M., 2013. rjags: Bayesian graphical models using MCMC. R pack-
age version 3-10.
Reuters News, 2003. NYMEX launches Cleaport electronic trading system.
Shiller, R., 1994. Macro Markets: Creating Institutions for Managing Soci-
ety’s Largest Economic Risks: Creating Institutions for Managing Society’s
Largest Economic Risks. Clarendon Press.
Silber, W., 1981. Innovation, competition, and new contract design in futures
markets. Journal of Futures Markets 1, 123–155.
Tashjian, E., Weissman, M., 1995. Advantages to competing with yourself:
Why an exchange might design futures contracts with correlated payoffs.
Journal of Financial Intermediation 4, 133–157.
Tversky, A., Kahneman, D., et al., 1981. The framing of decisions and the
psychology of choice. Science 211, 453–458.
42
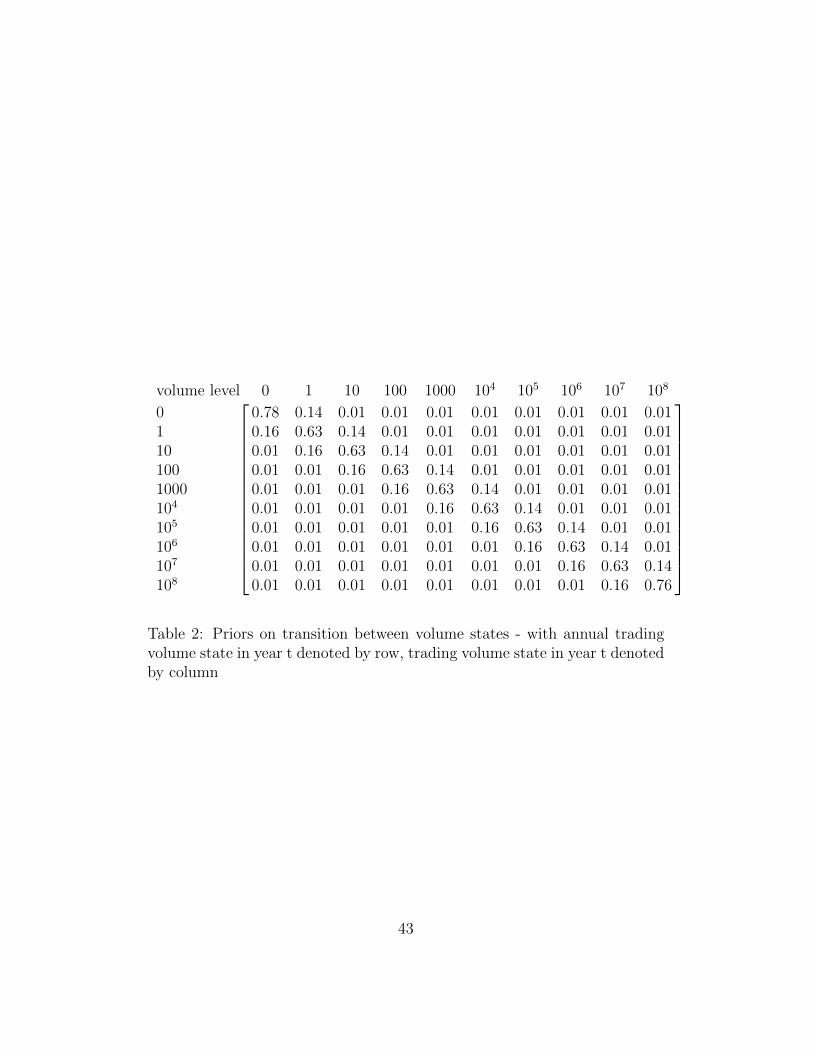
volume level 0 1 10 100 1000 104 105 106 107 108
0 0.78 0.14 0.01 0.01 0.01 0.01 0.01 0.01 0.01 0.011 0.16 0.63 0.14 0.01 0.01 0.01 0.01 0.01 0.01 0.0110 0.01 0.16 0.63 0.14 0.01 0.01 0.01 0.01 0.01 0.01100 0.01 0.01 0.16 0.63 0.14 0.01 0.01 0.01 0.01 0.011000 0.01 0.01 0.01 0.16 0.63 0.14 0.01 0.01 0.01 0.01104 0.01 0.01 0.01 0.01 0.16 0.63 0.14 0.01 0.01 0.01105 0.01 0.01 0.01 0.01 0.01 0.16 0.63 0.14 0.01 0.01106 0.01 0.01 0.01 0.01 0.01 0.01 0.16 0.63 0.14 0.01107 0.01 0.01 0.01 0.01 0.01 0.01 0.01 0.16 0.63 0.14108 0.01 0.01 0.01 0.01 0.01 0.01 0.01 0.01 0.16 0.76
Table 2: Priors on transition between volume states - with annual tradingvolume state in year t denoted by row, trading volume state in year t denotedby column
43
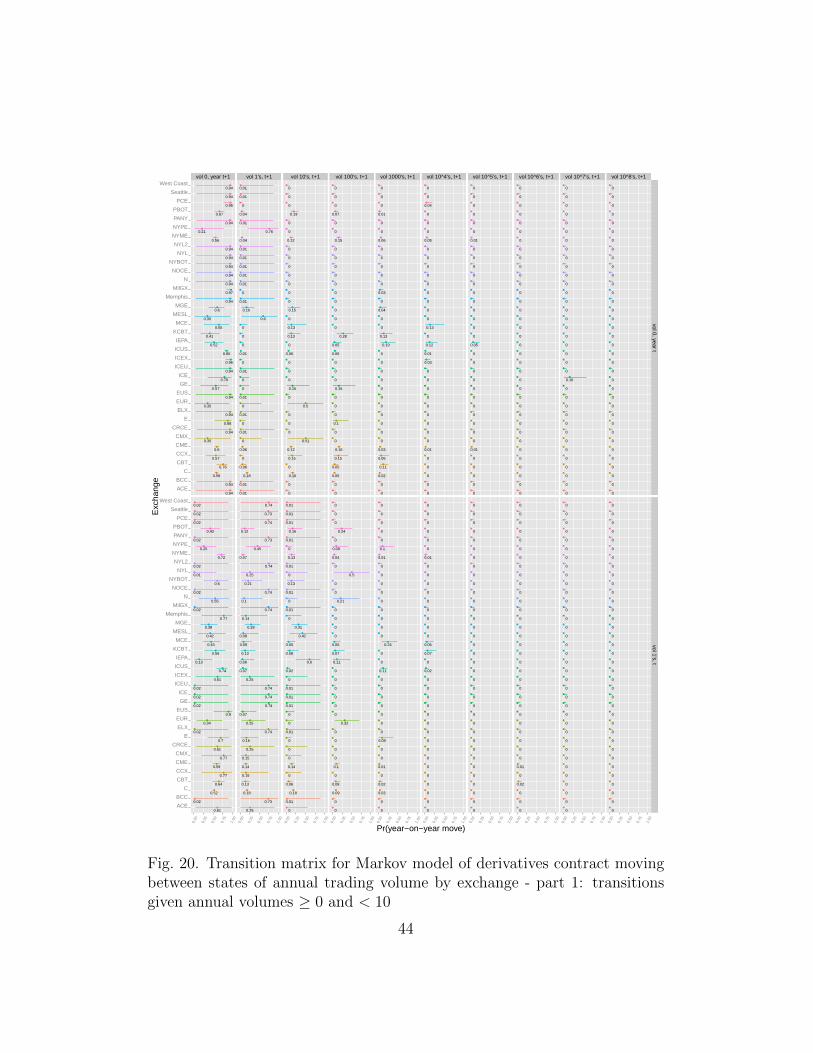
vol 0, year t+1 vol 1's, t+1 vol 10's, t+1 vol 100's, t+1 vol 1000's, t+1 vol 10^4's, t+1 vol 10^5's, t+1 vol 10^6's, t+1 vol 10^7's, t+1 vol 10^8's, t+1
●
●
●
●
●
●
●
●
●
●
●
●
●
●
●
●
●
●
●
●
●
●
●
●
●
●
●
●
●
●
●
●
●
●
●
●
0.59
0.56
0.52
0.94
0.94
0.76
0.94
0.6
0.85
0.94
0.94
0.94
0.65
0.67
0.79
0.35
0.57
0.6
0.35
0.57
0.88
0.94
0.41
0.35
0.94
0.94
0.94
0.96
0.97
0.95
0.94
0.94
0.21
0.94
0.94
0.94
●
●
●
●
●
●
●
●
●
●
●
●
●
●
●
●
●
●
●
●
●
●
●
●
●
●
●
●
●
●
●
●
●
●
●
●
0.52
0.72
0.13
0.55
0.9
0.64
0.01
0.59
0.74
0.02
0.02
0.02
0.45
0.43
0.02
0.77
0.02
0.38
0.34
0.77
0.7
0.02
0.56
0.42
0.02
0.61
0.6
0.61
0.02
0.02
0.61
0.02
0.25
0.02
0.77
0.02
●
●
●
●
●
●
●
●
●
●
●
●
●
●
●
●
●
●
●
●
●
●
●
●
●
●
●
●
●
●
●
●
●
●
●
●
0.18
0.04
0
0.01
0.01
0.06
0.01
0.06
0.01
0.01
0.01
0.01
0
0.04
0
0
0
0.16
0
0
0
0.01
0
0.6
0.01
0.01
0.01
0
0
0
0.01
0.01
0.76
0.01
0.01
0.01
●
●
●
●
●
●
●
●
●
●
●
●
●
●
●
●
●
●
●
●
●
●
●
●
●
●
●
●
●
●
●
●
●
●
●
●
0.18
0.07
0.06
0.1
0.07
0.13
0.25
0.14
0.07
0.74
0.73
0.74
0.09
0.12
0.74
0.15
0.74
0.28
0.25
0.15
0.16
0.74
0.13
0.08
0.73
0.25
0.21
0.25
0.74
0.74
0.25
0.74
0.45
0.74
0.14
0.73
●
●
●
●
●
●
●
●
●
●
●
●
●
●
●
●
●
●
●
●
●
●
●
●
●
●
●
●
●
●
●
●
●
●
●
●
0.16
0.12
0
0
0
0
0
0.12
0.06
0
0
0
0.13
0.19
0
0.51
0.16
0.15
0.5
0.15
0
0
0.13
0
0
0
0
0
0
0
0
0
0
0
0
0
●
●
●
●
●
●
●
●
●
●
●
●
●
●
●
●
●
●
●
●
●
●
●
●
●
●
●
●
●
●
●
●
●
●
●
●
0.18
0.13
0.6
0
0
0.06
0
0.14
0.02
0.01
0.01
0.01
0.05
0.16
0.01
0
0.01
0.31
0
0
0
0.01
0.08
0.42
0.01
0
0.13
0
0.01
0.01
0
0.01
0
0.01
0
0.01
●
●
●
●
●
●
●
●
●
●
●
●
●
●
●
●
●
●
●
●
●
●
●
●
●
●
●
●
●
●
●
●
●
●
●
●
0.05
0.15
0.05
0
0
0.05
0
0.16
0.06
0
0
0
0
0.07
0
0
0.16
0
0
0.15
0.1
0
0.28
0
0
0
0
0
0
0
0
0
0
0
0
0
●
●
●
●
●
●
●
●
●
●
●
●
●
●
●
●
●
●
●
●
●
●
●
●
●
●
●
●
●
●
●
●
●
●
●
●
0.09
0.04
0.11
0.21
0
0.08
0.5
0.1
0
0
0
0
0.05
0.24
0
0
0
0
0.32
0
0
0
0.07
0
0
0
0
0
0
0
0
0
0.09
0
0
0
●
●
●
●
●
●
●
●
●
●
●
●
●
●
●
●
●
●
●
●
●
●
●
●
●
●
●
●
●
●
●
●
●
●
●
●
0.02
0.06
0.19
0
0
0.11
0
0.03
0
0
0
0
0
0.01
0
0
0
0.04
0
0.06
0
0
0.13
0
0
0
0
0
0.03
0
0
0
0
0
0
0
●
●
●
●
●
●
●
●
●
●
●
●
●
●
●
●
●
●
●
●
●
●
●
●
●
●
●
●
●
●
●
●
●
●
●
●
0.03
0.01
0
0
0
0.02
0
0.01
0.11
0
0
0
0.24
0
0
0
0
0
0
0
0.09
0
0
0
0
0
0
0
0
0
0
0
0.1
0
0
0
●
●
●
●
●
●
●
●
●
●
●
●
●
●
●
●
●
●
●
●
●
●
●
●
●
●
●
●
●
●
●
●
●
●
●
●
0
0.05
0.12
0
0
0
0
0.01
0.01
0
0
0
0.13
0
0
0
0
0
0
0
0
0
0
0
0
0
0
0.03
0
0.04
0
0
0
0
0
0
●
●
●
●
●
●
●
●
●
●
●
●
●
●
●
●
●
●
●
●
●
●
●
●
●
●
●
●
●
●
●
●
●
●
●
●
0
0.01
0
0
0
0
0
0
0.02
0
0
0
0.05
0
0
0
0
0
0
0
0
0
0.07
0
0
0
0
0
0
0
0
0
0
0
0
0
●
●
●
●
●
●
●
●
●
●
●
●
●
●
●
●
●
●
●
●
●
●
●
●
●
●
●
●
●
●
●
●
●
●
●
●
0
0.01
0.05
0
0
0
0
0.01
0
0
0
0
0
0
0
0
0
0
0
0
0
0
0
0
0
0
0
0
0
0
0
0
0
0
0
0
●
●
●
●
●
●
●
●
●
●
●
●
●
●
●
●
●
●
●
●
●
●
●
●
●
●
●
●
●
●
●
●
●
●
●
●
0
0
0
0
0
0
0
0
0
0
0
0
0
0
0
0
0
0
0
0
0
0
0
0
0
0
0
0
0
0
0
0
0
0
0
0
●
●
●
●
●
●
●
●
●
●
●
●
●
●
●
●
●
●
●
●
●
●
●
●
●
●
●
●
●
●
●
●
●
●
●
●
0
0
0
0
0
0
0
0
0
0
0
0
0
0
0
0
0
0
0
0
0
0
0
0
0
0
0
0
0
0
0
0
0
0
0
0
●
●
●
●
●
●
●
●
●
●
●
●
●
●
●
●
●
●
●
●
●
●
●
●
●
●
●
●
●
●
●
●
●
●
●
●
0
0
0
0
0
0.02
0
0.01
0
0
0
0
0
0
0
0
0
0
0
0
0
0
0
0
0
0
0
0
0
0
0
0
0
0
0
0
●
●
●
●
●
●
●
●
●
●
●
●
●
●
●
●
●
●
●
●
●
●
●
●
●
●
●
●
●
●
●
●
●
●
●
●
0
0
0
0
0
0
0
0
0
0
0
0
0
0
0.16
0
0
0
0
0
0
0
0
0
0
0
0
0
0
0
0
0
0
0
0
0
●
●
●
●
●
●
●
●
●
●
●
●
●
●
●
●
●
●
●
●
●
●
●
●
●
●
●
●
●
●
●
●
●
●
●
●
0
0
0
0
0
0
0
0
0
0
0
0
0
0
0
0
0
0
0
0
0
0
0
0
0
0
0
0
0
0
0
0
0
0
0
0
●
●
●
●
●
●
●
●
●
●
●
●
●
●
●
●
●
●
●
●
●
●
●
●
●
●
●
●
●
●
●
●
●
●
●
●
0
0
0
0
0
0
0
0
0
0
0
0
0
0
0
0
0
0
0
0
0
0
0
0
0
0
0
0
0
0
0
0
0
0
0
0
●
●
●
●
●
●
●
●
●
●
●
●
●
●
●
●
●
●
●
●
●
●
●
●
●
●
●
●
●
●
●
●
●
●
●
●
0
0
0
0
0
0
0
0
0
0
0
0
0
0
0
0
0
0
0
0
0
0
0
0
0
0
0
0
0
0
0
0
0
0
0
0
ACE
BCC
C
CBT
CCX
CME
CMX
CRCE
E
ELX
EUR
EUS
GE
ICE
ICEU
ICEX
ICUS
IEPA
KCBT
MCE
MESL
MGE
Memphis
MilGX
N
NOCE
NYBOT
NYL
NYL2
NYME
NYPE
PANY
PBOT
PCE
Seattle
West Coast
ACE
BCC
C
CBT
CCX
CME
CMX
CRCE
E
ELX
EUR
EUS
GE
ICE
ICEU
ICEX
ICUS
IEPA
KCBT
MCE
MESL
MGE
Memphis
MilGX
N
NOCE
NYBOT
NYL
NYL2
NYME
NYPE
PANY
PBOT
PCE
Seattle
West Coast
vol 0, year tvol 1's, t
0.00
0.25
0.50
0.75
1.00
0.00
0.25
0.50
0.75
1.00
0.00
0.25
0.50
0.75
1.00
0.00
0.25
0.50
0.75
1.00
0.00
0.25
0.50
0.75
1.00
0.00
0.25
0.50
0.75
1.00
0.00
0.25
0.50
0.75
1.00
0.00
0.25
0.50
0.75
1.00
0.00
0.25
0.50
0.75
1.00
0.00
0.25
0.50
0.75
1.00
Pr(year−on−year move)
Exc
hang
e
Fig. 20. Transition matrix for Markov model of derivatives contract movingbetween states of annual trading volume by exchange - part 1: transitionsgiven annual volumes ≥ 0 and < 10
44

vol 0, year t+1 vol 1's, t+1 vol 10's, t+1 vol 100's, t+1 vol 1000's, t+1 vol 10^4's, t+1 vol 10^5's, t+1 vol 10^6's, t+1 vol 10^7's, t+1 vol 10^8's, t+1
●
●
●
●
●
●
●
●
●
●
●
●
●
●
●
●
●
●
●
●
●
●
●
●
●
●
●
●
●
●
●
●
●
●
●
●
0.4
0.39
0.19
0.81
0.7
0.56
0
0.39
0.45
0
0
0
0.41
0.45
0
0.16
0.56
0.58
0.26
0.48
0.62
0
0.58
0.62
0
0
0.54
0.3
0.3
0.58
0
0.79
0.44
0.3
0
0.5
●
●
●
●
●
●
●
●
●
●
●
●
●
●
●
●
●
●
●
●
●
●
●
●
●
●
●
●
●
●
●
●
●
●
●
●
0.14
0.23
0.12
0.55
0.64
0.33
0.3
0.25
0.27
0
0
0
0.15
0.19
0
0.28
0.41
0.13
0.09
0.35
0.29
0
0.14
0
0
0
0.19
0.16
0
0.58
0
0.42
0.14
0.16
0.3
0
●
●
●
●
●
●
●
●
●
●
●
●
●
●
●
●
●
●
●
●
●
●
●
●
●
●
●
●
●
●
●
●
●
●
●
●
0.14
0.04
0.08
0
0
0.15
0.02
0.08
0.04
0.02
0.02
0.02
0.09
0.08
0.02
0.08
0.1
0.13
0.29
0.03
0.15
0.02
0.05
0
0.02
0.02
0.13
0.36
0
0
0.02
0
0.22
0
0.36
0.01
●
●
●
●
●
●
●
●
●
●
●
●
●
●
●
●
●
●
●
●
●
●
●
●
●
●
●
●
●
●
●
●
●
●
●
●
0.06
0.01
0
0
0
0.02
0.3
0.03
0.06
0
0
0
0.08
0.04
0
0.05
0
0.05
0.09
0
0.1
0
0.14
0.51
0
0.5
0.07
0
0
0
0
0
0
0
0
0
●
●
●
●
●
●
●
●
●
●
●
●
●
●
●
●
●
●
●
●
●
●
●
●
●
●
●
●
●
●
●
●
●
●
●
●
0.22
0.25
0.26
0.02
0.22
0.19
0.73
0.21
0.14
0.74
0.74
0.74
0.16
0.3
0.74
0.13
0.28
0.04
0.36
0.22
0.11
0.74
0.13
0.08
0.74
0.74
0.23
0.15
0.43
0.36
0.74
0.11
0.28
0.15
0.56
0.25
●
●
●
●
●
●
●
●
●
●
●
●
●
●
●
●
●
●
●
●
●
●
●
●
●
●
●
●
●
●
●
●
●
●
●
●
0.21
0.11
0.08
0.08
0
0.27
0
0.12
0.13
0.02
0.02
0.02
0.09
0.19
0.02
0.14
0.08
0.3
0.25
0.09
0.3
0.01
0.34
0.01
0.02
0.01
0.19
0
0.19
0.13
0.02
0.13
0.31
0.19
0.36
0.61
●
●
●
●
●
●
●
●
●
●
●
●
●
●
●
●
●
●
●
●
●
●
●
●
●
●
●
●
●
●
●
●
●
●
●
●
0.17
0.23
0.24
0
0.05
0.08
0.01
0.25
0.16
0.01
0.01
0.01
0.09
0.16
0.01
0.18
0
0.19
0
0.2
0.07
0.01
0.21
0
0.01
0.01
0.06
0
0.23
0
0.01
0
0
0.35
0
0
●
●
●
●
●
●
●
●
●
●
●
●
●
●
●
●
●
●
●
●
●
●
●
●
●
●
●
●
●
●
●
●
●
●
●
●
0.38
0.4
0.41
0.11
0.29
0.18
0.15
0.42
0.36
0.74
0.74
0.74
0.37
0.28
0.74
0.17
0.29
0.39
0.31
0.29
0.2
0.25
0.28
0.25
0.74
0.25
0.52
0.03
0.81
0.05
0.74
0.05
0.35
0.53
0.15
0.25
●
●
●
●
●
●
●
●
●
●
●
●
●
●
●
●
●
●
●
●
●
●
●
●
●
●
●
●
●
●
●
●
●
●
●
●
0.06
0.06
0.19
0.04
0
0.01
0
0.05
0.11
0
0
0
0.03
0
0
0.36
0
0.02
0
0.03
0
0
0
0.16
0
0
0
0
0
0
0
0
0
0
0
0
●
●
●
●
●
●
●
●
●
●
●
●
●
●
●
●
●
●
●
●
●
●
●
●
●
●
●
●
●
●
●
●
●
●
●
●
0.16
0.21
0.39
0.17
0.04
0.14
0
0.17
0.11
0.01
0.01
0.01
0.22
0.19
0.01
0.21
0.16
0.05
0
0.21
0.05
0.6
0.03
0
0.01
0
0
0.75
0
0.13
0.01
0.13
0.15
0
0
0
●
●
●
●
●
●
●
●
●
●
●
●
●
●
●
●
●
●
●
●
●
●
●
●
●
●
●
●
●
●
●
●
●
●
●
●
0.01
0.02
0
0.09
0
0
0
0.01
0.04
0
0
0
0.17
0
0
0
0
0
0
0
0
0
0
0
0
0
0
0
0
0
0
0
0
0
0
0
●
●
●
●
●
●
●
●
●
●
●
●
●
●
●
●
●
●
●
●
●
●
●
●
●
●
●
●
●
●
●
●
●
●
●
●
0.04
0.03
0
0.07
0
0.02
0
0.01
0.04
0
0
0
0.06
0.07
0
0.05
0
0.05
0
0.05
0
0
0
0
0
0
0
0
0
0
0
0.11
0
0
0
0
●
●
●
●
●
●
●
●
●
●
●
●
●
●
●
●
●
●
●
●
●
●
●
●
●
●
●
●
●
●
●
●
●
●
●
●
0
0
0
0
0
0
0
0
0.02
0
0
0
0
0
0
0
0
0
0
0
0
0
0
0
0
0
0
0
0
0
0
0
0
0
0
0
●
●
●
●
●
●
●
●
●
●
●
●
●
●
●
●
●
●
●
●
●
●
●
●
●
●
●
●
●
●
●
●
●
●
●
●
0
0
0
0
0
0.01
0
0
0.02
0
0
0
0
0
0
0
0
0
0
0
0
0
0.03
0
0
0
0
0
0
0
0
0
0
0
0
0
●
●
●
●
●
●
●
●
●
●
●
●
●
●
●
●
●
●
●
●
●
●
●
●
●
●
●
●
●
●
●
●
●
●
●
●
0
0
0
0
0
0
0
0
0
0
0
0
0
0
0
0
0
0
0
0
0
0
0
0
0
0
0
0
0
0
0
0
0
0
0
0
●
●
●
●
●
●
●
●
●
●
●
●
●
●
●
●
●
●
●
●
●
●
●
●
●
●
●
●
●
●
●
●
●
●
●
●
0
0
0
0
0
0.01
0
0
0
0
0
0
0
0
0
0
0
0
0.1
0
0
0
0
0
0
0
0
0
0
0
0
0
0
0
0
0
●
●
●
●
●
●
●
●
●
●
●
●
●
●
●
●
●
●
●
●
●
●
●
●
●
●
●
●
●
●
●
●
●
●
●
●
0
0
0
0
0
0
0
0
0
0
0
0
0
0
0
0
0
0
0
0
0
0
0
0
0
0
0
0
0
0
0
0
0
0
0
0
●
●
●
●
●
●
●
●
●
●
●
●
●
●
●
●
●
●
●
●
●
●
●
●
●
●
●
●
●
●
●
●
●
●
●
●
0
0
0
0
0
0
0
0
0
0
0
0
0
0
0
0
0
0
0
0
0
0
0
0
0
0
0
0
0
0
0
0
0
0
0
0
●
●
●
●
●
●
●
●
●
●
●
●
●
●
●
●
●
●
●
●
●
●
●
●
●
●
●
●
●
●
●
●
●
●
●
●
0
0
0
0
0
0
0
0
0
0
0
0
0
0
0
0
0
0
0
0
0
0
0
0
0
0
0
0
0
0
0
0
0
0
0
0
●
●
●
●
●
●
●
●
●
●
●
●
●
●
●
●
●
●
●
●
●
●
●
●
●
●
●
●
●
●
●
●
●
●
●
●
0
0
0
0
0
0
0
0
0
0
0
0
0
0
0
0
0
0
0
0
0
0
0
0
0
0
0
0
0
0
0
0
0
0
0
0
ACE
BCC
C
CBT
CCX
CME
CMX
CRCE
E
ELX
EUR
EUS
GE
ICE
ICEU
ICEX
ICUS
IEPA
KCBT
MCE
MESL
MGE
Memphis
MilGX
N
NOCE
NYBOT
NYL
NYL2
NYME
NYPE
PANY
PBOT
PCE
Seattle
West Coast
ACE
BCC
C
CBT
CCX
CME
CMX
CRCE
E
ELX
EUR
EUS
GE
ICE
ICEU
ICEX
ICUS
IEPA
KCBT
MCE
MESL
MGE
Memphis
MilGX
N
NOCE
NYBOT
NYL
NYL2
NYME
NYPE
PANY
PBOT
PCE
Seattle
West Coast
vol 10's, tvol 100's, t
0.00
0.25
0.50
0.75
1.00
0.00
0.25
0.50
0.75
1.00
0.00
0.25
0.50
0.75
1.00
0.00
0.25
0.50
0.75
1.00
0.00
0.25
0.50
0.75
1.00
0.00
0.25
0.50
0.75
1.00
0.00
0.25
0.50
0.75
1.00
0.00
0.25
0.50
0.75
1.00
0.00
0.25
0.50
0.75
1.00
0.00
0.25
0.50
0.75
1.00
Pr(year−on−year move)
Exc
hang
e
Fig. 21. Transition matrix for Markov model of derivatives contract movingbetween states of annual trading volume by exchange - part 2: transitionsgiven annual volumes ≥ 10 and < 1, 000
45

vol 0, year t+1 vol 1's, t+1 vol 10's, t+1 vol 100's, t+1 vol 1000's, t+1 vol 10^4's, t+1 vol 10^5's, t+1 vol 10^6's, t+1 vol 10^7's, t+1 vol 10^8's, t+1
●
●
●
●
●
●
●
●
●
●
●
●
●
●
●
●
●
●
●
●
●
●
●
●
●
●
●
●
●
●
●
●
●
●
●
●
0.06
0.11
0.06
0.42
0.53
0.19
0.3
0.09
0.17
0
0
0
0.05
0.08
0
0.06
0
0.07
0.3
0.25
0.12
0
0.13
0
0.3
0
0.11
0.29
0.3
0
0.39
0.08
0.06
0
0
0
●
●
●
●
●
●
●
●
●
●
●
●
●
●
●
●
●
●
●
●
●
●
●
●
●
●
●
●
●
●
●
●
●
●
●
●
0.03
0.04
0.02
0.29
0.44
0.04
0
0.05
0.05
0
0
0
0.04
0
0
0.01
0
0.04
0.37
0
0
0
0.01
0
0
0
0
0
0
0.16
0
0.09
0
0
0
0
●
●
●
●
●
●
●
●
●
●
●
●
●
●
●
●
●
●
●
●
●
●
●
●
●
●
●
●
●
●
●
●
●
●
●
●
0.02
0
0
0.01
0
0.03
0
0.01
0.01
0
0
0
0.02
0
0
0
0
0
0
0.01
0
0
0
0
0
0
0
0
0
0
0.16
0
0
0
0.09
0
●
●
●
●
●
●
●
●
●
●
●
●
●
●
●
●
●
●
●
●
●
●
●
●
●
●
●
●
●
●
●
●
●
●
●
●
0
0
0
0
0
0
0
0
0
0
0
0
0
0
0
0
0
0
0
0
0
0
0
0
0
0
0
0
0
0
0
0
0
0
0
0
●
●
●
●
●
●
●
●
●
●
●
●
●
●
●
●
●
●
●
●
●
●
●
●
●
●
●
●
●
●
●
●
●
●
●
●
0.07
0.01
0
0.05
0.05
0.03
0
0.05
0.03
0
0
0
0.06
0.05
0
0.02
0.11
0.07
0
0.05
0.12
0
0.08
0.51
0
0
0.11
0.04
0
0.1
0
0.18
0.06
0
0
0
●
●
●
●
●
●
●
●
●
●
●
●
●
●
●
●
●
●
●
●
●
●
●
●
●
●
●
●
●
●
●
●
●
●
●
●
0.02
0.01
0
0
0
0.01
0
0.01
0
0
0
0
0.01
0
0
0
0
0
0
0
0
0
0
0
0
0
0
0
0
0
0
0
0
0
0
0
●
●
●
●
●
●
●
●
●
●
●
●
●
●
●
●
●
●
●
●
●
●
●
●
●
●
●
●
●
●
●
●
●
●
●
●
0.27
0.15
0.11
0.15
0.27
0.15
0.36
0.17
0.09
0.02
0.02
0.02
0.1
0.25
0.02
0.13
0.45
0.24
0
0.2
0.06
0
0.13
0.01
0
0.02
0.25
0.1
0
0.52
0
0
0.39
0.61
0.12
0.02
●
●
●
●
●
●
●
●
●
●
●
●
●
●
●
●
●
●
●
●
●
●
●
●
●
●
●
●
●
●
●
●
●
●
●
●
0.07
0.02
0
0.11
0
0.03
0
0.03
0.01
0
0
0
0.01
0.08
0
0.05
0.16
0
0
0.04
0.23
0
0
0
0
0
0
0
0
0
0
0.23
0
0
0
0
●
●
●
●
●
●
●
●
●
●
●
●
●
●
●
●
●
●
●
●
●
●
●
●
●
●
●
●
●
●
●
●
●
●
●
●
0.44
0.49
0.56
0.26
0.09
0.34
0.15
0.56
0.41
0.74
0.74
0.74
0.62
0.55
0.73
0.4
0.05
0.5
0.15
0.38
0.51
0.56
0.53
0.25
0.15
0.73
0.44
0.53
0.56
0.18
0.3
0.46
0.43
0.25
0.72
0.74
●
●
●
●
●
●
●
●
●
●
●
●
●
●
●
●
●
●
●
●
●
●
●
●
●
●
●
●
●
●
●
●
●
●
●
●
0.34
0.18
0.11
0.29
0.34
0.12
0.16
0.16
0.1
0
0
0.01
0.12
0.46
0.02
0.08
0
0.17
0
0.42
0.12
0
0.11
0.02
0.19
0.02
0.18
0.61
0.02
0.2
0.36
0
0.07
0.19
0.26
0.02
●
●
●
●
●
●
●
●
●
●
●
●
●
●
●
●
●
●
●
●
●
●
●
●
●
●
●
●
●
●
●
●
●
●
●
●
0.13
0.21
0.26
0.09
0
0.2
0
0.1
0.27
0.01
0.01
0.01
0.13
0.05
0.01
0.26
0.29
0.08
0
0.08
0.13
0
0.09
0
0.35
0.01
0.04
0
0
0.11
0
0.19
0
0
0
0.01
●
●
●
●
●
●
●
●
●
●
●
●
●
●
●
●
●
●
●
●
●
●
●
●
●
●
●
●
●
●
●
●
●
●
●
●
0.47
0.63
0.66
0.28
0.16
0.64
0.25
0.62
0.75
0.95
0.1
0.92
0.76
0.4
0.74
0.68
0.53
0.69
0.18
0.32
0.45
0.15
0.8
0.74
0.76
0.73
0.82
0.25
0.74
0.53
0.56
0.45
0.83
0.76
0.68
0.73
●
●
●
●
●
●
●
●
●
●
●
●
●
●
●
●
●
●
●
●
●
●
●
●
●
●
●
●
●
●
●
●
●
●
●
●
0
0.02
0.01
0.01
0
0.03
0
0.01
0.01
0
0
0
0.01
0
0
0.09
0
0
0.3
0
0
0.29
0
0
0
0
0
0
0
0
0
0
0
0
0
0
●
●
●
●
●
●
●
●
●
●
●
●
●
●
●
●
●
●
●
●
●
●
●
●
●
●
●
●
●
●
●
●
●
●
●
●
0.06
0.11
0.2
0
0
0.14
0.53
0.13
0.08
0
0.83
0
0.05
0
0.01
0.15
0.19
0.05
0.38
0.17
0.11
0.76
0.07
0.01
0
0.01
0
0
0.01
0
0
0.11
0.07
0
0
0.01
●
●
●
●
●
●
●
●
●
●
●
●
●
●
●
●
●
●
●
●
●
●
●
●
●
●
●
●
●
●
●
●
●
●
●
●
0
0
0
0
0
0.02
0
0.01
0
0
0
0
0
0
0
0
0
0
0
0
0
0
0
0
0
0
0
0
0
0
0
0
0
0
0
0
●
●
●
●
●
●
●
●
●
●
●
●
●
●
●
●
●
●
●
●
●
●
●
●
●
●
●
●
●
●
●
●
●
●
●
●
0
0
0
0
0
0.02
0
0
0
0
0
0
0
0
0
0
0
0.02
0
0
0
0
0
0
0
0
0
0
0
0
0
0
0
0
0
0
●
●
●
●
●
●
●
●
●
●
●
●
●
●
●
●
●
●
●
●
●
●
●
●
●
●
●
●
●
●
●
●
●
●
●
●
0
0
0
0
0
0
0
0
0
0
0
0
0
0
0
0
0
0
0
0
0
0
0
0
0
0
0
0
0
0
0
0
0
0
0
0
●
●
●
●
●
●
●
●
●
●
●
●
●
●
●
●
●
●
●
●
●
●
●
●
●
●
●
●
●
●
●
●
●
●
●
●
0
0
0
0
0
0
0
0
0
0
0
0
0
0
0
0
0
0
0
0
0
0
0
0
0
0
0
0
0
0
0
0
0
0
0
0
●
●
●
●
●
●
●
●
●
●
●
●
●
●
●
●
●
●
●
●
●
●
●
●
●
●
●
●
●
●
●
●
●
●
●
●
0
0
0
0
0
0
0
0
0
0
0
0
0
0
0
0
0
0
0
0
0
0
0
0
0
0
0
0
0
0
0
0
0
0
0
0
●
●
●
●
●
●
●
●
●
●
●
●
●
●
●
●
●
●
●
●
●
●
●
●
●
●
●
●
●
●
●
●
●
●
●
●
0
0
0
0
0
0
0
0
0
0
0
0
0
0
0
0
0
0
0
0
0
0
0
0
0
0
0
0
0
0
0
0
0
0
0
0
ACE
BCC
C
CBT
CCX
CME
CMX
CRCE
E
ELX
EUR
EUS
GE
ICE
ICEU
ICEX
ICUS
IEPA
KCBT
MCE
MESL
MGE
Memphis
MilGX
N
NOCE
NYBOT
NYL
NYL2
NYME
NYPE
PANY
PBOT
PCE
Seattle
West Coast
ACE
BCC
C
CBT
CCX
CME
CMX
CRCE
E
ELX
EUR
EUS
GE
ICE
ICEU
ICEX
ICUS
IEPA
KCBT
MCE
MESL
MGE
Memphis
MilGX
N
NOCE
NYBOT
NYL
NYL2
NYME
NYPE
PANY
PBOT
PCE
Seattle
West Coast
vol 1000's, tvol 10^4's, t
0.00
0.25
0.50
0.75
1.00
0.00
0.25
0.50
0.75
1.00
0.00
0.25
0.50
0.75
1.00
0.00
0.25
0.50
0.75
1.00
0.00
0.25
0.50
0.75
1.00
0.00
0.25
0.50
0.75
1.00
0.00
0.25
0.50
0.75
1.00
0.00
0.25
0.50
0.75
1.00
0.00
0.25
0.50
0.75
1.00
0.00
0.25
0.50
0.75
1.00
Pr(year−on−year move)
Exc
hang
e
Fig. 22. Transition matrix for Markov model of derivatives contract movingbetween states of annual trading volume by exchange - part 3: transitionsgiven annual volumes ≥ 1000 and < 10, 000
46

vol 0, year t+1 vol 1's, t+1 vol 10's, t+1 vol 100's, t+1 vol 1000's, t+1 vol 10^4's, t+1 vol 10^5's, t+1 vol 10^6's, t+1 vol 10^7's, t+1 vol 10^8's, t+1
●
●
●
●
●
●
●
●
●
●
●
●
●
●
●
●
●
●
●
●
●
●
●
●
●
●
●
●
●
●
●
●
●
●
●
●
0.01
0.01
0.01
0
0
0.02
0
0.01
0.01
0
0.42
0
0
0
0
0
0
0
0
0
0
0
0
0
0
0
0
0
0
0
0
0
0
0
0
0
●
●
●
●
●
●
●
●
●
●
●
●
●
●
●
●
●
●
●
●
●
●
●
●
●
●
●
●
●
●
●
●
●
●
●
●
0
0.01
0
0
0
0.01
0
0.01
0.01
0
0
0
0
0
0
0.01
0
0.03
0
0
0
0
0.02
0
0
0
0
0
0
0
0
0
0
0
0
0
●
●
●
●
●
●
●
●
●
●
●
●
●
●
●
●
●
●
●
●
●
●
●
●
●
●
●
●
●
●
●
●
●
●
●
●
0
0
0
0
0
0
0
0.01
0
0
0
0
0.01
0
0
0
0
0
0
0
0
0
0
0
0
0
0
0
0
0
0
0
0
0
0
0
●
●
●
●
●
●
●
●
●
●
●
●
●
●
●
●
●
●
●
●
●
●
●
●
●
●
●
●
●
●
●
●
●
●
●
●
0
0
0
0
0
0
0
0
0
0
0
0
0
0
0
0
0
0
0
0
0
0
0
0
0
0
0
0
0
0
0
0
0
0
0
0
●
●
●
●
●
●
●
●
●
●
●
●
●
●
●
●
●
●
●
●
●
●
●
●
●
●
●
●
●
●
●
●
●
●
●
●
0
0
0
0
0
0
0
0
0
0
0
0
0
0
0
0
0
0
0
0
0
0
0
0
0
0
0
0
0
0
0
0
0
0
0
0
●
●
●
●
●
●
●
●
●
●
●
●
●
●
●
●
●
●
●
●
●
●
●
●
●
●
●
●
●
●
●
●
●
●
●
●
0
0.01
0
0
0
0
0
0
0
0
0
0
0
0
0
0
0
0
0
0
0
0
0
0
0
0
0
0
0
0
0
0
0
0
0
0
●
●
●
●
●
●
●
●
●
●
●
●
●
●
●
●
●
●
●
●
●
●
●
●
●
●
●
●
●
●
●
●
●
●
●
●
0
0
0
0
0.11
0
0
0.01
0.01
0
0
0
0
0
0
0
0
0
0.07
0
0
0
0.02
0
0
0
0
0
0
0
0
0
0
0
0
0
●
●
●
●
●
●
●
●
●
●
●
●
●
●
●
●
●
●
●
●
●
●
●
●
●
●
●
●
●
●
●
●
●
●
●
●
0
0
0
0
0
0
0
0.01
0
0
0
0
0
0
0
0
0
0
0
0
0
0
0
0
0
0
0
0
0
0
0
0
0
0
0
0
●
●
●
●
●
●
●
●
●
●
●
●
●
●
●
●
●
●
●
●
●
●
●
●
●
●
●
●
●
●
●
●
●
●
●
●
0.05
0.01
0
0.5
0.11
0.02
0
0.01
0.02
0
0
0
0.03
0
0
0.02
0
0
0
0.13
0
0
0
0
0
0
0
0
0
0
0
0
0
0
0
0
●
●
●
●
●
●
●
●
●
●
●
●
●
●
●
●
●
●
●
●
●
●
●
●
●
●
●
●
●
●
●
●
●
●
●
●
0
0
0
0
0
0
0
0.01
0
0
0
0
0
0
0
0
0
0
0.06
0
0
0
0
0
0
0
0
0
0
0
0
0
0
0
0
0
●
●
●
●
●
●
●
●
●
●
●
●
●
●
●
●
●
●
●
●
●
●
●
●
●
●
●
●
●
●
●
●
●
●
●
●
0.43
0.22
0.12
0.01
0.44
0.06
0.16
0.07
0.14
0.01
0
0
0.09
0.02
0
0.1
0.01
0.03
0
0.34
0
0.25
0.12
0.02
0.02
0.02
0.16
0.02
0.02
0.02
0.02
0.6
0.61
0.36
0.02
0.02
●
●
●
●
●
●
●
●
●
●
●
●
●
●
●
●
●
●
●
●
●
●
●
●
●
●
●
●
●
●
●
●
●
●
●
●
0
0
0
0
0
0.02
0
0.01
0
0.05
0
0
0
0
0
0
0
0
0.14
0
0
0
0
0
0
0
0
0
0
0
0
0
0
0
0
0
●
●
●
●
●
●
●
●
●
●
●
●
●
●
●
●
●
●
●
●
●
●
●
●
●
●
●
●
●
●
●
●
●
●
●
●
0.5
0.7
0.76
0.25
0.21
0.81
0.38
0.8
0.76
0.25
0.52
0.95
0.82
0.74
0.25
0.7
0.91
0.9
0.41
0.43
0.56
0.1
0.75
0.74
0.74
0.74
0.8
0.73
0.73
0.74
0.73
0.25
0.25
0.55
0.74
0.73
●
●
●
●
●
●
●
●
●
●
●
●
●
●
●
●
●
●
●
●
●
●
●
●
●
●
●
●
●
●
●
●
●
●
●
●
0.02
0.19
0.11
0.02
0.77
0.08
0.39
0.04
0.06
0.29
0.02
0.36
0.15
0.02
0.16
0.04
0.02
0.07
0.15
0.02
0
0.01
0.04
0.02
0.02
0.02
0.02
0.02
0.02
0.02
0.02
0.02
0.02
0.02
0.02
0.02
●
●
●
●
●
●
●
●
●
●
●
●
●
●
●
●
●
●
●
●
●
●
●
●
●
●
●
●
●
●
●
●
●
●
●
●
0
0.05
0.12
0
0
0.09
0.42
0.1
0.06
0.59
0
0
0.03
0.01
0.73
0.17
0
0.06
0.47
0
0.35
0.54
0.09
0.01
0.01
0.01
0
0.01
0.01
0.01
0.01
0
0
0
0.01
0.01
●
●
●
●
●
●
●
●
●
●
●
●
●
●
●
●
●
●
●
●
●
●
●
●
●
●
●
●
●
●
●
●
●
●
●
●
0.74
0.72
0.87
0.73
0.15
0.8
0.59
0.89
0.92
0.62
0.73
0.56
0.83
0.74
0.82
0.9
0.73
0.88
0.51
0.74
0.76
0.25
0.93
0.73
0.74
0.73
0.74
0.73
0.74
0.73
0.74
0.74
0.73
0.74
0.73
0.73
●
●
●
●
●
●
●
●
●
●
●
●
●
●
●
●
●
●
●
●
●
●
●
●
●
●
●
●
●
●
●
●
●
●
●
●
0
0
0
0
0
0
0
0
0
0
0
0
0
0
0
0
0
0
0
0
0
0
0
0
0
0
0
0
0
0
0
0
0
0
0
0
●
●
●
●
●
●
●
●
●
●
●
●
●
●
●
●
●
●
●
●
●
●
●
●
●
●
●
●
●
●
●
●
●
●
●
●
0.01
0.07
0.01
0.01
0
0.08
0
0.04
0.01
0
0.01
0
0
0.01
0
0.05
0.01
0
0.07
0.01
0.19
0.6
0
0.01
0.01
0.01
0.01
0.01
0.01
0.01
0.01
0.01
0.01
0.01
0.01
0.01
●
●
●
●
●
●
●
●
●
●
●
●
●
●
●
●
●
●
●
●
●
●
●
●
●
●
●
●
●
●
●
●
●
●
●
●
0
0
0
0
0
0
0
0
0
0
0
0
0
0
0
0
0
0
0
0
0
0
0
0
0
0
0
0
0
0
0
0
0
0
0
0
●
●
●
●
●
●
●
●
●
●
●
●
●
●
●
●
●
●
●
●
●
●
●
●
●
●
●
●
●
●
●
●
●
●
●
●
0
0
0
0
0
0
0
0
0
0
0
0
0
0
0
0
0
0
0
0
0
0
0
0
0
0
0
0
0
0
0
0
0
0
0
0
ACE
BCC
C
CBT
CCX
CME
CMX
CRCE
E
ELX
EUR
EUS
GE
ICE
ICEU
ICEX
ICUS
IEPA
KCBT
MCE
MESL
MGE
Memphis
MilGX
N
NOCE
NYBOT
NYL
NYL2
NYME
NYPE
PANY
PBOT
PCE
Seattle
West Coast
ACE
BCC
C
CBT
CCX
CME
CMX
CRCE
E
ELX
EUR
EUS
GE
ICE
ICEU
ICEX
ICUS
IEPA
KCBT
MCE
MESL
MGE
Memphis
MilGX
N
NOCE
NYBOT
NYL
NYL2
NYME
NYPE
PANY
PBOT
PCE
Seattle
West Coast
vol 10^5's, tvol 10^6's, t
0.00
0.25
0.50
0.75
1.00
0.00
0.25
0.50
0.75
1.00
0.00
0.25
0.50
0.75
1.00
0.00
0.25
0.50
0.75
1.00
0.00
0.25
0.50
0.75
1.00
0.00
0.25
0.50
0.75
1.00
0.00
0.25
0.50
0.75
1.00
0.00
0.25
0.50
0.75
1.00
0.00
0.25
0.50
0.75
1.00
0.00
0.25
0.50
0.75
1.00
Pr(year−on−year move)
Exc
hang
e
Fig. 23. Transition matrix for Markov model of derivatives contract movingbetween states of annual trading volume by exchange - part 4: transitionsgiven annual volumes ≥ 10, 000 and < 1, 000, 000
47

vol 0, year t+1 vol 1's, t+1 vol 10's, t+1 vol 100's, t+1 vol 1000's, t+1 vol 10^4's, t+1 vol 10^5's, t+1 vol 10^6's, t+1 vol 10^7's, t+1 vol 10^8's, t+1
●
●
●
●
●
●
●
●
●
●
●
●
●
●
●
●
●
●
●
●
●
●
●
●
●
●
●
●
●
●
●
●
●
●
●
●
0
0
0
0
0
0.01
0
0.01
0
0
0
0
0
0
0
0
0
0
0
0
0
0
0
0
0
0
0
0
0
0
0
0
0
0
0
0
●
●
●
●
●
●
●
●
●
●
●
●
●
●
●
●
●
●
●
●
●
●
●
●
●
●
●
●
●
●
●
●
●
●
●
●
0
0
0
0
0
0
0
0
0
0
0
0
0
0
0
0
0
0
0
0
0
0
0
0
0
0
0
0
0
0
0
0
0
0
0
0
●
●
●
●
●
●
●
●
●
●
●
●
●
●
●
●
●
●
●
●
●
●
●
●
●
●
●
●
●
●
●
●
●
●
●
●
0
0
0
0
0
0
0
0
0
0
0
0
0
0
0
0
0
0
0
0
0
0
0
0
0
0
0
0
0
0
0
0
0
0
0
0
●
●
●
●
●
●
●
●
●
●
●
●
●
●
●
●
●
●
●
●
●
●
●
●
●
●
●
●
●
●
●
●
●
●
●
●
0
0
0
0
0
0
0
0
0
0
0
0
0
0
0
0
0
0
0
0
0
0
0
0
0
0
0
0
0
0
0
0
0
0
0
0
●
●
●
●
●
●
●
●
●
●
●
●
●
●
●
●
●
●
●
●
●
●
●
●
●
●
●
●
●
●
●
●
●
●
●
●
0
0
0
0
0
0
0
0
0
0
0
0
0
0
0
0
0
0
0
0
0
0
0
0
0
0
0
0
0
0
0
0
0
0
0
0
●
●
●
●
●
●
●
●
●
●
●
●
●
●
●
●
●
●
●
●
●
●
●
●
●
●
●
●
●
●
●
●
●
●
●
●
0
0
0
0
0
0
0
0
0
0
0
0
0
0
0
0
0
0
0
0
0
0
0
0
0
0
0
0
0
0
0
0
0
0
0
0
●
●
●
●
●
●
●
●
●
●
●
●
●
●
●
●
●
●
●
●
●
●
●
●
●
●
●
●
●
●
●
●
●
●
●
●
0
0
0
0
0
0
0
0
0
0
0
0
0
0
0
0
0
0
0
0
0
0
0
0
0
0
0
0
0
0
0
0
0
0
0
0
●
●
●
●
●
●
●
●
●
●
●
●
●
●
●
●
●
●
●
●
●
●
●
●
●
●
●
●
●
●
●
●
●
●
●
●
0
0
0
0
0
0
0
0
0
0
0
0
0
0
0
0
0
0
0
0
0
0
0
0
0
0
0
0
0
0
0
0
0
0
0
0
●
●
●
●
●
●
●
●
●
●
●
●
●
●
●
●
●
●
●
●
●
●
●
●
●
●
●
●
●
●
●
●
●
●
●
●
0
0
0
0
0
0
0
0
0
0
0
0
0
0
0
0
0
0
0
0
0
0
0
0
0
0
0
0
0
0
0
0
0
0
0
0
●
●
●
●
●
●
●
●
●
●
●
●
●
●
●
●
●
●
●
●
●
●
●
●
●
●
●
●
●
●
●
●
●
●
●
●
0
0
0
0
0
0
0
0
0
0
0
0
0
0
0
0
0
0
0
0
0
0
0
0
0
0
0
0
0
0
0
0
0
0
0
0
●
●
●
●
●
●
●
●
●
●
●
●
●
●
●
●
●
●
●
●
●
●
●
●
●
●
●
●
●
●
●
●
●
●
●
●
0
0
0
0
0
0
0
0
0
0
0
0
0
0
0
0
0
0
0.3
0
0
0
0
0
0
0
0
0
0
0
0
0
0
0
0
0
●
●
●
●
●
●
●
●
●
●
●
●
●
●
●
●
●
●
●
●
●
●
●
●
●
●
●
●
●
●
●
●
●
●
●
●
0
0
0
0
0
0
0
0
0
0
0
0
0
0
0
0
0
0
0
0
0
0
0
0
0
0
0
0
0
0
0
0
0
0
0
0
●
●
●
●
●
●
●
●
●
●
●
●
●
●
●
●
●
●
●
●
●
●
●
●
●
●
●
●
●
●
●
●
●
●
●
●
0
0
0
0
0
0
0
0
0
0
0
0
0
0
0
0
0
0
0
0
0
0
0
0
0
0
0
0
0
0
0
0
0
0
0
0
●
●
●
●
●
●
●
●
●
●
●
●
●
●
●
●
●
●
●
●
●
●
●
●
●
●
●
●
●
●
●
●
●
●
●
●
0
0
0
0
0
0
0
0
0
0
0
0
0
0
0
0
0
0
0
0
0
0
0
0
0
0
0
0
0
0
0
0
0
0
0
0
●
●
●
●
●
●
●
●
●
●
●
●
●
●
●
●
●
●
●
●
●
●
●
●
●
●
●
●
●
●
●
●
●
●
●
●
0.02
0.04
0.02
0.02
0.02
0.05
0.02
0.03
0
0.02
0.02
0.61
0.02
0.02
0.01
0.18
0.02
0.02
0
0.02
0.01
0
0.02
0.02
0.02
0.02
0.02
0.02
0.02
0.02
0.02
0.02
0.02
0.02
0.02
0.02
●
●
●
●
●
●
●
●
●
●
●
●
●
●
●
●
●
●
●
●
●
●
●
●
●
●
●
●
●
●
●
●
●
●
●
●
0
0
0
0
0
0
0
0
0
0
0
0
0
0
0
0
0
0
0
0
0
0
0
0
0
0
0
0
0
0
0
0
0
0
0
0
●
●
●
●
●
●
●
●
●
●
●
●
●
●
●
●
●
●
●
●
●
●
●
●
●
●
●
●
●
●
●
●
●
●
●
●
0.73
0.94
0.73
0.74
0.73
0.9
0.74
0.91
0.99
0.74
0.74
0.25
0.74
0.74
0.25
0.8
0.74
0.74
0.55
0.74
0.91
0.96
0.74
0.74
0.74
0.73
0.74
0.73
0.73
0.74
0.74
0.74
0.74
0.73
0.74
0.74
●
●
●
●
●
●
●
●
●
●
●
●
●
●
●
●
●
●
●
●
●
●
●
●
●
●
●
●
●
●
●
●
●
●
●
●
0.02
0
0
0.02
0.02
0.21
0.02
0.11
0.02
0.02
0.02
0.02
0.02
0.02
0
0.02
0.02
0.02
0.02
0.02
0.02
0.02
0.02
0.02
0.02
0.02
0.02
0.02
0.02
0.02
0.02
0.02
0.02
0.02
0.02
0.02
●
●
●
●
●
●
●
●
●
●
●
●
●
●
●
●
●
●
●
●
●
●
●
●
●
●
●
●
●
●
●
●
●
●
●
●
0.01
0.01
0.01
0.01
0.01
0.03
0.01
0.05
0
0.01
0.01
0
0.01
0.01
0.6
0
0.01
0.01
0
0.01
0
0
0.01
0.01
0.01
0.01
0.01
0.01
0.01
0.01
0.01
0.01
0.01
0.01
0.01
0.01
●
●
●
●
●
●
●
●
●
●
●
●
●
●
●
●
●
●
●
●
●
●
●
●
●
●
●
●
●
●
●
●
●
●
●
●
0.92
0.99
0.98
0.92
0.92
0.79
0.92
0.89
0.92
0.92
0.92
0.92
0.92
0.92
0.98
0.92
0.92
0.92
0.92
0.92
0.92
0.92
0.92
0.92
0.92
0.92
0.92
0.92
0.92
0.92
0.92
0.92
0.92
0.92
0.92
0.92
ACE
BCC
C
CBT
CCX
CME
CMX
CRCE
E
ELX
EUR
EUS
GE
ICE
ICEU
ICEX
ICUS
IEPA
KCBT
MCE
MESL
MGE
Memphis
MilGX
N
NOCE
NYBOT
NYL
NYL2
NYME
NYPE
PANY
PBOT
PCE
Seattle
West Coast
ACE
BCC
C
CBT
CCX
CME
CMX
CRCE
E
ELX
EUR
EUS
GE
ICE
ICEU
ICEX
ICUS
IEPA
KCBT
MCE
MESL
MGE
Memphis
MilGX
N
NOCE
NYBOT
NYL
NYL2
NYME
NYPE
PANY
PBOT
PCE
Seattle
West Coast
vol 10^7's, tvol 10^8's, t
0.00
0.25
0.50
0.75
1.00
0.00
0.25
0.50
0.75
1.00
0.00
0.25
0.50
0.75
1.00
0.00
0.25
0.50
0.75
1.00
0.00
0.25
0.50
0.75
1.00
0.00
0.25
0.50
0.75
1.00
0.00
0.25
0.50
0.75
1.00
0.00
0.25
0.50
0.75
1.00
0.00
0.25
0.50
0.75
1.00
0.00
0.25
0.50
0.75
1.00
Pr(year−on−year move)
Exc
hang
e
Fig. 24. Transition matrix for Markov model of derivatives contract movingbetween states of annual trading volume by exchange - part 5: transitionsgiven annual volumes ≥ 1, 000, 000
48
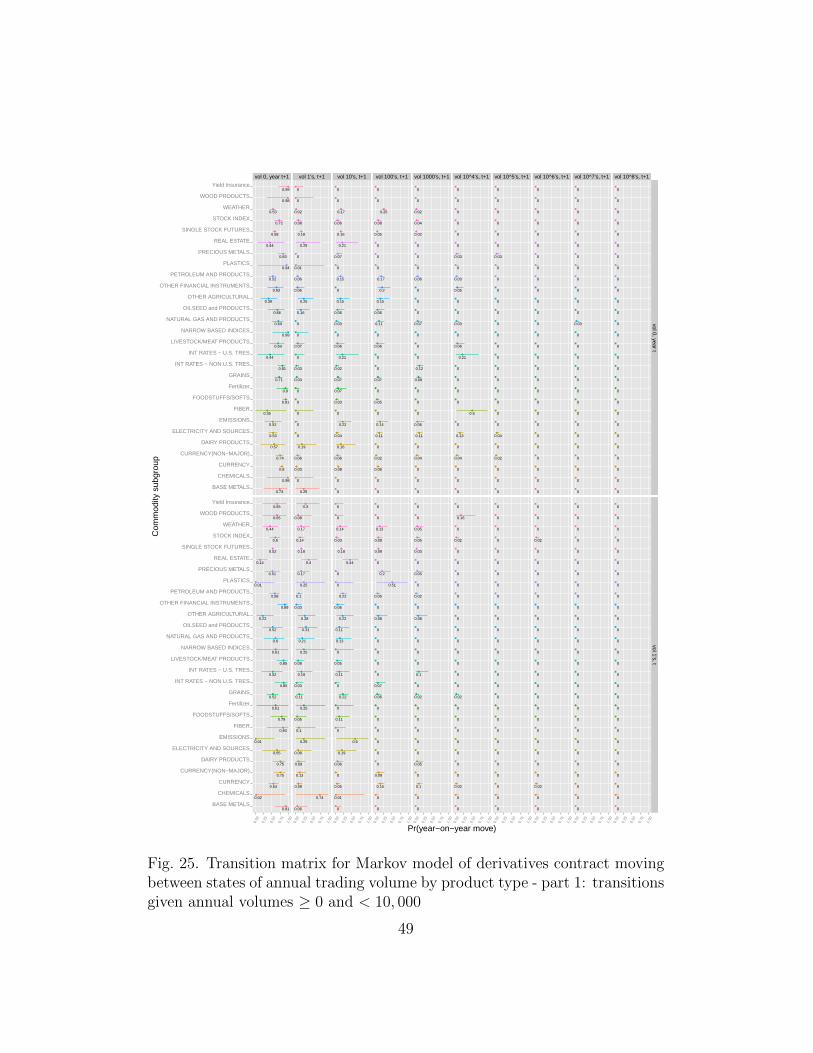
vol 0, year t+1 vol 1's, t+1 vol 10's, t+1 vol 100's, t+1 vol 1000's, t+1 vol 10^4's, t+1 vol 10^5's, t+1 vol 10^6's, t+1 vol 10^7's, t+1 vol 10^8's, t+1
●
●
●
●
●
●
●
●
●
●
●
●
●
●
●
●
●
●
●
●
●
●
●
●
●
●
●
●
0.58
0.98
0.52
0.72
0.81
0.69
0.44
0.52
0.83
0.53
0.99
0.73
0.53
0.9
0.8
0.74
0.71
0.91
0.69
0.57
0.39
0.63
0.44
0.35
0.66
0.98
0.94
0.99
●
●
●
●
●
●
●
●
●
●
●
●
●
●
●
●
●
●
●
●
●
●
●
●
●
●
●
●
0.52
0.02
0.58
0.6
0.85
0.6
0.52
0.01
0.51
0.65
0.61
0.91
0.44
0.61
0.54
0.75
0.52
0.79
0.85
0.75
0.22
0.89
0.14
0.84
0.52
0.65
0.01
0.65
●
●
●
●
●
●
●
●
●
●
●
●
●
●
●
●
●
●
●
●
●
●
●
●
●
●
●
●
0.18
0
0.06
0.08
0.03
0
0
0
0
0
0
0.25
0.02
0
0.03
0.06
0.03
0
0.07
0.19
0.25
0.06
0.25
0
0.16
0
0.01
0
●
●
●
●
●
●
●
●
●
●
●
●
●
●
●
●
●
●
●
●
●
●
●
●
●
●
●
●
0.18
0.74
0.1
0.14
0.03
0.21
0.18
0.25
0.17
0.08
0.25
0.06
0.17
0.25
0.09
0.13
0.11
0.05
0.08
0.09
0.28
0.03
0.4
0.1
0.31
0.08
0.25
0.3
●
●
●
●
●
●
●
●
●
●
●
●
●
●
●
●
●
●
●
●
●
●
●
●
●
●
●
●
0.16
0
0.15
0.06
0.02
0.03
0.21
0.22
0.07
0.04
0
0
0.17
0.07
0.08
0.06
0.07
0.03
0.06
0.16
0.15
0
0.21
0
0.06
0
0
0
●
●
●
●
●
●
●
●
●
●
●
●
●
●
●
●
●
●
●
●
●
●
●
●
●
●
●
●
0.18
0.01
0.22
0.03
0
0.13
0.11
0.6
0
0.19
0
0
0.14
0
0.05
0
0.22
0.11
0.05
0.06
0.22
0.06
0.44
0
0.11
0
0
0
●
●
●
●
●
●
●
●
●
●
●
●
●
●
●
●
●
●
●
●
●
●
●
●
●
●
●
●
0.05
0
0.17
0.08
0
0.11
0
0.14
0
0.11
0
0
0.25
0
0.08
0.02
0.07
0.05
0.06
0
0.15
0.2
0
0
0.06
0
0
0
●
●
●
●
●
●
●
●
●
●
●
●
●
●
●
●
●
●
●
●
●
●
●
●
●
●
●
●
0.09
0
0.06
0.09
0.07
0
0
0
0.2
0
0
0
0.13
0
0.15
0.09
0.06
0
0
0
0.08
0
0
0
0
0
0.51
0
●
●
●
●
●
●
●
●
●
●
●
●
●
●
●
●
●
●
●
●
●
●
●
●
●
●
●
●
0.02
0
0.06
0.04
0.12
0.07
0
0.06
0
0.11
0
0
0.02
0
0
0.04
0.09
0
0
0
0
0
0
0
0
0
0
0
●
●
●
●
●
●
●
●
●
●
●
●
●
●
●
●
●
●
●
●
●
●
●
●
●
●
●
●
0.03
0
0.02
0.05
0
0
0.1
0
0.05
0
0
0
0.05
0
0.1
0
0.02
0
0
0.05
0.08
0
0
0
0
0
0
0
●
●
●
●
●
●
●
●
●
●
●
●
●
●
●
●
●
●
●
●
●
●
●
●
●
●
●
●
0
0
0.03
0
0
0.03
0.21
0
0.03
0.13
0
0
0
0
0
0.04
0
0
0.06
0
0
0.05
0
0.5
0
0
0
0
●
●
●
●
●
●
●
●
●
●
●
●
●
●
●
●
●
●
●
●
●
●
●
●
●
●
●
●
0
0
0
0.02
0
0
0
0
0
0
0
0
0
0
0.02
0
0.02
0
0
0
0
0
0
0
0
0.16
0
0
●
●
●
●
●
●
●
●
●
●
●
●
●
●
●
●
●
●
●
●
●
●
●
●
●
●
●
●
0
0
0
0
0
0
0
0
0.03
0.04
0
0
0
0
0
0.02
0
0
0
0
0
0
0
0
0
0
0
0
●
●
●
●
●
●
●
●
●
●
●
●
●
●
●
●
●
●
●
●
●
●
●
●
●
●
●
●
0
0
0
0
0
0
0
0
0
0
0
0
0
0
0
0
0
0
0
0
0
0
0
0
0
0
0
0
●
●
●
●
●
●
●
●
●
●
●
●
●
●
●
●
●
●
●
●
●
●
●
●
●
●
●
●
0
0
0
0
0
0
0
0
0
0
0
0
0
0
0
0
0
0
0
0
0
0
0
0
0
0
0
0
●
●
●
●
●
●
●
●
●
●
●
●
●
●
●
●
●
●
●
●
●
●
●
●
●
●
●
●
0
0
0
0.02
0
0
0
0
0
0
0
0
0
0
0.02
0
0
0
0
0
0
0
0
0
0
0
0
0
●
●
●
●
●
●
●
●
●
●
●
●
●
●
●
●
●
●
●
●
●
●
●
●
●
●
●
●
0
0
0
0
0
0.03
0
0
0
0
0
0
0
0
0
0
0
0
0
0
0
0
0
0
0
0
0
0
●
●
●
●
●
●
●
●
●
●
●
●
●
●
●
●
●
●
●
●
●
●
●
●
●
●
●
●
0
0
0
0
0
0
0
0
0
0
0
0
0
0
0
0
0
0
0
0
0
0
0
0
0
0
0
0
●
●
●
●
●
●
●
●
●
●
●
●
●
●
●
●
●
●
●
●
●
●
●
●
●
●
●
●
0
0
0
0
0
0
0
0
0
0
0
0
0
0
0
0
0
0
0
0
0
0
0
0
0
0
0
0
●
●
●
●
●
●
●
●
●
●
●
●
●
●
●
●
●
●
●
●
●
●
●
●
●
●
●
●
0
0
0
0
0
0
0
0
0
0
0
0
0
0
0
0
0
0
0
0
0
0
0
0
0
0
0
0
BASE METALS
CHEMICALS
CURRENCY
CURRENCY(NON−MAJOR)
DAIRY PRODUCTS
ELECTRICITY AND SOURCES
EMISSIONS
FIBER
FOODSTUFFS/SOFTS
Fertilizer
GRAINS
INT RATES − NON U.S. TRES
INT RATES − U.S. TRES
LIVESTOCK/MEAT PRODUCTS
NARROW BASED INDICES
NATURAL GAS AND PRODUCTS
OILSEED and PRODUCTS
OTHER AGRICULTURAL
OTHER FINANCIAL INSTRUMENTS
PETROLEUM AND PRODUCTS
PLASTICS
PRECIOUS METALS
REAL ESTATE
SINGLE STOCK FUTURES
STOCK INDEX
WEATHER
WOOD PRODUCTS
Yield Insurance
vol 0, year tvol 1's, t
0.00
0.25
0.50
0.75
1.00
0.00
0.25
0.50
0.75
1.00
0.00
0.25
0.50
0.75
1.00
0.00
0.25
0.50
0.75
1.00
0.00
0.25
0.50
0.75
1.00
0.00
0.25
0.50
0.75
1.00
0.00
0.25
0.50
0.75
1.00
0.00
0.25
0.50
0.75
1.00
0.00
0.25
0.50
0.75
1.00
0.00
0.25
0.50
0.75
1.00
Pr(year−on−year move)
Com
mod
ity s
ubgr
oup
Fig. 25. Transition matrix for Markov model of derivatives contract movingbetween states of annual trading volume by product type - part 1: transitionsgiven annual volumes ≥ 0 and < 10, 000
49
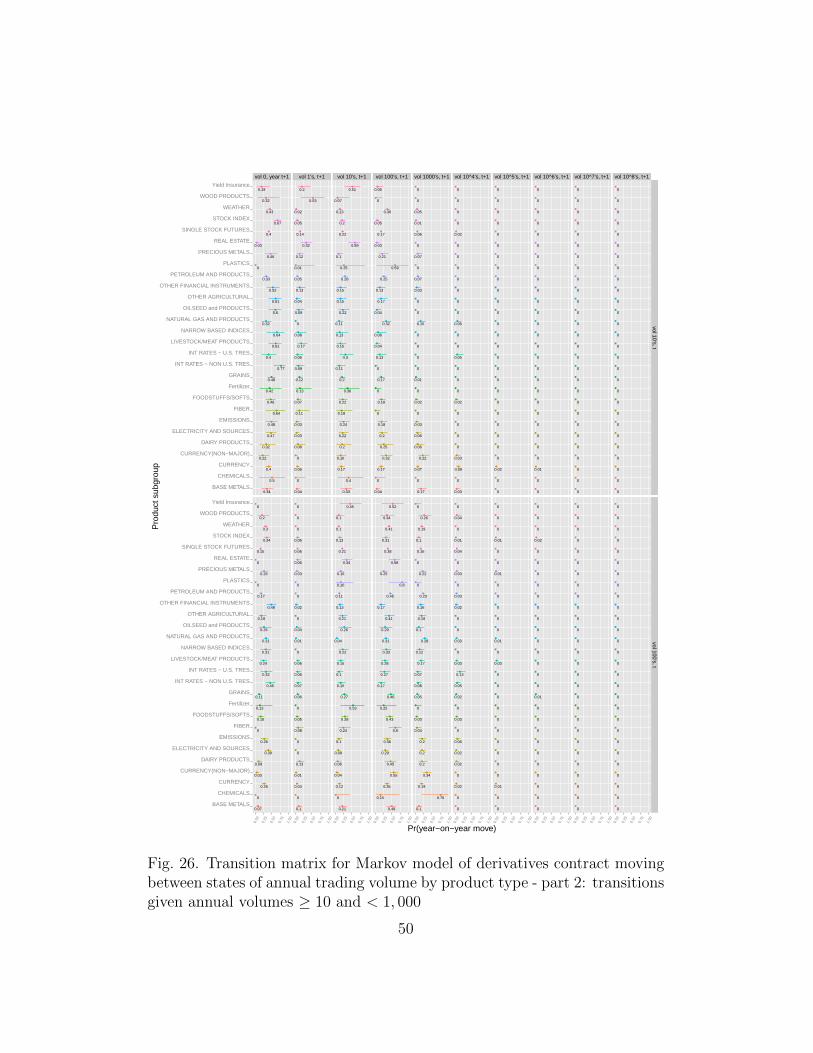
vol 0, year t+1 vol 1's, t+1 vol 10's, t+1 vol 100's, t+1 vol 1000's, t+1 vol 10^4's, t+1 vol 10^5's, t+1 vol 10^6's, t+1 vol 10^7's, t+1 vol 10^8's, t+1
●
●
●
●
●
●
●
●
●
●
●
●
●
●
●
●
●
●
●
●
●
●
●
●
●
●
●
●
0.4
0.5
0.33
0.67
0.77
0.32
0.4
0.48
0.46
0.47
0.64
0.34
0.43
0.42
0.4
0.22
0.48
0.46
0.61
0.32
0.61
0.52
0.03
0.64
0.6
0.32
0
0.19
●
●
●
●
●
●
●
●
●
●
●
●
●
●
●
●
●
●
●
●
●
●
●
●
●
●
●
●
0.15
0
0.17
0.34
0.45
0.31
0.32
0.26
0.26
0.39
0.31
0.07
0.3
0.13
0.26
0.03
0.11
0.15
0.24
0.09
0.18
0.48
0
0
0.26
0.2
0
0
●
●
●
●
●
●
●
●
●
●
●
●
●
●
●
●
●
●
●
●
●
●
●
●
●
●
●
●
0.14
0
0.05
0.05
0.09
0
0.06
0.03
0.12
0.03
0.08
0.04
0.02
0.13
0.06
0
0.12
0.07
0.17
0.08
0.04
0.13
0.32
0.11
0.09
0.53
0.01
0.2
●
●
●
●
●
●
●
●
●
●
●
●
●
●
●
●
●
●
●
●
●
●
●
●
●
●
●
●
0.06
0
0
0.06
0.07
0.01
0.06
0
0.03
0
0
0.1
0
0
0.04
0.01
0.06
0.05
0.06
0.13
0
0.02
0.06
0.08
0.04
0
0
0
●
●
●
●
●
●
●
●
●
●
●
●
●
●
●
●
●
●
●
●
●
●
●
●
●
●
●
●
0.22
0.4
0.28
0.2
0.11
0.11
0.3
0.24
0.1
0.22
0.13
0.33
0.13
0.36
0.17
0.16
0.2
0.22
0.15
0.2
0.15
0.15
0.59
0.18
0.22
0.07
0.25
0.51
●
●
●
●
●
●
●
●
●
●
●
●
●
●
●
●
●
●
●
●
●
●
●
●
●
●
●
●
0.21
0
0.11
0.13
0.15
0.04
0.1
0.1
0.16
0.09
0.22
0.21
0.1
0.53
0.12
0.04
0.27
0.28
0.15
0.06
0.21
0.13
0.34
0.24
0.26
0.1
0.16
0.45
●
●
●
●
●
●
●
●
●
●
●
●
●
●
●
●
●
●
●
●
●
●
●
●
●
●
●
●
0.17
0
0.25
0.05
0
0.32
0.13
0.18
0.21
0.2
0.08
0.04
0.36
0
0.17
0.32
0.17
0.18
0.04
0.25
0.17
0.13
0.03
0
0.04
0
0.59
0.06
●
●
●
●
●
●
●
●
●
●
●
●
●
●
●
●
●
●
●
●
●
●
●
●
●
●
●
●
0.38
0.15
0.45
0.31
0.17
0.31
0.27
0.36
0.25
0.29
0.33
0.49
0.41
0.25
0.35
0.55
0.46
0.43
0.28
0.45
0.41
0.17
0.58
0.6
0.29
0.34
0.8
0.52
●
●
●
●
●
●
●
●
●
●
●
●
●
●
●
●
●
●
●
●
●
●
●
●
●
●
●
●
0.06
0
0.07
0.01
0
0.15
0
0.03
0.07
0.06
0
0.17
0.05
0
0.07
0.22
0.01
0.02
0
0.06
0
0.03
0
0
0
0
0
0
●
●
●
●
●
●
●
●
●
●
●
●
●
●
●
●
●
●
●
●
●
●
●
●
●
●
●
●
0.16
0.76
0.23
0.1
0.08
0.28
0.07
0.2
0.22
0.2
0.12
0.1
0.19
0
0.19
0.34
0.05
0.03
0.17
0.2
0.18
0.16
0
0.04
0.1
0.26
0
0
●
●
●
●
●
●
●
●
●
●
●
●
●
●
●
●
●
●
●
●
●
●
●
●
●
●
●
●
0.02
0
0
0
0
0.06
0.05
0
0
0
0
0.03
0
0
0.09
0.03
0
0.02
0
0
0
0
0
0
0
0
0
0
●
●
●
●
●
●
●
●
●
●
●
●
●
●
●
●
●
●
●
●
●
●
●
●
●
●
●
●
0.04
0
0.03
0.01
0.05
0.03
0.13
0.06
0.03
0.02
0
0
0
0
0.02
0
0.02
0.03
0.03
0.02
0
0.02
0
0
0
0.04
0
0
●
●
●
●
●
●
●
●
●
●
●
●
●
●
●
●
●
●
●
●
●
●
●
●
●
●
●
●
0
0
0
0
0
0
0
0
0
0
0
0
0
0
0.02
0
0
0
0
0
0
0
0
0
0
0
0
0
●
●
●
●
●
●
●
●
●
●
●
●
●
●
●
●
●
●
●
●
●
●
●
●
●
●
●
●
0
0
0
0.01
0
0.01
0
0
0.01
0
0
0
0
0
0.01
0
0
0
0.03
0
0
0
0
0
0
0
0
0
●
●
●
●
●
●
●
●
●
●
●
●
●
●
●
●
●
●
●
●
●
●
●
●
●
●
●
●
0
0
0
0
0
0
0
0
0
0
0
0
0
0
0.01
0
0
0
0
0
0
0
0
0
0
0
0
0
●
●
●
●
●
●
●
●
●
●
●
●
●
●
●
●
●
●
●
●
●
●
●
●
●
●
●
●
0
0
0
0.02
0
0
0
0
0
0
0
0
0
0
0
0
0.01
0
0
0
0
0
0
0
0
0
0
0
●
●
●
●
●
●
●
●
●
●
●
●
●
●
●
●
●
●
●
●
●
●
●
●
●
●
●
●
0
0
0
0
0
0
0
0
0
0
0
0
0
0
0
0
0
0
0
0
0
0
0
0
0
0
0
0
●
●
●
●
●
●
●
●
●
●
●
●
●
●
●
●
●
●
●
●
●
●
●
●
●
●
●
●
0
0
0
0
0
0
0
0
0
0
0
0
0
0
0
0
0
0
0
0
0
0
0
0
0
0
0
0
●
●
●
●
●
●
●
●
●
●
●
●
●
●
●
●
●
●
●
●
●
●
●
●
●
●
●
●
0
0
0
0
0
0
0
0
0
0
0
0
0
0
0
0
0
0
0
0
0
0
0
0
0
0
0
0
●
●
●
●
●
●
●
●
●
●
●
●
●
●
●
●
●
●
●
●
●
●
●
●
●
●
●
●
0
0
0
0
0
0
0
0
0
0
0
0
0
0
0
0
0
0
0
0
0
0
0
0
0
0
0
0
BASE METALS
CHEMICALS
CURRENCY
CURRENCY(NON−MAJOR)
DAIRY PRODUCTS
ELECTRICITY AND SOURCES
EMISSIONS
FIBER
FOODSTUFFS/SOFTS
Fertilizer
GRAINS
INT RATES − NON U.S. TRES
INT RATES − U.S. TRES
LIVESTOCK/MEAT PRODUCTS
NARROW BASED INDICES
NATURAL GAS AND PRODUCTS
OILSEED and PRODUCTS
OTHER AGRICULTURAL
OTHER FINANCIAL INSTRUMENTS
PETROLEUM AND PRODUCTS
PLASTICS
PRECIOUS METALS
REAL ESTATE
SINGLE STOCK FUTURES
STOCK INDEX
WEATHER
WOOD PRODUCTS
Yield Insurance
vol 10's, tvol 100's, t
0.00
0.25
0.50
0.75
1.00
0.00
0.25
0.50
0.75
1.00
0.00
0.25
0.50
0.75
1.00
0.00
0.25
0.50
0.75
1.00
0.00
0.25
0.50
0.75
1.00
0.00
0.25
0.50
0.75
1.00
0.00
0.25
0.50
0.75
1.00
0.00
0.25
0.50
0.75
1.00
0.00
0.25
0.50
0.75
1.00
0.00
0.25
0.50
0.75
1.00
Pr(year−on−year move)
Pro
duct
sub
grou
p
Fig. 26. Transition matrix for Markov model of derivatives contract movingbetween states of annual trading volume by product type - part 2: transitionsgiven annual volumes ≥ 10 and < 1, 000
50
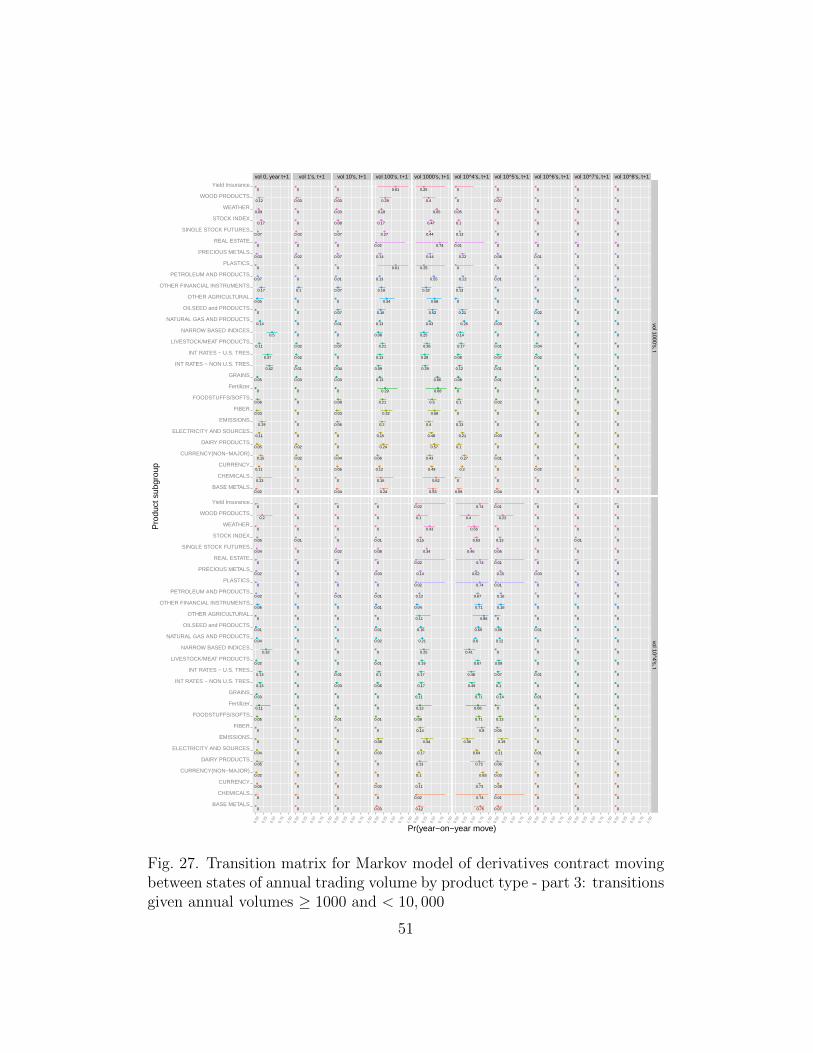
vol 0, year t+1 vol 1's, t+1 vol 10's, t+1 vol 100's, t+1 vol 1000's, t+1 vol 10^4's, t+1 vol 10^5's, t+1 vol 10^6's, t+1 vol 10^7's, t+1 vol 10^8's, t+1
●
●
●
●
●
●
●
●
●
●
●
●
●
●
●
●
●
●
●
●
●
●
●
●
●
●
●
●
0.07
0.13
0.07
0.17
0.42
0.14
0.37
0.19
0.03
0.11
0.5
0.02
0.09
0
0.11
0.15
0.05
0.06
0.11
0.05
0.05
0.17
0
0.03
0
0.12
0
0
●
●
●
●
●
●
●
●
●
●
●
●
●
●
●
●
●
●
●
●
●
●
●
●
●
●
●
●
0.04
0
0.02
0.05
0.13
0.04
0.13
0
0.02
0.04
0.32
0
0
0.11
0.05
0.02
0.03
0.05
0.02
0.05
0
0.06
0
0
0.01
0.2
0
0
●
●
●
●
●
●
●
●
●
●
●
●
●
●
●
●
●
●
●
●
●
●
●
●
●
●
●
●
0.02
0
0
0
0.01
0
0.02
0
0.02
0
0
0
0
0
0
0.02
0.03
0
0.02
0.02
0
0.1
0
0
0
0.03
0
0
●
●
●
●
●
●
●
●
●
●
●
●
●
●
●
●
●
●
●
●
●
●
●
●
●
●
●
●
0
0
0
0.01
0
0
0
0
0
0
0
0
0
0
0
0
0
0
0
0
0
0
0
0
0
0
0
0
●
●
●
●
●
●
●
●
●
●
●
●
●
●
●
●
●
●
●
●
●
●
●
●
●
●
●
●
0.07
0
0.01
0.08
0.04
0.01
0
0.06
0.07
0
0
0.04
0.03
0
0.06
0.04
0.03
0.08
0.07
0
0
0.07
0
0.03
0.07
0.03
0
0
●
●
●
●
●
●
●
●
●
●
●
●
●
●
●
●
●
●
●
●
●
●
●
●
●
●
●
●
0.02
0
0.01
0
0.03
0
0.01
0
0
0
0
0
0
0
0
0
0
0.01
0
0
0
0
0
0
0
0
0
0
●
●
●
●
●
●
●
●
●
●
●
●
●
●
●
●
●
●
●
●
●
●
●
●
●
●
●
●
0.27
0.16
0.13
0.17
0.09
0.13
0.13
0.2
0.14
0.15
0.08
0.24
0.18
0.29
0.12
0.06
0.13
0.21
0.21
0.24
0.34
0.18
0.02
0.32
0.16
0.29
0.61
0.61
●
●
●
●
●
●
●
●
●
●
●
●
●
●
●
●
●
●
●
●
●
●
●
●
●
●
●
●
0.08
0
0.01
0.01
0.06
0.02
0.1
0.08
0.03
0.03
0
0.03
0
0
0.02
0
0
0.01
0.01
0
0
0.01
0
0
0.01
0
0
0
●
●
●
●
●
●
●
●
●
●
●
●
●
●
●
●
●
●
●
●
●
●
●
●
●
●
●
●
0.44
0.62
0.55
0.47
0.29
0.43
0.28
0.4
0.44
0.48
0.25
0.53
0.65
0.68
0.49
0.43
0.66
0.5
0.35
0.57
0.58
0.32
0.74
0.58
0.52
0.4
0.25
0.25
●
●
●
●
●
●
●
●
●
●
●
●
●
●
●
●
●
●
●
●
●
●
●
●
●
●
●
●
0.34
0.02
0.12
0.15
0.17
0.21
0.17
0.34
0.14
0.17
0.25
0.12
0.43
0.13
0.11
0.1
0.11
0.08
0.19
0.13
0.11
0.04
0.02
0.14
0.16
0.1
0.02
0.02
●
●
●
●
●
●
●
●
●
●
●
●
●
●
●
●
●
●
●
●
●
●
●
●
●
●
●
●
0.13
0
0.22
0.1
0.12
0.26
0.08
0.13
0.22
0.21
0.14
0.09
0.05
0
0.2
0.27
0.08
0.1
0.17
0.1
0
0.13
0.01
0
0.21
0
0
0
●
●
●
●
●
●
●
●
●
●
●
●
●
●
●
●
●
●
●
●
●
●
●
●
●
●
●
●
0.46
0.74
0.67
0.63
0.49
0.6
0.48
0.36
0.62
0.64
0.41
0.75
0.56
0.68
0.73
0.83
0.71
0.71
0.67
0.72
0.86
0.71
0.74
0.8
0.69
0.4
0.74
0.74
●
●
●
●
●
●
●
●
●
●
●
●
●
●
●
●
●
●
●
●
●
●
●
●
●
●
●
●
0
0
0.01
0
0.01
0.03
0.07
0
0.06
0.03
0
0.04
0
0
0
0.01
0.01
0.02
0.01
0
0
0
0
0
0
0.07
0
0
●
●
●
●
●
●
●
●
●
●
●
●
●
●
●
●
●
●
●
●
●
●
●
●
●
●
●
●
0.06
0.01
0.16
0.13
0.1
0.12
0.07
0.19
0.15
0.11
0
0.07
0
0
0.08
0.03
0.14
0.13
0.09
0.06
0
0.16
0.01
0.05
0.09
0.22
0.01
0.01
●
●
●
●
●
●
●
●
●
●
●
●
●
●
●
●
●
●
●
●
●
●
●
●
●
●
●
●
0
0
0
0
0
0
0.02
0
0.01
0
0
0
0
0
0.02
0
0
0
0.04
0
0
0
0
0
0.02
0
0
0
●
●
●
●
●
●
●
●
●
●
●
●
●
●
●
●
●
●
●
●
●
●
●
●
●
●
●
●
0
0
0
0
0
0
0.01
0
0.03
0.01
0
0
0
0
0
0
0.01
0
0
0
0
0
0
0
0.01
0
0
0
●
●
●
●
●
●
●
●
●
●
●
●
●
●
●
●
●
●
●
●
●
●
●
●
●
●
●
●
0
0
0
0
0
0
0
0
0
0
0
0
0
0
0
0
0
0
0
0
0
0
0
0
0
0
0
0
●
●
●
●
●
●
●
●
●
●
●
●
●
●
●
●
●
●
●
●
●
●
●
●
●
●
●
●
0
0
0
0.01
0
0
0
0
0
0
0
0
0
0
0
0
0
0
0
0
0
0
0
0
0
0
0
0
●
●
●
●
●
●
●
●
●
●
●
●
●
●
●
●
●
●
●
●
●
●
●
●
●
●
●
●
0
0
0
0
0
0
0
0
0
0
0
0
0
0
0
0
0
0
0
0
0
0
0
0
0
0
0
0
●
●
●
●
●
●
●
●
●
●
●
●
●
●
●
●
●
●
●
●
●
●
●
●
●
●
●
●
0
0
0
0
0
0
0
0
0
0
0
0
0
0
0
0
0
0
0
0
0
0
0
0
0
0
0
0
BASE METALS
CHEMICALS
CURRENCY
CURRENCY(NON−MAJOR)
DAIRY PRODUCTS
ELECTRICITY AND SOURCES
EMISSIONS
FIBER
FOODSTUFFS/SOFTS
Fertilizer
GRAINS
INT RATES − NON U.S. TRES
INT RATES − U.S. TRES
LIVESTOCK/MEAT PRODUCTS
NARROW BASED INDICES
NATURAL GAS AND PRODUCTS
OILSEED and PRODUCTS
OTHER AGRICULTURAL
OTHER FINANCIAL INSTRUMENTS
PETROLEUM AND PRODUCTS
PLASTICS
PRECIOUS METALS
REAL ESTATE
SINGLE STOCK FUTURES
STOCK INDEX
WEATHER
WOOD PRODUCTS
Yield Insurance
vol 1000's, tvol 10^4's, t
0.00
0.25
0.50
0.75
1.00
0.00
0.25
0.50
0.75
1.00
0.00
0.25
0.50
0.75
1.00
0.00
0.25
0.50
0.75
1.00
0.00
0.25
0.50
0.75
1.00
0.00
0.25
0.50
0.75
1.00
0.00
0.25
0.50
0.75
1.00
0.00
0.25
0.50
0.75
1.00
0.00
0.25
0.50
0.75
1.00
0.00
0.25
0.50
0.75
1.00
Pr(year−on−year move)
Pro
duct
sub
grou
p
Fig. 27. Transition matrix for Markov model of derivatives contract movingbetween states of annual trading volume by product type - part 3: transitionsgiven annual volumes ≥ 1000 and < 10, 000
51

vol 0, year t+1 vol 1's, t+1 vol 10's, t+1 vol 100's, t+1 vol 1000's, t+1 vol 10^4's, t+1 vol 10^5's, t+1 vol 10^6's, t+1 vol 10^7's, t+1 vol 10^8's, t+1
●
●
●
●
●
●
●
●
●
●
●
●
●
●
●
●
●
●
●
●
●
●
●
●
●
●
●
●
0.01
0
0.01
0.04
0.02
0
0.07
0
0.02
0.01
0
0
0
0
0.01
0
0
0
0
0
0
0.01
0
0
0
0
0
0
●
●
●
●
●
●
●
●
●
●
●
●
●
●
●
●
●
●
●
●
●
●
●
●
●
●
●
●
0
0
0.01
0.01
0
0
0
0
0.02
0
0
0.02
0
0
0.01
0
0.02
0
0.01
0
0
0
0
0
0
0
0
0
●
●
●
●
●
●
●
●
●
●
●
●
●
●
●
●
●
●
●
●
●
●
●
●
●
●
●
●
0
0
0
0.01
0
0
0
0
0.01
0
0
0
0
0
0
0
0
0
0
0
0
0
0
0
0
0
0
0
●
●
●
●
●
●
●
●
●
●
●
●
●
●
●
●
●
●
●
●
●
●
●
●
●
●
●
●
0
0
0
0
0
0
0
0
0
0
0
0
0
0
0.01
0
0
0
0
0
0
0
0
0
0
0
0
0
●
●
●
●
●
●
●
●
●
●
●
●
●
●
●
●
●
●
●
●
●
●
●
●
●
●
●
●
0
0
0
0
0
0
0
0
0
0
0
0
0
0
0
0
0
0
0
0
0
0
0
0
0
0
0
0
●
●
●
●
●
●
●
●
●
●
●
●
●
●
●
●
●
●
●
●
●
●
●
●
●
●
●
●
0
0
0.01
0
0
0
0
0
0
0
0
0
0
0
0
0
0
0
0
0
0
0
0
0
0
0
0
0
●
●
●
●
●
●
●
●
●
●
●
●
●
●
●
●
●
●
●
●
●
●
●
●
●
●
●
●
0
0
0
0.02
0.01
0
0
0
0
0
0
0
0
0
0.01
0
0
0
0.01
0
0
0.01
0
0
0
0
0
0
●
●
●
●
●
●
●
●
●
●
●
●
●
●
●
●
●
●
●
●
●
●
●
●
●
●
●
●
0
0
0
0
0.02
0
0.01
0
0
0
0
0
0
0
0
0
0
0
0.01
0
0
0
0
0
0
0
0
0
●
●
●
●
●
●
●
●
●
●
●
●
●
●
●
●
●
●
●
●
●
●
●
●
●
●
●
●
0.06
0
0
0.02
0
0
0.08
0.11
0.05
0.03
0
0
0
0
0.03
0
0
0
0.01
0
0
0
0
0
0
0.02
0
0
●
●
●
●
●
●
●
●
●
●
●
●
●
●
●
●
●
●
●
●
●
●
●
●
●
●
●
●
0
0
0
0
0.02
0
0
0
0
0
0
0
0
0
0.02
0
0
0
0.01
0
0
0
0
0
0.01
0
0
0
●
●
●
●
●
●
●
●
●
●
●
●
●
●
●
●
●
●
●
●
●
●
●
●
●
●
●
●
0.42
0.02
0.18
0.12
0.05
0.21
0.16
0.29
0.11
0.23
0.02
0.16
0.02
0.02
0.15
0.17
0.05
0.08
0.06
0
0.02
0.05
0.02
0.16
0.02
0.05
0.02
0.02
●
●
●
●
●
●
●
●
●
●
●
●
●
●
●
●
●
●
●
●
●
●
●
●
●
●
●
●
0
0
0
0.02
0.04
0
0.01
0
0.03
0
0
0
0
0
0.01
0
0
0
0
0
0
0
0
0
0.01
0
0
0
●
●
●
●
●
●
●
●
●
●
●
●
●
●
●
●
●
●
●
●
●
●
●
●
●
●
●
●
0.5
0.73
0.75
0.64
0.69
0.69
0.54
0.52
0.69
0.61
0.74
0.56
0.74
0.73
0.71
0.73
0.91
0.86
0.85
0.99
0.74
0.87
0.74
0.65
0.82
0.92
0.74
0.74
●
●
●
●
●
●
●
●
●
●
●
●
●
●
●
●
●
●
●
●
●
●
●
●
●
●
●
●
0.02
0.02
0.03
0.08
0.26
0.18
0.11
0.02
0.13
0.24
0.02
0.03
0.02
0.02
0.02
0
0.04
0.06
0.02
0.02
0.02
0
0.02
0.06
0.1
0.02
0.02
0.02
●
●
●
●
●
●
●
●
●
●
●
●
●
●
●
●
●
●
●
●
●
●
●
●
●
●
●
●
0
0.01
0.06
0.14
0.21
0.09
0.12
0
0.11
0.12
0.01
0.25
0.01
0.01
0.07
0.08
0.03
0.05
0.06
0
0.01
0.03
0.01
0.16
0.16
0
0.01
0.01
●
●
●
●
●
●
●
●
●
●
●
●
●
●
●
●
●
●
●
●
●
●
●
●
●
●
●
●
0.74
0.74
0.8
0.81
0.6
0.78
0.8
0.73
0.78
0.76
0.73
0.91
0.74
0.74
0.88
0.99
0.89
0.92
0.94
0.74
0.74
0.91
0.74
0.94
0.81
0.74
0.73
0.74
●
●
●
●
●
●
●
●
●
●
●
●
●
●
●
●
●
●
●
●
●
●
●
●
●
●
●
●
0
0
0
0.01
0
0
0.01
0
0
0
0
0
0
0
0
0
0
0
0
0
0
0
0
0
0
0
0
0
●
●
●
●
●
●
●
●
●
●
●
●
●
●
●
●
●
●
●
●
●
●
●
●
●
●
●
●
0.01
0.01
0.13
0.06
0.04
0.04
0.06
0.01
0.04
0
0.01
0.02
0.01
0.01
0.06
0
0.04
0.01
0.01
0.01
0.01
0.07
0.01
0
0.06
0.01
0.01
0.01
●
●
●
●
●
●
●
●
●
●
●
●
●
●
●
●
●
●
●
●
●
●
●
●
●
●
●
●
0
0
0
0
0
0
0
0
0
0
0
0
0
0
0
0
0
0
0
0
0
0
0
0
0
0
0
0
●
●
●
●
●
●
●
●
●
●
●
●
●
●
●
●
●
●
●
●
●
●
●
●
●
●
●
●
0
0
0
0
0
0
0
0
0
0
0
0
0
0
0
0
0
0
0
0
0
0
0
0
0
0
0
0
BASE METALS
CHEMICALS
CURRENCY
CURRENCY(NON−MAJOR)
DAIRY PRODUCTS
ELECTRICITY AND SOURCES
EMISSIONS
FIBER
FOODSTUFFS/SOFTS
Fertilizer
GRAINS
INT RATES − NON U.S. TRES
INT RATES − U.S. TRES
LIVESTOCK/MEAT PRODUCTS
NARROW BASED INDICES
NATURAL GAS AND PRODUCTS
OILSEED and PRODUCTS
OTHER AGRICULTURAL
OTHER FINANCIAL INSTRUMENTS
PETROLEUM AND PRODUCTS
PLASTICS
PRECIOUS METALS
REAL ESTATE
SINGLE STOCK FUTURES
STOCK INDEX
WEATHER
WOOD PRODUCTS
Yield Insurance
vol 10^5's, tvol 10^6's, t
0.00
0.25
0.50
0.75
1.00
0.00
0.25
0.50
0.75
1.00
0.00
0.25
0.50
0.75
1.00
0.00
0.25
0.50
0.75
1.00
0.00
0.25
0.50
0.75
1.00
0.00
0.25
0.50
0.75
1.00
0.00
0.25
0.50
0.75
1.00
0.00
0.25
0.50
0.75
1.00
0.00
0.25
0.50
0.75
1.00
0.00
0.25
0.50
0.75
1.00
Pr(year−on−year move)
Pro
duct
sub
grou
p
Fig. 28. Transition matrix for Markov model of derivatives contract movingbetween states of annual trading volume by product type - part 4: transitionsgiven annual volumes ≥ 10, 000 and < 1, 000, 000
52

vol 0, year t+1 vol 1's, t+1 vol 10's, t+1 vol 100's, t+1 vol 1000's, t+1 vol 10^4's, t+1 vol 10^5's, t+1 vol 10^6's, t+1 vol 10^7's, t+1 vol 10^8's, t+1
●
●
●
●
●
●
●
●
●
●
●
●
●
●
●
●
●
●
●
●
●
●
●
●
●
●
●
●
0
0
0
0.01
0
0
0
0
0
0
0
0
0
0
0
0
0.03
0
0
0
0
0
0
0
0.01
0
0
0
●
●
●
●
●
●
●
●
●
●
●
●
●
●
●
●
●
●
●
●
●
●
●
●
●
●
●
●
0
0
0
0
0
0
0
0
0
0
0
0
0
0
0
0
0
0
0
0
0
0
0
0
0
0
0
0
●
●
●
●
●
●
●
●
●
●
●
●
●
●
●
●
●
●
●
●
●
●
●
●
●
●
●
●
0
0
0
0
0
0
0
0
0
0
0
0
0
0
0
0
0
0
0
0
0
0
0
0
0
0
0
0
●
●
●
●
●
●
●
●
●
●
●
●
●
●
●
●
●
●
●
●
●
●
●
●
●
●
●
●
0
0
0
0
0
0
0
0
0
0
0
0
0
0
0
0
0
0
0
0
0
0
0
0
0
0
0
0
●
●
●
●
●
●
●
●
●
●
●
●
●
●
●
●
●
●
●
●
●
●
●
●
●
●
●
●
0
0
0
0
0
0
0
0
0
0
0
0
0
0
0
0
0
0
0
0
0
0
0
0
0
0
0
0
●
●
●
●
●
●
●
●
●
●
●
●
●
●
●
●
●
●
●
●
●
●
●
●
●
●
●
●
0
0
0
0
0
0
0
0
0
0
0
0
0
0
0
0
0
0
0
0
0
0
0
0
0
0
0
0
●
●
●
●
●
●
●
●
●
●
●
●
●
●
●
●
●
●
●
●
●
●
●
●
●
●
●
●
0
0
0
0
0
0
0.01
0
0
0
0
0
0
0
0
0
0
0
0
0
0
0
0
0
0
0
0
0
●
●
●
●
●
●
●
●
●
●
●
●
●
●
●
●
●
●
●
●
●
●
●
●
●
●
●
●
0
0
0
0
0
0
0
0
0
0
0
0
0
0
0
0
0
0
0
0
0
0
0
0
0
0
0
0
●
●
●
●
●
●
●
●
●
●
●
●
●
●
●
●
●
●
●
●
●
●
●
●
●
●
●
●
0
0
0
0
0
0
0
0
0
0
0
0
0
0
0
0
0
0
0
0
0
0
0
0
0
0
0
0
●
●
●
●
●
●
●
●
●
●
●
●
●
●
●
●
●
●
●
●
●
●
●
●
●
●
●
●
0
0
0
0
0
0
0
0
0
0
0
0
0
0
0
0
0
0
0
0
0
0
0
0
0
0
0
0
●
●
●
●
●
●
●
●
●
●
●
●
●
●
●
●
●
●
●
●
●
●
●
●
●
●
●
●
0
0
0
0.01
0
0
0
0
0
0
0
0
0
0
0
0
0
0
0
0
0
0
0
0
0
0
0
0
●
●
●
●
●
●
●
●
●
●
●
●
●
●
●
●
●
●
●
●
●
●
●
●
●
●
●
●
0
0
0
0
0
0
0
0
0
0
0
0
0
0
0
0
0
0
0
0
0
0
0
0
0
0
0
0
●
●
●
●
●
●
●
●
●
●
●
●
●
●
●
●
●
●
●
●
●
●
●
●
●
●
●
●
0
0
0
0
0
0
0
0
0
0
0
0
0
0
0
0
0
0
0
0
0
0
0
0
0
0
0
0
●
●
●
●
●
●
●
●
●
●
●
●
●
●
●
●
●
●
●
●
●
●
●
●
●
●
●
●
0
0
0
0
0
0
0
0
0
0
0
0
0
0
0
0
0
0
0
0
0
0
0
0
0
0
0
0
●
●
●
●
●
●
●
●
●
●
●
●
●
●
●
●
●
●
●
●
●
●
●
●
●
●
●
●
0.02
0.02
0.04
0.01
0.09
0.03
0
0.02
0.21
0.02
0.02
0
0.02
0.02
0.04
0.02
0.06
0
0
0.02
0.02
0.01
0.02
0.02
0.07
0.02
0.02
0.02
●
●
●
●
●
●
●
●
●
●
●
●
●
●
●
●
●
●
●
●
●
●
●
●
●
●
●
●
0
0
0
0
0
0
0
0
0
0
0
0
0
0
0
0
0
0
0
0
0
0
0
0
0
0
0
0
●
●
●
●
●
●
●
●
●
●
●
●
●
●
●
●
●
●
●
●
●
●
●
●
●
●
●
●
0.73
0.73
0.93
0.92
0.76
0.92
0.89
0.74
0.77
0.74
0.74
0.95
0.74
0.74
0.95
0.73
0.91
0.98
0.95
0.74
0.74
0.91
0.74
0.74
0.9
0.74
0.73
0.74
●
●
●
●
●
●
●
●
●
●
●
●
●
●
●
●
●
●
●
●
●
●
●
●
●
●
●
●
0.02
0.02
0
0.08
0.13
0
0.21
0.02
0.02
0.02
0.02
0.02
0.02
0.02
0.02
0.02
0.02
0.02
0.02
0.02
0.02
0.02
0.02
0.02
0.02
0.02
0.02
0.02
●
●
●
●
●
●
●
●
●
●
●
●
●
●
●
●
●
●
●
●
●
●
●
●
●
●
●
●
0.01
0.01
0.02
0.03
0.13
0.03
0.09
0.01
0
0.01
0.01
0
0.01
0.01
0
0.01
0
0
0
0.01
0.01
0
0.01
0.01
0
0.01
0.01
0.01
●
●
●
●
●
●
●
●
●
●
●
●
●
●
●
●
●
●
●
●
●
●
●
●
●
●
●
●
0.92
0.92
0.99
0.92
0.87
0.99
0.79
0.92
0.92
0.92
0.92
0.92
0.92
0.92
0.92
0.92
0.92
0.92
0.92
0.92
0.92
0.92
0.92
0.92
0.92
0.92
0.92
0.92
BASE METALS
CHEMICALS
CURRENCY
CURRENCY(NON−MAJOR)
DAIRY PRODUCTS
ELECTRICITY AND SOURCES
EMISSIONS
FIBER
FOODSTUFFS/SOFTS
Fertilizer
GRAINS
INT RATES − NON U.S. TRES
INT RATES − U.S. TRES
LIVESTOCK/MEAT PRODUCTS
NARROW BASED INDICES
NATURAL GAS AND PRODUCTS
OILSEED and PRODUCTS
OTHER AGRICULTURAL
OTHER FINANCIAL INSTRUMENTS
PETROLEUM AND PRODUCTS
PLASTICS
PRECIOUS METALS
REAL ESTATE
SINGLE STOCK FUTURES
STOCK INDEX
WEATHER
WOOD PRODUCTS
Yield Insurance
vol 10^7's, tvol 10^8's, t
0.00
0.25
0.50
0.75
1.00
0.00
0.25
0.50
0.75
1.00
0.00
0.25
0.50
0.75
1.00
0.00
0.25
0.50
0.75
1.00
0.00
0.25
0.50
0.75
1.00
0.00
0.25
0.50
0.75
1.00
0.00
0.25
0.50
0.75
1.00
0.00
0.25
0.50
0.75
1.00
0.00
0.25
0.50
0.75
1.00
0.00
0.25
0.50
0.75
1.00
Pr(year−on−year move)
Pro
duct
sub
grou
p
Fig. 29. Transition matrix for Markov model of derivatives contract movingbetween states of annual trading volume by product type - part 5: transitionsgiven annual volumes ≥ 1, 000, 000
53