the landscape for impact investing in east … africa...4 • the landscape for impact investing in...
TRANSCRIPT
ETHIOPIA
THE LANDSCAPE FOR IMPACT INVESTING IN EAST AFRICA
WITH SUPPORT FROM
ACKNOWLEDGMENTSThis project was funded with UK aid from the UK Government though the Department for International Development’s Impact Programme. The Impact Programme aims to catalyse the market for impact investment in sub-Saharan Africa and South Asia. www.theimpactprogramme.org.uk
The Bertha Center at the University of Cape Town contributed to this report by providing their database of active impact investors operating across sub-Saharan Africa.
We would further like to thank the tireless Open Capital Advisors (OCA) research team—Nicole DeMarsh, Rodney Carew, Getrude Okoth, Christine Njuguna, Charles Njugunah, Jerioth Mwaura, and Ann Munyua—for interviewing impact investors, eco-system players, and entrepreneurs, and for conducting rigorous data collection under tight timelines.
We would especially like to thank our interview participants–without their key insights this report would not have been possible. We include a full list of interviewees in the Appendix.
GIIN Advisory TeamAmit Bouri, [email protected] Mudaliar, [email protected] Schiff, [email protected] Gustafson, [email protected]
Open Capital AdvisorsAnnie Roberts, [email protected] Loew, [email protected] Desai, [email protected]
AUGUST 2015
LIST OF COMMON TERMS AND ACRONYMS
AFD | Agence Française de Développement (French Development Agency)
AfDB | African Development Bank
BIF | Burundian Franc
BIO | Belgian Investment Company for Developing Countries
BoP | Base of the Pyramid
CEPGL | Communauté Économique des Pays des Grand Lacs (Economic Community of the Great Lakes Countries)
COMESA | The Common Market for Eastern and Southern Africa
CSR | Corporate Social Responsibility
DFI | Development Finance Institution
DFID | The Department for International Development (United Kingdom)
DRC | Democratic Republic of the Congo
EAC | East African Community
Early-stage business | Business that has begun operations but has most likely not began commercial manufacture and sales
EIB | European Investment Bank
ESG | Environmental, Social, and Governance
ETB | Ethiopian Birr
FDI | Foreign Direct Investment
FMCG | Fast-Moving Consumer Goods
FMO | Nederlandse Financierings-Maatschappij voor Ontwikkelingslanden N.V. (Netherlands Development Finance Company)
Focus countries | Countries under the study where non-DFI impact investors are most active in. Namely Ethiopia, Kenya, Rwanda, Tanzania, and Uganda
GDP | Gross Domestic Product
GEMS | Growth Enterprise Market Segment
GIIRS | Global Impact Investing Ratings System
GIZ | Gesellschaft für Internationale Zusammenarbeit (German Agency for International Cooperation)
Growth-stage business | Company has a functioning business model and its current focus is developing new products / services or expanding into new markets
HDI | Human Development Index
ICC | International Criminal Court
ICT | Information and Communication Technology
IFAD | International Fund for Agricultural Development
IFC | International Finance Corporation
IMF | International Monetary Fund
IRIS | Impact Investing and Reporting Standards
KES | Kenyan Shilling
LP | Limited Partner
Mature business | Profitable company with a developed and recognizable brand
MDG | Millennium Development Goal
MFI | Microfinance Institution
MSME | Micro, Small and Medium Enterprise
NGO | Non-Governmental Organization
Non-focus countries | Countries covered in the study but have limited non-DFI impact investor activity. Namely Burundi, Djibouti, Eritrea, Somalia, South Sudan, and Sudan
OFID | OPEC Fund for International Development
OPIC | Overseas Private Investment Corporation
PE | Private Equity
PPA | Power Purchasing Agreement
PPP | Purchasing Power Parity
PPP | Public-Private Partnership
PTA | Preferential Trade Area Bank
RDB | Rwanda Development Board
RFP | Request for Proposal
RWF | Rwandan Franc
SACCO | Savings and Credit Co-operative
SAGCOT | Southern Agricultural Corridor of Tanzania
SDG | Sudanese Pound
SGB | Small and Growing Business
SME | Small and Medium-Sized Enterprises
SOE | State-Owned Enterprises
SOS | Somali Shilling
SSP | South Sudanese Pound
TA | Technical Assistance
TIC | Tanzania Investment Centre
TZS | Tanzanian Shilling
UGX | Ugandan Shilling
UN DESA | United Nations - Department of Economic and Social Affairs
UNCTAD | United Nation’s Conference on Trade and Development
USAID | The United States Agency for International Development
VAT | Value-Added Tax
VC | Venture Capital
Venture-stage business | Sales have begun but cannot sustain the company’s operations. The business model is still being aligned with the realities on the ground
WASH | Water, Sanitation, and Hygiene
WHO | World Health Organization
IV • THE LANDSCAPE FOR IMPACT INVESTING IN EAST AFRICA
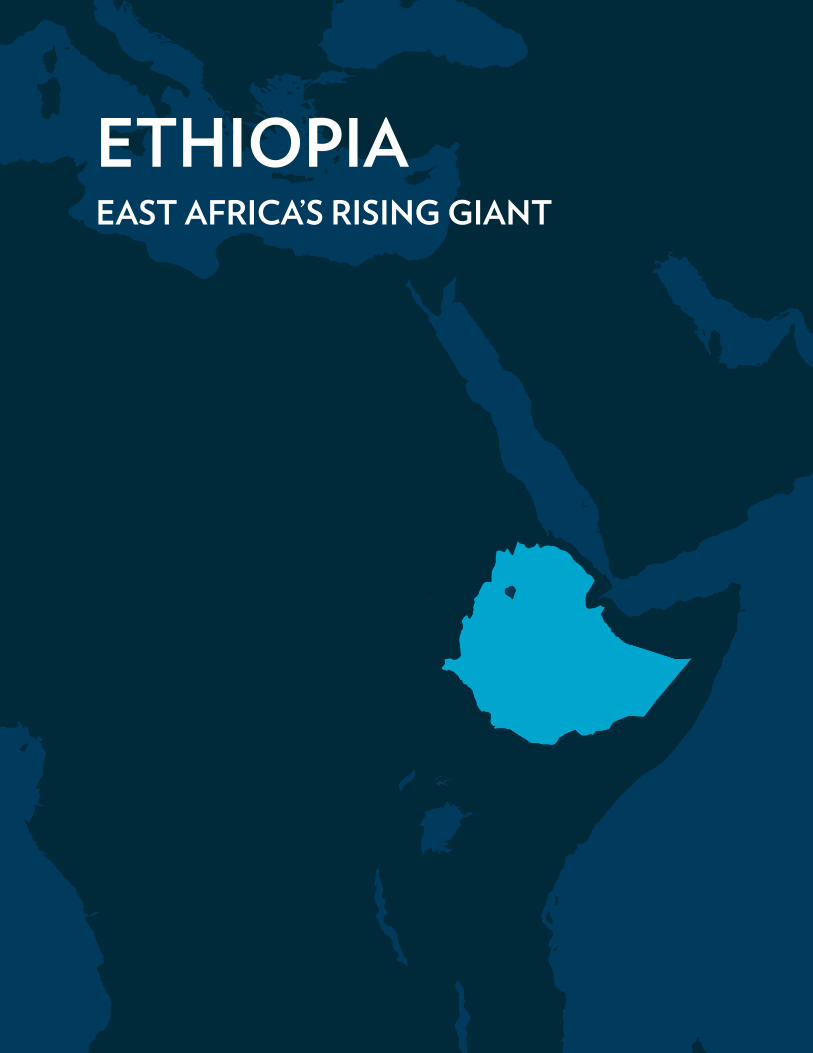
ETHIOPIAEAST AFRICA’S RISING GIANT
ETHIOPIA • 1
TABLE OF CONTENTSIntroduction . . . . . . . . . . . . . . . . . . . . . . . . . . . . . . . . . . . . . . . . . . . . . . . . . . . . . . . . . . . . . . . . . . . . . . . . . . . . . 2
Country Context . . . . . . . . . . . . . . . . . . . . . . . . . . . . . . . . . . . . . . . . . . . . . . . . . . . . . . . . . . . . . . . . . . . . . . . 3
Gross Domestic Product . . . . . . . . . . . . . . . . . . . . . . . . . . . . . . . . . . . . . . . . . . . . . . . . . . . . . . . . . 3
Foreign Direct Investment . . . . . . . . . . . . . . . . . . . . . . . . . . . . . . . . . . . . . . . . . . . . . . . . . . . . . . . 4
Inflation and Exchange Rates . . . . . . . . . . . . . . . . . . . . . . . . . . . . . . . . . . . . . . . . . . . . . . . . . . . . 6
Supply of Impact Capital . . . . . . . . . . . . . . . . . . . . . . . . . . . . . . . . . . . . . . . . . . . . . . . . . . . . . . . . . . . . . 7
Broader Investing Landscape . . . . . . . . . . . . . . . . . . . . . . . . . . . . . . . . . . . . . . . . . . . . . . . . . . . 7
Impact Capital Disbursed . . . . . . . . . . . . . . . . . . . . . . . . . . . . . . . . . . . . . . . . . . . . . . . . . . . . . . . . 8
Investments Over Time . . . . . . . . . . . . . . . . . . . . . . . . . . . . . . . . . . . . . . . . . . . . . . . . . . . . . . . . . . 9
Sector . . . . . . . . . . . . . . . . . . . . . . . . . . . . . . . . . . . . . . . . . . . . . . . . . . . . . . . . . . . . . . . . . . . . . . . . . . . . . . . 10
Deal Size . . . . . . . . . . . . . . . . . . . . . . . . . . . . . . . . . . . . . . . . . . . . . . . . . . . . . . . . . . . . . . . . . . . . . . . . . . . 12
Instrument . . . . . . . . . . . . . . . . . . . . . . . . . . . . . . . . . . . . . . . . . . . . . . . . . . . . . . . . . . . . . . . . . . . . . . . . . . 13
Local Presence . . . . . . . . . . . . . . . . . . . . . . . . . . . . . . . . . . . . . . . . . . . . . . . . . . . . . . . . . . . . . . . . . . . . 14
Impact Tracking Standards . . . . . . . . . . . . . . . . . . . . . . . . . . . . . . . . . . . . . . . . . . . . . . . . . . . . . . 14
Demand for Impact Investing Capital . . . . . . . . . . . . . . . . . . . . . . . . . . . . . . . . . . . . . . . . . . . . . . 15
Development Context . . . . . . . . . . . . . . . . . . . . . . . . . . . . . . . . . . . . . . . . . . . . . . . . . . . . . . . . . . . 15
Entrepreneurs . . . . . . . . . . . . . . . . . . . . . . . . . . . . . . . . . . . . . . . . . . . . . . . . . . . . . . . . . . . . . . . . . . . . . . 17
Enabling Impact Investing: The Ecosystem . . . . . . . . . . . . . . . . . . . . . . . . . . . . . . . . . . . . . . . . . 19
Regulatory Environment . . . . . . . . . . . . . . . . . . . . . . . . . . . . . . . . . . . . . . . . . . . . . . . . . . . . . . . . . 19
Ecosystem Players . . . . . . . . . . . . . . . . . . . . . . . . . . . . . . . . . . . . . . . . . . . . . . . . . . . . . . . . . . . . . . . . 20
Challenges and Opportunities for Impact Investors . . . . . . . . . . . . . . . . . . . . . . . . . . . . . . . 22
Challenges . . . . . . . . . . . . . . . . . . . . . . . . . . . . . . . . . . . . . . . . . . . . . . . . . . . . . . . . . . . . . . . . . . . . . . . . . 22
Opportunities . . . . . . . . . . . . . . . . . . . . . . . . . . . . . . . . . . . . . . . . . . . . . . . . . . . . . . . . . . . . . . . . . . . . . 23
2 • THE LANDSCAPE FOR IMPACT INVESTING IN EAST AFRICA
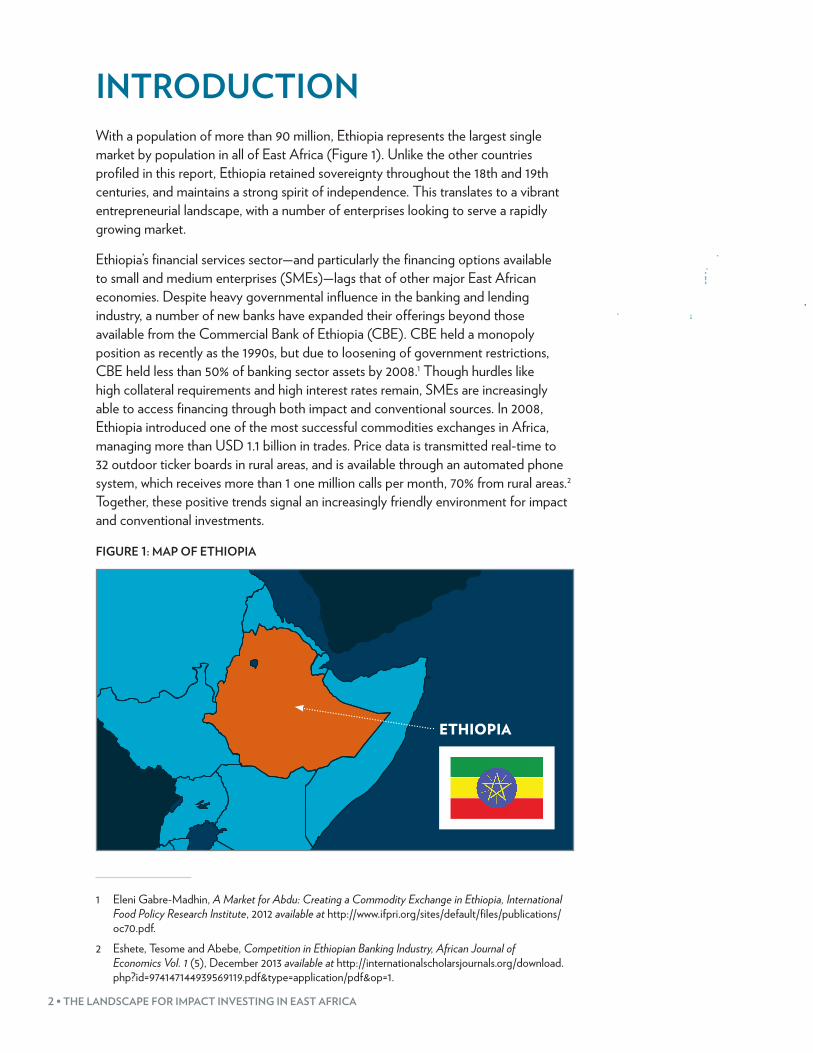
INTRODUCTIONWith a population of more than 90 million, Ethiopia represents the largest single market by population in all of East Africa (Figure 1). Unlike the other countries profiled in this report, Ethiopia retained sovereignty throughout the 18th and 19th centuries, and maintains a strong spirit of independence. This translates to a vibrant entrepreneurial landscape, with a number of enterprises looking to serve a rapidly growing market.
Ethiopia’s financial services sector—and particularly the financing options available to small and medium enterprises (SMEs)—lags that of other major East African economies. Despite heavy governmental influence in the banking and lending industry, a number of new banks have expanded their offerings beyond those available from the Commercial Bank of Ethiopia (CBE). CBE held a monopoly position as recently as the 1990s, but due to loosening of government restrictions, CBE held less than 50% of banking sector assets by 2008.1 Though hurdles like high collateral requirements and high interest rates remain, SMEs are increasingly able to access financing through both impact and conventional sources. In 2008, Ethiopia introduced one of the most successful commodities exchanges in Africa, managing more than USD 1.1 billion in trades. Price data is transmitted real-time to 32 outdoor ticker boards in rural areas, and is available through an automated phone system, which receives more than 1 one million calls per month, 70% from rural areas.2 Together, these positive trends signal an increasingly friendly environment for impact and conventional investments.
FIGURE 1: MAP OF ETHIOPIA
ETHIOPIA
1 Eleni Gabre-Madhin, A Market for Abdu: Creating a Commodity Exchange in Ethiopia, International Food Policy Research Institute, 2012 available at http://www.ifpri.org/sites/default/files/publications/oc70.pdf.
2 Eshete, Tesome and Abebe, Competition in Ethiopian Banking Industry, African Journal of Economics Vol. 1 (5), December 2013 available at http://internationalscholarsjournals.org/download.php?id=974147144939569119.pdf&type=application/pdf&op=1.
ETHIOPIA • 3
COUNTRY CONTEXTAfter decades of authoritarianism, Ethiopia’s economy is on the rise. Exceptional growth rates, spurred by a wave of privatization and robust foreign direct investment (FDI) flows, have fueled rapid modernization, especially in the past decade. Nonetheless, Ethiopia’s living standards lag behind those of its peer countries; the economy is still overwhelmingly agriculture-based, and linkages between urban affluence and rural populations are weak.
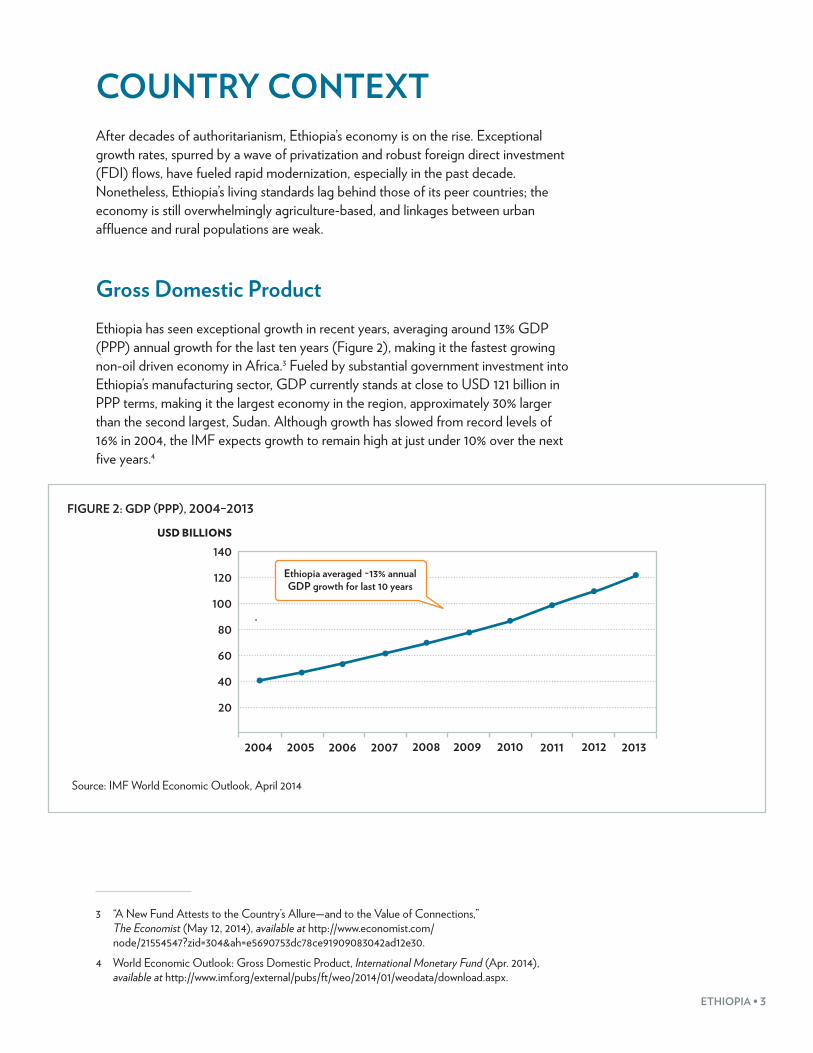
Gross Domestic ProductEthiopia has seen exceptional growth in recent years, averaging around 13% GDP (PPP) annual growth for the last ten years (Figure 2), making it the fastest growing non-oil driven economy in Africa.3 Fueled by substantial government investment into Ethiopia’s manufacturing sector, GDP currently stands at close to USD 121 billion in PPP terms, making it the largest economy in the region, approximately 30% larger than the second largest, Sudan. Although growth has slowed from record levels of 16% in 2004, the IMF expects growth to remain high at just under 10% over the next five years.4
FIGURE 2: GDP (PPP), 2004–2013
100
120
140
80
60
40
20
2004 2005 2006 2007 2008 2009 2010 2011 2012 2013
Ethiopia averaged ~13% annual GDP growth for last 10 years
USD BILLIONS
Source: IMF World Economic Outlook, April 2014
3 “A New Fund Attests to the Country’s Allure—and to the Value of Connections,” The Economist (May 12, 2014), available at http://www.economist.com/node/21554547?zid=304&ah=e5690753dc78ce91909083042ad12e30.
4 World Economic Outlook: Gross Domestic Product, International Monetary Fund (Apr. 2014), available at http://www.imf.org/external/pubs/ft/weo/2014/01/weodata/download.aspx.
4 • THE LANDSCAPE FOR IMPACT INVESTING IN EAST AFRICA
Standards of living, however, remain low. With a population of around 90 million—the second largest in Africa behind Nigeria—Ethiopia’s GDP (PPP) per capita is only USD 1,400 which ranks ahead of only Burundi, Eritrea, and South Sudan regionally (no data for Somalia). The share of GDP from agriculture is close to 50%, by far the highest in the region, and agriculture employs 80% of Ethiopians, compared to only 50% in neighboring Kenya.5 While the government’s efforts to promote industry have done much to boost growth, industry is still a small share of GDP compared to agriculture. Most non-agricultural economic activity takes place in Addis Ababa, resulting in a concentration of wealth in the country’s capital. Nonetheless, pressure on farmers is likely to rise as increasing population growth pushes down land availability and reduces average plot size.
Elsewhere, large-scale industrial projects are likely to absorb substantial government spending. The Grand Millennium Dam—already 30% complete—will add 6 GW of electrical capacity to Ethiopia’s grid with a construction cost of nearly USD 5 billion.6
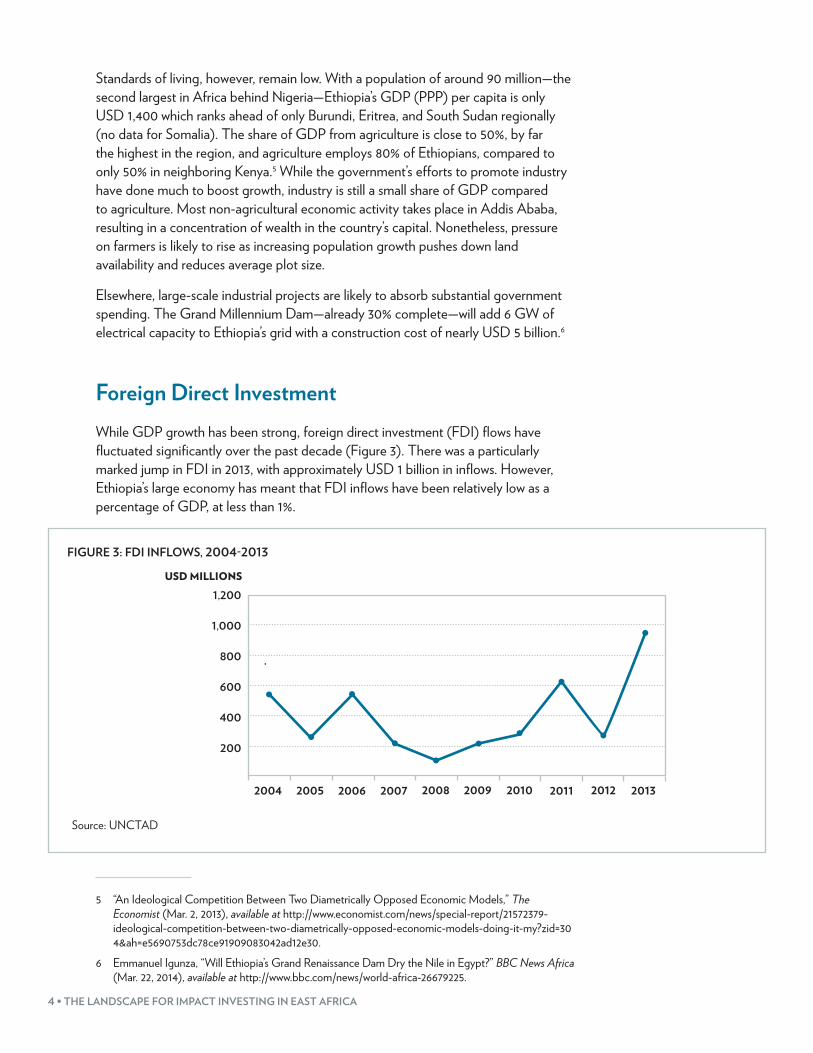
Foreign Direct InvestmentWhile GDP growth has been strong, foreign direct investment (FDI) flows have fluctuated significantly over the past decade (Figure 3). There was a particularly marked jump in FDI in 2013, with approximately USD 1 billion in inflows. However, Ethiopia’s large economy has meant that FDI inflows have been relatively low as a percentage of GDP, at less than 1%.
FIGURE 3: FDI INFLOWS, 2004-2013
800
1,000
1,200
600
400
200
2004 2005 2006 2007 2008 2009 2010 2011 2012 2013
USD MILLIONS
Source: UNCTAD
5 “An Ideological Competition Between Two Diametrically Opposed Economic Models,” The Economist (Mar. 2, 2013), available at http://www.economist.com/news/special-report/21572379-ideological-competition-between-two-diametrically-opposed-economic-models-doing-it-my?zid=304&ah=e5690753dc78ce91909083042ad12e30.
6 Emmanuel Igunza, “Will Ethiopia’s Grand Renaissance Dam Dry the Nile in Egypt?” BBC News Africa (Mar. 22, 2014), available at http://www.bbc.com/news/world-africa-26679225.
ETHIOPIA • 5
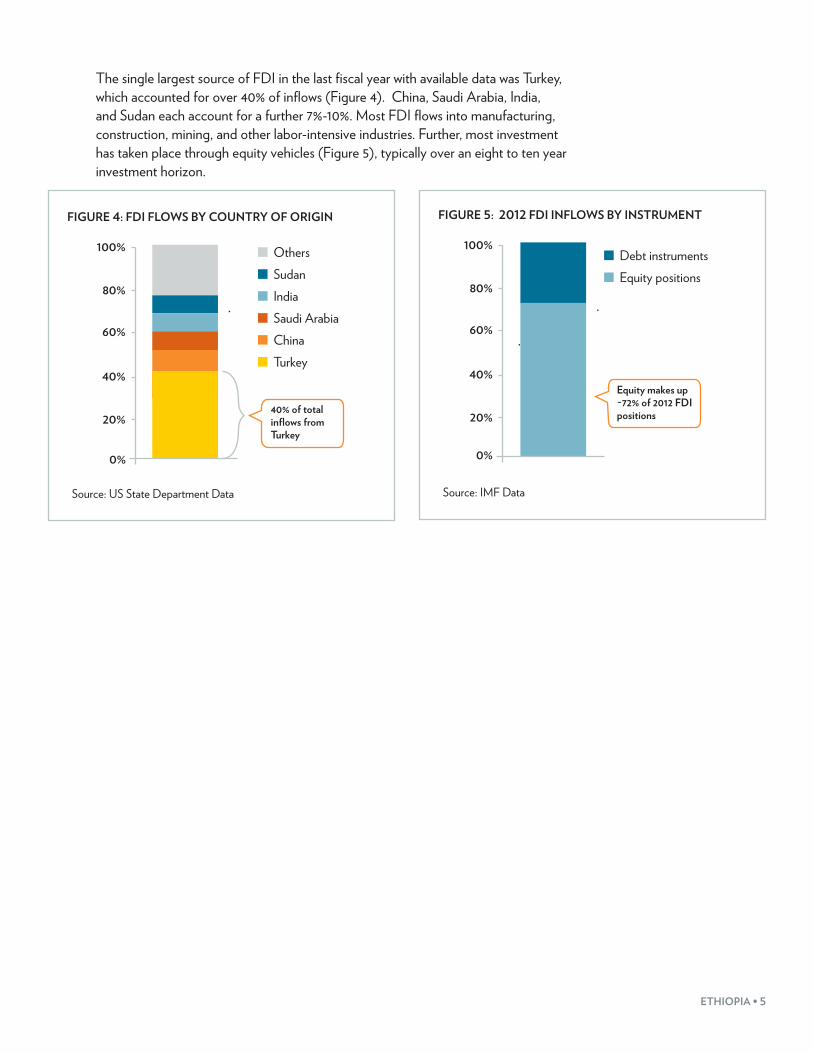
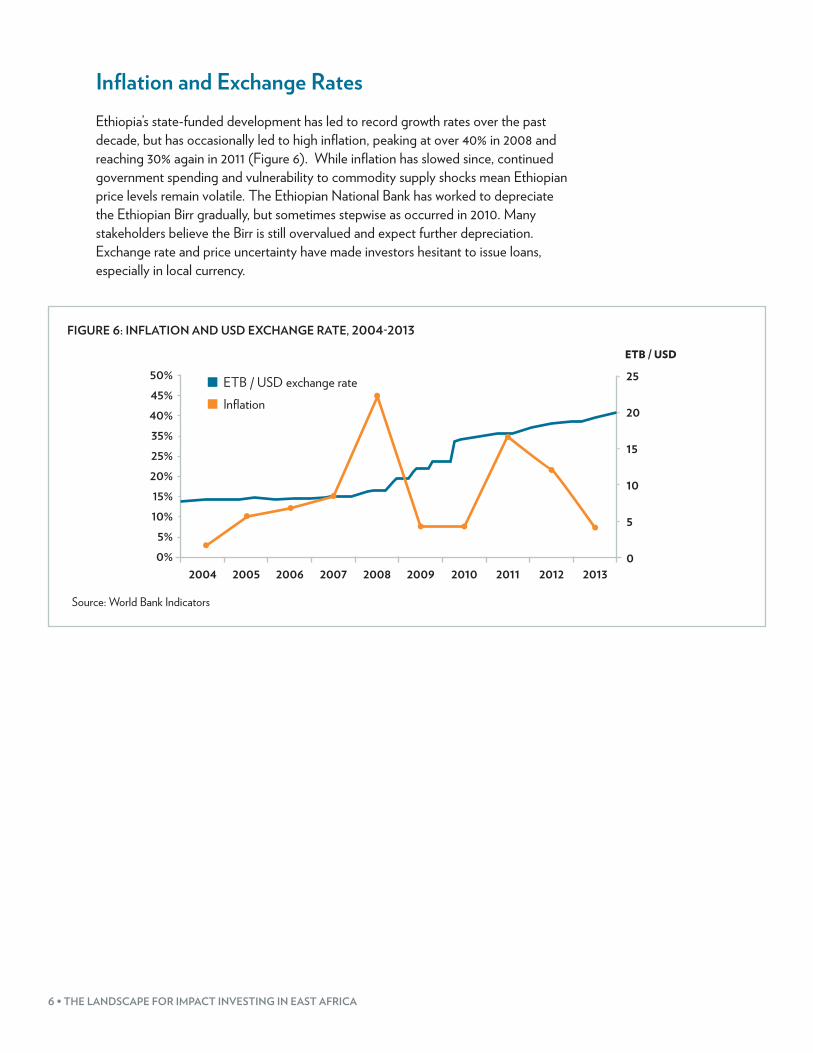
The single largest source of FDI in the last fiscal year with available data was Turkey, which accounted for over 40% of inflows (Figure 4). China, Saudi Arabia, India, and Sudan each account for a further 7%-10%. Most FDI flows into manufacturing, construction, mining, and other labor-intensive industries. Further, most investment has taken place through equity vehicles (Figure 5), typically over an eight to ten year investment horizon.
FIGURE 4: FDI FLOWS BY COUNTRY OF ORIGIN
0%
OthersSudanIndiaSaudi ArabiaChinaTurkey
40% of total inflows from Turkey
100%
80%
60%
40%
20%
Source: US State Department Data
FIGURE 5: 2012 FDI INFLOWS BY INSTRUMENT
100%
80%
60%
40%
20%
0%
Debt instrumentsEquity positions
Equity makes up ~72% of 2012 FDI positions
Source: IMF Data
6 • THE LANDSCAPE FOR IMPACT INVESTING IN EAST AFRICA
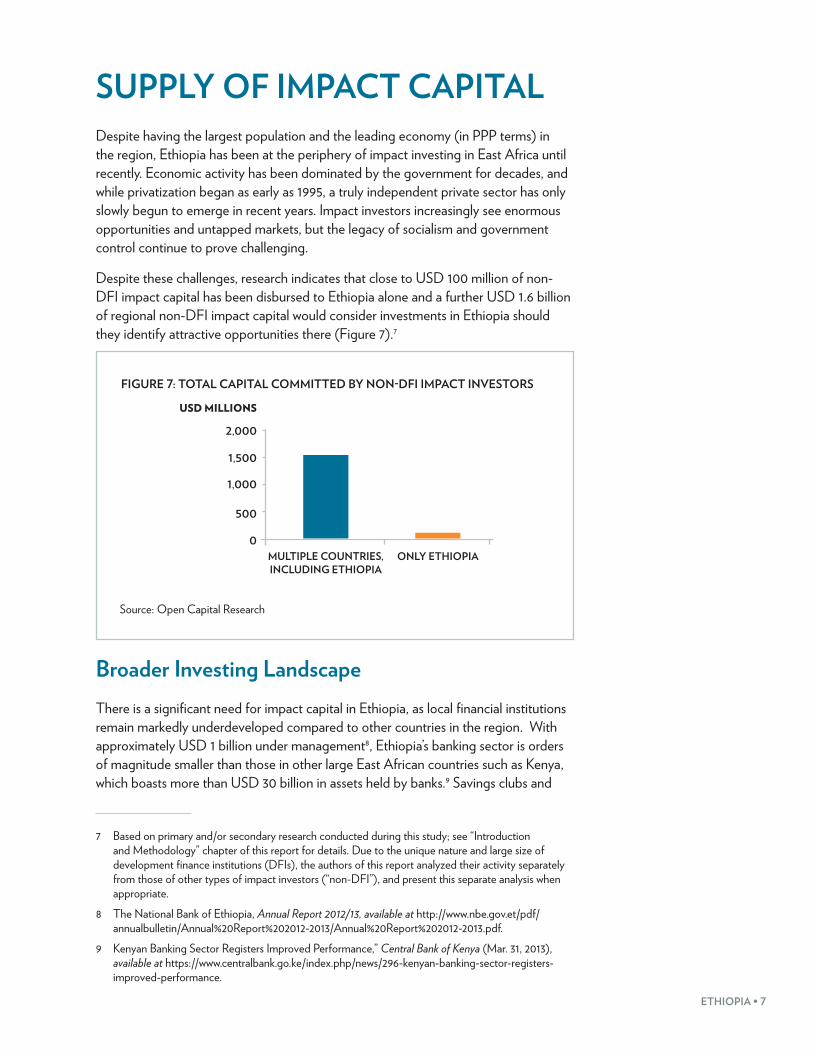
Inflation and Exchange RatesEthiopia’s state-funded development has led to record growth rates over the past decade, but has occasionally led to high inflation, peaking at over 40% in 2008 and reaching 30% again in 2011 (Figure 6). While inflation has slowed since, continued government spending and vulnerability to commodity supply shocks mean Ethiopian price levels remain volatile. The Ethiopian National Bank has worked to depreciate the Ethiopian Birr gradually, but sometimes stepwise as occurred in 2010. Many stakeholders believe the Birr is still overvalued and expect further depreciation. Exchange rate and price uncertainty have made investors hesitant to issue loans, especially in local currency.
FIGURE 6: INFLATION AND USD EXCHANGE RATE, 2004-2013
35%
40%
45%
50%
25%
15%
5%
0%
10%
20%
ETB / USD exchange rateInflation
ETB / USD
2004 2006 2008 2010 20122005 2007 2009 2011 2013
25
20
15
10
0
5
Source: World Bank Indicators
ETHIOPIA • 7
SUPPLY OF IMPACT CAPITAL Despite having the largest population and the leading economy (in PPP terms) in the region, Ethiopia has been at the periphery of impact investing in East Africa until recently. Economic activity has been dominated by the government for decades, and while privatization began as early as 1995, a truly independent private sector has only slowly begun to emerge in recent years. Impact investors increasingly see enormous opportunities and untapped markets, but the legacy of socialism and government control continue to prove challenging.
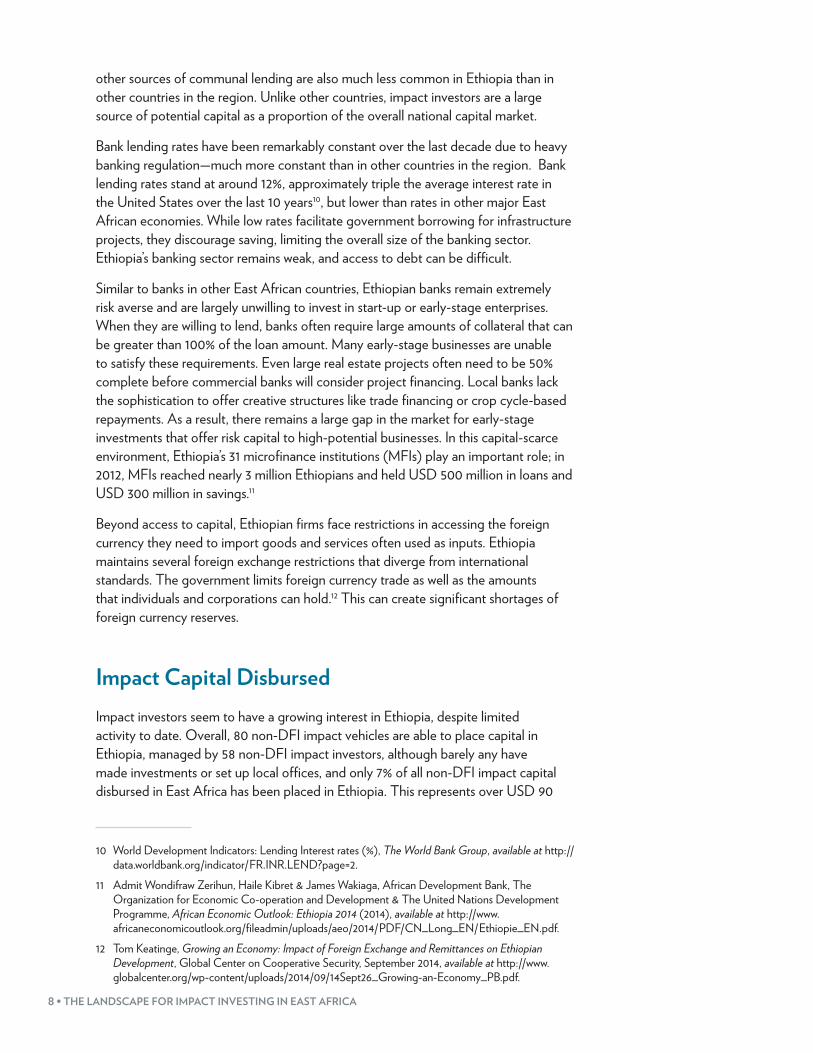
Despite these challenges, research indicates that close to USD 100 million of non-DFI impact capital has been disbursed to Ethiopia alone and a further USD 1.6 billion of regional non-DFI impact capital would consider investments in Ethiopia should they identify attractive opportunities there (Figure 7).7
FIGURE 7: TOTAL CAPITAL COMMITTED BY NON-DFI IMPACT INVESTORS
MULTIPLE COUNTRIES, INCLUDING ETHIOPIA
ONLY ETHIOPIA
2,000
1,500
500
0
1,000
USD MILLIONS
Source: Open Capital Research
Broader Investing Landscape There is a significant need for impact capital in Ethiopia, as local financial institutions remain markedly underdeveloped compared to other countries in the region. With approximately USD 1 billion under management8, Ethiopia’s banking sector is orders of magnitude smaller than those in other large East African countries such as Kenya, which boasts more than USD 30 billion in assets held by banks.9 Savings clubs and
7 Based on primary and/or secondary research conducted during this study; see “Introduction and Methodology” chapter of this report for details. Due to the unique nature and large size of development finance institutions (DFIs), the authors of this report analyzed their activity separately from those of other types of impact investors (“non-DFI”), and present this separate analysis when appropriate.
8 The National Bank of Ethiopia, Annual Report 2012/13, available at http://www.nbe.gov.et/pdf/annualbulletin/Annual%20Report%202012-2013/Annual%20Report%202012-2013.pdf.
9 Kenyan Banking Sector Registers Improved Performance,” Central Bank of Kenya (Mar. 31, 2013), available at https://www.centralbank.go.ke/index.php/news/296-kenyan-banking-sector-registers-improved-performance.
8 • THE LANDSCAPE FOR IMPACT INVESTING IN EAST AFRICA
other sources of communal lending are also much less common in Ethiopia than in other countries in the region. Unlike other countries, impact investors are a large source of potential capital as a proportion of the overall national capital market.
Bank lending rates have been remarkably constant over the last decade due to heavy banking regulation—much more constant than in other countries in the region. Bank lending rates stand at around 12%, approximately triple the average interest rate in the United States over the last 10 years10, but lower than rates in other major East African economies. While low rates facilitate government borrowing for infrastructure projects, they discourage saving, limiting the overall size of the banking sector. Ethiopia’s banking sector remains weak, and access to debt can be difficult.
Similar to banks in other East African countries, Ethiopian banks remain extremely risk averse and are largely unwilling to invest in start-up or early-stage enterprises. When they are willing to lend, banks often require large amounts of collateral that can be greater than 100% of the loan amount. Many early-stage businesses are unable to satisfy these requirements. Even large real estate projects often need to be 50% complete before commercial banks will consider project financing. Local banks lack the sophistication to offer creative structures like trade financing or crop cycle-based repayments. As a result, there remains a large gap in the market for early-stage investments that offer risk capital to high-potential businesses. In this capital-scarce environment, Ethiopia’s 31 microfinance institutions (MFIs) play an important role; in 2012, MFIs reached nearly 3 million Ethiopians and held USD 500 million in loans and USD 300 million in savings.11
Beyond access to capital, Ethiopian firms face restrictions in accessing the foreign currency they need to import goods and services often used as inputs. Ethiopia maintains several foreign exchange restrictions that diverge from international standards. The government limits foreign currency trade as well as the amounts that individuals and corporations can hold.12 This can create significant shortages of foreign currency reserves.
Impact Capital DisbursedImpact investors seem to have a growing interest in Ethiopia, despite limited activity to date. Overall, 80 non-DFI impact vehicles are able to place capital in Ethiopia, managed by 58 non-DFI impact investors, although barely any have made investments or set up local offices, and only 7% of all non-DFI impact capital disbursed in East Africa has been placed in Ethiopia. This represents over USD 90
10 World Development Indicators: Lending Interest rates (%), The World Bank Group, available at http://data.worldbank.org/indicator/FR.INR.LEND?page=2.
11 Admit Wondifraw Zerihun, Haile Kibret & James Wakiaga, African Development Bank, The Organization for Economic Co-operation and Development & The United Nations Development Programme, African Economic Outlook: Ethiopia 2014 (2014), available at http://www.africaneconomicoutlook.org/fileadmin/uploads/aeo/2014/PDF/CN_Long_EN/Ethiopie_EN.pdf.
12 Tom Keatinge, Growing an Economy: Impact of Foreign Exchange and Remittances on Ethiopian Development, Global Center on Cooperative Security, September 2014, available at http://www.globalcenter.org/wp-content/uploads/2014/09/14Sept26_Growing-an-Economy_PB.pdf.
ETHIOPIA • 9
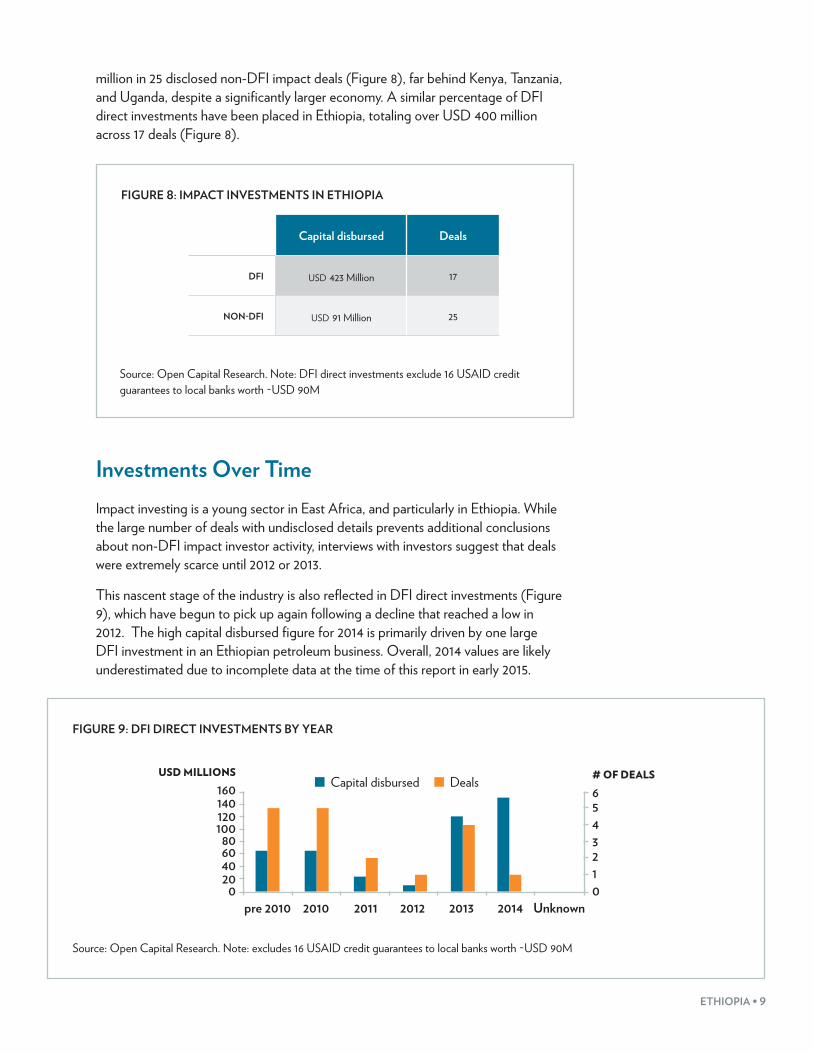
million in 25 disclosed non-DFI impact deals (Figure 8), far behind Kenya, Tanzania, and Uganda, despite a significantly larger economy. A similar percentage of DFI direct investments have been placed in Ethiopia, totaling over USD 400 million across 17 deals (Figure 8).
FIGURE 8: IMPACT INVESTMENTS IN ETHIOPIA
Capital disbursed Deals
DFI usd 423 Million 17
NON-DFI usd 91 Million 25
Source: Open Capital Research. Note: DFI direct investments exclude 16 USAID credit guarantees to local banks worth ~USD 90M
Investments Over TimeImpact investing is a young sector in East Africa, and particularly in Ethiopia. While the large number of deals with undisclosed details prevents additional conclusions about non-DFI impact investor activity, interviews with investors suggest that deals were extremely scarce until 2012 or 2013.
This nascent stage of the industry is also reflected in DFI direct investments (Figure 9), which have begun to pick up again following a decline that reached a low in 2012. The high capital disbursed figure for 2014 is primarily driven by one large DFI investment in an Ethiopian petroleum business. Overall, 2014 values are likely underestimated due to incomplete data at the time of this report in early 2015.
FIGURE 9: DFI DIRECT INVESTMENTS BY YEAR
USD MILLIONS
160140120100
80604020
0
654321
# OF DEALS
0
Capital disbursed Deals
pre 2010 2010 2011 2012 2013 2014 Unknown
Source: Open Capital Research. Note: excludes 16 USAID credit guarantees to local banks worth ~USD 90M
10 • THE LANDSCAPE FOR IMPACT INVESTING IN EAST AFRICA
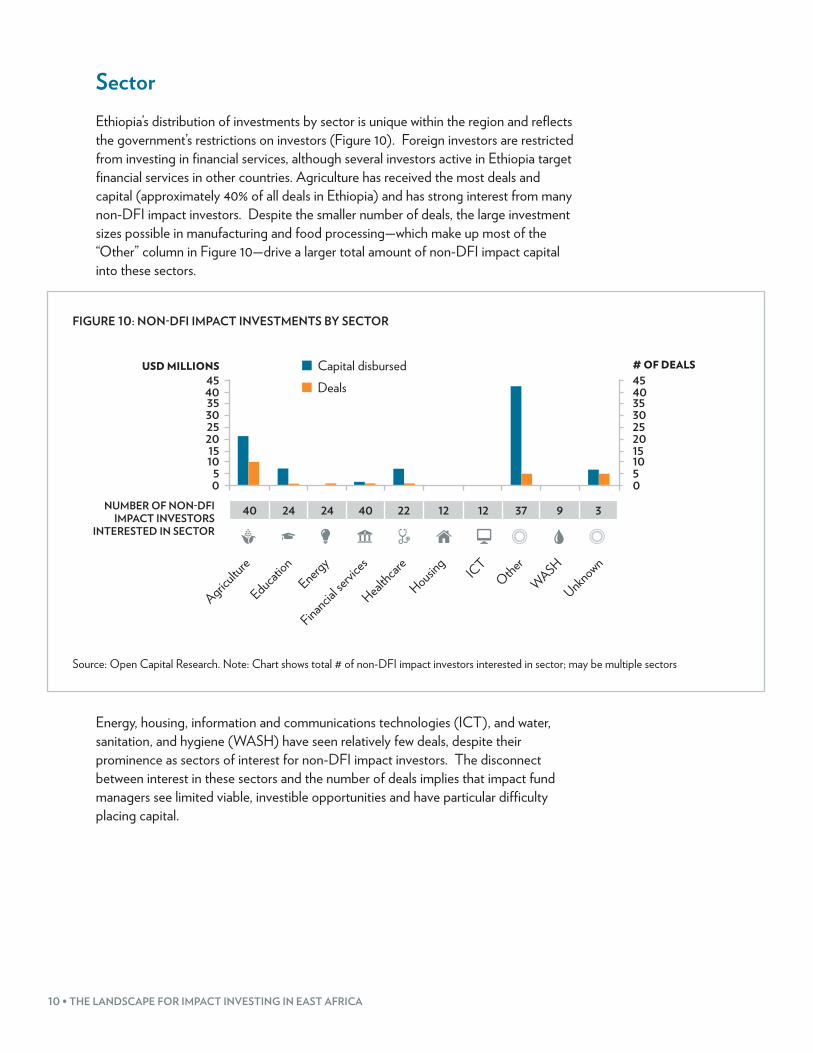
SectorEthiopia’s distribution of investments by sector is unique within the region and reflects the government’s restrictions on investors (Figure 10). Foreign investors are restricted from investing in financial services, although several investors active in Ethiopia target financial services in other countries. Agriculture has received the most deals and capital (approximately 40% of all deals in Ethiopia) and has strong interest from many non-DFI impact investors. Despite the smaller number of deals, the large investment sizes possible in manufacturing and food processing—which make up most of the “Other” column in Figure 10—drive a larger total amount of non-DFI impact capital into these sectors.
FIGURE 10: NON-DFI IMPACT INVESTMENTS BY SECTOR
NUMBER OF NON-DFI IMPACT INVESTORS
INTERESTED IN SECTOR
40 24 24 40 22 12 12 37 9 3
USD MILLIONS4540353025201510
50
454035302520151050
# OF DEALSCapital disbursedDeals
Agriculture
Education
Energy
Financial se
rvices
Healthcar
e
Housing
ICTOther
WASH
Unknown
Source: Open Capital Research. Note: Chart shows total # of non-DFI impact investors interested in sector; may be multiple sectors
Energy, housing, information and communications technologies (ICT), and water, sanitation, and hygiene (WASH) have seen relatively few deals, despite their prominence as sectors of interest for non-DFI impact investors. The disconnect between interest in these sectors and the number of deals implies that impact fund managers see limited viable, investible opportunities and have particular difficulty placing capital.
ETHIOPIA • 11
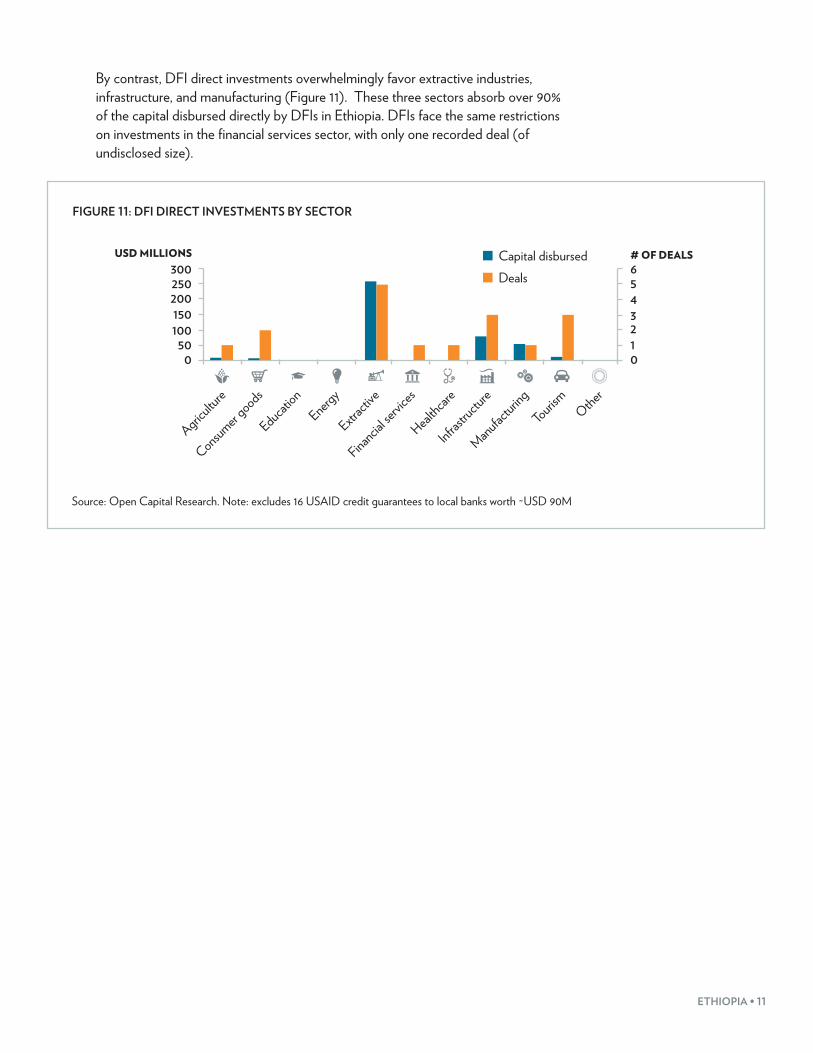
By contrast, DFI direct investments overwhelmingly favor extractive industries, infrastructure, and manufacturing (Figure 11). These three sectors absorb over 90% of the capital disbursed directly by DFIs in Ethiopia. DFIs face the same restrictions on investments in the financial services sector, with only one recorded deal (of undisclosed size).
FIGURE 11: DFI DIRECT INVESTMENTS BY SECTOR
USD MILLIONS300250200150100
500
54321
# OF DEALS
0
Capital disbursedDeals 6
Agriculture
Education
Energy
Extract
ive
Financial se
rvices
Healthcar
e
Infrastru
cture
Manufacturing
Consumer goods
Tourism Other
Source: Open Capital Research. Note: excludes 16 USAID credit guarantees to local banks worth ~USD 90M
12 • THE LANDSCAPE FOR IMPACT INVESTING IN EAST AFRICA
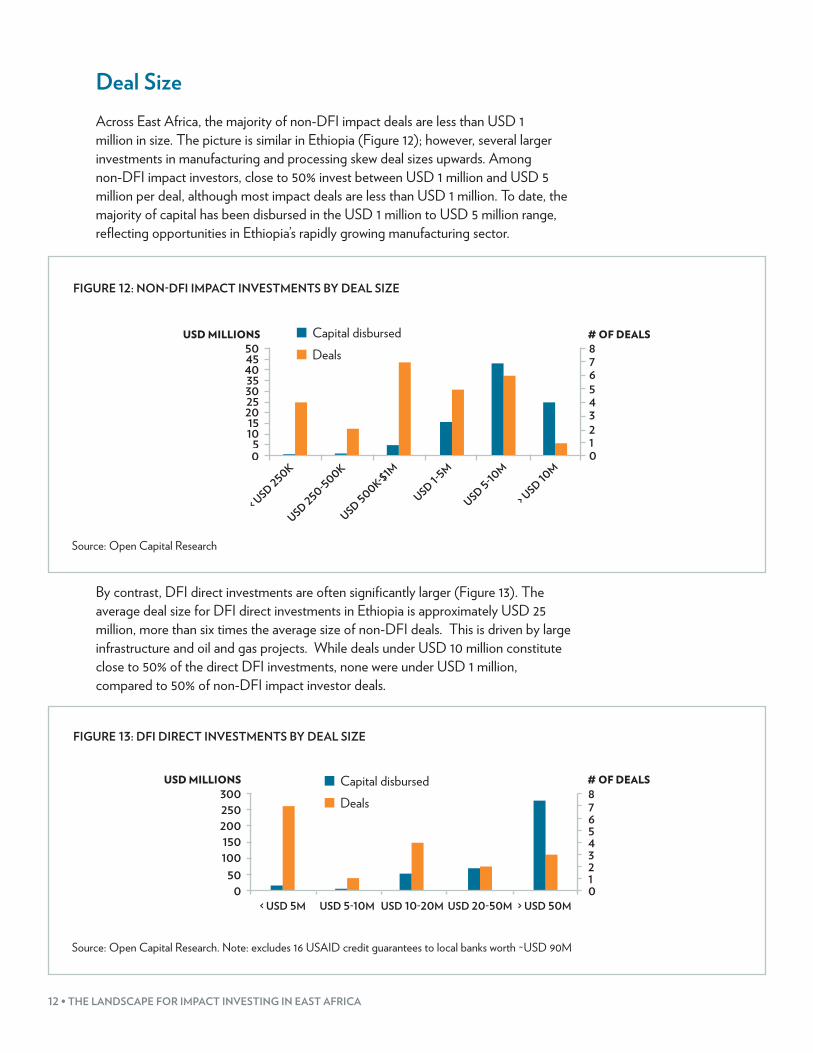
Deal SizeAcross East Africa, the majority of non-DFI impact deals are less than USD 1 million in size. The picture is similar in Ethiopia (Figure 12); however, several larger investments in manufacturing and processing skew deal sizes upwards. Among non-DFI impact investors, close to 50% invest between USD 1 million and USD 5 million per deal, although most impact deals are less than USD 1 million. To date, the majority of capital has been disbursed in the USD 1 million to USD 5 million range, reflecting opportunities in Ethiopia’s rapidly growing manufacturing sector.
FIGURE 12: NON-DFI IMPACT INVESTMENTS BY DEAL SIZE
USD MILLIONS504540
# OF DEALS876543210
353025201510
50
Capital disbursedDeals
< USD 250K
USD 250-500K
USD 500K-$1M
USD 1-5M
USD 5-10M
> USD 10
M
Source: Open Capital Research
By contrast, DFI direct investments are often significantly larger (Figure 13). The average deal size for DFI direct investments in Ethiopia is approximately USD 25 million, more than six times the average size of non-DFI deals. This is driven by large infrastructure and oil and gas projects. While deals under USD 10 million constitute close to 50% of the direct DFI investments, none were under USD 1 million, compared to 50% of non-DFI impact investor deals.
FIGURE 13: DFI DIRECT INVESTMENTS BY DEAL SIZE
USD MILLIONS300250200150100
500
# OF DEALS87654
Capital disbursedDeals
< USD 5M USD 5-10M USD 10-20M USD 20-50M > USD 50M
3210
Source: Open Capital Research. Note: excludes 16 USAID credit guarantees to local banks worth ~USD 90M
ETHIOPIA • 13
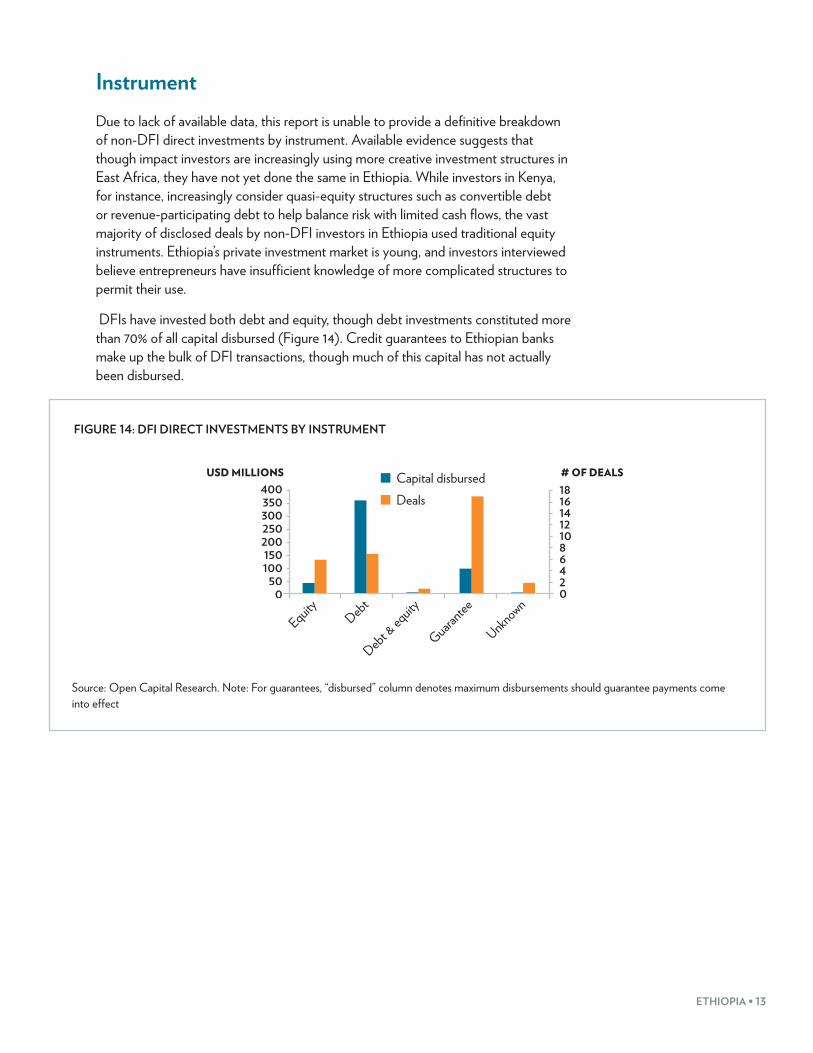
InstrumentDue to lack of available data, this report is unable to provide a definitive breakdown of non-DFI direct investments by instrument. Available evidence suggests that though impact investors are increasingly using more creative investment structures in East Africa, they have not yet done the same in Ethiopia. While investors in Kenya, for instance, increasingly consider quasi-equity structures such as convertible debt or revenue-participating debt to help balance risk with limited cash flows, the vast majority of disclosed deals by non-DFI investors in Ethiopia used traditional equity instruments. Ethiopia’s private investment market is young, and investors interviewed believe entrepreneurs have insufficient knowledge of more complicated structures to permit their use.
DFIs have invested both debt and equity, though debt investments constituted more than 70% of all capital disbursed (Figure 14). Credit guarantees to Ethiopian banks make up the bulk of DFI transactions, though much of this capital has not actually been disbursed.
FIGURE 14: DFI DIRECT INVESTMENTS BY INSTRUMENT
USD MILLIONS400350300250200150100
500
Capital disbursedDeals
EquityDebt
Debt & eq
uity
Guarantee
Unknown
# OF DEALS
1614121086420
18
Source: Open Capital Research. Note: For guarantees, “disbursed” column denotes maximum disbursements should guarantee payments come into effect
14 • THE LANDSCAPE FOR IMPACT INVESTING IN EAST AFRICA
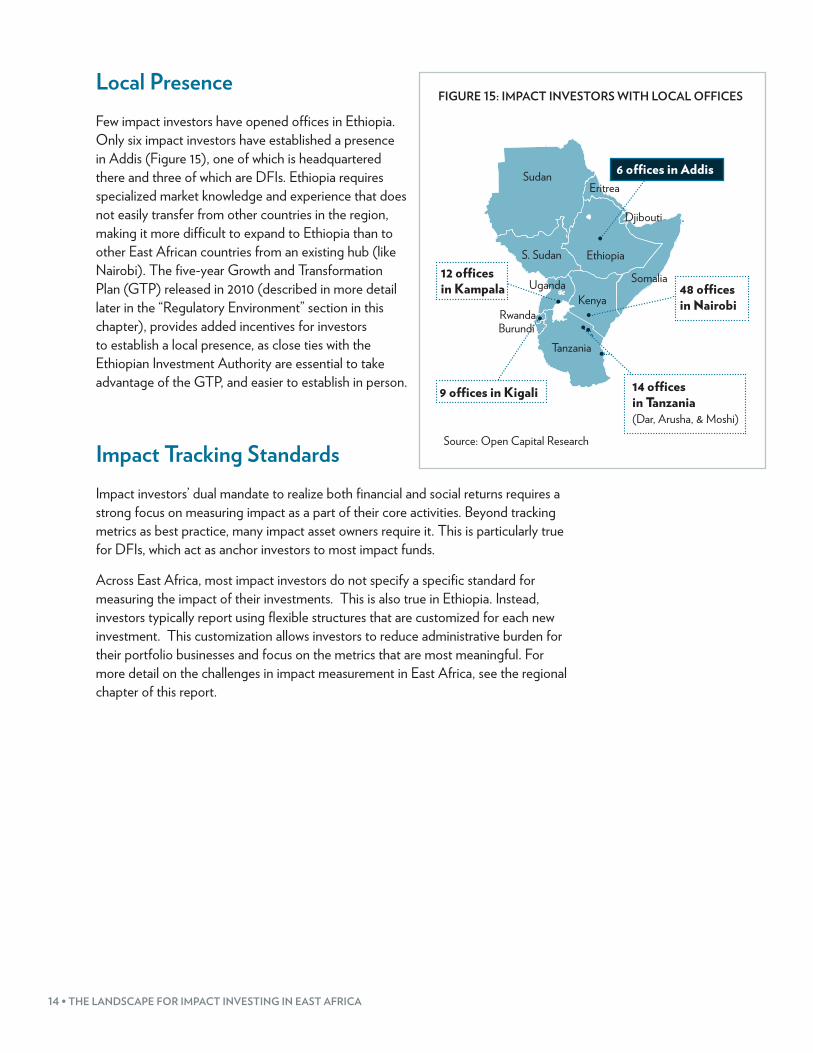
Local PresenceFew impact investors have opened offices in Ethiopia. Only six impact investors have established a presence in Addis (Figure 15), one of which is headquartered there and three of which are DFIs. Ethiopia requires specialized market knowledge and experience that does not easily transfer from other countries in the region, making it more difficult to expand to Ethiopia than to other East African countries from an existing hub (like Nairobi). The five-year Growth and Transformation Plan (GTP) released in 2010 (described in more detail later in the “Regulatory Environment” section in this chapter), provides added incentives for investors to establish a local presence, as close ties with the Ethiopian Investment Authority are essential to take advantage of the GTP, and easier to establish in person.
Impact Tracking Standards Impact investors’ dual mandate to realize both financial and social returns requires a strong focus on measuring impact as a part of their core activities. Beyond tracking metrics as best practice, many impact asset owners require it. This is particularly true for DFIs, which act as anchor investors to most impact funds.
Across East Africa, most impact investors do not specify a specific standard for measuring the impact of their investments. This is also true in Ethiopia. Instead, investors typically report using flexible structures that are customized for each new investment. This customization allows investors to reduce administrative burden for their portfolio businesses and focus on the metrics that are most meaningful. For more detail on the challenges in impact measurement in East Africa, see the regional chapter of this report.
Source: Open Capital Research
FIGURE 15: IMPACT INVESTORS WITH LOCAL OFFICES
•
•
••
•
•
6 offices in Addis
48 offices in Nairobi
12 offices in Kampala
9 offices in Kigali 14 offices in Tanzania(Dar, Arusha, & Moshi)
•Rwanda
Sudan
S. Sudan Ethiopia
Kenya
Tanzania
Somalia
Eritrea
Djibouti
Uganda
Burundi
ETHIOPIA • 15
DEMAND FOR IMPACT INVESTING CAPITAL Despite record growth over the past decade, Ethiopia lags other countries in the region in the provision of key goods and services. This creates opportunities for entrepreneurs to build enterprises that fill these needs while also realizing financial returns. As the private sector continues to grow and entrepreneurs take advantage of these opportunities, they will increasingly look beyond banks and family savings to finance business growth. This is likely to translate into demand for impact capital and private equity more generally (despite currently variable and often low levels of familiarity with these concepts).
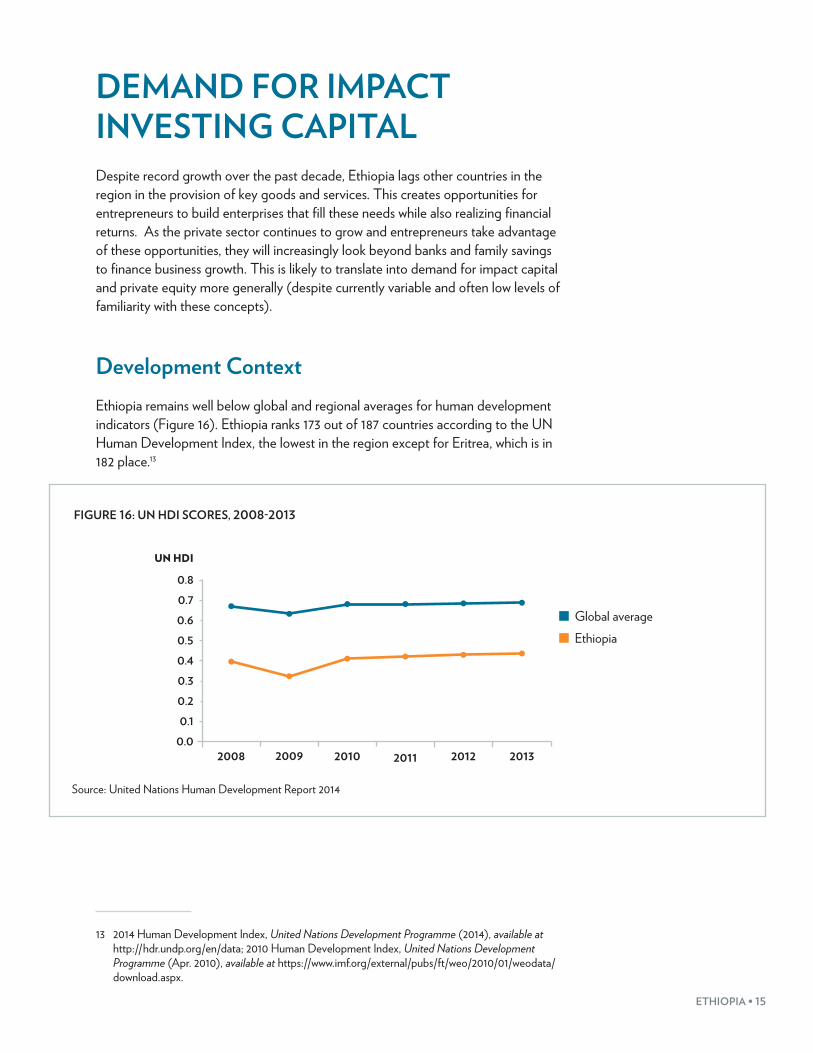
Development ContextEthiopia remains well below global and regional averages for human development indicators (Figure 16). Ethiopia ranks 173 out of 187 countries according to the UN Human Development Index, the lowest in the region except for Eritrea, which is in 182 place.13
FIGURE 16: UN HDI SCORES, 2008-2013
0.6
0.7
0.8
0.5
0.3
0.1
0.0
0.2
0.4
Global averageEthiopia
2008 2010 20122009 2011 2013
UN HDI
Source: United Nations Human Development Report 2014
13 2014 Human Development Index, United Nations Development Programme (2014), available at http://hdr.undp.org/en/data; 2010 Human Development Index, United Nations Development Programme (Apr. 2010), available at https://www.imf.org/external/pubs/ft/weo/2010/01/weodata/download.aspx.
16 • THE LANDSCAPE FOR IMPACT INVESTING IN EAST AFRICA
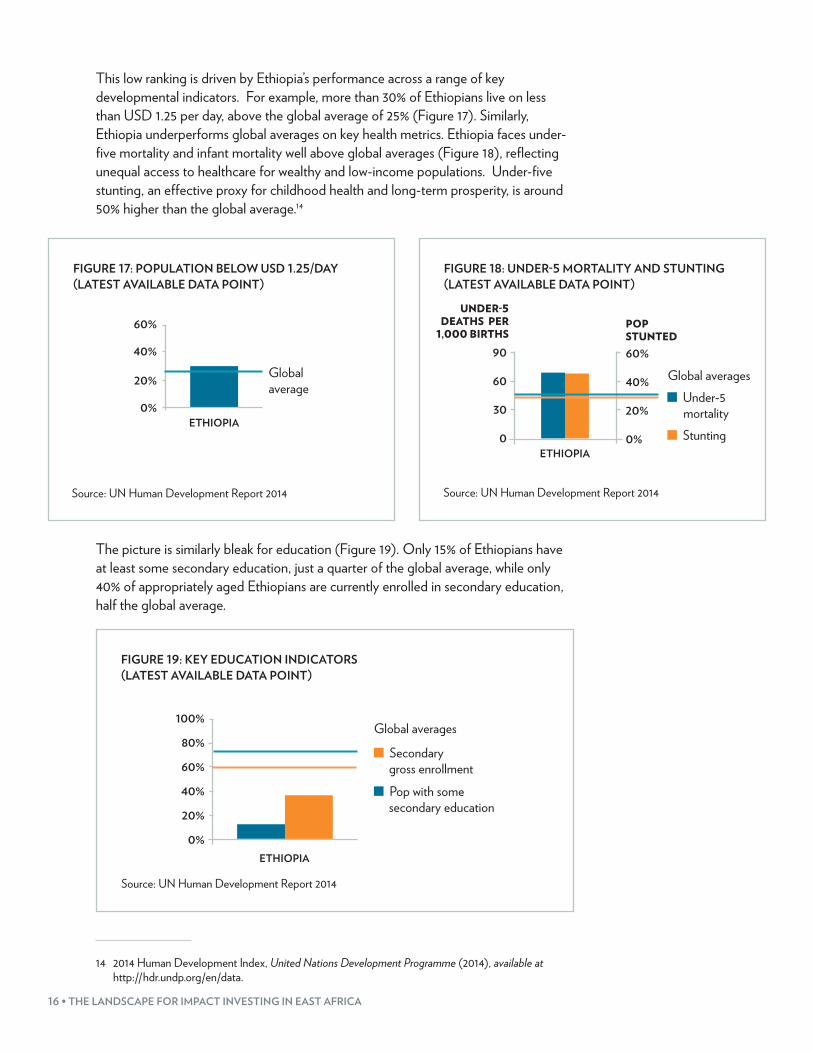
This low ranking is driven by Ethiopia’s performance across a range of key developmental indicators. For example, more than 30% of Ethiopians live on less than USD 1.25 per day, above the global average of 25% (Figure 17). Similarly, Ethiopia underperforms global averages on key health metrics. Ethiopia faces under-five mortality and infant mortality well above global averages (Figure 18), reflecting unequal access to healthcare for wealthy and low-income populations. Under-five stunting, an effective proxy for childhood health and long-term prosperity, is around 50% higher than the global average.14
FIGURE 17: POPULATION BELOW USD 1.25/DAY (LATEST AVAILABLE DATA POINT)
ETHIOPIA0%
20%
40%
60%
Global average
Source: UN Human Development Report 2014
FIGURE 18: UNDER-5 MORTALITY AND STUNTING (LATEST AVAILABLE DATA POINT)
90
60
30
0
60%
40%
20%
0%
UNDER-5 DEATHS PER
1,000 BIRTHSPOP STUNTED
ETHIOPIA
Under-5 mortality
Stunting
Global averages
Source: UN Human Development Report 2014
The picture is similarly bleak for education (Figure 19). Only 15% of Ethiopians have at least some secondary education, just a quarter of the global average, while only 40% of appropriately aged Ethiopians are currently enrolled in secondary education, half the global average.
FIGURE 19: KEY EDUCATION INDICATORS (LATEST AVAILABLE DATA POINT)
100%
ETHIOPIA
80%
60%
40%
20%
0%
Secondary gross enrollment
Pop with some secondary education
Global averages
Source: UN Human Development Report 2014
14 2014 Human Development Index, United Nations Development Programme (2014), available at http://hdr.undp.org/en/data.
ETHIOPIA • 17
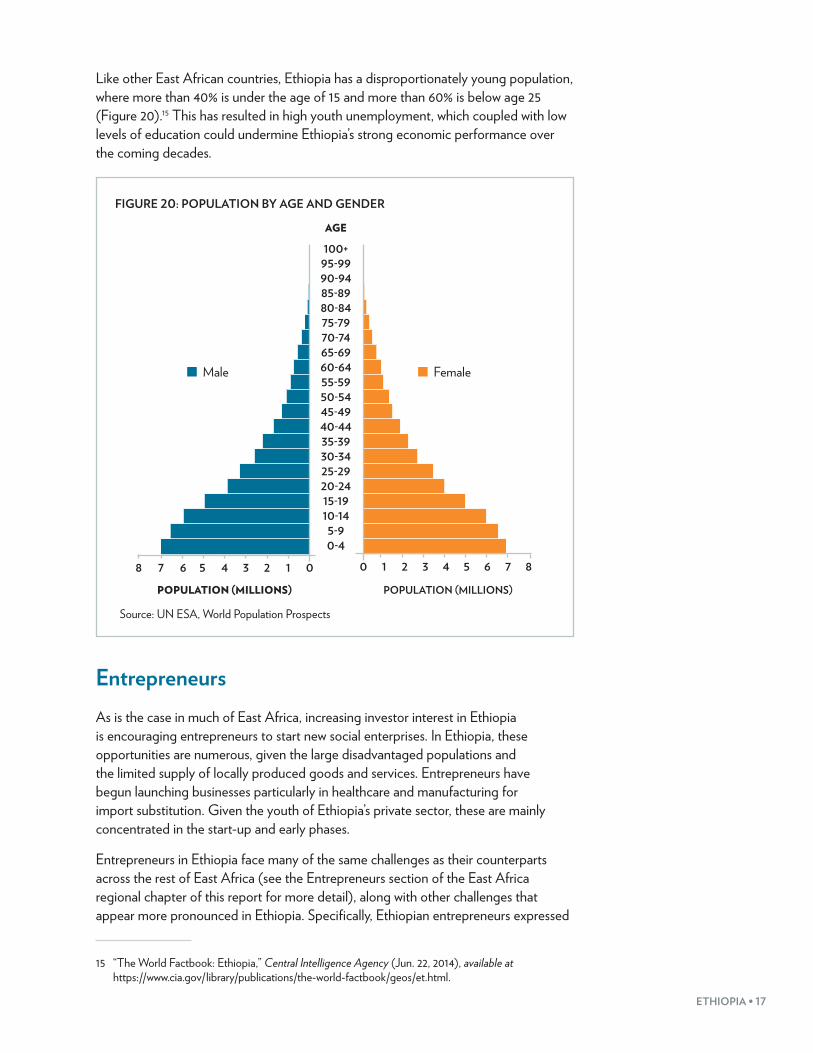
Like other East African countries, Ethiopia has a disproportionately young population, where more than 40% is under the age of 15 and more than 60% is below age 25 (Figure 20).15 This has resulted in high youth unemployment, which coupled with low levels of education could undermine Ethiopia’s strong economic performance over the coming decades.
Source: UN ESA, World Population Prospects
FIGURE 20: POPULATION BY AGE AND GENDER
AGE
5-910-1415-1920-2425-2930-3435-3940-4445-4950-5455-5960-6465-6970-7475-7980-8485-8990-9495-99100+
Male
POPULATION (MILLIONS)
8 7 6 5 4 3 2 1 0
POPULATION (MILLIONS)
876543210
Female
0-4
EntrepreneursAs is the case in much of East Africa, increasing investor interest in Ethiopia is encouraging entrepreneurs to start new social enterprises. In Ethiopia, these opportunities are numerous, given the large disadvantaged populations and the limited supply of locally produced goods and services. Entrepreneurs have begun launching businesses particularly in healthcare and manufacturing for import substitution. Given the youth of Ethiopia’s private sector, these are mainly concentrated in the start-up and early phases.
Entrepreneurs in Ethiopia face many of the same challenges as their counterparts across the rest of East Africa (see the Entrepreneurs section of the East Africa regional chapter of this report for more detail), along with other challenges that appear more pronounced in Ethiopia. Specifically, Ethiopian entrepreneurs expressed
15 “The World Factbook: Ethiopia,” Central Intelligence Agency (Jun. 22, 2014), available at https://www.cia.gov/library/publications/the-world-factbook/geos/et.html.
18 • THE LANDSCAPE FOR IMPACT INVESTING IN EAST AFRICA
frustration over impact investors’ hesitancy to provide local currency loans. With the exception of the Ethiopian Development Bank, DFIs typically denominate loans in Euro or USD, as do private-sector impact investors. At the same time, Ethiopia’s stringent foreign currency controls mean that entrepreneurs primarily have to run operations in Ethiopian Birr, leaving them exposed to currency risk. Entrepreneurs stress the positive impact that could be achieved if larger international institutions offered foreign exchange risk-sharing mechanisms for SMEs.
Investors, for their part, also face a range of challenges. As in the rest of East Africa, entrepreneurs in Ethiopia commonly struggle to create realistic forward-looking strategies and projections, a plan to use capital, and efficient operations. Entrepreneurs often run several projects simultaneously and have limited attention to devote to a single enterprise. Growth-stage companies are far fewer in Ethiopia than early-stage companies or startups. Furthermore, many of the most interesting businesses do not explicitly present themselves as social businesses, even when their potential for impact is high (see the Entrepreneurs section of the East Africa regional chapter for more detail).
Beyond pipeline development, impact investors see significant value in strong local networks to evaluate opportunities. Investing in this market, with limited legal recourse, requires trust between the impact investor and the entrepreneur. Particularly if an enterprise has been operating informally, it can be difficult to evaluate its history and trustworthiness without local social networks to provide insight on the entrepreneur. This is particularly true in Ethiopia where high linguistic and cultural barriers often present challenges to international impact investors. Deep social and professional networks that extend beyond the impact investing sector will be difficult to develop without long-term local presence.
ETHIOPIA • 19
ENABLING IMPACT INVESTING: THE ECOSYSTEMLike impact investor activity, the broader ecosystem for impact investing in Ethiopia is still developing. Ethiopia’s rapid growth presents an attractive picture for intermediaries and service providers as well as investors, but a challenging regulatory environment means ecosystem development progress may be slow.
Regulatory EnvironmentToday, Ethiopia is relatively stable politically. Though the current Prime Minister has shown guarded enthusiasm for liberalization and free-market reform,16 most government institutions are hesitant to fully engage in the private sector. Investors and entrepreneurs interviewed generally regard Ethiopia’s government as one of the more functional and benevolent in the region. Both foreign and local interviewees highlight the low levels of corruption, echoed by the World Bank’s Ease of Doing Business rankings, placing Ethiopia third in the region, just ahead of Kenya.17
Further, even though Ethiopia has a reputation for opaque government regulations and a challenging business environment, the government is reportedly growing more welcoming to private equity investments. In 2010, the Ethiopian government released its five-year Growth and Transformation Plan (GTP), which specifically emphasizes foreign investment as a key component of Ethiopia’s growth strategy. Investors active in sectors prioritized by the GTP—large-scale agriculture and manufacturing for export in particular—will receive particularly favorable incentives.
Despite these positive developments, the government retains tight control over the country’s economy and certain restrictions present challenges for investors:
• Restrictions on foreign investment: Ethiopia’s Investment Code lays out foreign investment regulations reserving the following occupations for Ethiopian nationals: banking, broadcasting, attorney and legal consultancies, indigenous medicine preparation, advertisement, domestic air transport, and packaging.18 Several sectors are further reserved for domestic investors, including several agricultural sectors, manufacturing, some consumer goods, construction, pre-secondary education, diagnostic services, capital goods leasing, and printing. The government reserves exclusive rights to postal services, grid energy transmission, passenger air transport, weapons, and telecommunications. In general, investors find it essential to build close relationships with various government bodies before placing capital, to
16 “Hailemariam Desalegn,” The Economist (Nov. 12, 2012), available at http://www.economist.com/news/21566482-hailemariam-desalegn.
17 “Economy Rankings,” The World Bank Group (Jun. 2014), available at http://www.doingbusiness.org/rankings.
18 Ethiopian Investment Agency, Ethiopian Investment Guide 2013, available at http://ethiopianembassy.be/wp-content/uploads/2014/05/Investment_Guide_2013.pdf.
20 • THE LANDSCAPE FOR IMPACT INVESTING IN EAST AFRICA
ensure regulations are understood and interpreted correctly. The minimum capital requirement for foreign investors is USD 100,000 unless accompanied by a domestic partner, in which case the minimum capital requirement is USD 60,000.
• Repatriation of profits and dividends: Although the government of Ethiopia officially allows repatriation of profits and dividends, in practice this requires careful structuring and complicated official registration of all investments with the Ethiopian Investment Authority. This remains one of the greatest hurdles cited by impact investors.
• Foreign exchange controls: The National Bank of Ethiopia (NBE) actively manages foreign currency reserves and exchange rates. The Ethiopian Birr is not freely convertible and all foreign currency transactions must be approved by the NBE.19 As a result, foreign exchange shortages are common, particularly among smaller businesses whose currency needs are typically subordinate to those of larger corporations.20
• Land ownership: All land in Ethiopia is owned directly by the state, which provides leaseholds for up to 99 years. The precise lease terms vary according to location, type of investment, and class of land.21 Investors and businesses negotiate leases with local governments, which can increase the administrative burden on cross-regional projects. The government has attempted to limit land speculation and fluctuations in leasehold prices and, with an urban land lease proclamation in 2011, it has the right to revalue any land involved in transfers of leasehold rights.22
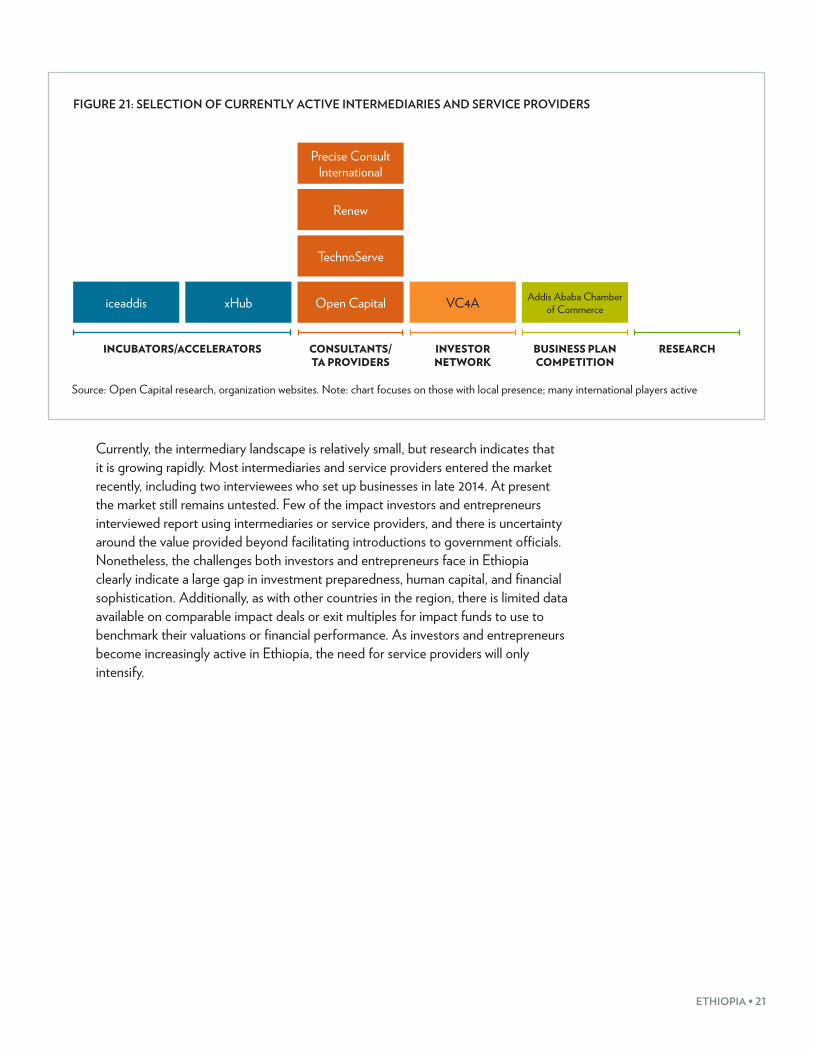
Ecosystem PlayersIntermediaries and service providers are underrepresented in Ethiopia relative to its size and economic potential. With around a dozen identified organizations (Figure 21), Ethiopia has the fewest active intermediaries and service providers of any of the five focus countries, and a small fraction of the number in Kenya. The relatively early stage of Ethiopia’s private sector has limited the overall market for service providers. Unlike in the rest of East Africa, the impact ecosystem in Ethiopia primarily comprises consultants and technical assistance (TA) providers. There are only a few incubators active in Ethiopia, despite the need for more. Some of the larger professional services firms, such as Deloitte, Ernst & Young and Grant Thornton offer regional expertise on accounting, strategy consulting, tax, and other intermediary services from their offices in Addis. However, these firms’ services are almost always more expensive than SMEs can afford. In addition to locally based consultants, there are a number of regional consulting firms that routinely support investors and entrepreneurs.
19 U.S. Department of State, Department of State: 2014 Investment Climate Statement (2014), available at http://www.state.gov/documents/organization/228594.pdf.
20 Office of the United States Trade Representative, Foreign Trade Barriers-Ethiopia, available at http://www.ustr.gov/sites/default/files/Ethiopia_0.pdf.
21 “About Ethiopia,” Federal Democratic Republic of Ethiopia: Ministry of Foreign Affairs, available at http://www.mfa.gov.et/aboutethiopia.php?pg=3&page=3.
22 U.S. Department of State, Department of State: 2014 Investment Climate Statement (2014), available at http://www.state.gov/documents/organization/228594.pdf.
ETHIOPIA • 21
FIGURE 21: SELECTION OF CURRENTLY ACTIVE INTERMEDIARIES AND SERVICE PROVIDERS
INCUBATORS/ACCELERATORS CONSULTANTS/ TA PROVIDERS
INVESTOR NETWORK
BUSINESS PLAN COMPETITION
RESEARCH
iceaddis xHub VC4AOpen Capital
TechnoServe
Renew
Precise Consult International
Addis Ababa Chamber of Commerce
Source: Open Capital research, organization websites. Note: chart focuses on those with local presence; many international players active
Currently, the intermediary landscape is relatively small, but research indicates that it is growing rapidly. Most intermediaries and service providers entered the market recently, including two interviewees who set up businesses in late 2014. At present the market still remains untested. Few of the impact investors and entrepreneurs interviewed report using intermediaries or service providers, and there is uncertainty around the value provided beyond facilitating introductions to government officials. Nonetheless, the challenges both investors and entrepreneurs face in Ethiopia clearly indicate a large gap in investment preparedness, human capital, and financial sophistication. Additionally, as with other countries in the region, there is limited data available on comparable impact deals or exit multiples for impact funds to use to benchmark their valuations or financial performance. As investors and entrepreneurs become increasingly active in Ethiopia, the need for service providers will only intensify.
22 • THE LANDSCAPE FOR IMPACT INVESTING IN EAST AFRICA
CHALLENGES AND OPPORTUNITIES FOR IMPACT INVESTORSChallengesEthiopia’s complex business environment has made it difficult for East African impact investors to effectively navigate its markets and find investable deals. The early stage of the private sector and the subsequent lack of mature businesses have further limited investor pipeline. These challenges are described in further detail below:
• Insufficient investment-ready deal flow: Many impact investors struggle to disburse capital raised, similar to elsewhere in the region. In Ethiopia, efforts to disburse capital are complicated by a large informal sector. Businesses in Ethiopia suffer from the same weaknesses seen across the region, where companies struggle to develop efficient operations, build strong strategic plans, create realistic forward-looking projections, and present a plan to use desired capital.
• Lack of understanding of private investment: Ethiopia has attracted large inflows of donor funding from multilateral aid agencies and foundations. Investors report that decades of grant funding have considerably diluted Ethiopian entrepreneurship and understanding of investment. Seeking grants remains the default for many companies, which often specifically position themselves to be attractive to grant money. Impact investors need to ensure that businesses are sufficiently educated on the private investment process and the value it can provide.
• Informal record keeping: Investors unanimously lament the informality of financial record keeping, especially in smaller businesses. Corporate bank accounts and personal bank accounts are often mingled, even for larger businesses. Most businesses are family-owned and struggle with transfer pricing between sister companies. Many observers note that investors—particularly foreign investors—are unrealistic in their expectations of financial sophistication.
• Limited experienced local talent: Impact investors struggle to find experienced local staff to support both their own investment teams and management teams within growing portfolio companies. This challenge is particularly acute when seeking finance professionals with 5-15 years of experience to serve as a company CFO or portfolio manager, despite the large number of Ethiopian university students graduating each year with degrees in accounting and finance. Even when a talented, experienced professional can be found, they often command high wages that can be challenging for impact businesses to support, especially in their early years.
• Restrictions on foreign investment: As described above, several sectors are restricted for foreign investment. This includes access to foreign currency, which can be difficult unless investments are properly registered, requiring close
ETHIOPIA • 23
collaboration with the Ethiopian Investment Authority. Although working with the government has made some investors hesitant, the general perception seems to be that working closely with the government results in successful investments and clear expectations for foreign currency availability, repatriation of profits and dividends, and ability to enter specific sectors that are government priorities.
OpportunitiesNonetheless, Ethiopia’s enormous but largely undeveloped market presents significant opportunities to impact investors, particularly those that are willing to take on earlier-stage risk. Opportunities that could generate measurable social and environmental impact for investors in Ethiopia are described below:
• Leverage technical assistance facilities for pre-investment pipeline building: Many impact investors have successfully raised technical assistance facilities for portfolio companies. Increasingly, TA funders recognize the importance of pre-investment support to get companies to the point where they can pass rigorous investment committee requirements. Targeted, tailored support, whether from the impact investor or a third party, requires an upfront commitment of resources, but in Ethiopia it has reportedly proven effective in preparing potential targets for investment and building high quality deal flow. This can reduce diligence timelines if the investor is able to increase familiarity and visibility pre-investment in order to assess the company’s operations and ability to execute.
• Increase local decision-making: Where possible, impact investors have cited significant improvements in their portfolio through local decision-making and local support. This allows investment officers to form meaningful relationships with portfolio companies, where they are empowered to respond more quickly and efficiently to changing realities on the ground.
• Source opportunities outside major cities such as Addis Ababa: Impact investors with staff on the ground in major cities report that it is easier for them to find investments than those investors based abroad, but many entrepreneurs operating in rural areas do not even spend much time in Addis Ababa, so even being based in major cities may not be sufficient. For impact investors who see these types of businesses as highly impactful, it will be increasingly necessary to build relationships beyond those made in economic centers.
Non-DFI impact investors see particularly strong opportunities in Ethiopia in the following sectors:
• Agriculture: Ethiopian smallholders have larger plot sizes than do farmers in other countries in the region, but there are still opportunities to consolidate production and significantly increase yields. Given the smallholder landscape, there are also opportunities to aggregate harvests and create consistent, high-quality supply. Aggregation could allow farmers to connect directly with export markets, which are especially attractive regionally. There is also significant potential in agricultural processing across a range of crops and considerable opportunity to advance basic farming practices which are poor, even compared to East African standards.
24 • THE LANDSCAPE FOR IMPACT INVESTING IN EAST AFRICA
• Renewable energy: Only 23% of Ethiopia’s population has access to electricity23. As a result, impact investors identify strong government support for new businesses and approaches, as Ethiopia looks to dramatically expand power generation capacity. This opens the door for large-scale projects and seems promising to improve power purchase agreements. At the same time, there are large segments of the population that lack reliable access to grid power, opening opportunities for micro-grid and off-grid solutions.
• Consumer goods for the mass market: At 20% of the population, Ethiopia’s middle-class is robust compared to many other countries in the region24. With rapid growth, impact investors believe there are increasingly attractive opportunities to supply goods and services to these consumers. These businesses often create substantial employment opportunities, which may fit impact criteria for some impact investors and often require investments in manufacturing, which align with the government’s priority sectors within the Growth and Transformation Plan.
23 World Development Indicators: Access to electricity (% of population), The World Bank Group, available at http://data.worldbank.org/indicator/EG.ELC.ACCS.ZS.
24 The Middle of the Pyramid, African Development Bank, available at: http://www.afdb.org/fileadmin/uploads/afdb/Documents/Publications/The%20Middle%20of%20the%20Pyramid_The%20Middle%20of%20the%20Pyramid.pdf.
28 • THE LANDSCAPE FOR IMPACT INVESTING IN EAST AFRICA
ABOUT THE GLOBAL IMPACT INVESTING NETWORK
The Global Impact Investing Network (GIIN®) is a nonprofit organization dedicated to increasing the scale and effectiveness of impact investing. The GIIN builds critical infrastructure and supports activities, education, and research that help accelerate the development of a coherent impact investing industry. For more information, see www.thegiin.org.
30 Broad Street, 38th Floor, New York, NY 10004 +1.646.837.7430 | [email protected] | www.thegiin.org