the landscape for impact investing in … africa landscape... · ifc | international ... 2 • the...
TRANSCRIPT
REGIONAL OVERVIEW
THE LANDSCAPE FOR IMPACT INVESTING IN EAST AFRICA
WITH SUPPORT FROM
II • THE LANDSCAPE FOR IMPACT INVESTING IN EAST AFRICA
ACKNOWLEDGMENTSThis project was funded with UK aid from the UK Government though the Department for International Development’s Impact Programme. The Impact Programme aims to catalyse the market for impact investment in sub-Saharan Africa and South Asia. www.theimpactprogramme.org.uk
The Bertha Center at the University of Cape Town contributed to this report by providing their database of active impact investors operating across sub-Saharan Africa.
We would further like to thank the tireless Open Capital Advisors (OCA) research team—Nicole DeMarsh, Rodney Carew, Getrude Okoth, Christine Njuguna, Charles Njugunah, Jerioth Mwaura, and Ann Munyua—for interviewing impact investors, eco-system players, and entrepreneurs, and for conducting rigorous data collection under tight timelines.
We would especially like to thank our interview participants–without their key insights this report would not have been possible. We include a full list of interviewees in the Appendix.
GIIN Advisory TeamAmit Bouri, [email protected] Mudaliar, [email protected] Schiff, [email protected] Gustafson, [email protected]
Open Capital AdvisorsAnnie Roberts, [email protected] Loew, [email protected] Desai, [email protected]
EAST AFRICA REGIONAL OVERVIEW • III
LIST OF COMMON TERMS AND ACRONYMS
AFD | Agence Française de Développement (French Development Agency)
AfDB | African Development Bank
BIF | Burundian Franc
BIO | Belgian Investment Company for Developing Countries
BoP | Base of the Pyramid
CEPGL | Communauté Économique des Pays des Grand Lacs (Economic Community of the Great Lakes Countries)
COMESA | The Common Market for Eastern and Southern Africa
CSR | Corporate Social Responsibility
DFI | Development Finance Institution
DFID | The Department for International Development (United Kingdom)
DRC | Democratic Republic of the Congo
EAC | East African Community
Early-stage business | Business that has begun operations but has most likely not began commercial manufacture and sales
EIB | European Investment Bank
ESG | Environmental, Social, and Governance
ETB | Ethiopian Birr
FDI | Foreign Direct Investment
FMCG | Fast-Moving Consumer Goods
FMO | Nederlandse Financierings-Maatschappij voor Ontwikkelingslanden N.V. (Netherlands Development Finance Company)
Focus countries | Countries under the study where non-DFI impact investors are most active in. Namely Ethiopia, Kenya, Rwanda, Tanzania, and Uganda
GDP | Gross Domestic Product
GEMS | Growth Enterprise Market Segment
GIIRS | Global Impact Investing Ratings System
GIZ | Gesellschaft für Internationale Zusammenarbeit (German Agency for International Cooperation)
Growth-stage business | Company has a functioning business model and its current focus is developing new products / services or expanding into new markets
HDI | Human Development Index
ICC | International Criminal Court
ICT | Information and Communication Technology
IFAD | International Fund for Agricultural Development
IFC | International Finance Corporation
IMF | International Monetary Fund
IRIS | Impact Investing and Reporting Standards
KES | Kenyan Shilling
LP | Limited Partner
Mature business | Profitable company with a developed and recognizable brand
MDG | Millennium Development Goal
MFI | Microfinance Institution
MSME | Micro, Small and Medium Enterprise
NGO | Non-Governmental Organization
Non-focus countries | Countries covered in the study but have limited non-DFI impact investor activity. Namely Burundi, Djibouti, Eritrea, Somalia, South Sudan, and Sudan
OFID | OPEC Fund for International Development
OPIC | Overseas Private Investment Corporation
PE | Private Equity
PPA | Power Purchasing Agreement
PPP | Purchasing Power Parity
PPP | Public-Private Partnership
PTA | Preferential Trade Area Bank
RDB | Rwanda Development Board
RFP | Request for Proposal
RWF | Rwandan Franc
SACCO | Savings and Credit Co-operative
SAGCOT | Southern Agricultural Corridor of Tanzania
SDG | Sudanese Pound
SGB | Small and Growing Business
SME | Small and Medium-Sized Enterprises
SOE | State-Owned Enterprises
SOS | Somali Shilling
SSP | South Sudanese Pound
TA | Technical Assistance
TIC | Tanzania Investment Centre
TZS | Tanzanian Shilling
UGX | Ugandan Shilling
UN DESA | United Nations - Department of Economic and Social Affairs
UNCTAD | United Nation’s Conference on Trade and Development
USAID | The United States Agency for International Development
VAT | Value-Added Tax
VC | Venture Capital
Venture-stage business | Sales have begun but cannot sustain the company’s operations. The business model is still being aligned with the realities on the ground
WASH | Water, Sanitation, and Hygiene
WHO | World Health Organization
EAST AFRICA VAST OPPORTUNITIES AND EXPECTATIONS FOR IMPACT DEALS IN COMING YEARS
EAST AFRICA REGIONAL OVERVIEW • 1
TABLE OF CONTENTSIntroduction . . . . . . . . . . . . . . . . . . . . . . . . . . . . . . . . . . . . . . . . . . . . . . . . . . . . . . . . . . . . . . . . . . . . . . . . . . . . . 2
Regional Context . . . . . . . . . . . . . . . . . . . . . . . . . . . . . . . . . . . . . . . . . . . . . . . . . . . . . . . . . . . . . . . . . . . . . . 3
Gross Domestic Product . . . . . . . . . . . . . . . . . . . . . . . . . . . . . . . . . . . . . . . . . . . . . . . . . . . . . . . . . 4
Foreign Direct Investment . . . . . . . . . . . . . . . . . . . . . . . . . . . . . . . . . . . . . . . . . . . . . . . . . . . . . . . 6
Inflation and Exchange Rates . . . . . . . . . . . . . . . . . . . . . . . . . . . . . . . . . . . . . . . . . . . . . . . . . . . . 7
Supply of Impact Capital . . . . . . . . . . . . . . . . . . . . . . . . . . . . . . . . . . . . . . . . . . . . . . . . . . . . . . . . . . . . . . 8
Broader Investing Landscape . . . . . . . . . . . . . . . . . . . . . . . . . . . . . . . . . . . . . . . . . . . . . . . . . . . 8
Impact Capital Disbursed . . . . . . . . . . . . . . . . . . . . . . . . . . . . . . . . . . . . . . . . . . . . . . . . . . . . . . . . 10
Investments Over Time . . . . . . . . . . . . . . . . . . . . . . . . . . . . . . . . . . . . . . . . . . . . . . . . . . . . . . . . . . 12
Sector . . . . . . . . . . . . . . . . . . . . . . . . . . . . . . . . . . . . . . . . . . . . . . . . . . . . . . . . . . . . . . . . . . . . . . . . . . . . . . . 14
Deal Size . . . . . . . . . . . . . . . . . . . . . . . . . . . . . . . . . . . . . . . . . . . . . . . . . . . . . . . . . . . . . . . . . . . . . . . . . . . 16
Instrument . . . . . . . . . . . . . . . . . . . . . . . . . . . . . . . . . . . . . . . . . . . . . . . . . . . . . . . . . . . . . . . . . . . . . . . . . . 18
Local Presence . . . . . . . . . . . . . . . . . . . . . . . . . . . . . . . . . . . . . . . . . . . . . . . . . . . . . . . . . . . . . . . . . . . . 19
Impact Tracking Standards . . . . . . . . . . . . . . . . . . . . . . . . . . . . . . . . . . . . . . . . . . . . . . . . . . . . . . 20
Indirect Investment into Impact Funds . . . . . . . . . . . . . . . . . . . . . . . . . . . . . . . . . . . . . . . . 21
Demand and Need for Impact Investing Capital . . . . . . . . . . . . . . . . . . . . . . . . . . . . . . . . . . 22
Development Context . . . . . . . . . . . . . . . . . . . . . . . . . . . . . . . . . . . . . . . . . . . . . . . . . . . . . . . . . . . 22
Entrepreneurs . . . . . . . . . . . . . . . . . . . . . . . . . . . . . . . . . . . . . . . . . . . . . . . . . . . . . . . . . . . . . . . . . . . . . . 26
Enabling Impact Investing: The Ecosystem . . . . . . . . . . . . . . . . . . . . . . . . . . . . . . . . . . . . . . . . . 27
Regulatory Environment . . . . . . . . . . . . . . . . . . . . . . . . . . . . . . . . . . . . . . . . . . . . . . . . . . . . . . . . . 27
Ecosystem Players . . . . . . . . . . . . . . . . . . . . . . . . . . . . . . . . . . . . . . . . . . . . . . . . . . . . . . . . . . . . . . . . 28
Other Service Providers . . . . . . . . . . . . . . . . . . . . . . . . . . . . . . . . . . . . . . . . . . . . . . . . . . . . . . . . . . 29
Sector Opportunities Across East Africa . . . . . . . . . . . . . . . . . . . . . . . . . . . . . . . . . . . . . . . . . . . . 30
Challenges and Opportunities for Impact Investors . . . . . . . . . . . . . . . . . . . . . . . . . . . . . . . 31
Common Challenges . . . . . . . . . . . . . . . . . . . . . . . . . . . . . . . . . . . . . . . . . . . . . . . . . . . . . . . . . . . . . 31
Common Opportunities . . . . . . . . . . . . . . . . . . . . . . . . . . . . . . . . . . . . . . . . . . . . . . . . . . . . . . . . . 32
2 • THE LANDSCAPE FOR IMPACT INVESTING IN EAST AFRICA
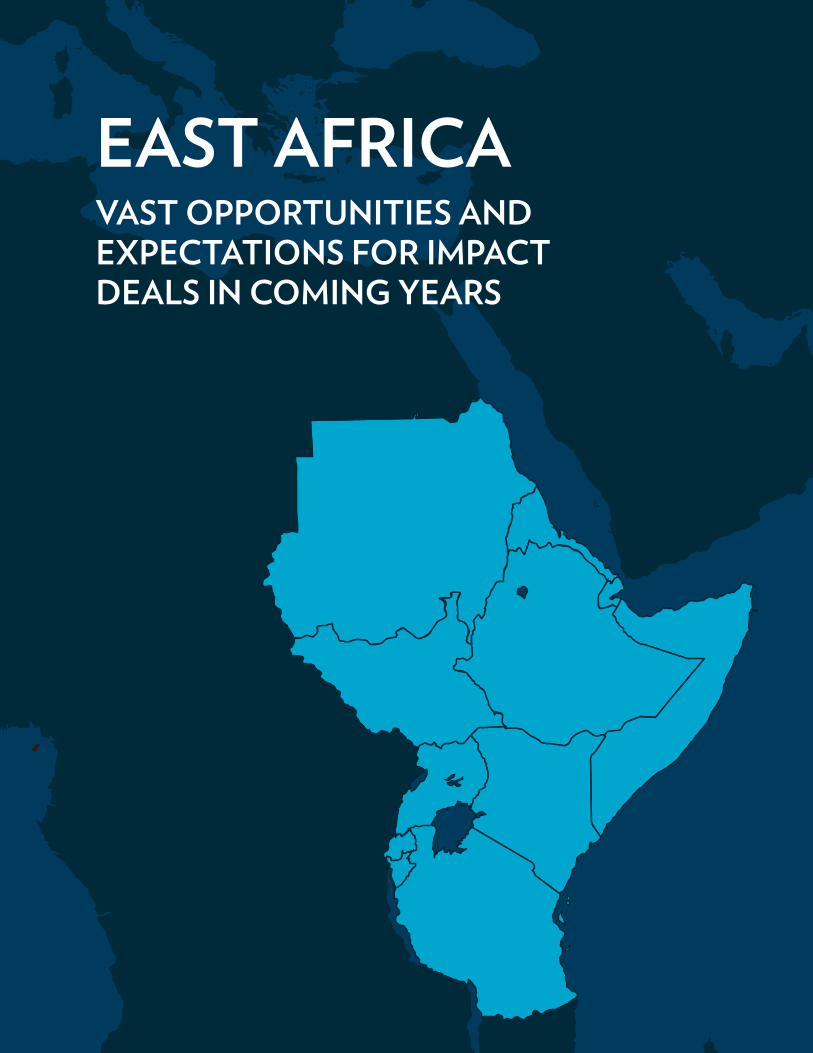
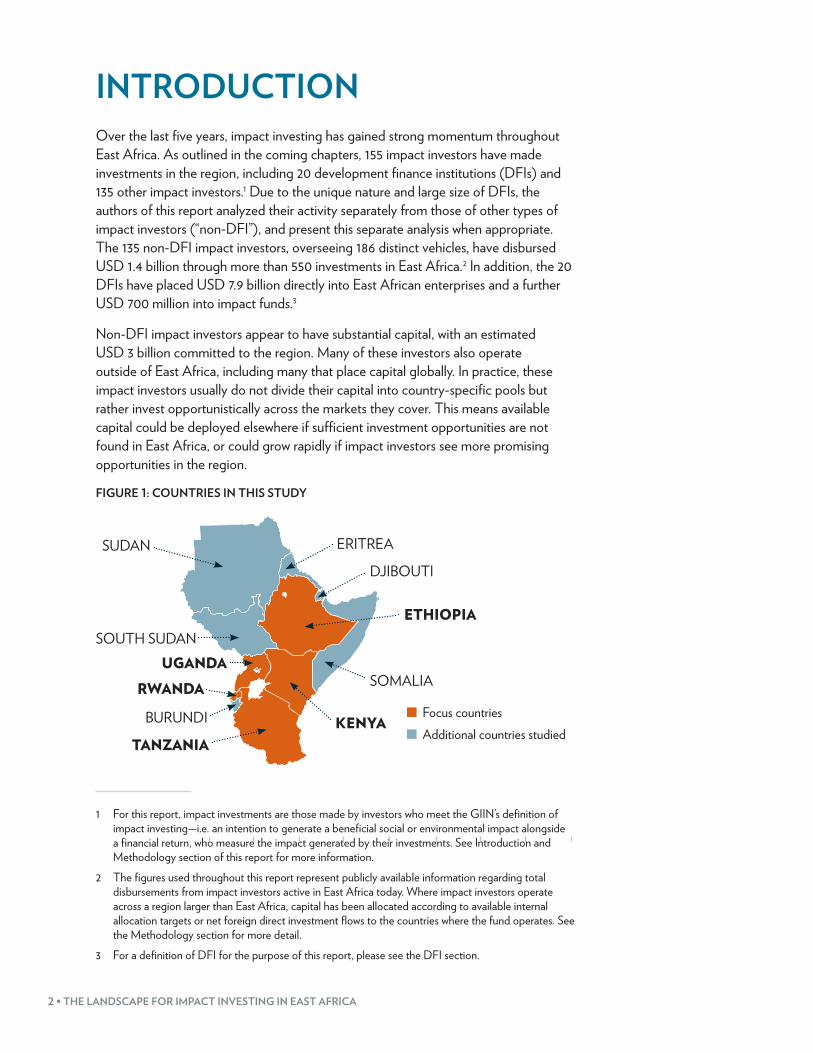
INTRODUCTIONOver the last five years, impact investing has gained strong momentum throughout East Africa. As outlined in the coming chapters, 155 impact investors have made investments in the region, including 20 development finance institutions (DFIs) and 135 other impact investors.1 Due to the unique nature and large size of DFIs, the authors of this report analyzed their activity separately from those of other types of impact investors (“non-DFI”), and present this separate analysis when appropriate. The 135 non-DFI impact investors, overseeing 186 distinct vehicles, have disbursed USD 1.4 billion through more than 550 investments in East Africa.2 In addition, the 20 DFIs have placed USD 7.9 billion directly into East African enterprises and a further USD 700 million into impact funds.3
Non-DFI impact investors appear to have substantial capital, with an estimated USD 3 billion committed to the region. Many of these investors also operate outside of East Africa, including many that place capital globally. In practice, these impact investors usually do not divide their capital into country-specific pools but rather invest opportunistically across the markets they cover. This means available capital could be deployed elsewhere if sufficient investment opportunities are not found in East Africa, or could grow rapidly if impact investors see more promising opportunities in the region.
FIGURE 1: COUNTRIES IN THIS STUDY
RWANDA
SOUTH SUDANETHIOPIA
KENYATANZANIA
SOMALIA
ERITREA
DJIBOUTI
UGANDA
BURUNDI
SUDAN
Focus countriesAdditional countries studied
1 For this report, impact investments are those made by investors who meet the GIIN’s definition of impact investing—i.e. an intention to generate a beneficial social or environmental impact alongside a financial return, who measure the impact generated by their investments. See Introduction and Methodology section of this report for more information.
2 The figures used throughout this report represent publicly available information regarding total disbursements from impact investors active in East Africa today. Where impact investors operate across a region larger than East Africa, capital has been allocated according to available internal allocation targets or net foreign direct investment flows to the countries where the fund operates. See the Methodology section for more detail.
3 For a definition of DFI for the purpose of this report, please see the DFI section.
EAST AFRICA REGIONAL OVERVIEW • 3
REGIONAL CONTEXTMany stakeholders see great opportunities for regional trading blocs, though progress to implement recommended policies has been slow. The East African Community (EAC) includes Burundi, Kenya, Rwanda, Tanzania, and Uganda, and intends to create a single trading bloc with integrated immigration policies, a single currency, and free internal trade.4 Though the EAC has made progress—for example, launching an integrated East Africa tourist visa in 20145—these changes are not well-known, and progress towards a unified currency and free trade proceeds slowly.6
Beyond the EAC, several countries studied for this report participate in the Common Market for Eastern and Southern Africa (COMESA), including Burundi, Djibouti, Eritrea, Ethiopia, Kenya, Rwanda, South Sudan, Sudan, and Uganda. COMESA also aims to create free trade between members and progress towards a unified visa, among other customs and trade treaties.7 Tanzania is also a member of the Southern African Development Community.8
Despite regional trade treaties, countries in East Africa operate and govern largely independently. Each country has a different political context, functions with an independent regulatory system, is culturally unique, and presents different opportunities for investment. Successful operations in one country do not necessarily transfer to another and each new context must be considered separately. At the same time, these 11 unique governments represent a combined 300 million citizens, presenting a large opportunity for social enterprises9 that are able to successfully expand and reach large swaths of the global population.10
4 Korwa G. Adar, Centre for Studies on Federalism, East Africa Community (2011), available at http://www.internationaldemocracywatch.org/attachments/458_EAC-adar.pdf.
5 Ismail Musa Ladu & Risdel Kasasira, “EAC Single Tourist Visa Launched,” Daily Monitor (Feb. 21, 2014), available at http://www.monitor.co.ug/News/National/EAC-single-tourist-visa-launched/-/688334/2215296/-/usri45z/-/index.html.
6 Masafumi Yabara, The International Monetary Fund, Capital Market Integration: Progress Ahead of the East African Community Monetary Union (2012), available at http://www.imf.org/external/pubs/ft/wp/2012/wp1218.pdf.
7 “COMESA Strategy,” COMESA, available at http://about.comesa.int/index.php?option=com_content&view=article&id=78&Itemid=118.
8 “Member States,” Southern African Development Community, available at http://www.sadc.int/member-states/.
9 For this report, social enterprises are defined to be businesses that seek to measure impact as well as generate a financial return.
10 Population: Total, The World Bank Group, available at http://data.worldbank.org/indicator/SP.POP.TOTL; Note that population estimates are not available for South Sudan or Somalia.
4 • THE LANDSCAPE FOR IMPACT INVESTING IN EAST AFRICA
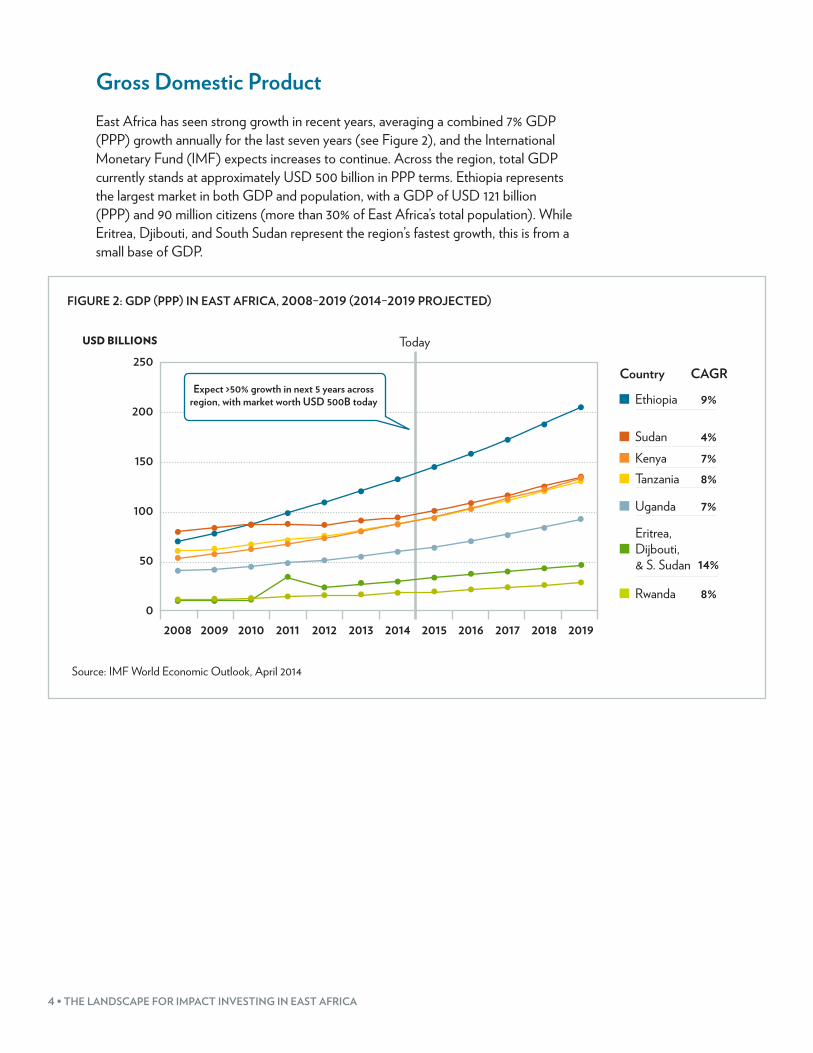
Gross Domestic ProductEast Africa has seen strong growth in recent years, averaging a combined 7% GDP (PPP) growth annually for the last seven years (see Figure 2), and the International Monetary Fund (IMF) expects increases to continue. Across the region, total GDP currently stands at approximately USD 500 billion in PPP terms. Ethiopia represents the largest market in both GDP and population, with a GDP of USD 121 billion (PPP) and 90 million citizens (more than 30% of East Africa’s total population). While Eritrea, Djibouti, and South Sudan represent the region’s fastest growth, this is from a small base of GDP.
FIGURE 2: GDP (PPP) IN EAST AFRICA, 2008–2019 (2014–2019 PROJECTED)
USD BILLIONS
Country
100
150
200
250
Expect >50% growth in next 5 years across region, with market worth USD 500B today
2008 2009 2010 2011 2012 2013 2014 2015 2016 2017 2018 2019
50
0
Today
CAGR
Eritrea, Dijbouti, & S. Sudan 14%
Ethiopia 9%
Sudan 4%Kenya 7%Tanzania 8%
Uganda 7%
Rwanda 8%
Source: IMF World Economic Outlook, April 2014
EAST AFRICA REGIONAL OVERVIEW • 5
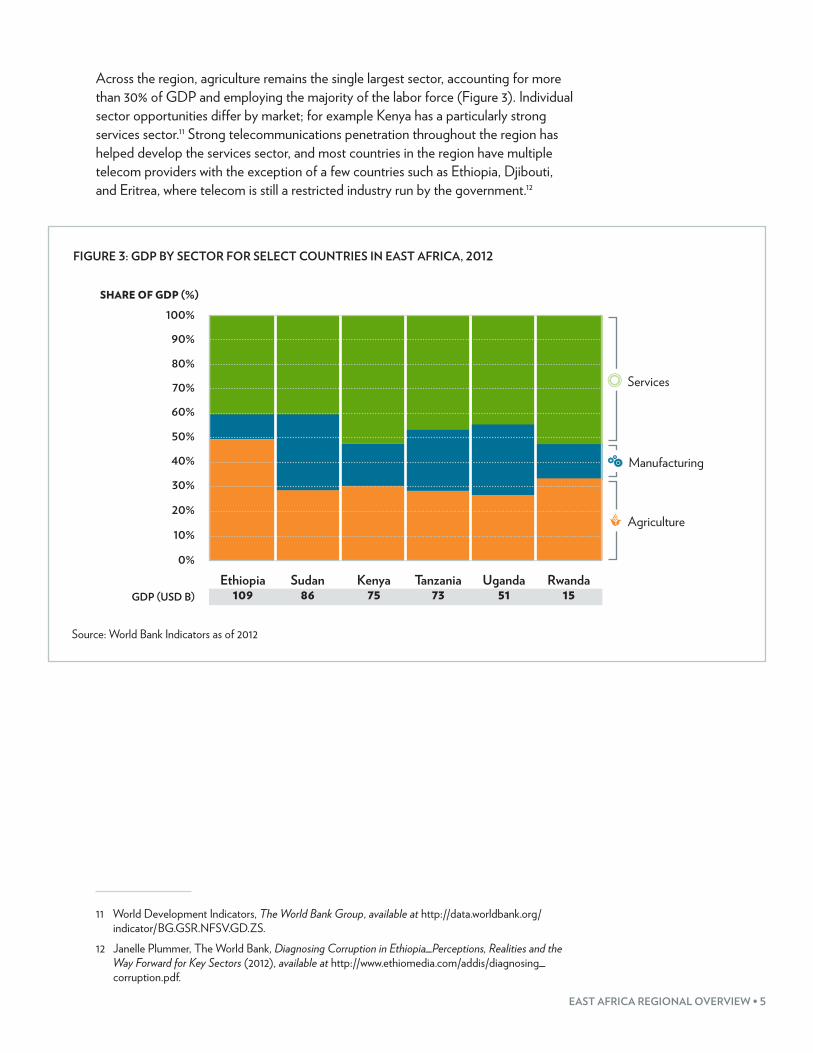
Across the region, agriculture remains the single largest sector, accounting for more than 30% of GDP and employing the majority of the labor force (Figure 3). Individual sector opportunities differ by market; for example Kenya has a particularly strong services sector.11 Strong telecommunications penetration throughout the region has helped develop the services sector, and most countries in the region have multiple telecom providers with the exception of a few countries such as Ethiopia, Djibouti, and Eritrea, where telecom is still a restricted industry run by the government.12
FIGURE 3: GDP BY SECTOR FOR SELECT COUNTRIES IN EAST AFRICA, 2012
100%
80%
60%
40%
20%
10%
0%
30%
50%
70%
90%
Kenya 75
Uganda 51
Tanzania 73
Sudan 86
Ethiopia 109
Rwanda 15GDP (USD B)
SHARE OF GDP (%)
Services
Manufacturing
Agriculture
Source: World Bank Indicators as of 2012
11 World Development Indicators, The World Bank Group, available at http://data.worldbank.org/indicator/BG.GSR.NFSV.GD.ZS.
12 Janelle Plummer, The World Bank, Diagnosing Corruption in Ethiopia_Perceptions, Realities and the Way Forward for Key Sectors (2012), available at http://www.ethiomedia.com/addis/diagnosing_corruption.pdf.
6 • THE LANDSCAPE FOR IMPACT INVESTING IN EAST AFRICA
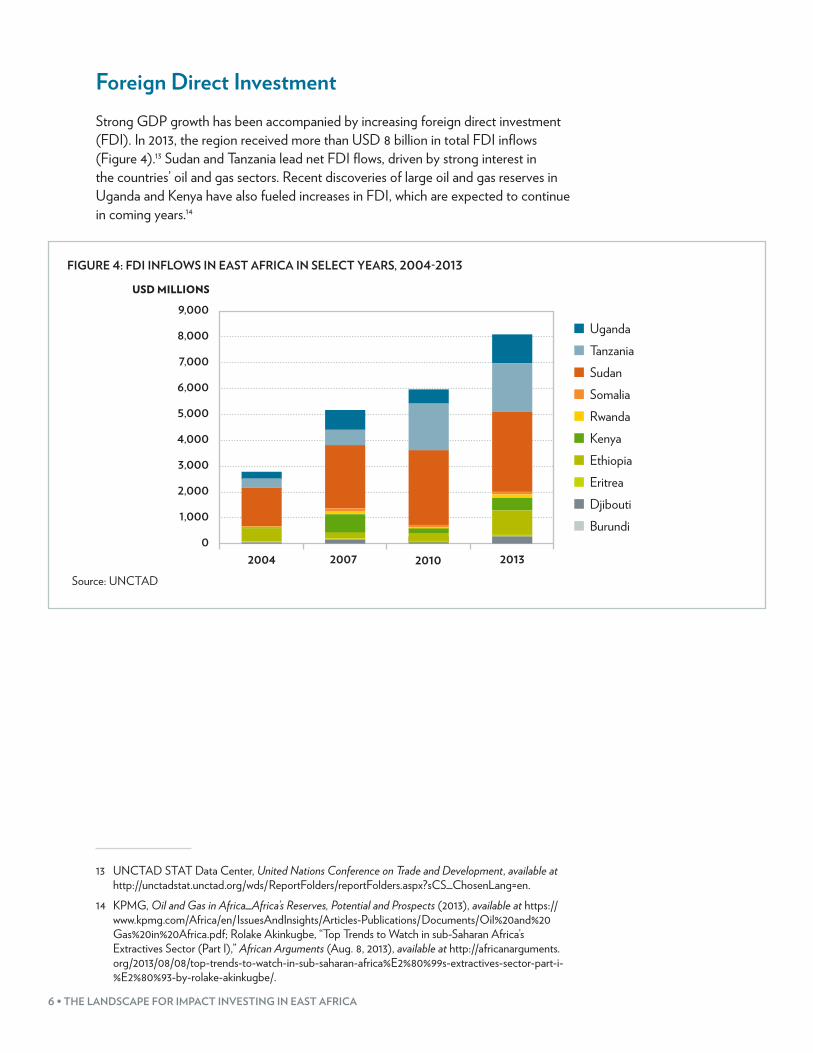
Foreign Direct InvestmentStrong GDP growth has been accompanied by increasing foreign direct investment (FDI). In 2013, the region received more than USD 8 billion in total FDI inflows (Figure 4).13 Sudan and Tanzania lead net FDI flows, driven by strong interest in the countries’ oil and gas sectors. Recent discoveries of large oil and gas reserves in Uganda and Kenya have also fueled increases in FDI, which are expected to continue in coming years.14
FIGURE 4: FDI INFLOWS IN EAST AFRICA IN SELECT YEARS, 2004-2013
2004 2007 2010 2013
1,000
2,000
3,000
4,000
5,000
6,000
7,000
8,000
9,000
0
UgandaTanzaniaSudanSomaliaRwandaKenyaEthiopiaEritreaDjiboutiBurundi
USD MILLIONS
Source: UNCTAD
13 UNCTAD STAT Data Center, United Nations Conference on Trade and Development, available at http://unctadstat.unctad.org/wds/ReportFolders/reportFolders.aspx?sCS_ChosenLang=en.
14 KPMG, Oil and Gas in Africa_Africa’s Reserves, Potential and Prospects (2013), available at https://www.kpmg.com/Africa/en/IssuesAndInsights/Articles-Publications/Documents/Oil%20and%20Gas%20in%20Africa.pdf; Rolake Akinkugbe, “Top Trends to Watch in sub-Saharan Africa’s Extractives Sector (Part I),” African Arguments (Aug. 8, 2013), available at http://africanarguments.org/2013/08/08/top-trends-to-watch-in-sub-saharan-africa%E2%80%99s-extractives-sector-part-i-%E2%80%93-by-rolake-akinkugbe/.
EAST AFRICA REGIONAL OVERVIEW • 7
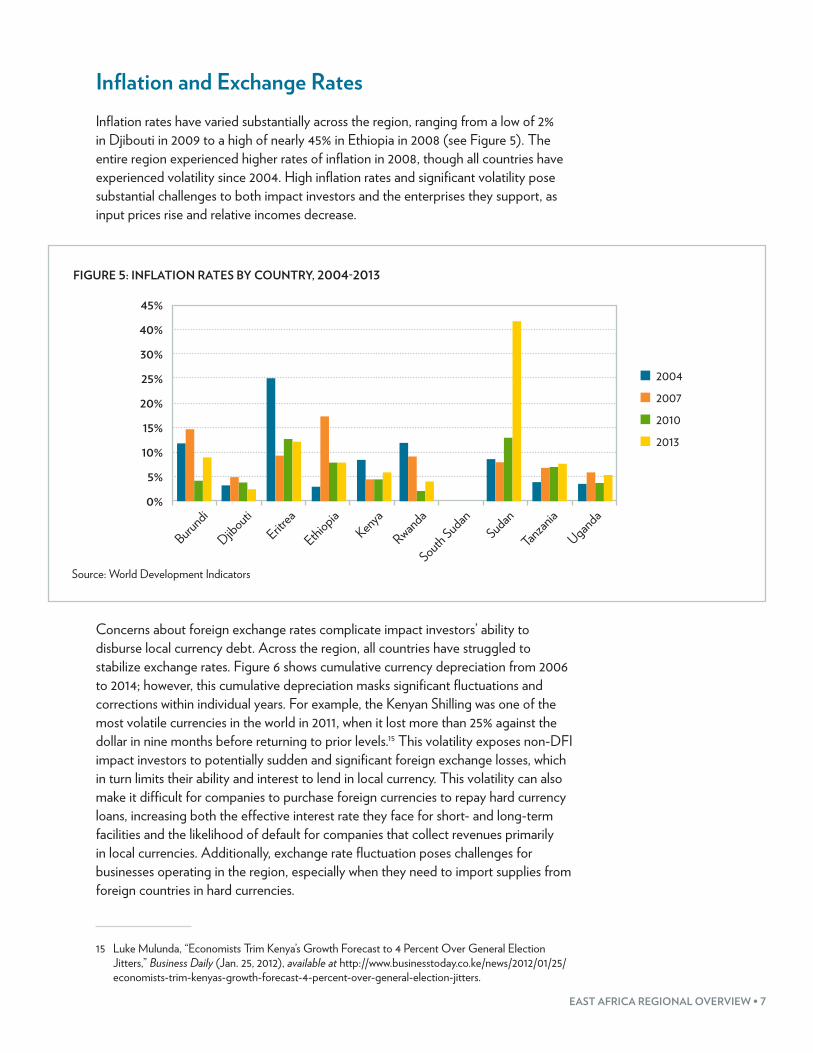
Inflation and Exchange RatesInflation rates have varied substantially across the region, ranging from a low of 2% in Djibouti in 2009 to a high of nearly 45% in Ethiopia in 2008 (see Figure 5). The entire region experienced higher rates of inflation in 2008, though all countries have experienced volatility since 2004. High inflation rates and significant volatility pose substantial challenges to both impact investors and the enterprises they support, as input prices rise and relative incomes decrease.
FIGURE 5: INFLATION RATES BY COUNTRY, 2004-2013
2004200720102013
Kenya
Uganda
Tanzan
ia
Rwanda
South SudanSudan
Djibouti
BurundiEritr
ea
Ethiopia0%
5%
10%
15%
20%
25%
30%
40%
45%
Source: World Development Indicators
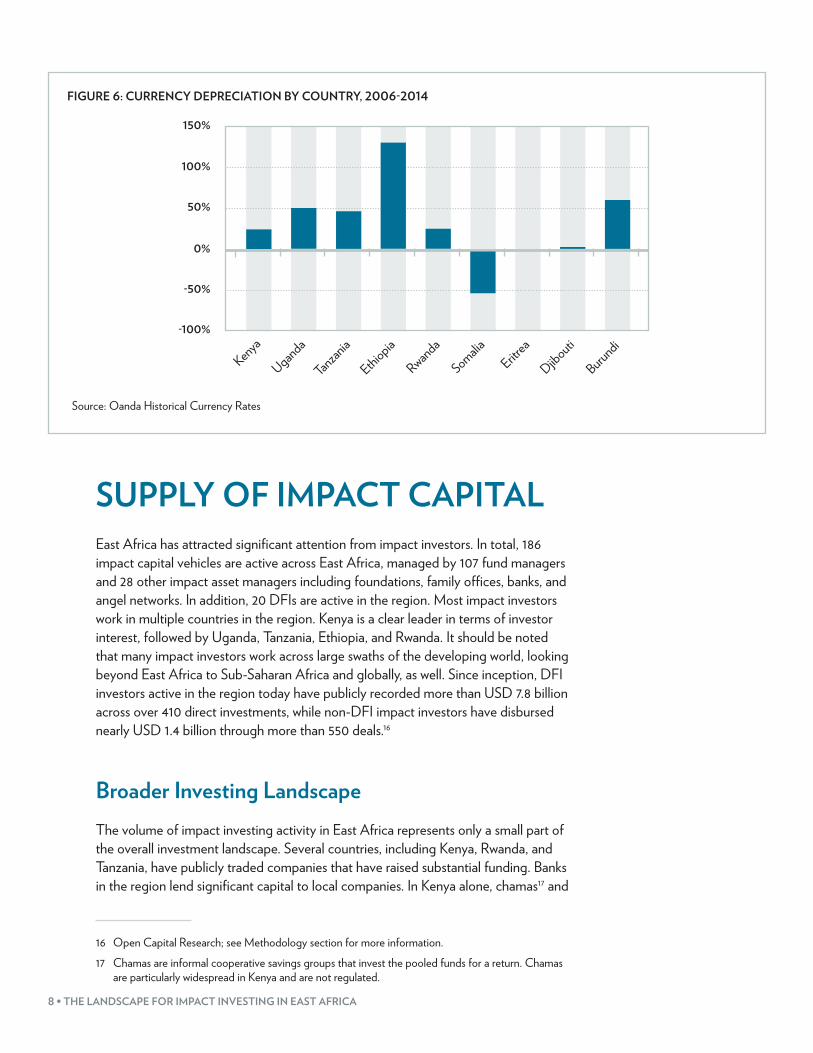
Concerns about foreign exchange rates complicate impact investors’ ability to disburse local currency debt. Across the region, all countries have struggled to stabilize exchange rates. Figure 6 shows cumulative currency depreciation from 2006 to 2014; however, this cumulative depreciation masks significant fluctuations and corrections within individual years. For example, the Kenyan Shilling was one of the most volatile currencies in the world in 2011, when it lost more than 25% against the dollar in nine months before returning to prior levels.15 This volatility exposes non-DFI impact investors to potentially sudden and significant foreign exchange losses, which in turn limits their ability and interest to lend in local currency. This volatility can also make it difficult for companies to purchase foreign currencies to repay hard currency loans, increasing both the effective interest rate they face for short- and long-term facilities and the likelihood of default for companies that collect revenues primarily in local currencies. Additionally, exchange rate fluctuation poses challenges for businesses operating in the region, especially when they need to import supplies from foreign countries in hard currencies.
15 Luke Mulunda, “Economists Trim Kenya’s Growth Forecast to 4 Percent Over General Election Jitters,” Business Daily (Jan. 25, 2012), available at http://www.businesstoday.co.ke/news/2012/01/25/economists-trim-kenyas-growth-forecast-4-percent-over-general-election-jitters.
8 • THE LANDSCAPE FOR IMPACT INVESTING IN EAST AFRICA
FIGURE 6: CURRENCY DEPRECIATION BY COUNTRY, 2006-2014
Kenya
Uganda
Tanzan
ia
Ethiopia
Rwanda
SomaliaEritr
ea
Djibouti
Burundi
150%
100%
50%
-50%
-100%
0%
Source: Oanda Historical Currency Rates
SUPPLY OF IMPACT CAPITALEast Africa has attracted significant attention from impact investors. In total, 186 impact capital vehicles are active across East Africa, managed by 107 fund managers and 28 other impact asset managers including foundations, family offices, banks, and angel networks. In addition, 20 DFIs are active in the region. Most impact investors work in multiple countries in the region. Kenya is a clear leader in terms of investor interest, followed by Uganda, Tanzania, Ethiopia, and Rwanda. It should be noted that many impact investors work across large swaths of the developing world, looking beyond East Africa to Sub-Saharan Africa and globally, as well. Since inception, DFI investors active in the region today have publicly recorded more than USD 7.8 billion across over 410 direct investments, while non-DFI impact investors have disbursed nearly USD 1.4 billion through more than 550 deals.16
Broader Investing Landscape The volume of impact investing activity in East Africa represents only a small part of the overall investment landscape. Several countries, including Kenya, Rwanda, and Tanzania, have publicly traded companies that have raised substantial funding. Banks in the region lend significant capital to local companies. In Kenya alone, chamas17 and
16 Open Capital Research; see Methodology section for more information.17 Chamas are informal cooperative savings groups that invest the pooled funds for a return. Chamas
are particularly widespread in Kenya and are not regulated.
EAST AFRICA REGIONAL OVERVIEW • 9
SACCOs18 have more capital under management than all non-DFI impact investors in East Africa.
However, there remains a substantial gap in the market that impact investing looks to fill. Public markets have rigid listing requirements and limited liquidity while commercial banks in the region remain risk averse and are often unwilling to lend to early-stage ventures (which represent a large share of businesses in the region, particularly those of interest to impact investors). When willing to lend, commercial banks in East Africa have high collateral requirements, often exceeding 100%, which many early-stage enterprises are unable to meet.
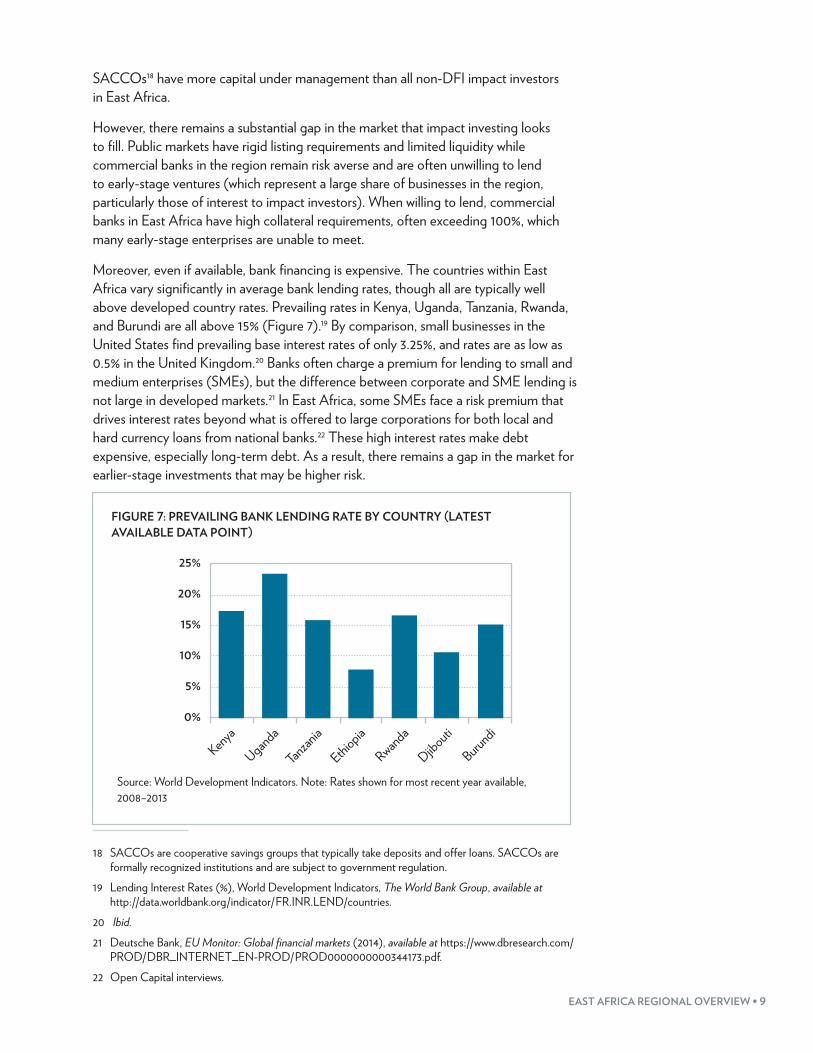
Moreover, even if available, bank financing is expensive. The countries within East Africa vary significantly in average bank lending rates, though all are typically well above developed country rates. Prevailing rates in Kenya, Uganda, Tanzania, Rwanda, and Burundi are all above 15% (Figure 7).19 By comparison, small businesses in the United States find prevailing base interest rates of only 3.25%, and rates are as low as 0.5% in the United Kingdom.20 Banks often charge a premium for lending to small and medium enterprises (SMEs), but the difference between corporate and SME lending is not large in developed markets.21 In East Africa, some SMEs face a risk premium that drives interest rates beyond what is offered to large corporations for both local and hard currency loans from national banks.22 These high interest rates make debt expensive, especially long-term debt. As a result, there remains a gap in the market for earlier-stage investments that may be higher risk.
FIGURE 7: PREVAILING BANK LENDING RATE BY COUNTRY (LATEST AVAILABLE DATA POINT)
Kenya
Uganda
Tanzan
ia
Ethiopia
Rwanda
Djibouti
Burundi
25%
20%
15%
10%
5%
0%
Source: World Development Indicators. Note: Rates shown for most recent year available, 2008–2013
18 SACCOs are cooperative savings groups that typically take deposits and offer loans. SACCOs are formally recognized institutions and are subject to government regulation.
19 Lending Interest Rates (%), World Development Indicators, The World Bank Group, available at http://data.worldbank.org/indicator/FR.INR.LEND/countries.
20 Ibid.21 Deutsche Bank, EU Monitor: Global financial markets (2014), available at https://www.dbresearch.com/
PROD/DBR_INTERNET_EN-PROD/PROD0000000000344173.pdf.22 Open Capital interviews.
10 • THE LANDSCAPE FOR IMPACT INVESTING IN EAST AFRICA
Local banks, chamas, SACCOs, and other conventional sources also do not have any specific impact focus, but rather concentrate only on financial returns, often investing in real estate, deposits, and treasury bonds. Impact investors are the only institutionalized funders who intentionally seek to push development and therefore proactively seek innovative solutions in difficult sectors or circumstances that conventional investors would otherwise overlook or dismiss.
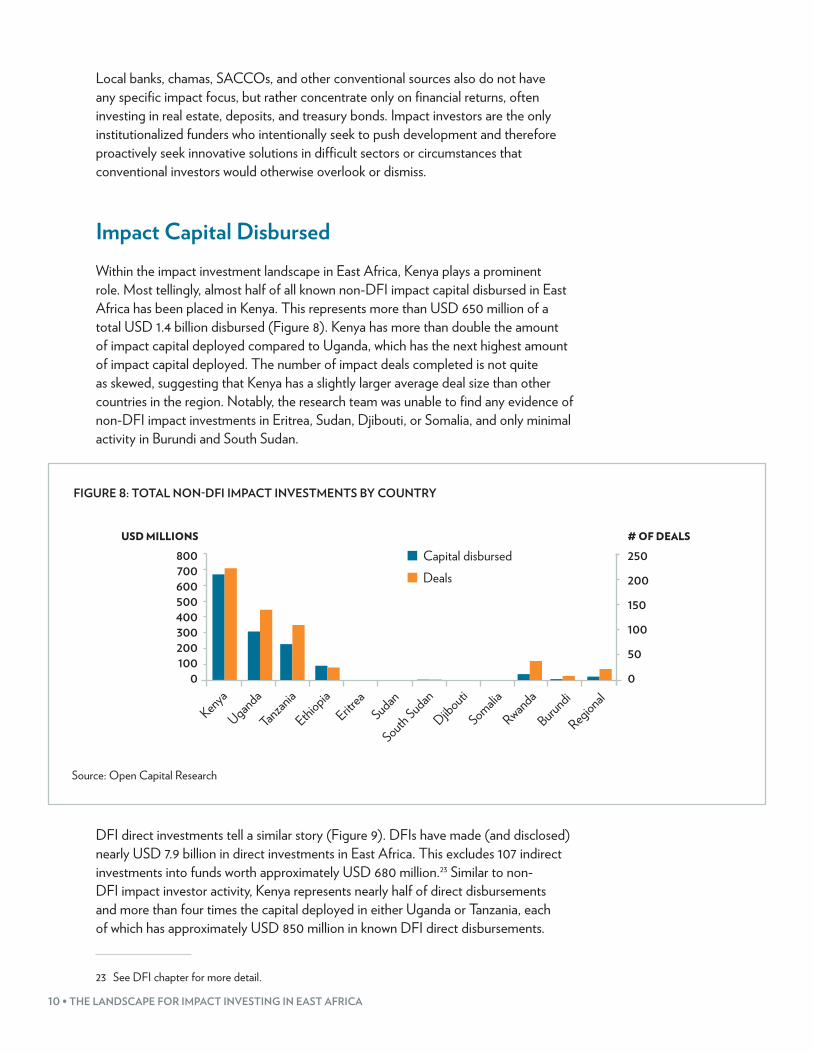
Impact Capital DisbursedWithin the impact investment landscape in East Africa, Kenya plays a prominent role. Most tellingly, almost half of all known non-DFI impact capital disbursed in East Africa has been placed in Kenya. This represents more than USD 650 million of a total USD 1.4 billion disbursed (Figure 8). Kenya has more than double the amount of impact capital deployed compared to Uganda, which has the next highest amount of impact capital deployed. The number of impact deals completed is not quite as skewed, suggesting that Kenya has a slightly larger average deal size than other countries in the region. Notably, the research team was unable to find any evidence of non-DFI impact investments in Eritrea, Sudan, Djibouti, or Somalia, and only minimal activity in Burundi and South Sudan.
FIGURE 8: TOTAL NON-DFI IMPACT INVESTMENTS BY COUNTRY
USD MILLIONS # OF DEALS
250800700600500
300
1000
200
400150
50
0
100
200
Kenya
Uganda
Tanzan
iaEritr
eaSudan
South Sudan
Djibouti
Rwanda
Burundi
Ethiopia
Somalia
Regional
Capital disbursedDeals
Source: Open Capital Research
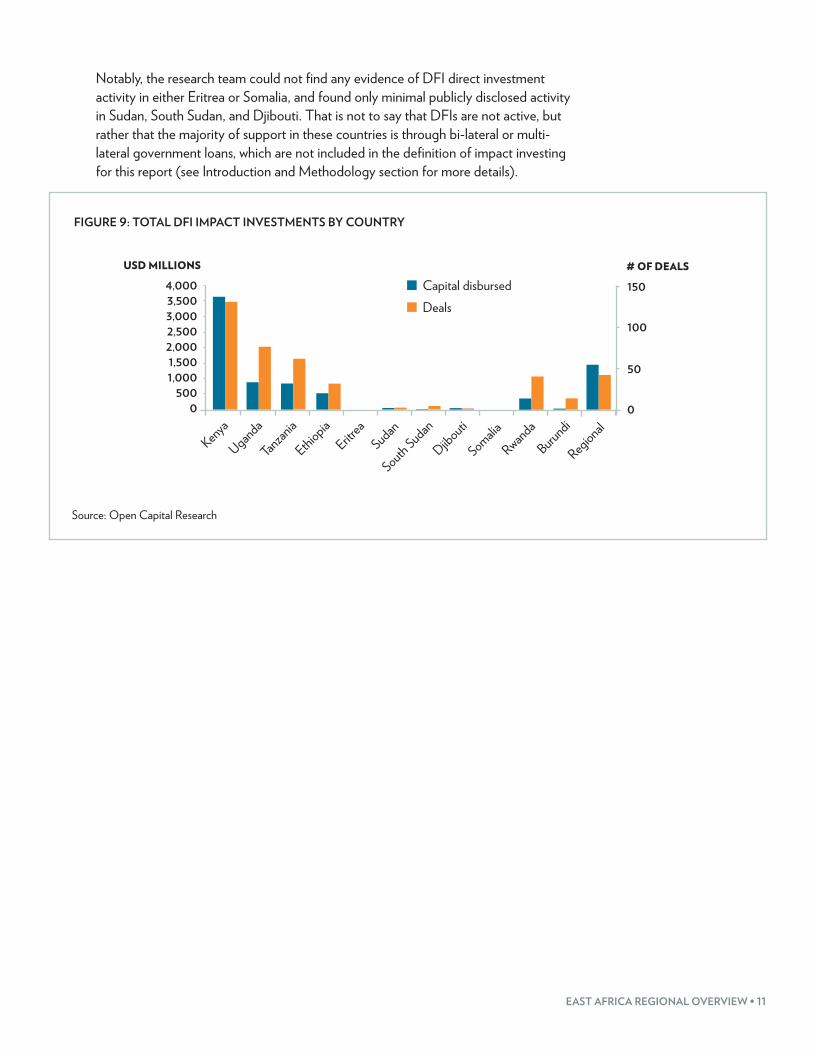
DFI direct investments tell a similar story (Figure 9). DFIs have made (and disclosed) nearly USD 7.9 billion in direct investments in East Africa. This excludes 107 indirect investments into funds worth approximately USD 680 million.23 Similar to non-DFI impact investor activity, Kenya represents nearly half of direct disbursements and more than four times the capital deployed in either Uganda or Tanzania, each of which has approximately USD 850 million in known DFI direct disbursements.
23 See DFI chapter for more detail.
EAST AFRICA REGIONAL OVERVIEW • 11
Notably, the research team could not find any evidence of DFI direct investment activity in either Eritrea or Somalia, and found only minimal publicly disclosed activity in Sudan, South Sudan, and Djibouti. That is not to say that DFIs are not active, but rather that the majority of support in these countries is through bi-lateral or multi-lateral government loans, which are not included in the definition of impact investing for this report (see Introduction and Methodology section for more details).
FIGURE 9: TOTAL DFI IMPACT INVESTMENTS BY COUNTRY
Eritrea
Kenya
4,0003,5003,0002,500
1,500
5000
1,000
2,000
150
100
50
0
Ethiopia
Tanzan
ia
RwandaSudan
South Sudan
Burundi
Djibouti
SomaliaUganda
Regional
Capital disbursedDeals
USD MILLIONS # OF DEALS
Source: Open Capital Research

12 • THE LANDSCAPE FOR IMPACT INVESTING IN EAST AFRICA
Investments Over TimeNon-DFI impact investors have been actively investing in East Africa for more than a decade, but investments only began to pick up after 2010 (Figure 10), though the large number of deals with undisclosed details prevents additional conclusions about non-DFI impact investor activity. Despite the limited data, this trend aligns with impressions from non-DFI impact investors, who report interest in impact investing in East Africa gaining momentum in 2010 and beyond.24
FIGURE 10: NON-DFI IMPACT INVESTMENTS BY YEAR
Capital disbursedDeals
Pre-2004
20042005
20072008
20092011
20122006
2010 20132014
180160140120
80
200
60
100
40
USD MILLIONS
60
50
40
30
0
10
20
# OF DEALS
Source: Open Capital Research. Note: 2014 represents partial data as of October. Also, 274 deals, totaling approx. USD 586 million, with unknown year have been omitted
With the data available (274 deals with unknown year have been omitted), it appears that average deal sizes increased from 2011 onwards, as the amount of capital disbursed increased faster than the number of deals. The decline for 2014 is likely the product of incomplete data reporting at the time of data collection in late 2014, as many try to close final investments before the end of the calendar year.
24 Interviews with non-DFI impact investors conducted for this study.
EAST AFRICA REGIONAL OVERVIEW • 13
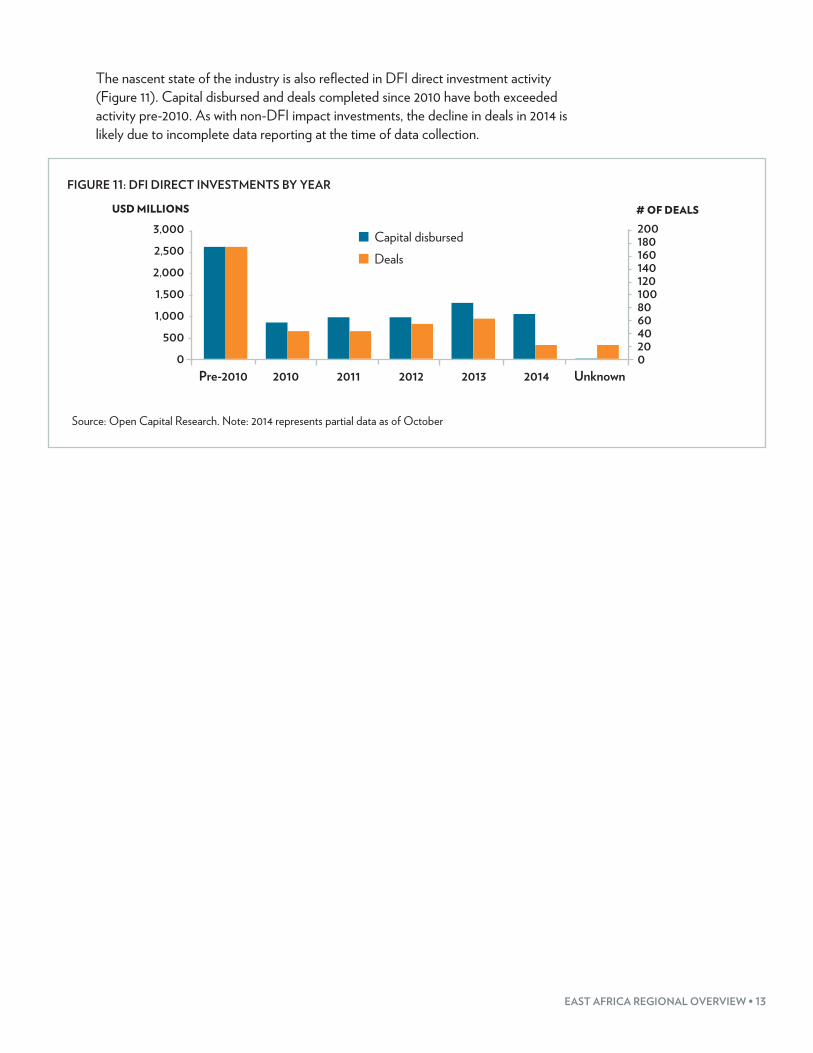
The nascent state of the industry is also reflected in DFI direct investment activity (Figure 11). Capital disbursed and deals completed since 2010 have both exceeded activity pre-2010. As with non-DFI impact investments, the decline in deals in 2014 is likely due to incomplete data reporting at the time of data collection.
FIGURE 11: DFI DIRECT INVESTMENTS BY YEAR
3,000
2,500
1,500
500
0
1,000
2,000
Capital disbursedDeals
USD MILLIONS # OF DEALS
Pre-2010 2010 2011 2012 2013 2014 Unknown
200180160140120100806040
020
Source: Open Capital Research. Note: 2014 represents partial data as of October
14 • THE LANDSCAPE FOR IMPACT INVESTING IN EAST AFRICA
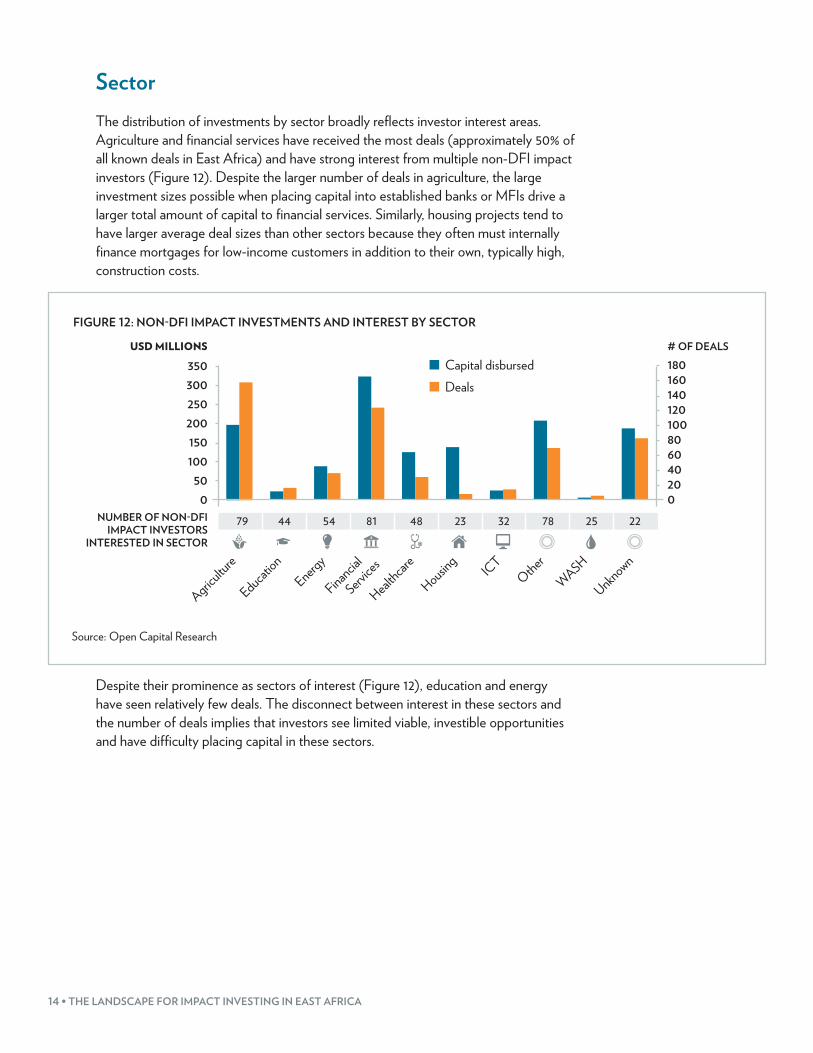
SectorThe distribution of investments by sector broadly reflects investor interest areas. Agriculture and financial services have received the most deals (approximately 50% of all known deals in East Africa) and have strong interest from multiple non-DFI impact investors (Figure 12). Despite the larger number of deals in agriculture, the large investment sizes possible when placing capital into established banks or MFIs drive a larger total amount of capital to financial services. Similarly, housing projects tend to have larger average deal sizes than other sectors because they often must internally finance mortgages for low-income customers in addition to their own, typically high, construction costs.
FIGURE 12: NON-DFI IMPACT INVESTMENTS AND INTEREST BY SECTOR
USD MILLIONS
300350
250
150
500
100
200
# OF DEALS180160140120100806040
020
Capital disbursedDeals
Agriculture
Education
Energy
Financial
Service
s
Healthcar
eICT
Other
Housing
WASH
Unknown
NUMBER OF NON-DFI IMPACT INVESTORS
INTERESTED IN SECTOR
79 44 54 81 48 23 32 78 25 22
Source: Open Capital Research
Despite their prominence as sectors of interest (Figure 12), education and energy have seen relatively few deals. The disconnect between interest in these sectors and the number of deals implies that investors see limited viable, investible opportunities and have difficulty placing capital in these sectors.
EAST AFRICA REGIONAL OVERVIEW • 15
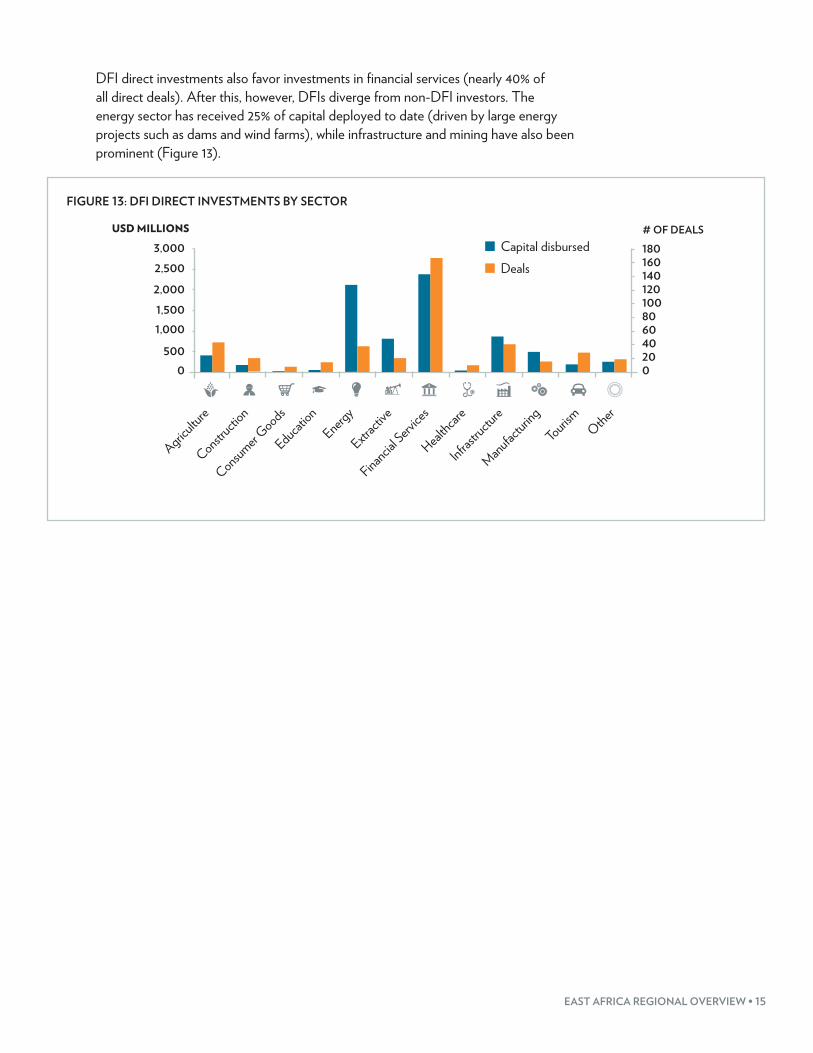
DFI direct investments also favor investments in financial services (nearly 40% of all direct deals). After this, however, DFIs diverge from non-DFI investors. The energy sector has received 25% of capital deployed to date (driven by large energy projects such as dams and wind farms), while infrastructure and mining have also been prominent (Figure 13).
FIGURE 13: DFI DIRECT INVESTMENTS BY SECTOR
3,000
2,500
2,000
1,500
5000
1,000
USD MILLIONSCapital disbursedDeals
180160140
100
020
60
# OF DEALS
120
80
40
Agriculture
Education
Energy
Extract
ive
Financial Serv
ices
Healthcar
e
Infrastru
cture
Manufacturing
Constructio
n
Consumer Goods
Tourism Other
16 • THE LANDSCAPE FOR IMPACT INVESTING IN EAST AFRICA
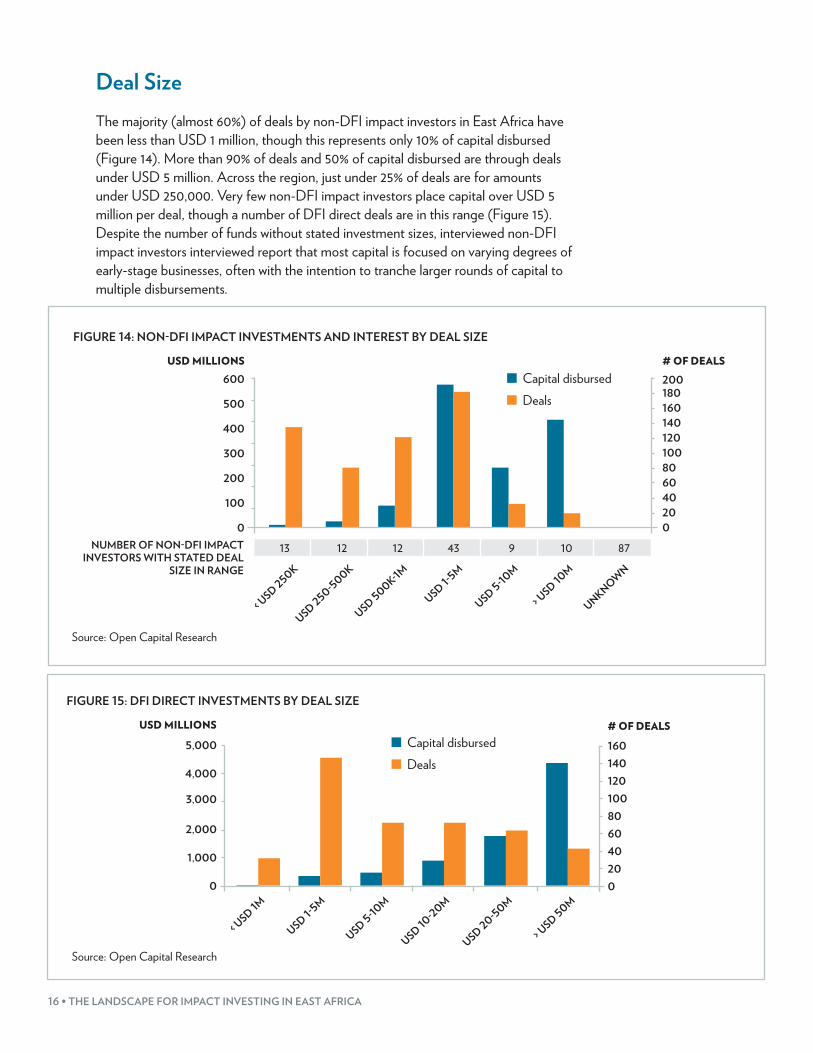
Deal SizeThe majority (almost 60%) of deals by non-DFI impact investors in East Africa have been less than USD 1 million, though this represents only 10% of capital disbursed (Figure 14). More than 90% of deals and 50% of capital disbursed are through deals under USD 5 million. Across the region, just under 25% of deals are for amounts under USD 250,000. Very few non-DFI impact investors place capital over USD 5 million per deal, though a number of DFI direct deals are in this range (Figure 15). Despite the number of funds without stated investment sizes, interviewed non-DFI impact investors interviewed report that most capital is focused on varying degrees of early-stage businesses, often with the intention to tranche larger rounds of capital to multiple disbursements.
FIGURE 14: NON-DFI IMPACT INVESTMENTS AND INTEREST BY DEAL SIZE
Capital disbursedDeals
USD MILLIONS # OF DEALS600
500
300
100
0
200
400
180200
160140120100806040
020
NUMBER OF NON-DFI IMPACT INVESTORS WITH STATED DEAL
SIZE IN RANGE
USD 500K-1M
USD 250-500K
< USD 250K
USD 1-5M
USD 5-10M
> USD 10
M
UNKNOWN
13 12 12 43 10 879
Source: Open Capital Research
FIGURE 15: DFI DIRECT INVESTMENTS BY DEAL SIZE
5,000
4,000
1,000
0
2,000
3,000
Capital disbursedDeals
USD MILLIONS # OF DEALS
< USD 1M
USD 1-5M
USD 5-10M
USD 10-20M
USD 20-50M
> USD 50M
160140120100806040
020
Source: Open Capital Research
EAST AFRICA REGIONAL OVERVIEW • 17
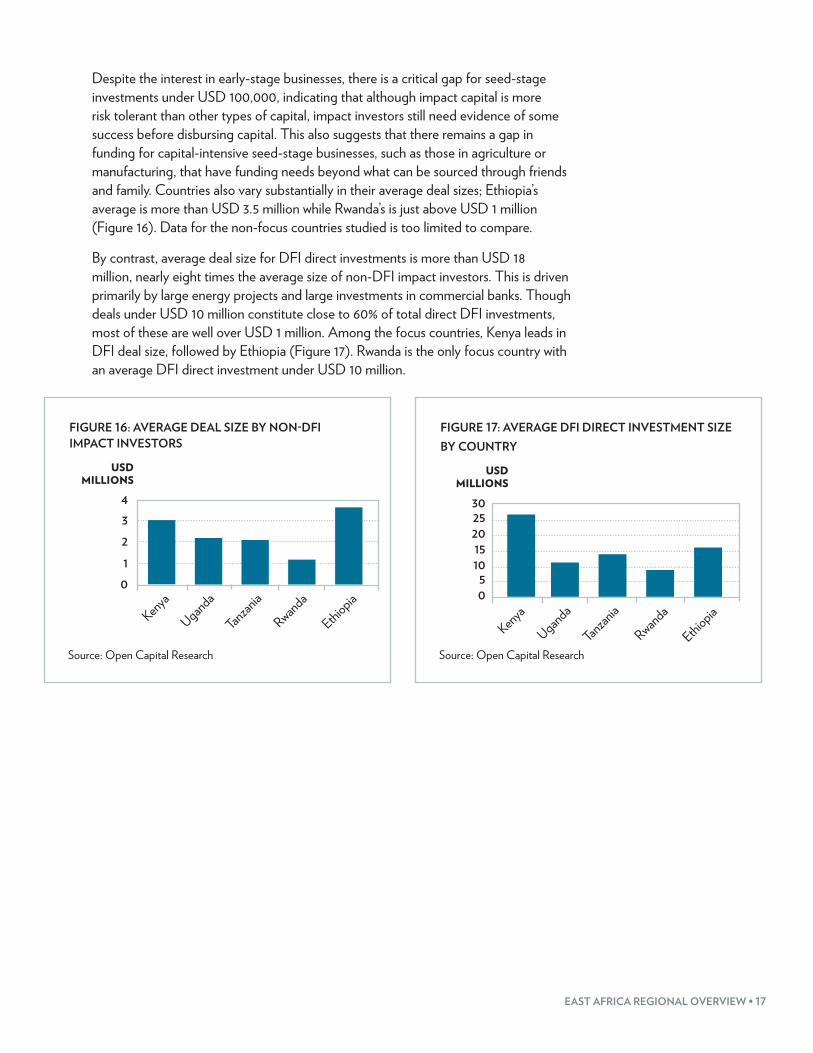
Despite the interest in early-stage businesses, there is a critical gap for seed-stage investments under USD 100,000, indicating that although impact capital is more risk tolerant than other types of capital, impact investors still need evidence of some success before disbursing capital. This also suggests that there remains a gap in funding for capital-intensive seed-stage businesses, such as those in agriculture or manufacturing, that have funding needs beyond what can be sourced through friends and family. Countries also vary substantially in their average deal sizes; Ethiopia’s average is more than USD 3.5 million while Rwanda’s is just above USD 1 million (Figure 16). Data for the non-focus countries studied is too limited to compare.
By contrast, average deal size for DFI direct investments is more than USD 18 million, nearly eight times the average size of non-DFI impact investors. This is driven primarily by large energy projects and large investments in commercial banks. Though deals under USD 10 million constitute close to 60% of total direct DFI investments, most of these are well over USD 1 million. Among the focus countries, Kenya leads in DFI deal size, followed by Ethiopia (Figure 17). Rwanda is the only focus country with an average DFI direct investment under USD 10 million.
FIGURE 16: AVERAGE DEAL SIZE BY NON-DFI IMPACT INVESTORS
Kenya
Uganda
Tanzan
ia
Ethiopia
Rwanda
4
3
2
1
0
USD MILLIONS
Source: Open Capital Research
FIGURE 17: AVERAGE DFI DIRECT INVESTMENT SIZE BY COUNTRY
20
10
Kenya
Uganda
Tanzan
ia
Ethiopia
Rwanda
3025
15
50
USD MILLIONS
Source: Open Capital Research
18 • THE LANDSCAPE FOR IMPACT INVESTING IN EAST AFRICA
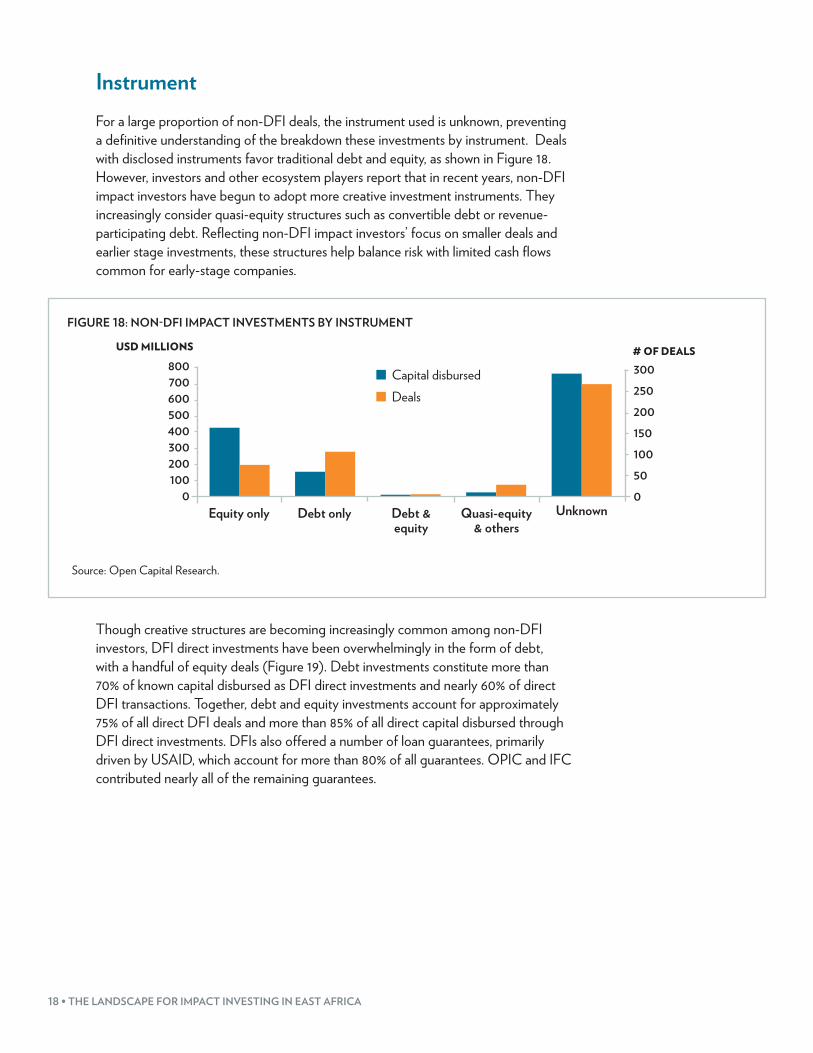
InstrumentFor a large proportion of non-DFI deals, the instrument used is unknown, preventing a definitive understanding of the breakdown these investments by instrument. Deals with disclosed instruments favor traditional debt and equity, as shown in Figure 18. However, investors and other ecosystem players report that in recent years, non-DFI impact investors have begun to adopt more creative investment instruments. They increasingly consider quasi-equity structures such as convertible debt or revenue-participating debt. Reflecting non-DFI impact investors’ focus on smaller deals and earlier stage investments, these structures help balance risk with limited cash flows common for early-stage companies.
FIGURE 18: NON-DFI IMPACT INVESTMENTS BY INSTRUMENT
500600700800
400
1000
200300
Capital disbursedDeals
USD MILLIONS
Equity only Debt only Debt & equity
UnknownQuasi-equity & others
300
250
200
150
100
50
0
# OF DEALS
Source: Open Capital Research.
Though creative structures are becoming increasingly common among non-DFI investors, DFI direct investments have been overwhelmingly in the form of debt, with a handful of equity deals (Figure 19). Debt investments constitute more than 70% of known capital disbursed as DFI direct investments and nearly 60% of direct DFI transactions. Together, debt and equity investments account for approximately 75% of all direct DFI deals and more than 85% of all direct capital disbursed through DFI direct investments. DFIs also offered a number of loan guarantees, primarily driven by USAID, which account for more than 80% of all guarantees. OPIC and IFC contributed nearly all of the remaining guarantees.
EAST AFRICA REGIONAL OVERVIEW • 19
FIGURE 19: DFI DIRECT INVESTMENTS BY INSTRUMENT
5,000
6,000
4,000
1,000
0
2,000
3,000
Capital disbursedDeals
USD MILLIONS
300
250
200
150
100
50
0
# OF DEALS
Equity Debt Debt & Equity
Guarantee Grant Other No info
Source: Open Capital Research
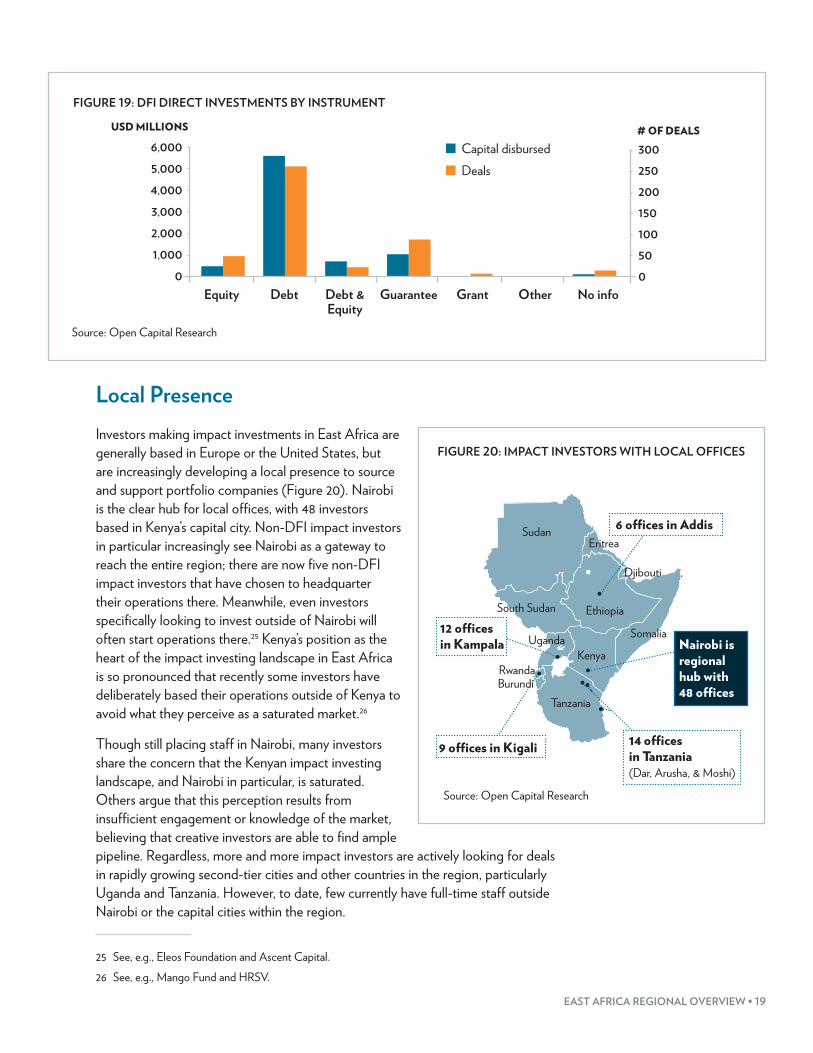
Local Presence Investors making impact investments in East Africa are generally based in Europe or the United States, but are increasingly developing a local presence to source and support portfolio companies (Figure 20). Nairobi is the clear hub for local offices, with 48 investors based in Kenya’s capital city. Non-DFI impact investors in particular increasingly see Nairobi as a gateway to reach the entire region; there are now five non-DFI impact investors that have chosen to headquarter their operations there. Meanwhile, even investors specifically looking to invest outside of Nairobi will often start operations there.25 Kenya’s position as the heart of the impact investing landscape in East Africa is so pronounced that recently some investors have deliberately based their operations outside of Kenya to avoid what they perceive as a saturated market.26
Though still placing staff in Nairobi, many investors share the concern that the Kenyan impact investing landscape, and Nairobi in particular, is saturated. Others argue that this perception results from insufficient engagement or knowledge of the market, believing that creative investors are able to find ample pipeline. Regardless, more and more impact investors are actively looking for deals in rapidly growing second-tier cities and other countries in the region, particularly Uganda and Tanzania. However, to date, few currently have full-time staff outside Nairobi or the capital cities within the region.
25 See, e.g., Eleos Foundation and Ascent Capital.26 See, e.g., Mango Fund and HRSV.
Source: Open Capital Research
FIGURE 20: IMPACT INVESTORS WITH LOCAL OFFICES
•
•
••
•
•
6 offices in Addis
Nairobi is regional hub with 48 offices
12 offices in Kampala
9 offices in Kigali 14 offices in Tanzania(Dar, Arusha, & Moshi)
•Rwanda
Sudan
South Sudan Ethiopia
Kenya
Tanzania
Somalia
Eritrea
Djibouti
Uganda
Burundi
20 • THE LANDSCAPE FOR IMPACT INVESTING IN EAST AFRICA
Though still placing staff in Nairobi, many investors share the concern that the Kenyan impact investing landscape, and Nairobi in particular, is saturated. Others argue that this perception results from insufficient engagement or knowledge of the market, believing that creative investors are able to find ample pipeline. Regardless, more and more impact investors are actively looking for deals in rapidly growing second-tier cities and other countries in the region, particularly Uganda and Tanzania. However, to date, few currently have full-time staff outside Nairobi or the capital cities within the region.
Impact Tracking Standards Impact investors’ dual mandate to realize both financial and social or environmental returns requires a strong focus on measuring impact as part of their core activities. Beyond tracking metrics as best practice, many impact asset owners require it. This is particularly true for DFIs, which act as anchor investors in many impact investment funds.
However, developing tools to accurately track impact metrics has proven difficult. Beyond general inexperience designing methodologies for measuring impact accurately over time, tracking metrics is perceived by some as expensive and time-consuming for an early-stage business, potentially diverting resources from enterprise growth. Moreover, impact investors define impact in a wide variety of ways and emphasize different elements, complicating efforts to develop a universal standard or toolbox. In many ways, this is beneficial for SMEs, who do not all fit the same definition.
The majority of fund managers interviewed do not specify a particular language or tool but rather report using flexible structures adapted to each new investment. Though many investors have rigorous and rigid impact guidelines to make an investment, they generally design and track metrics after the investment in an individualized manner to minimize the burden placed on portfolio companies.
Among the few that do specify using a known language or tool, IRIS27 has emerged as the most prominent. Some fund managers select their own set of IRIS metrics; others use an existing tool, such as the Global Impact Investment Rating System (GIIRS), which is built on the IRIS taxonomy.
27 IRIS (formerly known as Impact Reporting and Investment Standards) is a set of standardized metrics for impact measurement managed by the Global Impact Investment Network (www.iris.thegiin.org).
EAST AFRICA REGIONAL OVERVIEW • 21
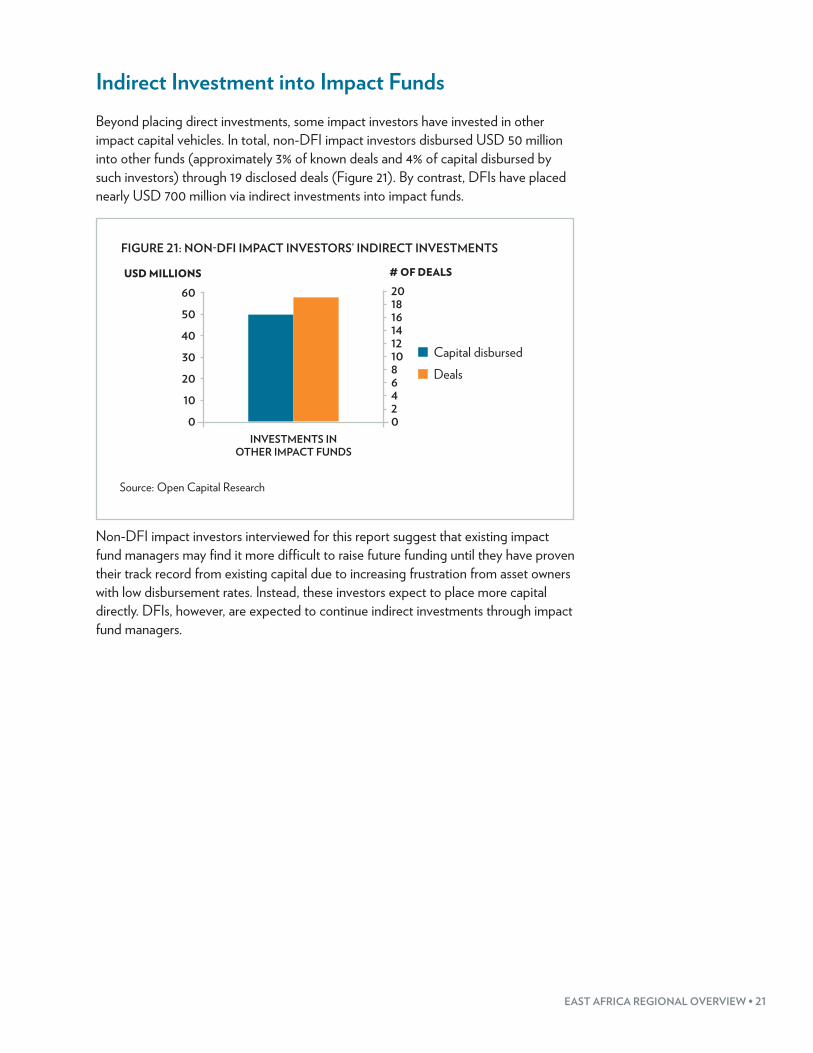
Indirect Investment into Impact Funds Beyond placing direct investments, some impact investors have invested in other impact capital vehicles. In total, non-DFI impact investors disbursed USD 50 million into other funds (approximately 3% of known deals and 4% of capital disbursed by such investors) through 19 disclosed deals (Figure 21). By contrast, DFIs have placed nearly USD 700 million via indirect investments into impact funds.
Source: Open Capital Research
FIGURE 21: NON-DFI IMPACT INVESTORS’ INDIRECT INVESTMENTS
Capital disbursedDeals
INVESTMENTS IN OTHER IMPACT FUNDS
50
60
40
10
0
20
30
USD MILLIONS
1820
121416
810
46
20
# OF DEALS
Non-DFI impact investors interviewed for this report suggest that existing impact fund managers may find it more difficult to raise future funding until they have proven their track record from existing capital due to increasing frustration from asset owners with low disbursement rates. Instead, these investors expect to place more capital directly. DFIs, however, are expected to continue indirect investments through impact fund managers.
22 • THE LANDSCAPE FOR IMPACT INVESTING IN EAST AFRICA
DEMAND AND NEED FOR IMPACT INVESTING CAPITAL There is strong demand for impact capital among entrepreneurs operating in East Africa. Despite the region’s progress on key development indicators, there remain significant gaps in the provision of key goods and services, which create opportunities for entrepreneurs to build enterprises that fill needs while also realizing financial returns. As noted earlier, most of these businesses are in early stages of development and growth.
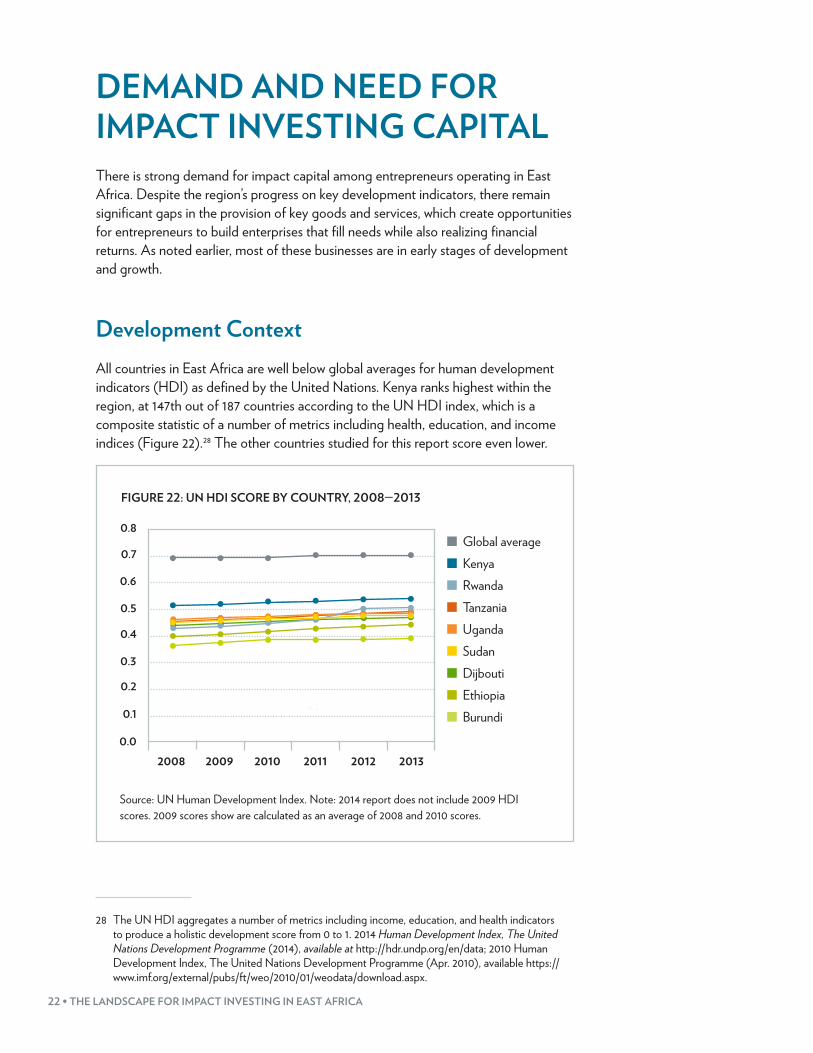
Development ContextAll countries in East Africa are well below global averages for human development indicators (HDI) as defined by the United Nations. Kenya ranks highest within the region, at 147th out of 187 countries according to the UN HDI index, which is a composite statistic of a number of metrics including health, education, and income indices (Figure 22).28 The other countries studied for this report score even lower.
FIGURE 22: UN HDI SCORE BY COUNTRY, 2008—2013
0.4
0.5
0.6
0.7
0.8
2008 2009 2010 2011 2012 2013
0.2
0.3
0.0
0.1
Global averageKenyaRwandaTanzaniaUgandaSudanDijboutiEthiopiaBurundi
Source: UN Human Development Index. Note: 2014 report does not include 2009 HDI scores. 2009 scores show are calculated as an average of 2008 and 2010 scores.
28 The UN HDI aggregates a number of metrics including income, education, and health indicators to produce a holistic development score from 0 to 1. 2014 Human Development Index, The United Nations Development Programme (2014), available at http://hdr.undp.org/en/data; 2010 Human Development Index, The United Nations Development Programme (Apr. 2010), available https://www.imf.org/external/pubs/ft/weo/2010/01/weodata/download.aspx.
EAST AFRICA REGIONAL OVERVIEW • 23
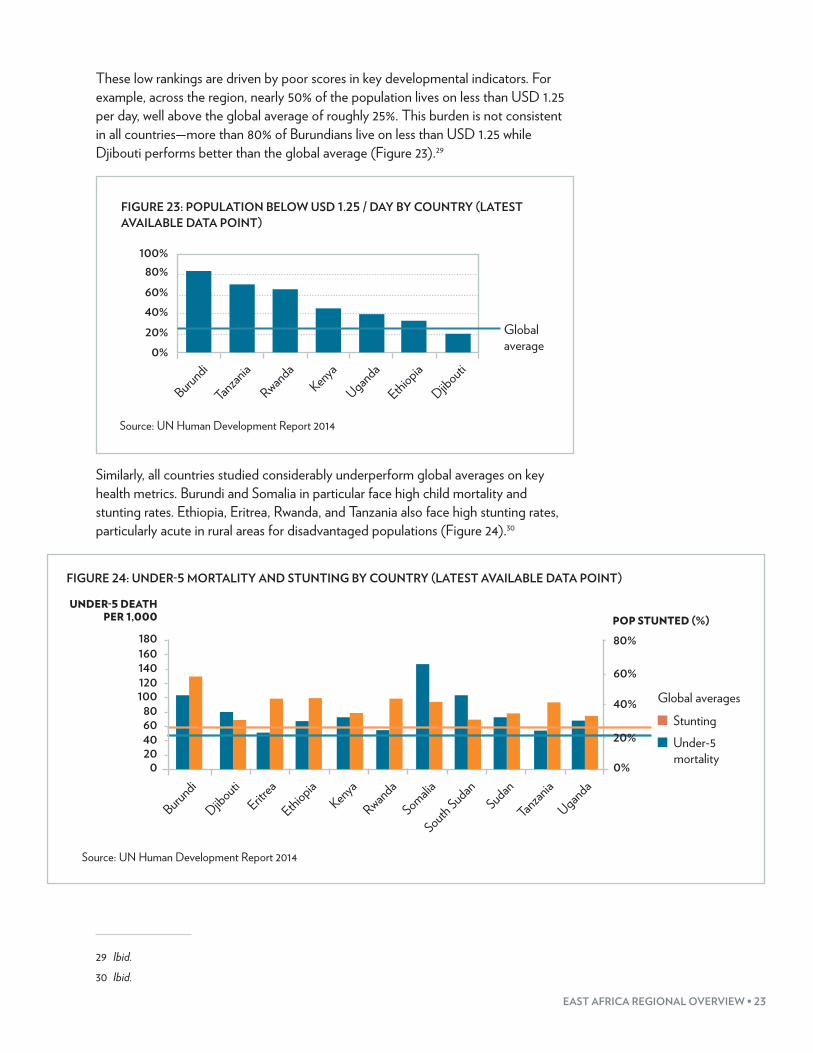
These low rankings are driven by poor scores in key developmental indicators. For example, across the region, nearly 50% of the population lives on less than USD 1.25 per day, well above the global average of roughly 25%. This burden is not consistent in all countries—more than 80% of Burundians live on less than USD 1.25 while Djibouti performs better than the global average (Figure 23).29
FIGURE 23: POPULATION BELOW USD 1.25 / DAY BY COUNTRY (LATEST AVAILABLE DATA POINT)
100%80%
60%
40%
20%
0%
Kenya
Uganda
Tanzan
ia
Ethiopia
Rwanda
Djibouti
Burundi
Global average
Source: UN Human Development Report 2014
Similarly, all countries studied considerably underperform global averages on key health metrics. Burundi and Somalia in particular face high child mortality and stunting rates. Ethiopia, Eritrea, Rwanda, and Tanzania also face high stunting rates, particularly acute in rural areas for disadvantaged populations (Figure 24).30
FIGURE 24: UNDER-5 MORTALITY AND STUNTING BY COUNTRY (LATEST AVAILABLE DATA POINT)
Source: UN Human Development Report 2014
StuntingUnder-5
mortality
Kenya
Rwanda
Tanzan
ia
Djibouti
Ethiopia
BurundiEritr
ea
Somalia
UgandaSudan
South Sudan
180160140120
80
200
60
100
40
UNDER-5 DEATH PER 1,000
80%
60%
40%
0%
POP STUNTED (%)
Global averages
20%
29 Ibid.30 Ibid.
24 • THE LANDSCAPE FOR IMPACT INVESTING IN EAST AFRICA
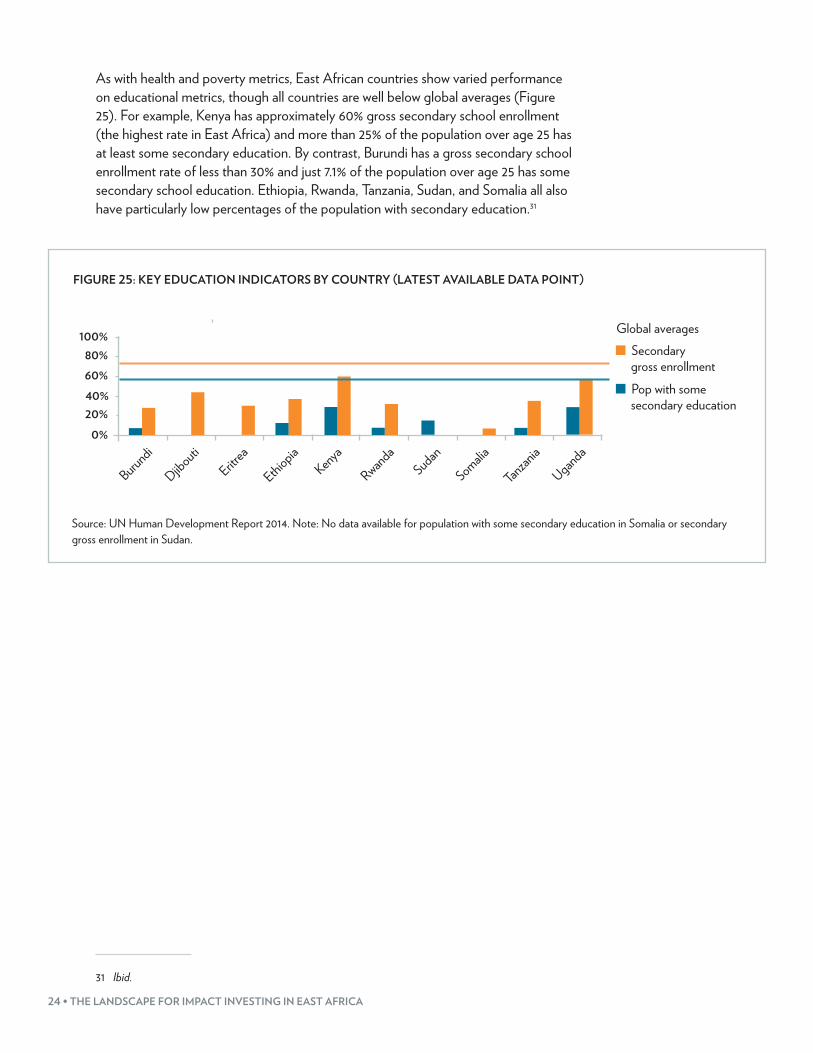
As with health and poverty metrics, East African countries show varied performance on educational metrics, though all countries are well below global averages (Figure 25). For example, Kenya has approximately 60% gross secondary school enrollment (the highest rate in East Africa) and more than 25% of the population over age 25 has at least some secondary education. By contrast, Burundi has a gross secondary school enrollment rate of less than 30% and just 7.1% of the population over age 25 has some secondary school education. Ethiopia, Rwanda, Tanzania, Sudan, and Somalia all also have particularly low percentages of the population with secondary education.31
FIGURE 25: KEY EDUCATION INDICATORS BY COUNTRY (LATEST AVAILABLE DATA POINT)
Source: UN Human Development Report 2014. Note: No data available for population with some secondary education in Somalia or secondary gross enrollment in Sudan.
Secondary gross enrollment
Pop with some secondary education
100%80%
60%
20%
0%
40%
Global averages
Kenya
Rwanda
Tanzan
iaSudan
Djibouti
Ethiopia
SomaliaEritr
ea
Burundi
Uganda
31 Ibid.
EAST AFRICA REGIONAL OVERVIEW • 25
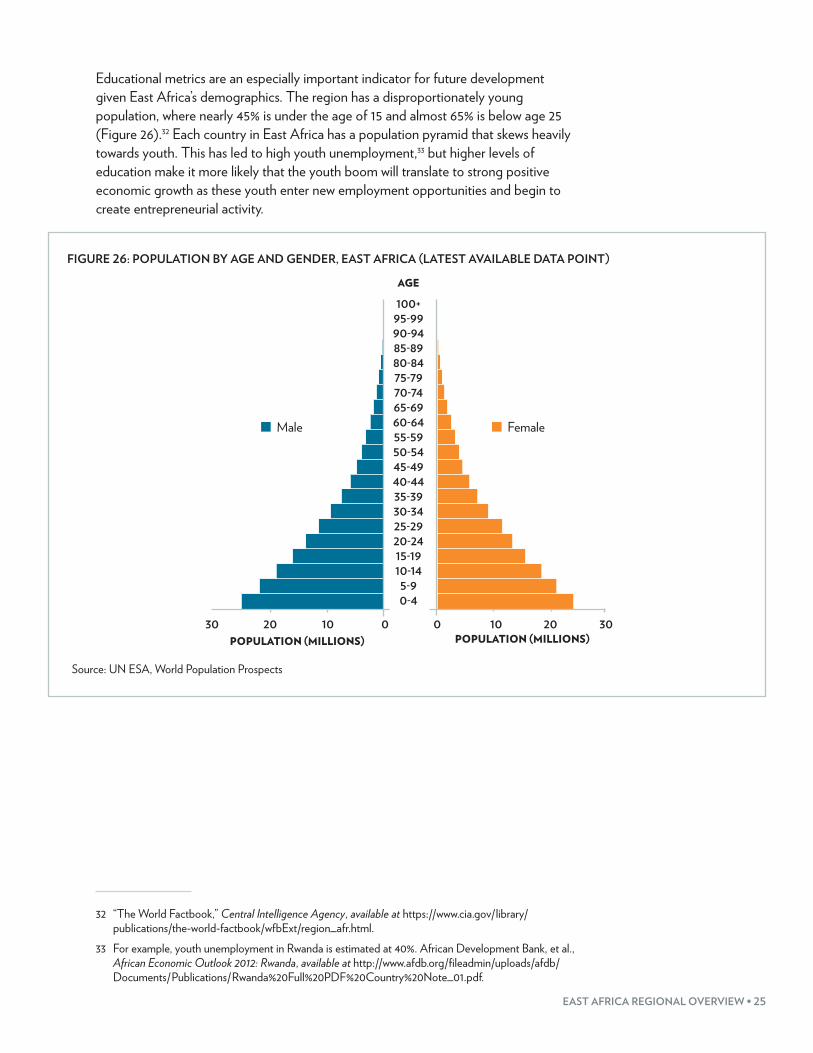
Educational metrics are an especially important indicator for future development given East Africa’s demographics. The region has a disproportionately young population, where nearly 45% is under the age of 15 and almost 65% is below age 25 (Figure 26).32 Each country in East Africa has a population pyramid that skews heavily towards youth. This has led to high youth unemployment,33 but higher levels of education make it more likely that the youth boom will translate to strong positive economic growth as these youth enter new employment opportunities and begin to create entrepreneurial activity.
Source: UN ESA, World Population Prospects
FIGURE 26: POPULATION BY AGE AND GENDER, EAST AFRICA (LATEST AVAILABLE DATA POINT)
0-4
AGE
5-910-1415-1920-2425-2930-3435-3940-4445-4950-5455-5960-6465-6970-7475-7980-8485-8990-9495-99100+
Male
POPULATION (MILLIONS) POPULATION (MILLIONS)102030 20 301000
Female
32 “The World Factbook,” Central Intelligence Agency, available at https://www.cia.gov/library/publications/the-world-factbook/wfbExt/region_afr.html.
33 For example, youth unemployment in Rwanda is estimated at 40%. African Development Bank, et al., African Economic Outlook 2012: Rwanda, available at http://www.afdb.org/fileadmin/uploads/afdb/Documents/Publications/Rwanda%20Full%20PDF%20Country%20Note_01.pdf.
26 • THE LANDSCAPE FOR IMPACT INVESTING IN EAST AFRICA
EntrepreneursWith increasing interest from impact investors, many entrepreneurs in East Africa see an opportunity to start new social enterprises.34 Many of these opportunities include disadvantaged populations and the mass market as suppliers, consumers, or both. Entrepreneurs have launched businesses across sectors of interest to impact investors—education, housing, healthcare, water and sanitation, energy, etc.—and seek capital across the spectrum of funding from start-up needs to SME-size deals to capital for scaling up, though they are primarily concentrated in the start-up and early phases. This focus on earlier-stage businesses aligns with the local landscape, in which there are few mature social enterprises.
Despite growing demand for capital, entrepreneurs across the region face substantial challenges regardless of their stage of development. Though early-stage entrepreneurs are sometimes able to source capital to begin operations from friends, family, and various community financing organizations such as SACCOs or MFIs, they struggle to find the next round of capital to test and pilot their ideas in the market. Many businesses at this stage operate informally—they are unlikely to have clear financial records, access to formal markets, or access to government services. This makes it difficult for investors to disburse capital, even those looking for early-stage deals.
In their early stages of development, formal and informal businesses often face common challenges preventing them from being fully investment ready, including a lack of realistic forward-looking projections, unclear capital use plans, and limited management capacity to scale operations. In addition, entrepreneurs often run several projects simultaneously and have limited attention to devote to a single enterprise.
While these challenges are not as common for more developed businesses, high potential, rapidly scaling companies are more likely to have existing access to credit through strong relationships with local commercial banks. When businesses do seek impact capital, they are typically well-known to investors, leading to competition among impact investors and/or a large number of co-investors.
By and large, impact investors report that the most interesting, sophisticated businesses typically do not market themselves as “social enterprises.” Instead, they present strong commercial cases for investment and have social impact embedded in the success of their business model. Notably, these high-potential businesses typically view impact investors first and foremost as sources of capital, regardless of the investors’ impact intent.
In countries that have less mature impact investing and social enterprise ecosystems, entrepreneurs have few examples of success and limited access to networks to find funding. Burundi, Djibouti, Eritrea, Somalia, South Sudan, and Sudan have very few social entrepreneurs, making it difficult for entrepreneurs to know where to get the support needed to grow and scale. In countries where social enterprises have already succeeded in attracting global attention like Kenya, Uganda, Tanzania, Ethiopia, and Rwanda, there are some existing contacts to help guide new entrepreneurs through
34 Open Capital Research.
EAST AFRICA REGIONAL OVERVIEW • 27
the complicated funding process. However, even in these more active countries, there are only a few successful examples of young, rapidly growing companies. This dearth of successful start-ups can contribute to entrepreneurs viewing their businesses as a way to earn a modest living rather than as a highly-scalable enterprise. Investors across East African countries will need to invest in local networks to understand the landscape and help entrepreneurs translate their ideas into investible plans.
ENABLING IMPACT INVESTING: THE ECOSYSTEMEast Africa is home to many intermediaries and other service providers in the impact investing ecosystem. These players are largely concentrated in Kenya, though there are an increasing number emerging in Uganda, Tanzania, Ethiopia, and Rwanda. While there is considerable country-specific variation, the broader business environment is becoming more supportive and sophisticated in East Africa, providing more options to partner with suppliers, distributors, and other commercial entities.
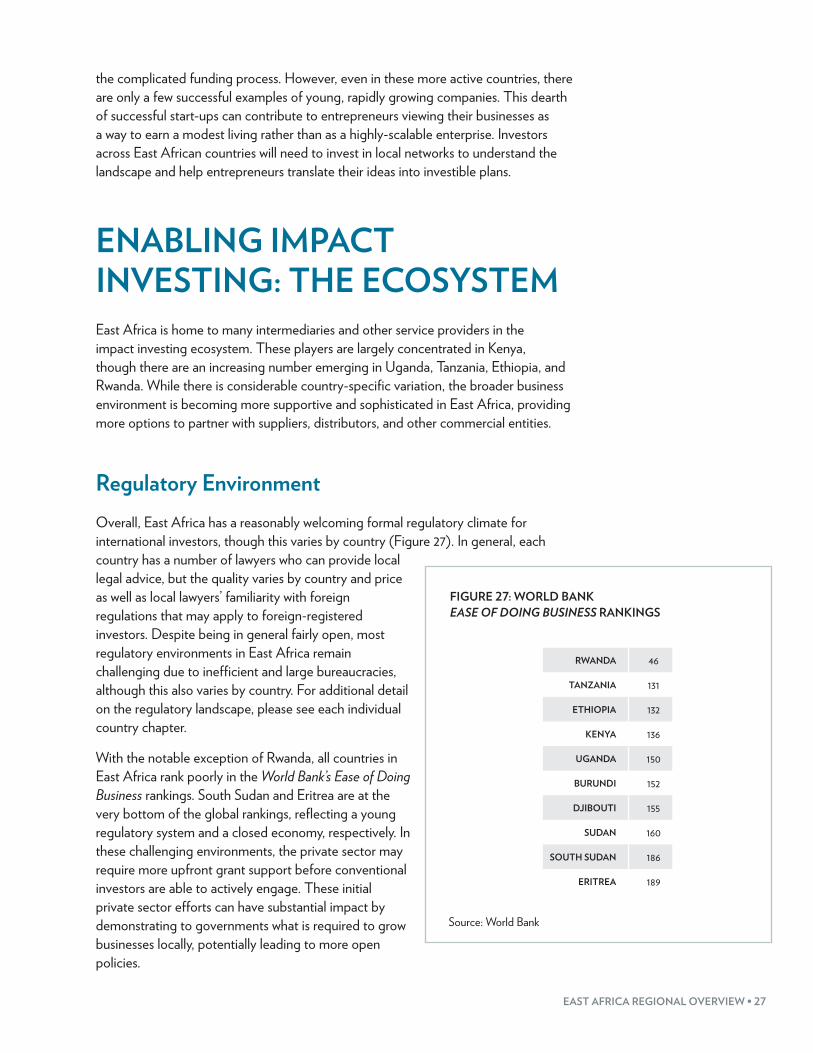
Regulatory EnvironmentOverall, East Africa has a reasonably welcoming formal regulatory climate for international investors, though this varies by country (Figure 27). In general, each country has a number of lawyers who can provide local legal advice, but the quality varies by country and price as well as local lawyers’ familiarity with foreign regulations that may apply to foreign-registered investors. Despite being in general fairly open, most regulatory environments in East Africa remain challenging due to inefficient and large bureaucracies, although this also varies by country. For additional detail on the regulatory landscape, please see each individual country chapter.
With the notable exception of Rwanda, all countries in East Africa rank poorly in the World Bank’s Ease of Doing Business rankings. South Sudan and Eritrea are at the very bottom of the global rankings, reflecting a young regulatory system and a closed economy, respectively. In these challenging environments, the private sector may require more upfront grant support before conventional investors are able to actively engage. These initial private sector efforts can have substantial impact by demonstrating to governments what is required to grow businesses locally, potentially leading to more open policies.
FIGURE 27: WORLD BANK EASE OF DOING BUSINESS RANKINGS
RWANDA 46
TANZANIA 131
ETHIOPIA 132
KENYA 136
UGANDA 150
BURUNDI 152
DJIBOUTI 155
SUDAN 160
SOUTH SUDAN 186
ERITREA 189
Source: World Bank
28 • THE LANDSCAPE FOR IMPACT INVESTING IN EAST AFRICA
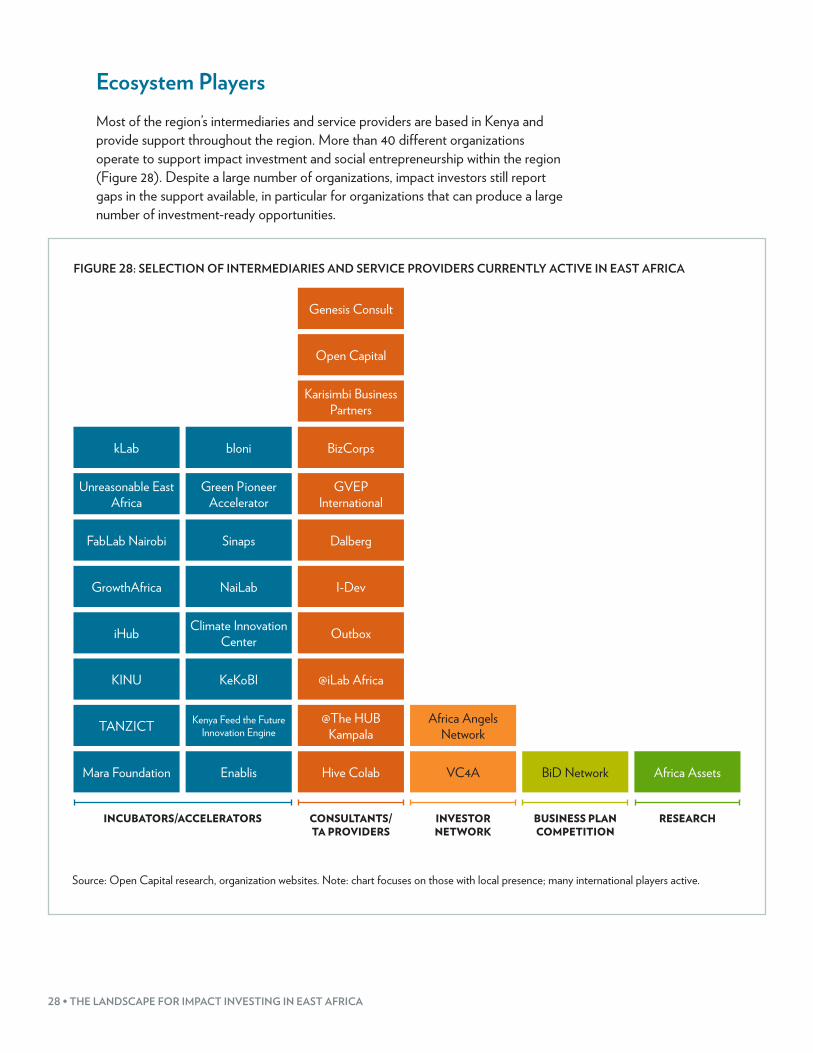
Ecosystem PlayersMost of the region’s intermediaries and service providers are based in Kenya and provide support throughout the region. More than 40 different organizations operate to support impact investment and social entrepreneurship within the region (Figure 28). Despite a large number of organizations, impact investors still report gaps in the support available, in particular for organizations that can produce a large number of investment-ready opportunities.
FIGURE 28: SELECTION OF INTERMEDIARIES AND SERVICE PROVIDERS CURRENTLY ACTIVE IN EAST AFRICA
INCUBATORS/ACCELERATORS CONSULTANTS/ TA PROVIDERS
INVESTOR NETWORK
BUSINESS PLAN COMPETITION
RESEARCH
Mara Foundation
TANZICT
KINU
iHub
GrowthAfrica
FabLab Nairobi
Unreasonable East Africa
kLab
Enablis
Kenya Feed the Future Innovation Engine
KeKoBI
Climate Innovation Center
NaiLab
Sinaps
Green Pioneer Accelerator
bloni
VC4A
Africa Angels Network
Hive Colab
@The HUB Kampala
@iLab Africa
Outbox
I-Dev
Dalberg
GVEP International
BizCorps
Karisimbi Business Partners
Open Capital
Genesis Consult
BiD Network Africa Assets
Source: Open Capital research, organization websites. Note: chart focuses on those with local presence; many international players active.

EAST AFRICA REGIONAL OVERVIEW • 29
The support ecosystem primarily includes incubators and accelerators. These organizations predominantly provide mentorship, training, and access to financing directly or through a network cultivated by the incubator. Many provide shared office space, which can help young businesses attract talent and business opportunities. There are also consultants, investor networks, and business plan competitions, though many are too new to have demonstrated effectiveness or results.
Incubators tend to focus on seed or very early-stage businesses. The ecosystem’s skew toward incubators implies that there are a significant number of enterprises in these earlier stages. As most impact investors are focused on businesses with key operational structures and track record in place, and correspondingly larger capital requirements compared to seed-stage businesses, a gap may exist for intermediaries and service providers operating with businesses that are slightly more mature. Many incubators have a strong sectoral focus, often in information and communications technologies (ICT) and/or energy. However, many impact investors express an interest in agriculture, health care, and other sectors, which may be more capital intensive and less of a fit for these incubator programs.
Beyond incubators, there are a number of consultants and technical assistance (TA) providers focused on the impact investing ecosystem, including Biz Corps, Dalberg, I-DEV, and Open Capital Advisors. These organizations support SMEs as they grow with intensive, tailored support. They frequently approach impact investors to raise capital for their clients and tend to be sector agnostic, supporting individual businesses on a case-by-case basis. There are also a number of individual business consultants who perform similar services. As individuals, these consultants are typically limited to a smaller number of engagements.
There is a broad gap in the market for detailed market research and data to support both impact investors and social enterprises, despite the strong efforts of organizations such as Africa Assets and the Bertha Center. For example, there is limited data on comparable impact deals or exit multiples for impact investors to benchmark their valuations or financial performance. From an operational standpoint, detailed market data on consumption and purchasing habits often do not exist. This can present a challenge to both impact investors and social enterprises when evaluating growth assumptions and opportunities.
Other Service ProvidersIn addition, East Africa boasts a wide range of service providers including accountants, lawyers, recruiting firms, and others. Most countries in East Africa require annual audited accounts, and a large industry has developed to serve this requirement. However, the quality of audits varies widely and so does the reliability of any accounts produced. Particularly for small companies or family-owned businesses, developing clear financial documentation can be challenging. Similarly, legal representation of varying quality is widely available. International firms have begun to consider the region, but few have full-time staff on the ground.
In addition to professional firms, there are a wide variety of marketers, talent recruiting firms, and other business service providers, yet there is substantial variation in
30 • THE LANDSCAPE FOR IMPACT INVESTING IN EAST AFRICA
availability across countries. Even when available, they are of substantially varying quality, and few firms operate with local presence in multiple countries.
SECTOR OPPORTUNITIES ACROSS EAST AFRICAAll East African countries share a demand for impact capital with populations well below global averages for human development, despite robust recent economic growth, averaging a combined 7% annual GDP (PPP) growth for the last eight years. As such, there are ample opportunities for investors to support entrepreneurs who will generate both financial and social returns. The following sectors present particularly notable opportunities in East Africa:
• Agriculture: Throughout East Africa, agriculture contributes more than 30% of GDP, employs most of the population, and is an important sector to increase incomes and improve food security. Given the predominance of smallholder farming, there are opportunities to aggregate production and create consistent, high-quality supply. In addition, there are opportunities to connect directly with export markets. There is also significant potential in agricultural processing across a range of crops and in agricultural sub-sectors such as horticulture, livestock, and dairy.
• Renewable energy: All countries in East Africa are looking to expand power generation capacity in the coming decades, with strong government support. This opens the door for large-scale projects and creates the potential for improved power purchase agreements and cross-border trade. At the same time, there are large segments of the population that lack reliable access to grid power, opening opportunities for micro-grid and off-grid solutions.
• Aquaculture: Fisheries and fish processing also show high potential, with the export of fish and fishmeal becoming an increasingly significant part of the East African economy. Sustainable fisheries can provide a critical source of protein and have the potential to reduce increasing pressure on important coastal areas.
• Tourism: Given the variety of attractions available in East Africa, from beautiful coasts to vibrant safari parks, there is high potential for tourism, although countries will need to be conscious of addressing security concerns to attract tourists. Governments across the region have started encouraging foreign investors and the returning diaspora to invest in the sector with some encouraging results. Tourism presents a particular opportunity for the non-focus countries in this report as a near-term potential employment source.
• Consumer goods for the mass market: With East Africa’s rapidly growing middle class, impact investors report seeing increasingly attractive opportunities to supply goods and services to consumers with rising disposable incomes. These businesses often create substantial employment opportunities, which may align with impact criteria for some impact investors.
EAST AFRICA REGIONAL OVERVIEW • 31
• Urban development: Non-DFI impact investors also note rapid urbanization and growing demand for businesses to serve expanding cities as an area of opportunity. Service sectors cited by impact investors include affordable housing, water, and sanitation.
• Basic services distribution: Throughout the region, increasing incomes and populations put growing pressure on the provision of basic services, including healthcare, education, water and sanitation, energy access, and financial services. Across these sectors, social enterprises struggle to distribute products and services across urban, peri-urban, and rural areas. Providing distribution as a basic service could have an exponential effect in driving growth for social enterprises and their investors.
CHALLENGES AND OPPORTUNITIES FOR IMPACT INVESTORS
Common Challenges• Insufficient investment-ready opportunities: Despite robust market activity to
date, many non-DFI impact investors still struggle to place the capital they have raised. Though investors acknowledge that there are many businesses with exciting potential, investors encounter few companies that they believe are truly investment ready. Early-stage businesses, which are the primary target for impact investors, face certain common challenges that constrain them from being fully prepared for investment, including unproven operations, an unclear strategy to scale, informal financial and corporate records, and a lack of realistic forward-looking projections.
• Insufficient human capital: Talent is the key constraint for many East African businesses. Companies struggle to find the talented, reliable management needed to plan for and reach scale. Though true for all skilled positions, this shortage is particularly acute for finance professionals with 5-15 years of experience who can serve as a company CFO. Even when talented, experienced professionals can be found, they often command high wages that can be challenging for SMEs or social enterprises to support, especially in their early years.
• International decision makers: Many non-DFI impact investors have investment committees based abroad and whose members may not have on-the-ground experience with investments in East Africa.35 These remote investment committees often interpret risk differently than their investment teams operating on the ground, which can cause due diligence and deal closing timelines to stretch to 12 to
35 Open Capital interviews with entrepreneurs, intermediaries, and investors.
32 • THE LANDSCAPE FOR IMPACT INVESTING IN EAST AFRICA
18 months for both debt and equity investments.36 This can frustrate entrepreneurs, and put additional pressure on businesses as they must survive without needed capital.
• Difficulty accessing bank financing: Though entrepreneurs are sometimes able to source capital to begin operations from friends, family, and various community financing organizations, they struggle to find the next round of capital to test and pilot their ideas in the market. In particular, conventional bank financing is difficult to access for early-stage businesses, as conventional banks in the region are very risk averse. Even if willing to lend, they require high collateral ratios (often in excess of 100% of the loan amount), which few entrepreneurs are able to meet.
• Limited local currency financing: Many impact businesses earn the majority of their revenues in local currencies. However, most impact investors track returns in international hard currencies and have little ability to invest in local currencies. This is especially challenging for long-term debt instruments, which require repayment in hard currencies that can appreciate 5-10% per year. Hedging options are typically prohibitively expensive, though some impact investors with large funds report effectively using fund-level hedges to minimize risk.
• Few exit examples: For new funds looking to raise capital, the relative youth of the impact investment industry means there are few examples of successful exits. As more impact portfolios in East Africa near the end of their tenors, there will be significant pressure on funds to exit investments, though it is not yet clear how this will develop in coming years. Without a successful track record of exits, it can be difficult for impact investors to raise additional funding or a second investment fund. Some fund managers interviewed for this report believe it may be easier for a new impact investor to raise funds than for an experienced one, as the latter are expected to demonstrate a track record before raising a second fund.
Common OpportunitiesEach country in East Africa is unique. As a result, impact investors must learn about each country individually; strategies and solutions that are effective in one East African country will not necessarily work in another. Nevertheless, there are some high-level recommendations for investors that apply to the region as a whole:
• Leverage technical assistance (TA) facilities for pre-investment pipeline building: More pre-investment support for businesses is needed to develop a strong pipeline of investible opportunities. Increasingly, TA funders (e.g. USAID, DFID) recognize the importance of pre-investment support to get companies to the point where they can successfully raise capital. Several impact investors have successfully developed TA facilities for portfolio companies. Kenya in particular offers a robust intermediary ecosystem, and many of these players operate across the region. Such support can also significantly reduce diligence timelines if the investor is able to increase familiarity and visibility into the business pre-investment.
36 Ibid.
EAST AFRICA REGIONAL OVERVIEW • 33
• Develop sector expertise: Beyond bringing capital to portfolio companies, impact investors can drive performance by understanding the specific sectors where their portfolio companies operate. For some investors, this sector focus has allowed them to identify exciting, less well-known opportunities earlier, and reduce their diligence timelines by leveraging existing knowledge. Sectors such as agriculture, energy, and financial services present large opportunities where companies often face consistent challenges across portfolio companies.
• Source opportunities outside capital cities: Many impact investors with staff on the ground in East Africa report finding investments more easily than those based abroad. However, many entrepreneurs operate in rural areas or smaller cities, instead of the capital cities or regional hubs where investment staff are based. For investors who see these entrepreneurs’ businesses as attractive impact investment opportunities, it will be increasingly necessary to build relationships beyond those made in major cities.
• Expand investment instruments: With the variety of early-stage businesses in East Africa, creative investment structures—such as milestone-based conversion and profit-sharing debt – can help to fill a significant gap that straight equity and debt deals do not. Such structures can help entrepreneurs meet ongoing cash flow requirements while delivering long-term returns in line with investor expectations. There is also an opportunity to expand sharia-compliant investments to support Muslim entrepreneurs, using Murabaha37 and Ijara38 methods to help align impact investor goals with sharia law in areas with large Muslim populations in the region.
• Increase local decision-making: Impact investors have cited significant improvements in their portfolio from increased local decision-making and local support. This allows investment officers to form meaningful relationships with portfolio companies, where they are empowered to respond to changing realities on the ground. Placing staff and investment committees locally can also reduce diligence timelines, as these individuals are more familiar with local trends and norms. In an environment of increasing competition between impact investors for high-potential deals, designing effective diligence procedures aligned to the region could be a key differentiator for successful impact investors.
37 Murabaha is an Islamic financing system in which an intermediary purchases an asset desired by the customer. The intermediary owns the asset completely and then agrees to sell that asset to the customer for a fixed sale price, paid in installments.
38 Ijara is an Islamic financing system in which an intermediary purchases an asset (e.g. a house) and then rents it to a customer for a fixed payment. In this system, the intermediary retains ownership of the asset, though some variants of Ijara also allow the customer to purchase the asset.

34 • THE LANDSCAPE FOR IMPACT INVESTING IN EAST AFRICA


ABOUT THE GLOBAL IMPACT INVESTING NETWORK
The Global Impact Investing Network (GIIN®) is a nonprofit organization dedicated to increasing the scale and effectiveness of impact investing. The GIIN builds critical infrastructure and supports activities, education, and research that help accelerate the development of a coherent impact investing industry. For more information, see www.thegiin.org.
30 Broad Street, 38th Floor, New York, NY 10004 +1.646.837.7430 | [email protected] | www.thegiin.org