the journey to 100% - virbmedia.virbcdn.com/files/23/9d5d5d45dcbd18d6-re100briefing-reportre... ·...
TRANSCRIPT

RE100
Briefing Report 2015
An initiative of
In partnership with
An action of
Supported by
The journey To 100%

1 RE100 BRIEfIng REPORT | JAnUARY 2015
InTroDuCTIonTo meet the world’s growing demand for energy, the most influential companies are finding innovative ways to decarbonize their power use. Driven by increasing electricity prices and internal commitments to reduce carbon emissions, shifting to clean energy is one area where business and sustainability strategies are perfectly aligned.
And the smartest companies are going even further than their peers. They’re making firm commitments to be 100% renewable as an integral part of their business strategies. Such bold decisions will help them meet their future energy needs in a carbon-constrained world.
This doesn’t mean the journey to 100% renewable is an easy one. But it is achievable; and the rewards are demonstrably worth the commitment required.
For example, as well as seeing the value of direct investments in renewable power, companies are also benefitting from indirect investments, such as supporting power developers and utilities through long-term power purchase agreements, and taking advantage of renewable electricity tracking instruments.
This RE100 Briefing Report provides a snapshot of current global trends in corporate demand for, and investment in, renewable power. It is the first report from RE100, a global campaign working with the world’s most influential businesses on their journeys to becoming 100% powered by renewables.
REnEWABLE POWER PROVIDES A WIn-WIn OPPORTUnITY – DELIVERIng BUSInESS VALUE AT THE SAME TIME AS CUTTIng CARBOn.
AnD MAJOR BUSInESSES RECOgnIZE THIS.
2 RE100 BRIEfIng REPORT | JAnUARY 2015
1We Mean Business is a coalition of organizations including BSR, The B Team, CDP, Ceres, The Climate Group, The Prince of Wales’s Corporate Leaders Group and WBCSD2REN21, appraisal of the IEA’s 2012 Energy Technology Perspectives report in Renewable Global Futures Report, 2013
15 Of THE WORLD’S MOST InfLUEnTIAL BUSInESSES HAVE JOInED RE100 AnD MADE A gLOBAL COMMITMEnT TO 100% REnEWABLE POWER.
As part of the RE100 campaign’s ongoing work to chart the unique pathways bold business leaders are taking to the 100% goal, this Briefing shares insights into the action of individual companies to date, and illustrates emerging trends in renewable power options. Importantly, it also highlights where barriers to further progress exist and identifies how RE100 will play a role in addressing them.
The Climate Group has joined forces with CDP, We Mean Business1 and IRENA to kick start RE100. And we will work closely with other leading organizations supporting the scale up of renewable power.
Through reading this Briefing and seeing the progress already being made by leading businesses around the world, we hope you will be inspired to join us on our journey to 100% renewable power.
MAPPInG The journey
DECARBOnIZIng POWER SUPPLY
We already know why we need to decarbonize our power supply – and even how we will achieve it.
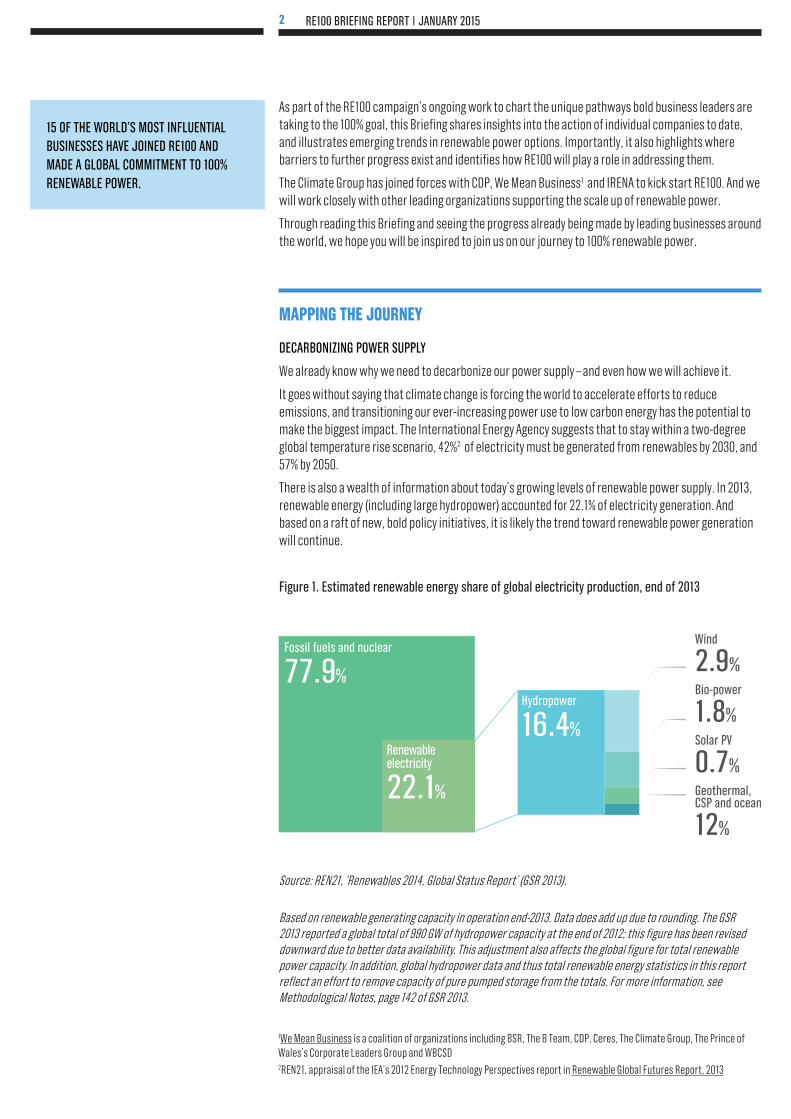
It goes without saying that climate change is forcing the world to accelerate efforts to reduce emissions, and transitioning our ever-increasing power use to low carbon energy has the potential to make the biggest impact. The International Energy Agency suggests that to stay within a two-degree global temperature rise scenario, 42%2 of electricity must be generated from renewables by 2030, and 57% by 2050.
There is also a wealth of information about today’s growing levels of renewable power supply. In 2013, renewable energy (including large hydropower) accounted for 22.1% of electricity generation. And based on a raft of new, bold policy initiatives, it is likely the trend toward renewable power generation will continue.
figure 1. Estimated renewable energy share of global electricity production, end of 2013
Wind
2.9%Bio-power
1.8%Solar PV
0.7%geothermal, CSP and ocean
12%
Hydropower
16.4%
fossil fuels and nuclear
77.9%
22.1%
Source: REN21, ‘Renewables 2014, Global Status Report’ (GSR 2013).
Based on renewable generating capacity in operation end-2013. Data does add up due to rounding. The GSR 2013 reported a global total of 990 GW of hydropower capacity at the end of 2012; this figure has been revised downward due to better data availability. This adjustment also affects the global figure for total renewable power capacity. In addition, global hydropower data and thus total renewable energy statistics in this report reflect an effort to remove capacity of pure pumped storage from the totals. For more information, see Methodological Notes, page 142 of GSR 2013.
Renewableelectricity

3 RE100 BRIEfIng REPORT | JAnUARY 2015
50%
40%
30%
20%
10%
0%
18.5%
28.8%30.5%
32.4%
38.9%
43.7%41.4%
13.7%.
8.5%7.8%6.9%6.1%
12.6%11.4%10.2%9.2%8.3%7.6%
5.2% 5.3% 5.9%
Renewable power capacity change as a % global power capacity change (net)Renewable power as a % global power capacityRenewable power as a % global power generation
However, while these high-level overviews provide useful context for mapping the overall path toward decarbonizing the power sector from a supply perspective, we currently have less understanding of the role played by energy users – such as businesses – and how they are shaping the future of the power market.
DECARBOnIZIng POWER SUPPLY
It is difficult to map the current total global demand for renewable energy from the private sector. Overviews exist for energy flows in general, but understanding business demand for renewable power specifically is more challenging to chart. Power companies and governments simply aren’t reporting on private sector use of renewable power in a way that is practical to collate.
But what is clear, is that a growing number of major businesses are determined to take all measures available to decarbonize their own energy use. A report from sustainability non-profit Ceres found 14% of the Fortune 100 have specific renewable energy commitments.6 These businesses’ decisions have been driven by rising and volatile energy prices, soaring costs of carbon, the threat of imminent carbon pricing and increasing high-profile leadership in the fight against climate change.
‘New’ renewables have played an increasingly important part in electricity generation over the last ten years.3 In Figure 2, the third line shows the share of world electricity generation represented by renewable energy excluding large hydro. This rose in 2013 to 8.5%, compared with 7.8% in 2012 and 5.2% in 2007. Overall, renewables (excluding large hydro projects) accounted for 41.3% of the new generating capacity installed worldwide in 2013.4 This demonstrates that new renewable power is steadily increasing its foothold in overall generation, and there is no sign of this trend changing.5
figure 2. Renewable power generation and capacity as a proportion of global power, 2006-2013 (%)
3,4,5 Frankfurt School, FS-UNEP Collaborating Centre and Bloomberg New Energy Finance, Global Trends In Renewable Energy Investment, 20146Ceres and David Gardiner & Associates, LLC, Power Forward: Why the World’s Largest Companies Are Investing in Renewable Energy, 20127CDP, Climate Change Program Reports
Source: Frankfurt School, FS-UNEP Collaborating Centre and Bloomberg New Energy Finance, ‘Global Trends In Renewable Energy Investment’, 2014

4 RE100 BRIEfIng REPORT | JAnUARY 2015
While it is challenging to quantify what exactly this transition means for global renewable power demand, we can see what companies are currently doing by analyzing CDP Climate Change 2013 and 2014 questionnaire data7, which is based on companies voluntarily reporting information from calendar or financial years 2012 and 2013. The full data set is limited, because only around 500 companies currently provide enough information – about their investments and carbon emission reductions from renewable power investments – to provide a data pool of approximately 650 investments, amounting to almost US$10 billion. However, our analysis of the data available provides a useful insight into how companies are using renewables to decarbonize power demand. It also highlights where RE100 can provide real value in increasing the visibility of trends in corporate renewable power, by collecting even more detailed data from companies through CDP.
APProACheS To SeCurInG reneWABLe PoWerDeveloping and implementing strategies for increasing renewable power differs across sectors and regions. Critical variables include the amount of power required, timing and geography, but businesses also have to choose whether it makes more sense to make a direct investment or work with a power provider – and which renewable power technology will work best for their needs.
Based on the CDP data reviewed for this report, Figure 3 outlines the level of spend companies are directing at various approaches to increasing renewable energy use. Figure 3 breaks this spend down further by sector.
figure 3. Breakdown of companies’ renewable power spend
% Of SPEnD
Installation: Multiple
40%
Installation: Hydro
<1%
Installation: Wind
3%
Purchase: PPA
2%
Purchase: ETI
2%
Installation: Solar PV
34%
Installation: Biomass
19%
power or CHP
7CDP, Climate Change Program Reports

5 RE100 BRIEfIng REPORT | JAnUARY 2015
figure 4. Breakdown of the number and type of renewable power investments by sector
Note: This is based on a total of 549 renewable power investments reported to CDP in 2013 and 2014 where companies provided financial and carbon saving information.
0 10 20 30 40 50 60 70
Installation: Biomass power or CHP
Installation: Hydro
Installation: Multiple
Installation: Solar PV
Installation: Wind
Purchase: PPA
Purchase: ETI
Transport
Retail
Manufacturing
ICT
Heavy industry
Consumer products
Construction
Commercial and professional services
enerGy eFFICIenCy
ALTHOUgH RE100 IS fOCUSED On InCREASIng CORPORATE USE Of REnEWABLE POWER, IT IS RECOgnIZED THAT EnERgY EffICIEnCY HAS A KEY ROLE TO PLAY In EnABLIng COMPAnIES TO REDUCE OVERALL EnERgY USE. IT IS OBVIOUS THAT REDUCIng POWER DEMAnD ALSO REDUCES EnERgY COSTS. AnD IT IS CLEAR A JUDICIOUS MIX Of EnERgY EffICIEnCY AnD CLEAn POWER WILL BE KEY TO A SUCCESSfUL AnD fInAnCIALLY ATTRACTIVE DECARBOnIZATIOn STRATEgY. COMPAnIES TAKIng PART In RE100 HAVE COMPREHEnSIVE EnERgY EffICIEnCY PROgRAMS THAT WILL HELP THEM ACHIEVE THEIR 100% REnEWABLE POWER COMMITMEnTS, BY REDUCIng OVERALL POWER DEMAnD.

6 RE100 BRIEfIng REPORT | JAnUARY 2015
THE VALUE In OWnIng POWER fOR BIg EnERgY USERS
The biggest energy users included in our data set are making the largest investments in their own renewables installations. This suggests companies see real value in direct investment in renewable power, whether they are on-site or off-site installations, and prefer direct investment to paying higher and likely rising energy costs through existing power providers.The most financially attractive direct investments made by the companies reviewed in our data (see Figure 5), are in biomass energy to produce heat and power for industrial processes. However, solar projects are also proving popular, and in some cases, wind makes commercial sense. As electricity prices climb and companies gain more experience and insight into the technologies that best work for them, it is likely the trend for direct investment in renewable installations will continue. It will also be interesting to see the new technologies that emerge. For example, Formula E has made a commitment to become the first motor racing championship to be powered by 100% renewable power and is already demonstrating alternative fuels such as glycerine based ‘Aquafuel’ that is used in generators to power Formula E cars.
InDIRECT InVESTMEnT In POWER PROVIDERS
Across all business sectors, working with electricity companies and power providers to set up power purchase agreements (PPAs) is a popular choice for companies that want to switch to renewable power, but don’t want to invest directly in power generation. Supporting funding of renewables through PPAs makes sense for companies that have a large power footprint across multiple facilities serviced by one power company, or those with a long-term and large power footprint across fewer locations that don’t offer good opportunities for renewable installations. It takes out the risk of ownership of the renewable energy asset, but it also means the company can’t make a financial return. However, a company may secure longer term firm pricing or price reductions through the PPA.
PoWer PurChASe AGreeMenT (PPA)
A POWER PURCHASE AgREEMEnT IS A COnTRACT BETWEEn An ELECTRICITY PURCHASER (ELECTRIC UTILITY OR EnD COnSUMER) AnD A PRIVATELY-OWnED POWER PRODUCER fOR THE PURCHASE Of ELECTRICITY gEnERATED BY A SPECIfIC PROJECT COnnECTED TO THE gRID. A PPA DEfInES REVEnUE fOR THE PROJECT, THE SCHEDULE fOR THE DELIVERY Of ELECTRICITY AnD OTHER COnTRACTUAL TERMS. PPAS ARE USED TO SECURE A REVEnUE STREAM fOR A PROJECT AnD AS SUCH ARE An InSTRUMEnT Of PROJECT fInAnCE. PPAS ARE SUBJECT TO POLICIES AnD REgULATIOn AnD TAKE DIffEREnT fORMS In DIffEREnT COUnTRIES OR SUB-nATIOnAL REgIOnS. THE TRAnSfER Of ELECTRICITY TRACKIng CERTIfICATES ISSUED BY THE PRODUCER TO THE PURCHASER ARE nORMALLY THE BASIS fOR CLAIMIng ZERO gREEnHOUSE gAS (gHg) EMISSIOnS AnD 100% REnEWABLE On THE POWER PURCHASED THROUgH A PPA.
BT
In the UK, which represents approximately 85% of BT’s total power use, the company has a contract with energy company npower to supply 100% of its electricity from renewable sources. BT has also entered into a number of PPAs directly with energy generators to purchase renewable energy, supporting the creation of new wind farms and a large solar array in Suffolk. BT plans to expand this further by reaching similar deals with energy providers outside the UK for worldwide operations.
As part of the BT-npower renewable energy contract, npower has initiated carbon labeling of electricity to provide assurance of its carbon status. Electricity is rated from A-G with A having the lowest carbon content. BT purchases 100% A-certified electricity. BT hopes this labeling system will increase demand for renewable energy and help increase investment in renewable energy infrastructure.
neSTLé
Following a power purchase agreement with Mexican wind-turbine company CISA-GAMESA, 85% of the total electricity consumed by Nestlé’s factories in Mexico is now supplied by wind power. Nestlé estimates that this will reduce air emissions, including GHGs, by more than 124,000 tons of CO2eq annually – comparable to taking 39,000 small cars off the road. It is the first food company in Mexico to obtain nearly all the electrical energy needed for its manufacturing operations from a renewable source.
8WWF, Corporate Renewable Energy Buyers’ Principles: Increasing Access To Renewable Energy, 2014
In the US, companies are keen to seek more options for purchasing renewable power directly from utilities. A group of leading businesses have come together with the support of WWF-US and the World Resources Institute to develop the Corporate Renewable Energy Buyers Principles8 in an effort to raise

7 RE100 BRIEfIng REPORT | JAnUARY 2015
awareness of corporate demand for renewable power. The initiative is gaining traction in the US and provides additional evidence of the desire big businesses have to increase their use of renewable power. RE100 will continue to track and collaborate with such aligned initiatives. In Europe, credible renewable electricity tariffs with independent verification are becoming popular with businesses that don’t have the time or resources to undertake their own feasibility studies, but want to make a simple switch. Renewable power utilities are also springing up to respond to increased demand from businesses keen to secure a quick and easy route to going 100%. Even mainstream renewable energy tariffs aren’t always the cheapest option, but many are becoming competitive. Plus, the additional brand and reputational value generated through employees and customers that choose these options is often worth the additional cost. Philips, J Safra Sarasin and Swiss Re have all used this approach to support the delivery of their 100% commitment. Providers, such as E.ON, see the long-term benefits of focusing on low carbon power generation.9
Green eLeCTrICITy TArIFFS
A gREEn ELECTRICITY TARIff IS A COnTRACT fOR ELECTRICITY SUPPLY WHERE PART OR ALL Of THE ELECTRICITY COnSUMED BY THE PURCHASER IS MATCHED BY REnEWABLE ELECTRICITY PURCHASES MADE BY THE POWER SUPPLIER. THE COnTRACT BETWEEn THE SUPPLIER AnD THE POWER PURCHASER CAn BE STRUCTURED In DIffEREnT WAYS WITH RESPECT TO THE QUAnTITY AnD QUALITY Of REnEWABLE ELECTRICITY THE PROVIDER WILL SUPPLY. THE POWER SUPPLIER, USUALLY An ELECTRIC UTILITY OR OTHER POWER MARKETER, MAY PURCHASE REnEWABLE ELECTRICITY fROM A VARIETY Of SOURCES AnD PROJECTS COnnECTED TO THE ELECTRIC gRID. THE BASIS fOR THE PURCHASER CLAIMIng THE ELECTRICITY PURCHASED IS REnEWABLE MUST BE APPROPRIATE CERTIfICATIOn AnD TRACKIng Of THE ORIgIn Of ELECTRICITY, AS WELL AS THE CAnCELLATIOn Of InSTRUMEnTS AT THE TIME Of COnSUMPTIOn.
eLeCTrICITy TrACKInG InSTruMenTS (eTIS)
COMPAnIES CAn CLAIM THE EnVIROnMEnTAL BEnEfITS Of REnEWABLE EnERgY BY ACQUIRIng ELECTRICITY TRACKIng InSTRUMEnTS, ISSUED BY A gRID-COnnECTED REnEWABLE POWER PRODUCER. InSTRUMEnTS LIKE REnEWABLE EnERgY CREDITS – KnOWn AS RECS (US), gUARAnTEES Of ORIgIn (EUROPE) AnD I-RECS (OTHER REgIOnS) – CAn BE PURCHASED SEPARATELY fROM ELECTRIC POWER, TO MATCH THEIR ELECTRICITY COnSUMPTIOn fROM nOn-REnEWABLE SOURCES. EACH MWH Of POWER COnSUMED HAS TO BE MATCHED WITH THE PURCHASE AnD CAnCELLATIOn Of An InSTRUMEnT TRACKIng OnE MWH Of REnEWABLE ELECTRICITY, ISSUED BY A PRODUCER COnnECTED TO THE SAME gRID. THIS OPTIOn IS AVAILABLE OnLY In COUnTRIES WITH APPROPRIATE TRACKIng SYSTEMS In PLACE.
SWISS re
Swiss Re introduced a carbon emissions reduction plan as part of its Greenhouse Neutral Programme in 2003. As three quarters of Swiss Re’s energy consumption comes from power use, switching to renewable power was a big part of the program, alongside implementing energy efficiency measures. Swiss Re has developed ‘minimum standards’ for renewable power sourcing, which in Switzerland means purchasing ‘naturemade star’ graded electricity, while in Germany, renewable power is purchased from energy company NaturEnergie.
KPn
KPN has made a commitment to have net zero CO2 emissions by 2020, which is supported by its aim to use 100% renewable power. The company has purchased renewable electricity in Holland since 2011, and 2% of the gas it consumes is biogas.KPN also believes in coupling renewable energy purchases with energy efficiency measures and smart ICT to reduce overall energy consumption. Any emissions from non-renewable sources are offset in the Netherlands using Gold Standard Climate compensation.
VERIfIED ELECTRICITY TRACKIng InSTRUMEnTS
The use of electricity tracking instruments (ETIs) is critical for many in the journey to going 100% renewable, but problems arise because there are so many different rules in different countries, and in some cases, different rules within countries. In other cases, there are no clear rules at all.ETIs offer a useful option for companies who rent a lot of their commercial space – or have lots of small offices and facilities where individual on-site generation or complicated PPAs simply don’t make sense. It allows them to essentially ‘offset’ their electricity. But while ‘good’ ETIs come with a guarantee that the renewable energy claims are unique to that company, some systems fall prey to the same credits being sold multiple times which leads to double counting. Companies joining the RE100 campaign understand the importance of accessing credible ETIs, which is an approach used by Commerzbank, KPN and Reed Elsevier. Further guidance on this will be developed by RE100 in collaboration with experts and other organizations that recognize the importance of establishing credible systems which enable companies to choose this option, knowing their contribution to renewable power use is genuine. Some types of ETIs have a limited and verifiable positive impact, so RE100 is committed to advocating and helping companies adopt renewable options that have the largest impact on emissions reductions.
9http://www.bloomberg.com/news/print/2014-12-01/eon-split-to-fortify-german-green-energy-transformation.html

8 RE100 BRIEfIng REPORT | JAnUARY 2015
InVeSTMenT In reneWABLe TeChnoLoGIeS By non-PoWer CoMPAnIeS
The total investment in renewable power technologies from companies included in the data analysis for this report amounted to US$9.8 billion. It is recognized that this is a small proportion of actual investment being made by businesses. However, data collection will be improved in the future because increased transparency in reporting is a key aim of RE100, with the CDP disclosure cycle as the primary tool we will use.
figure 5. The average investments in different technologies based on data reported to CDP.
Average investment per company (million US$)
Biomass power or CHP
Multiple typesof technology
Wind Solar PV Hydro
70
60
50
40
30
20
10
0
Note: This chart is based on a total of 408 on-site and off-site renewable power investments reported to CDP in 2013 and 2014 data sets where companies provided financial information.

9 RE100 BRIEfIng REPORT | JAnUARY 2015
SOLAR SHInES THROUgH
Power generation using photovoltaic panels (solar PV) is growing from strength to strength. BT, H&M, IKEA and YOOX Group all use solar PV as part of their 100% renewable strategy. Based on the data reviewed for this Briefing, it was found to be the most popular renewable power technology used across all sectors. And as costs of this technology continue to come down, the financial case for solar PV makes perfect sense. This is particularly the case where companies are building new facilities in areas with access to land or roof space and reliable sunshine. Many companies are putting panels in places where it is immediately visible to colleagues, customers and other stakeholders to showcase their commitment to renewable power. But solar PV is not just a vanity option. The Solar Energy Industries Association10 reports that companies in the US are adopting solar at unprecedented rates – with over 1,000 MW of solar PV installations added between 2012 and 2013. As of “mid-2013, cumulative commercial deployment totaled 3,380 MW at over 32,800 facilities throughout the country” – an increase of over 40% compared with 2012.
BIOMASS IS QUIETLY DELIVERIng MAJOR CARBOn CUTS
Although solar is the most popular choice of renewable power technology due to the relatively low installation costs and ease of application, biomass is playing an important role in supporting energy intensive sectors that need large amounts of power and heat, because it boasts strong financial returns [see Figure 6] as well as carbon emission reductions.
figure 6: Average annual CO2e savings for different renewable power investments
Installation: Biomass power or CHP
Purchase: PPA
Purchase: ETI
Installation: Multiple
Installation: Hydro
Installation: Wind
Installation: Solar PV
Installation: Solar thermal
0 25 50 75 100
Note: This chart is based on information from 393 companies that provided financial and carbon saving information on their renewable power investments to CDP in 2013 and 2014. 10Solar Energy Industries Association, Solar Means Business 2013: Top U.S. Commercial Solar Users

10 RE100 BRIEfIng REPORT | JAnUARY 2015
Waste from food or paper and pulp processing can be used as a biomass fuel for generating power and heat – both of which are critical for many industrial processes. These win-win opportunities make perfect sense from a holistic resource efficiency perspective, by helping to reduce both waste management and energy bills.
MArS
Mars has a wide range of renewable energy installations across its facilities globally. Food waste is used to generate power and heat in its Wrigley factories in Shanghai and Guangzhou, China; Poznań, Poland; Porici, Czech Republic; and Biesheim, France. These factories treat wastewater anaerobically, which produces biogas. The biogas is then used to fuel boilers and heat water. This approach prevents methane from being released into the atmosphere, in addition to reducing consumption of fossil-fuel derived natural gas by approximately 3% annually at these sites.
LARgE SCALE WInD
Based on the data set we looked at for this report, direct investments in more traditional large-scale generation technologies like hydro and wind projects are still dominated by the utility sector. However, two companies bucking this trend are IKEA and Mars. Both have made the bold commitment to be 100% renewable and this means looking at technology options that make economic sense for providing large amounts of power.IKEA’s most recent announcement was a 165 MW wind farm installation in Texas, the company’s single largest global investment in renewable energy. Mars also unveiled its Mesquite Creek 118 turbine wind farm, with a 200 MW output. This investment provides 100% of Mars US electricity needs, helping boost its global journey to 100% renewables.It is likely that as more companies make the ‘100% renewable power’ commitment, wind projects will become attractive options for those looking for solid investments that make long-term sense.
DIFFerenT reGIonS’ STrenGThSMany major companies committing to go 100% renewable know there will be some early wins in countries where on-site or off-site renewable power projects, PPAs and ETIs all make good business sense, and demonstrate a credible and authentic option. But many are also operating in regions like Asia, where the opportunities are less immediately obvious.In India, although there was a limited number of investments available for review, of the companies that did report to CDP, most are investing in solar PV and solar thermal projects, and gaining better financial and carbon returns on those investments than other renewables.

11 RE100 BRIEfIng REPORT | JAnUARY 2015
InFoSyS
In 2014 the solar PV installations on Infosys campuses in India produced 1,101 MWh of electricity, and in total, 30% of Infosys’ power came from renewable sources. The company plans to increase the solar PV installations on its campuses from 2 MW to 50 MW over the next two years. Increasing renewable power makes sense for Infosys due to conducive solar policies and increasing electricity and diesel costs. Infosys hopes to be carbon neutral by 2018, by reducing electricity consumption by 50% and sourcing the remaining energy from renewable sources.
As the world’s largest energy consumer, China is increasingly making renewable energy a top strategic development priority. According to REN21’s Global Status Report11, China led the rest of the world in renewable energy investment in 2013, spending a total of US$56.3 billion on wind, solar and other renewable projects. China’s push for renewables is supported by a host of policies and regulations aimed at encouraging energy efficiency and expanding domestic renewable energy deployment. To date, the majority of China’s renewable energy projects have been erected on a utility-scale basis. However, in January 2014 a new distributed solar PV subsidy took effect, which paves the way for corporations to invest in smaller on-site renewable energy projects. The subsidy encourages self-consumption, because payment for electricity sold to the grid is often 2-3 times lower than the cost of buying electricity from the grid. As such, the ideal adopter of PV in China is a commercial or industrial enterprise that can consume the majority of electricity generated at source.
figure 7. numerous corporate solar PV projects are already starting to be realized in China.
20 MW PV projectannounced April, 2014
14.62 MW PV projectannounced november, 2014
4 MW PV projectannounced October, 2014
50 MW PV projectannounced September, 2014
35 MW PV projectannounced May, 2014
10 MW PV projectannounced July, 2014
50 MW PV projectannounced December, 2013
13 MW PV projectannounced October, 2013
11REN21, Renewables 2014 Global Status Report

12 RE100 BRIEfIng REPORT | JAnUARY 2015
Given the excellent solar resources in China, on top of subsidies and tax incentives, solar PV can provide attractive returns on investment. Although awareness of the opportunities is currently relatively low, increased visibility of projects through initiatives like RE100 will help demonstrate what can be achieved to help scale the growth of corporate demand for renewable power.
The PoWer oF FInAnCIAL reTurnSOne of the biggest challenges for many companies looking to go 100% renewable is the lack of data about the financial returns associated with the various renewable options.All of the companies currently in the RE100 campaign have made a significant investment of their time and resources in identifying the best options. But they also recognize that to get to the scale of renewable power needed to reduce emissions globally, many more companies need to follow the path to 100%.Part of the role of RE100 is to raise awareness about the options and the associated financial benefits companies can expect to achieve, in order to attract more businesses to switch to renewable power.Based on the data reviewed as background to this report, the global average IRR for renewable power investments ranged from 0-18%. Figure 8 indicates how this breaks down across technologies.
figure 8: Average internal rate of return (IRR) on renewable power investments
Biomass power or CHP
Multiple typesof technology
Hydro Solar PV Wind
18
14
9
5
0
Note: This chart is based on a total of 339 on-site and off-site renewable power investments reported to CDP 2013 and 2014, where companies provided financial information and stated an expected lifetime of the project. It should also be noted that the information provided for hydro is based on information from one investment.
% IRR
13 RE100 BRIEfIng REPORT | JAnUARY 2015
There are also significant ranges in the financial returns across technology types applied in different industry sectors. And there are certainly challenges caused by the lack of information being disclosed about investment in renewable power projects by companies outside of the power sector. But as part of RE100, the intent is to increase transparency in this area and build a clearer picture of the growth in demand from major corporations to decarbonize their power supplies.
nEXT STEPS TO 100% REnEWABLE
This RE100 Briefing Report provides an initial snapshot of the appetite major businesses have to drive demand for renewable power.Over the next five years, The Climate Group and CDP, with the support and collaboration from many others, aim to increase awareness of the business case for renewable power and encourage others to commit to the journey – our target is that by 2020, 100 of the world’s most influential businesses join RE100 and commit to 100% renewable power.
To find out more contact [email protected] or visit theRE100.org.
Follow the conversation on Twitter by using: #RE100
Partners are also invited to join RE100 on LinkedIn for discussion in an exclusive group.
ACKnOWLEDgEMEnTS
Powered by
CDP data analysis provided by Point380China analysis provided by Azure International
Author: Emily farnworthEditor: Clare SaxonDesigner: Jo Violaris

14 RE100 BRIEfIng REPORT | JAnUARY 2015
In PARTnERSHIP WITH:
CDP is an international NGO that provides the only global system through which more than 5,000 companies and 207 cities report, manage and share vital environmental information. These insights enable investors, companies and governments to mitigate risks from the use of natural resources and identify opportunities from taking a responsible approach to the environment. Please visit www.cdp.net.
@CDP
An InITIATIVE Of:
The Climate Group is an award-winning, international non-profit. Our goal is a prosperous, low carbon future. We believe this will be achieved through a ‘clean revolution’: the rapid scale-up of low carbon energy and technology.
We work with corporate and government partners to develop climate finance mechanisms, business models which promote innovation, and supportive policy frameworks. We convene leaders, share hard evidence of successful low carbon growth, and pilot practical solutions which can be replicated worldwide.
@Climategroup
SUPPORTED BY:
The International Renewable Energy Agency (IRENA) is an intergovernmental organisation that supports countries in their transition to a sustainable energy future, and serves as the principal platform for international cooperation, a centre of excellence, and a repository of policy, technology, resource and financial knowledge on renewable energy. IRENA promotes the widespread adoption and sustainable use of all forms of renewable energy, including bioenergy, geothermal, hydropower, ocean, solar and wind energy in the pursuit of sustainable development, energy access, energy security and low-carbon economic growth and prosperity.
@IREnA
An ACTIOn Of:
We Mean Business is a coalition of organizations working with thousands of the world’s most influential businesses and investors. These businesses recognize that the transition to a low carbon economy is the only way to secure sustainable economic growth and prosperity for all. To accelerate this transition, we have formed a common platform to amplify the business voice, catalyze bold climate action by all, and promote smart policy frameworks.
@WMBTweets
THECLIMATEGROUP.ORG | THECLEANREVOLUTION.ORGTWITTER.COM/CLIMATEGROUP | #CLEANREVOLUTION
europe | London | +44 (0)20 7960 2970 China | Beijing | Hong Kong | +86 (0) 10 64403639India | New Delhi | +91 11 4200 3342north America | New York City | +1 (646) 233 0550