the journal of biological chemistry vol. … sensitivity and substrate specificity of ... enterocyte...
TRANSCRIPT

THE JOURNAL OF BIOLOGICAL CHEMISTRY 0 1986 by The American Society of Biological Chemists, Inc.
Vol. 261, No. 14, Issue of May 15, pp. 6168-6176 1986 Printed in C?.S.A.
Temperature Sensitivity and Substrate Specificity of Two Distinct Na+-activated D-Glucose Transport Systems in Guinea Pig‘Jejunal Brush Border Membrane Vesicles*
(Received for publication, February 4, 1985)
Edith Brot-Laroche, Maria-Angeles SerranoS, Brigitte Delhomme, and Francisco Alvarado From the Centre de Reeherches sur Ea Nutrition, Centre National de la Recherche Scientifiqique, 9 Rue Hetzel, 92190 Meudon, France
D-Glucose transport was studied with isolated brush border membrane vesicles from guinea pig jejunum. Saturatiop curves were carried out at either 25 or 35 “C in buffers containing Na+, Li+, K+ (100 mM chlo- ride salt), or sorbitol (200 mM). Uncorrected uptake rates were fitted by nonlinear regression analysis to an equation involving one diffusional and two satura- ble terms. In the presence of Na+ at 35 O C , two satu- rable systems (K, = 0.4 and 24 mM, respectively) were evident, as well as a diffusion component quantita- tively identical with that measured with L-glucose in separate experiments. In contrast, at 25 “C only one saturable system was apparent (K, = 1.2 mM): the second exhibited diffusion-like kinetics. In the pres- ence of Na+ at 35 “C, D-glucose uptake was fully inhib- ited by both D-glucose and D-galactose, whereas a- methylglucoside gave kinetics of partial inhibition,
We conclude that in the presence of Na+ there are at least two distinct D-glucose transport systems: 1) Sys- tem I, a low temperature-sensitive system, fully inhib- ited by D-glUCOSe, D-galactose, and a-methylglucoside; we identify it as the “classical” D-glucose/Na+ cotrans- port system, insensitive to inhibition by cytochalasin B and obligatorily dependent on Na+; and 2) System II, a high temperature-sensitive system where D-glu- cose and D-galactose inhibit but a-methylglucoside is inert. Its cation specificity is unclear but it appears to be sensitive to cytochalasin B inhibition.
When Li+ or K+ substituted for Na+, only one trans- port system was apparent. The Li+-activated transport was: 1) independent of the incubation temperature; 2) inhibited by D-glucose and D-galactose but not by a- methylglucoside, 2-deoxy-~-giucose, D-mannose, and D-XylOSe; and 3) sensitive to cytochalasin B inhibition.
The exact nature of the system (or systems) involved in D-glucose transport in the absence of sodium remains to be established.
* This project was supported by Contract 82.7001 from the Institut National de la Santb et de la Recherche MBdicale and Contract 4812 (ATP International, 1981) from the Centre National de la Recherche Scientifique. Part of this work was presented at the Sixth Meeting of the European Intestinal Transport Group, Pamplona, Spain, Septem- ber 27-29,1984 and at the conference on Membrane Transport Driuen by Ion Gradients, New York Academy of Sciences, New York, October 2-4, 1984 (1). The costs of publication of this article were defrayed in part by the payment of page charges. This article must therefore be hereby marked “aduertisernent” in accordance with 18 U.S.C. Section 1734 solely to indicate this fact.
$ Fellow of the Fondation pour la Recherche MBdicale Fransaise, Paris. Present address: Dept. of Biochemistry, School of Pharmacy, University of Salamanca, Spain.
D-Glucose uptake across the brush border membrane of the enterocyte involves a secondary active transport mechanism where the energy for the uphill sugar influx comes from the dissipation of an inward-directed sodium electrochemical gra- dient (2-7). The molecular basis of this cotransport is believed to consist of a carrier protein (or proteins) with at least two distinct sites, one specific for sugar and one for sodium. To reconcile experimental results obtained both with intact tissue and with isolated brush border membrane vesicles, Alvarado and Lherminier (8) postulated that Na+ behaves as an oblig- atory (essential)’actiuator, meaning that, in the absence of this cation, the sugar transport rate is nil. The unequivocal demonstration of this proposal would require the use of iso- lated membrane vesicles because intact tissue preparations contain a source of sodium that replenishes a “sodiu,m reser- voir” located at the external side of the brush border mem- brane, meaning that, in practice, zero sodium conditions cannot be obtained with regular intact tissue preparations (8, 9). Only with isolated brush border membrane vesicles can full control of both the extra- and intravesicular spaces be obtained.
In the present work, using isolated brush border membrane vesicles, we thus aimed at establishing whether, as postulated, D-glucose uptake is nil in the absence of Na”. To achieve this goal, it was first necessary operationally to define the bound- ary separating transport from diffusion (zero transport). Ex- periments were therefore performed to quantitate D-glucose uptake and to compare it directly with that of presumed diffusion markers such as L-glucose or D-mannitol, both in the presence and in the absence of Na+.
Our results lead us to conclude that, above simple diffusion, D-glucose uptake across the brush border membrane of guinea pig jejunum is complex. In the presence of sodium, it involves at least two distinct transport agencies, one of which we identify with the classical D-glucose/Na’ cotransport system, where Na+ is an obligatory activator. Although in the absence of sodium saturable D-glUCOSe transport also occurs, we do not yet have enough information to choose one among several possible transport mechanisms that we discuss.
EXPERIMENTAL PROCEDURES
Animals-Adult guinea pigs of either sex weighing 400-500 g were used. These had free access to food and their drinking water contained sufficient vitamin C to keep them in good health. The animals were killed by a blow to the head. The jejunum was quickly removed, everted, and washed with saline prior to storage at -20 ‘C.
Materials-All reagents were of analytical grade. The a- and @- methyl-D-glucopyranosides (aMG1 and BMG, respectively) were freed
The abbreviations used are: aMG, a-methyl-D-glucopyranoside; EGTA, [ethylenebis(oxyethylenenitrilo)]tetraacetic acid; Hepes, 4- (2-hydroxyethyl)-l-piperazineethanesulfonic acid; HMBA, Hepes/
6168
Temperature and Intes&inaE D-Glucose/Na+ Cotransport 6169
from contaminating D-glucose by chromatography on Dowex 1 resin in the hydroxide form (10). Sugar and radiochemical purity were checked by using thin layer chromatography aluminum sheets pre- coated with Silica Gel 60 (0.2 mm thick, activated for 30 min at 100 “C; Merck) with n-butyl alcohol/acetone/water (4/5/1, v/v) as the solvent (11). D-[U-’4C]glUCOSe and ~-[l-~H]glucose were from either New Endand Nuclear or the Centre d’Etudes Nucleaires a t - Saclay, France.
Vesicle Premration-Vesicles were ureuared with the Mg+/EGTA precipitation kethod of Hauser et al. 112j, with slight mo&fications. Further details, including preparation of the HMBA (Hepesln-bu- tylamine/maleic acid 10/7/7 mM, pH 7.4) incubation buffer are given in Brot-Laroche and Alvarado (13). Protein content was measured with the Bio-Rad assay kit. The vesicles, adjusted to about 25 mg of protein/ml, were stored in liquid nitrogen until the day of each experiment.
Assays-Substrate uptake by the vesiculated brush borders was determined by using a rapid filtration technique, essentially as de- scribed by Hopfer et al. (14). Incubations were started by mixing the concentrated vesicle preparation with appropriate incubation media which contained (final concentrations): (i) the HMBA buffer, pH 7.4; (ii) single-label (i.e. either 3H or 14C) substrate; (iii) 100 mM salt (unless stated otherwise, NaC1, KCl, or LiC1); and (iv) enough sorbitol to keep the osmolarity constant. The intravesicular media contained only the HMBA buffer plus sorbitol (500 mM) and all experiments were performed with the same inward-directed net osmotic gradient (100 mOSM). Experiments were performed either a t room or at con- trolled temperature (23,25, or 35 “C) using a Short-Time Incubation Apparatus (Innovativ Labor AG, Switzerland; see Kessler et al. (15)). At the end of each incubation, the reaction was stopped with 2.5 ml of ice-cold stop solution containing the HMBA buffer, 350 mM KC1 and 25 mM MgS04. The diluted samples were rapidly filtered under vacuum through cellulose-nitrate membrane fiters (0.65 pm pore, 25 mm diameter, Sartorius, GmbH, Gotingen, Federal Republic of Ger- many) which were then rinsed twice with 5 ml of ice-cold stop solution. The entire procedure lasted less than 15 sec. Appropriate blanks were made to correct for unspecific marker retention on the filters. After dissolution of the filters in 4 ml of scintillation fluid (Aqualuma plus, Kontron), radioactivity was measured in a scintil- lation spectrometer.
Expression of the Results-All results are expressed either (i) as absolute velocities in pmol/mg of protein/s or (ii) as relative velocities (nl/mg of protein/s), where the absolute velocities are divided by the substrate concentration (13).
Fit of Transport Results to the Michaelis-Menten Equation-Ab- solute velocity data as a function of substrate concentration were fitted by iteration to a complex equation involving the sum of one nonsaturable and two saturable components (16, 17). For further details, see the text.
Statistical Analysis-Uptake data were compared by means of a one-way analysis of variance (18, 19). Saturation curves were solved by applying a nonlinear regression analysis that includes an F test (16). All calculations were performed with a Hewlett-Packard 85 microcomputer.
RESULTS AND DISCUSSION
The Kinetics of Substrate Uptake We assume that total uptake by brush border membrane
vesicles is the sum of diffusion and transport components. Since transport may involve one or two saturable components exhibiting Michaelis-Menten kinetics, we adopted the prop- osition that, in our system, the total uptake rate, ut, is given by the complex equation:
which is the sum of two saturable components and one dif- fusional term (17). Since one of the main objectives of our work was to study the mechanism of D-glucose uptake in sodium-free buffers, it was essential to begin by establishing the boundary between transport and diffusion. Therefore, our
maleic acid/n-butylamine buffer; LTS, low temperature sensitive; HTS, high temperature sensitive.
-
first step was to assess rigorously the diffusional component, given by the term Kd. [SI in Equation 1. TO achieve this goal, two conceptually different experimental approaches were used.
Use of L-Glucose and D-Mannitol as Diffusion Probes L-Glucose and D-mannitol are frequently used as diffusion
markers to correct monosaccharide transport data, both with intact tissue (20,21) and with isolated brush border membrane vesicles, although here the literature is inconsistent (see be- low). Use of these sugar analogues as diffusion markers is justified because: (i) physically, they are very similar to D- glucose and therefore should exhibit similar diffusibility and (ii) they have a negligibly small affinity for the intestinal monosaccharide transport system(s) and therefore behave in practice as “nonsubstrates” (7, 20, 21). To verify the appro- priateness of using these diffusion markers in the present work, we applied the relative velocity test, which is useful to establish whether or not an uptake involves only diffusion (13). The definition of diffusion in terms of relative velocities is an operational one and is indeed quite powerful. If diffusion is defined as a flux whose rate (vd) is unaffected by changes in the concentration of either the marker itself or indeed of any regular activator or inhibitor, we have that:
vd = Kdm’[s] (2)
and that the relative velocity, up, is:
v,=”=I(d [SI
(3)
where K,, is the kinetic diffusion constant assessed by using appropriate markers, not to be confused with K,, which is described below. The results shown in Table I demonstrate that between 4 and 10 s the L-glucose and D-mannitol uptake rates are constant in the concentration range of to 10-1 M. Furthermore, they are unaffected by the ionic composition of the media and the presence of either D-glucose, D-galactose, a-methylglucoside, or phlorizin at concentrations expected to inhibit fully any monosaccharide transport. The entire body of vr results obtained with either L-glucose (2.68 nlfmg of protein/s) or n-mannitol (2.80 nl/mg of protein/s) are statis- tically indistinguishable and constitute a reliable measure of kdm.
ud
D-Glucose Uptake in the Presence or Absence of Na+: the Boundary between Transport and Diffusion
Much published kinetic work on solute/Na+ cotransport across isolated membrane vesicles is based on the assumption that uptake in the absence of Na+ can be equated with diffusion. Along the same lines, many workers classify trans- port into two distinct categories: sodium-dependent and so- dium-independent. The assumption is also made that total uptake in the presence of Na+, minus the uptake in the absence of this cation, gives an appropriate measure of “SO- dium-dependent uptake.” However, all the above assumptions seem gratuitous in the absence of a solid understanding of the mechanistic significance of substrate uptake under sodium- free conditions. To add further confusion to the issue, many workers fail to distinguish between metal-free and Na+-free conditions, i.e. conditions where Na+ has been substituted by other metals such as K’, Li+, or Mg‘, by organic cations such as Tris+ or choline+, or even by nonionic substances such as mannitol or sorbitol.
In the present work, therefore, we have not made any assumptions and we have begun with the question: Where exactly does transport begin and diffusion end? The data in
6170 Temperature and Intestinal D-GEucose/Na+ Cotransport
TABLE I L-Glucose and D-mannitol uptake in the presence of either sodium or lithium: effect of various sugar analogues Uptake data are presented as relative velocities (units = nl/mg of protein/$. The diffusion markers were present
either in trace amounts (T, 1O"j mM) or at concentrations ranging from 0.1 to 300 mM. All other conditions are similar to those in the legend of Fig. 1.
Marker (range) Effector Range Cation (100 mM) Time (nl Relative + S.D,) velocity
L-Glucose
(n) mM mM s
T 10-300 Na+ 10 3.2 f 0.8 (33)
D-Glucose 10-300 Na+ 10 2.4 f 0.8 T
(33)
T a-Methylglucoside 10-300 Na+ 10 2.7 f 0.8 (37) D-Galactose 10-300 Na+ 10 2.4 f 0.9 (35)
T D-Glucose 10-150 Li+ 4 2.8 f 1.4 (232) T D-Glucose 10-150 + phlorizin, 0.5 mM Li+ 4 2.7 f 1.8 (112)
0.1 Li+ 10 3.5 f 1.4 (9) D-Mannitol
10 10
Li+ 10 2.1 f 0.9 (9) Na+ 10 2.9 f 0.8 (6)
I 1 0
5 * 4 1 ' 1
15
2.
D-glucose "
D-mannitol 1-glucose
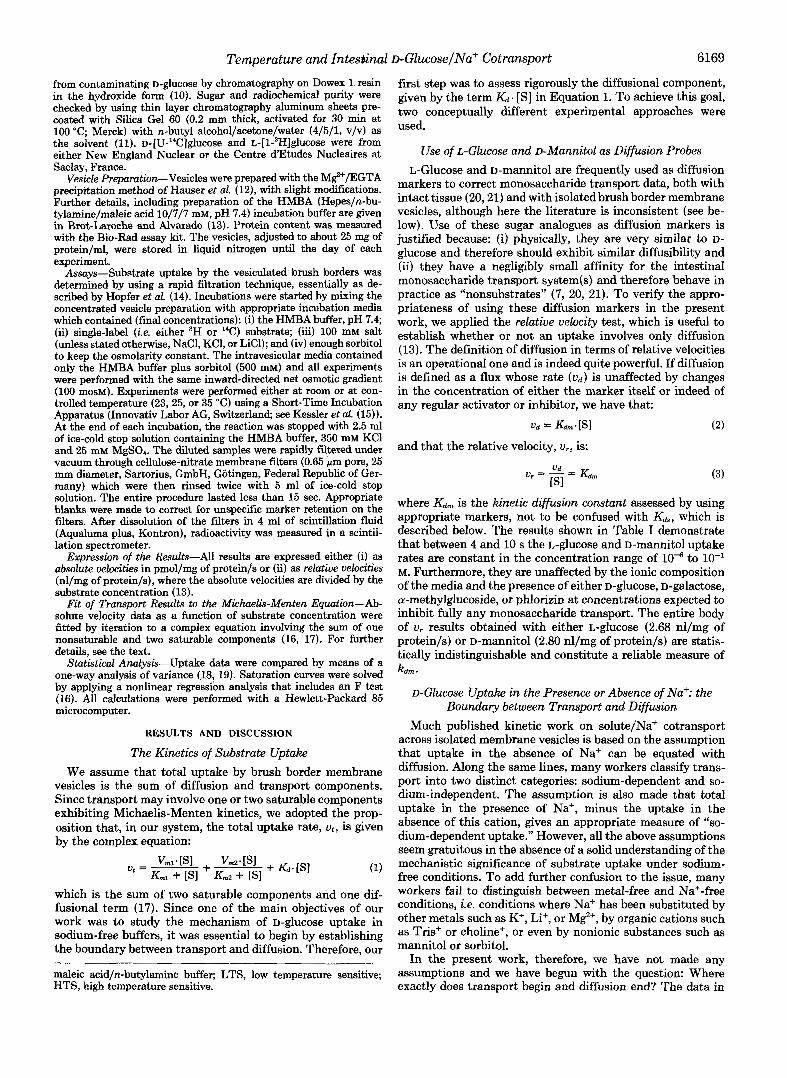
FIG. 1. Uptake of D-glucose, L-glucose, and D-mannitol in the presence or absence of monovalent cations. Vesicles were incubated for 10 s at room temperature under standard conditions that included a cation gradient ([out]/[in] = lOO/O mM). The chloride salts used are indicated in the columns. SORE means that the 100 mM cation chloride had been fully substituted by 200 mM sorbitol. The relative velocities are given as n1.mg-l protein. s-l +. S.E., n ranging from 5 to 40 determinations/point. The D-mannitol and L- glucose relative velocities were found to be unaffected by the cation present in the medium, so that the results are averaged, irrespective of the cation present. The concentration (mM) of the various sub- strates used is indicated under each column. For the D-glucose uptake data in the presence of Na+, the arrow indicates that the level reached here far exceeds the figure limits.
Fig. 1 permit a direct comparison of the uptake of D-glucose with that of L-glucose and D-mannitol which, as shown in the preceding section, are a measure of uptake by simple diffusion. In Fig. 1, therefore, the uptake level of either L-glucose or mannitol marks the boundary separating diffusion from trans- port, and any uptake taking place above this limit (2.5 nl/mg of protein/s, lower horizontal line) can be considered as in- volving stereospecific transport. It will therefore be useful to define net uptake or transport as that uptake remaining after the diffusion component has been subtracted. If we now compare D-glucose transport rates in the presence and in the absence of Na+, the activating effect of this cation is evident (Fig. 1). However, it is also clear that, in the absence of Na+, some D-ghCOSe transport occurs.
The results with Na+ seem easy to interpret. As expected from any saturable system, the D-glucose relative velocity drops drastically as the substrate concentration increases from 0.1 to 10 mM. At a quantitatively lower level, the same results have been obtained with Li+ suggesting that, in the
presence of this cation, D-glucose transport also involves a saturable carrier. With K+ or in the complete absence of metal (sorbitol experiment), the results are statistically homogene- ous with 0.1 and 10 mM glucose (a 100-fold concentration difference) indicating that, here, net uptake follows "diffu- sion'' kinetics. This point is highly relevant to our present analysis. Superfkially, the results in Fig. 1 would seem to support the notion that D-glucose uptake in either K+ or sorbitol occurs by simple diffusion, thereby justifying two practices frequently found in the literature: (i) to assume that transport can be simply classified into sodium-dependent and sodium-independent and (ii) to assume that, by subtracting the uptake in K+ or similar sodium-free conditions, an appro- priate correction for Na+-dependent transport kinetics has been achieved (22-29). However, the difference between the D-glucose uptake level in either K+ or sorbitol (13 nl .rng-' protein. s-l) and the diffusion boundary measured with mark- ers (Fig. 1) permits the conclusion that D-glucose uptake under these conditions involves a very low affinity carrier. This has been confirmed by experiments to be discussed below.
Kinetic Analysis of D-Glucose Transport To characterize further the effect of the alkali-metal ions
on D-glucose transport, a kinetic study was made under con- ditions similar to those in Fig. 1. For the kinetic analysis that follows, total uptake rates were used and the diffusion com- ponent was estimated by iteration (16). We shall see that the diffusion constant assessed with this method, K,, agrees well with that determined with markers (Kdm, see above). To assess K& with a certain degree of accuracy, our iteration procedure would require the use of substrate concentrations well above any system's saturation point. Since our data indicated that we were dealing with low affinity systems, particularly when Na+ is absent, we were confronted with two practical prob- lems. First, we reasoned that, in order to maintain a constant osmotic difference across the membrane (100 mosM), a 350 mM substrate concentration limit should not be exceeded. Second, use of high substrate concentrations implies dilution of the radioactive label which either increases the cost of the experiment or drastically increases the error, or both.
Kinetics in the Presence of Na+: Effect of Temperature Two parallel sets of experiments were performed at 25 or
at 35 "C. In both sets (Fig. 2) initial uptake rates were meas- ured statistically identical velocities were found with either 2- or 3-s incubations. We found that D-glucose transport by
Temperature and Intestinal D-Glucose/Na+ Cotransport 6171
V slope of the saturation curve in Fig. 2) is much greater at
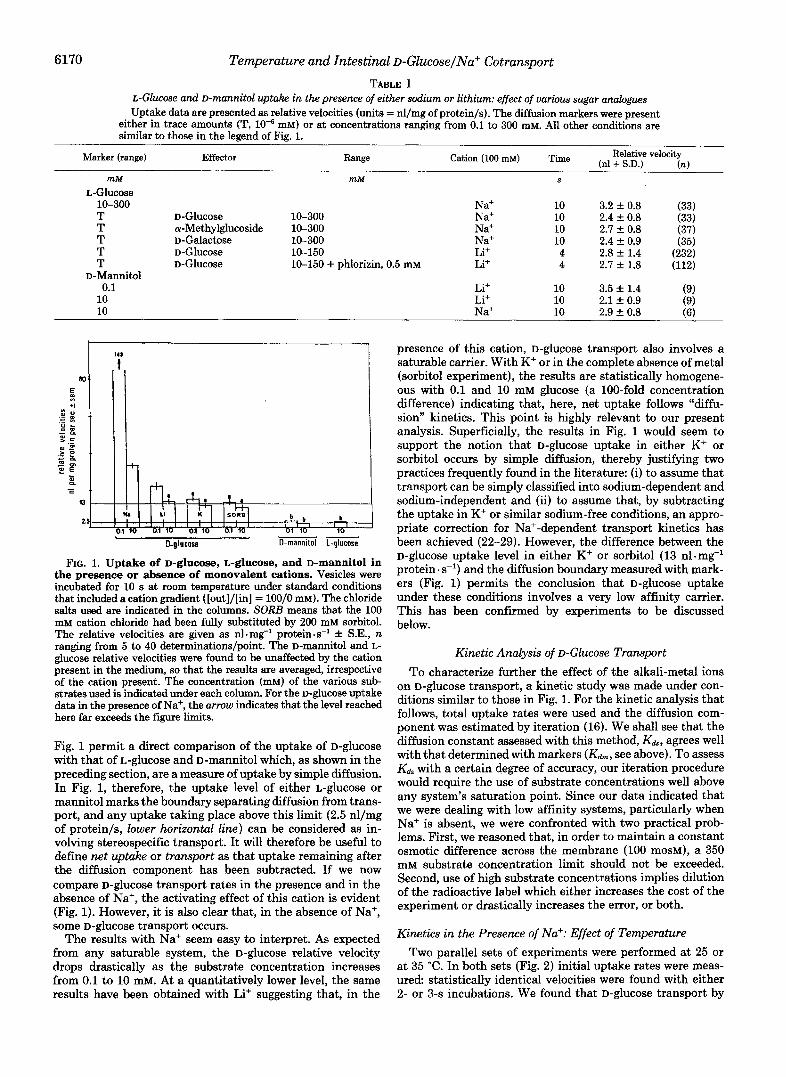
The data at 35 "C seem easy to interpret. First, the best fit (Table 11, line 4) yields a Kd = 5 -I- 3 nl.mg-' protein .s-', reasonably in accord with the results found with diffusion markers (&, = 2.8 nl; Table I). Second, this fit reveals the existence of two distinct transport systems. If one of them is eliminated by fixing Vd to zero, the value of F increases from 0.97 to 4.31, which is an unacceptable fit (compare lines 3 and 4 in Table 11). We define the two systems as follows: (i) System I or LTS, the low temperature-sensitive system with a high affinity (Kml = 0.4 mM) and a low capacity ( V,, = 336 pmol mg" protein s") and (ii) System II or HTS, the high temperature-sensitive system which exhibits a low affinity (Km2 = 24 mM) and a high capacity (V,, = 2233 pmol).
At 25 "C, however, the situation is less clear because the
Indeed, when the fit of Equation 1 was attempted without imposing any restrictions (all five parameters to be fitted were allowed to float), the computer was unable to find one. To resolve this difficulty, we successively imposed the following two restrictions.
(a) We first fixed V,, to zero, which is equivalent to saying
A 25 "C than at 35 "C. 4.
50 150 250 350
D - a l u c o s e . m t . 4 low affinity system cannot be distinguished from diffusion.
that'only one saturablesystem exists. This restriction yielded a good fit but a value for Kdp (9 nl; Table 11, line 1) that was too high when compared to either Kd,,, or to the K d s value observed at 35 "C. This result suggested that an apparent diffusion was hiding a low-affinity system. If one of the two saturable components in Equation 1 has an exceedingly low affinity for the substrate, the assumption would be warranted that Km2 >> [SI at all practical values of [SI. In that case, the
--: -_-_____-__ s--- corresponding Michaelian term would simplify to give:
b K d S v l t s ) , n l p e r m g p r o t e i n P e r s e c o n d
100 200 300 4 0 0 VlnYWl - v, uz = - [SI = k . [SI (4)
L 2 + [SI
FIG. 2. Sodium/D-glucose cotransport: the effect of temper- ature. Vesicles were incubated for 2 s at either 25 "C (0) or 35 "C (B) in media containing: (i) 10 mM HMBA buffer, pH 7.4; (ii) 100 mM NaCl; (iii) U-14C-labeled D-glUCOSe in the concentration range from 0.1 to 350 mM; and (iv) sufficient sorbitol to keep the osmolarity constant. The data are illustrated either: A, as direct plots, u = f[S]; or B, according to Eadie-Hofstee. Solid curves are the theoretical ones
.calculated by iteration (parameters listed in Table 11). Straight dotted lines represent the decomposition of the total uptake rates into their individual components. Further details in the text.
guinea pig vesicles is very temperature-sensitive and even suggests the existence of kinetic differences at 25 and at 35 "C. The most salient feature of our results (summarized in Table 11) is that the apparent diffusion constant (given by the
where k is a constant. Equation 1 would then become:
or
In other words, the apparent diffusion constant estimated by iteration, K'&, is probably the sum of the true Kh plus the additional constant, k, representing the low affinity second transport system:
K'dr = K* + K (7)
TABLE I1 Kinetic parameters for 0-glucose uptake in the presence and in the absence of Nuf: effect of temperature
Uptake rate data were fit by nonlinear regression analysis of Equation 1. Parameter values in parenthesis indicate that they were fixed before attempting the corresponding iteration, the remaining parameters being allowed to float. Uptake data with either K+ or sorbitol were statistically homogenous and have been pooled for nonlinear regression analysis. The F test includes the degrees of freedom between brackets (16).
"C Na+ 25
35
Li' 25 35
K+, sorbitol 25 35
p m l . s-' mM 307 f 34 1.3 f 0.3 290 k 28 1.2 & 0.2
1007 +. 128 336 f 87
1.8 f 0.3 0.4 f 0.2
1006 +. 377 537 f 159 34 f 12
28 f 13 358 f 102 48 f 16 959 f 314 70 -+ 25
prno1.s" (0) 107 lo6 13) (0)
rnM n1.s" 9 f l 1.86 [10,112]
1.00 [8.107] 13 f 2 4.31 [9.105]
2233 f 671 24 f 13 5 t - 3 0.97 [7,105] 2 f 0.5 0.47 [5,174] 5 t - 1 0.69 [5,39] 1 f 0.3 2.63 [5,186] 3 f 1 4.64 [5,148]
6172 Temperature and Intestinul D-Glucose/Na+ Cotransport
(b) To test this hypothesis, we fixed Kds = Kdm = 3 nl and allowed Vm2 to.float. The computer yielded a good fit (Table 11, line 2) where: (i) Vml and Kml did not differ appreciably from the previous fit and (ii) the existence of a second Mi- chaelian system with an exceedingly low affinity (Kmz = lo6 mM) became apparent? This result yields a ratio Vmz/Km2 = 7 nl. mg-'. s-'. Substituting in Equation 7, we obtain that K f d s = 7 + 3 = 10 nl, which is essentially identical to the apparent Kds obtained by iteration when Vmz was fned to zero.
These results confirm that, in the presence of sodium, there are two distinct D-glucose transport systems differing in tem- perature sensitivity. The LTS system is essentially unaffected when the temperature changes from 25 to 35 "C. In contrast, the HTS system seems to be extremely temperature-sensitive. Its K,,, changes from exceedingly high values at 25 "C to an apparent K , at 35 "C that, although still much higher than that of system LTS, is nevertheless in the mM range (Kmz =
The Eadie-Hofstee plots in Fig. 23 illustrate clearly the coexistence at 35 "C of the LTS (lower arrow, Vml) and the HTS ( Vmz) systems. At 25 "C, on the contrary, only the LTS system is readily apparent. It gives a straight line that con- verges to the Vml intercept, whereas the HTS system is hidden by the diffusion-like uptake illustrated by the vertical line labeled K'ds.
These results strongly suggest that the activity of the two Na-activated transport systems is modulated by the physical state of the brush border membrane lipids (30-33). Each transport system can be considered as being in a "basal state" below the transition temperature and in an "activated state'' above that temperature. Accordingly, the two systems de- scribed in this section may be postulated to have widely different temperature responses. System LTS would have its transition below 25 "C, explaining its being unaffected by a temperature jump from 25 to 35 "C. In contrast, the temper- ature transition for system HTS probably lies between 25 and 35 "C. In support of this working hypothesis, experiments on D-glucose uptake in renal brush border membrane vesicles have revealed the existence of a temperature transition around 15 "C: under similar conditions, L-glucose has been found to exhibit no break (30, 31). Why was there no evidence for a break in the 15 to 35 "C range in these experiments? One possible explanation is that the highest temperature used was 30 "C, not high enough to reveal the second break. Also, the substrate concentration (1 mM) was probably insufficient to provide evidence for the low-affinity system HTS. However, other work on D-glucose transport by brush border membrane vesicles from rat intestine has revealed the existence of a temperature transition in the 25 to 35 "C range (32, 33).
To date, most studies on D-glUCOSe transport by isolated brush border membrane vesicles have been performed at a single temperature, generally ranging from 17 to 25 "C. The HTS system has therefore been ignored until now. At 25 "C and below, this sytem exhibits diffusion-like kinetics, meaning that its relative contribution to the total substrate uptake will change drastically as the D-glUCOSe concentration is varied, affecting the results accordingly. Based on the kinetic data listed in Table 11, Fig. 3 illustrates the relative proportions at either 25 or 35 "C of the two saturable and the diffusional components we have found in the presence of Na+. At both temperatures, because of its high affinity, the LTS system is nearly 100% at first, then falls rapidly as the D-glucose
Of course, we do not pretend that the numerical value found for K,, has any meaning in itself. The point we are making is that K,z is indeed very high, meaning that the affinity of the HTS system for glucose in the presence of sodium is negligibly small at 25 "C.
24 mM).
I go h A 90
7 0 I
50
30
10
50 100 150 200 2 5 0 300
D-gtucose, mM
501( 30 10 a n
50 100 150 ZOO 250 300
D-glucos e, mM FIG. 3. Relative contribution of pure diffusion and of the
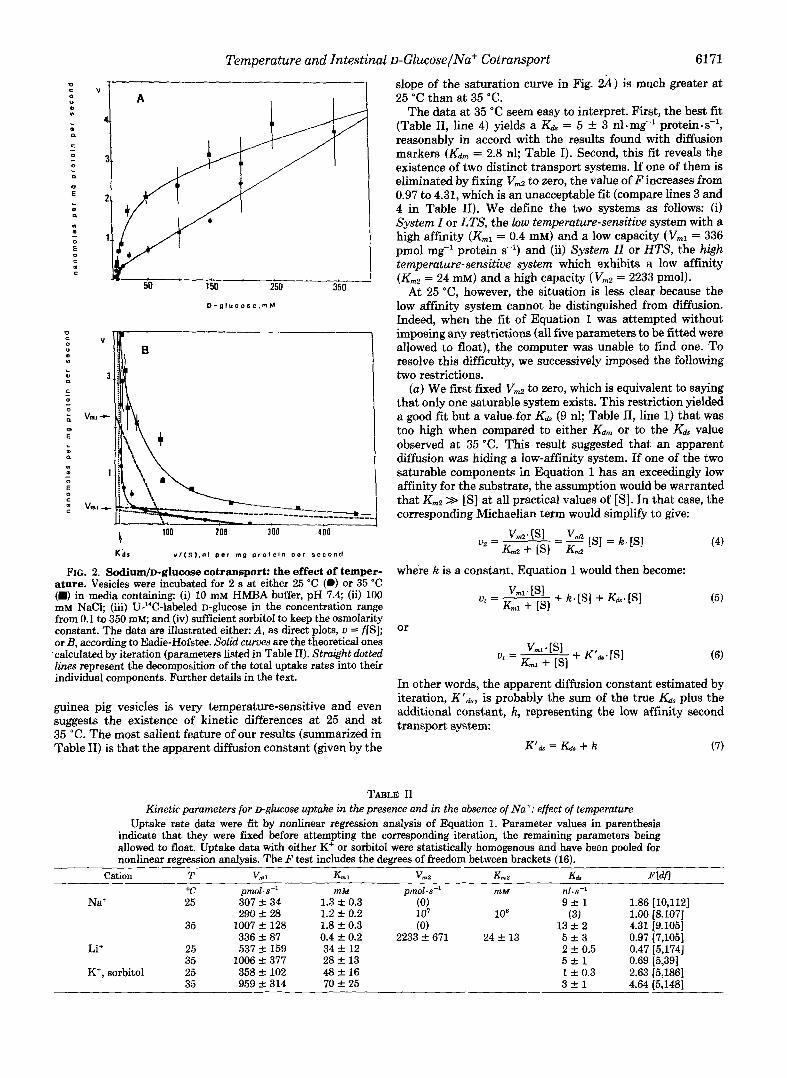
LTS and HTS systems to the total uptake of D-ghCOSe in the presence of sodium. The kinetic data in Table I1 have been applied to calculate the total uptake rate as a function of D-glUCOSe concen- tration at either 25 "C (A) or 35 "C ( B ) . The total uptake rate is defined as ut = a + b + c = 100% (see Equation l), where a is the LTS system, b is HTS, and c is pure diffusion.
concentration increases. On the contrary, the low affinity HTS and the pure diffusion components, which are negligible at very low concentrations, become significant at glucose concentrations as low as 1 mM, where they add up to about 7% at 25 "C and nearly 30% at 35 "C. At 25 "C, both the HTS and pure diffusion increase steadily in parallel: the sum of the two reaches 91% of the total at 300 mM D-glUCOSe. As shown in Fig. 3A, these two components exhibit similar shape be- cause HTS, as mentioned, behaves like diffusion. At 35 "C, however, HTS behaves very differently: it peaks rapidly at about 50 mM D-glucose then drops because of saturation.
There is a lack of evidence for a very high affinity D-glucose transport system in the presence of sodium. Some reports claim the existence of a very high affinity D-glucose transport system in brush border preparations from both kidney (34) and small intestine (35), with a Km in the PM range. We have not found evidence for the existence of such a system in guinea pig intestine. However, since our experiments were performed at D-glucose concentrations ranging from 0.1 to 350 mM, inappropriate for the detection of a very low Km system, we carried out additional D-glucose saturation curves with concentrations ranging from loT6 to M. These ex- periments yielded a K, = 0.4 f 0.1 mM, identical to that obtained when using higher glucose concentrations (Table 11).
In order to establish whether this result could be attributed to species differences, we performed similar experiments with rabbit jejunum. Again, no evidence for a high affinity trans- port system was found with this species (White New Zealand rabbits), the apparent K,,, being 0.5 +- 0.1 mM.
Temperature and Intestinal o-Glueose/Na+ Cotransport 6173
Kinetics of D-Glucose Uptake under Sodium-free Conditions Kinetics in the Presence of Lithium-We have shown pre-
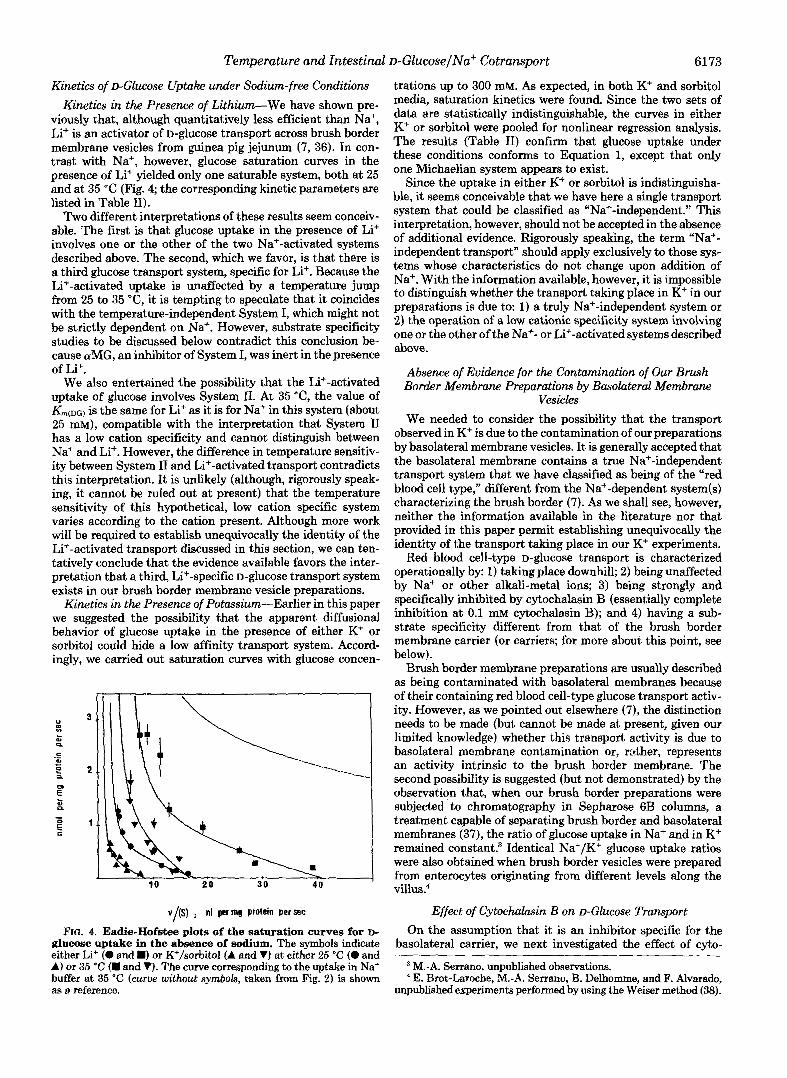
viously that, although quantitatively less efficient than Na+, Li+ is an activator of D-glucose transport across brush border membrane vesicles from guinea pig jejunum (7, 36). In con- trast with Na+, however, glucose saturation curves in the presence of Li+ yielded only one saturable system, both at 25 and at 35 "C (Fig. 4; the corresponding kinetic parameters are listed in Table 11).
Two different interpretations of these results seem conceiv- able. The first is that glucose uptake in the presence of Li+ involves one or the other of the two Na+-activated systems described above. The second, which we favor, is that there is a third glucose transport system, specific for LP. Because the Li+-activated uptake is unaffected by a temperature jump from 25 to 35 "C, it is tempting to speculate that it coincides with the temperature-independent System I, which might not be strictly dependent on Na+. However, substrate specificity studies to be discussed below contradict this conclusion be- cause aMG, an inhibitor of System I, was inert in the presence of Li+.
We also entertained the possibility that the Li+-activated uptake of glucose involves System 11. At 35 "C, the value of K, ,~G, is the same for Li+ as it is for Na+ in this system (about 25 mM), compatible with the interpretation that System I1 has a low cation specificity and cannot distinguish between Na+ and Li+. However, the difference in temperature sensitiv- ity between System I1 and Li+-activated transport contradicts this interpretation. It is unlikely (although, rigorously speak- ing, it cannot be ruled out at present) that the temperature sensitivity of this hypothetical, low cation specific system varies according to the cation present. Although more work will be required to establish unequivocally the identity of the Li+-activated transport discussed in this section, we can ten- tatively conclude that the evidence available favors the inter- pretation that a third, Li+-specific D-glucose transport system exists in our brush border membrane vesicle preparations.
Kinetics in the Presence of Potassium-Earlier in this paper we suggested the possibility that the apparent diffusional behavior of glucose uptake in the presence of either K+ or sorbitol could hide a low affinity transport system. Accord- ingly, we carried out saturation curves with glucose concen-
10 20 30 4 0 1
v/(s) ; nl per mg protein persec
FIG. 4. Eadie-Hofstee plots of the saturation curves for D- glucose uptake in the absence of sodium. The symbols indicate either Li+ (0 and m) or K+/sorbitol (A and V) at either 25 "C (0 and A) or 35 "C (W and VI. The curve corresponding to the uptake in Na+ buffer at 35 "C (cum without symbols, taken from Fig. 2) is shown as a reference.
trations up to 300 mM. As expected, in both K+ and sorbitol media, saturation kinetics were found. Since the two sets of data are statistically indistinguishable, the curves in either K+ or sorbitol were pooled for nonlinear regression analysis. The results (Table 11) confirm that glucose uptake under these conditions conforms to Equation 1, except that only one Michaelian system appears to exist.
Since the uptake in either K+ or sorbitol is indistinguisha- ble, it seems conceivable that we have here a single transport system that could be classified as "Na+-independent." This interpretation, however, should not be accepted in the absence of additional evidence. Rigorously speaking, the term "Na+- independent transport" should apply exclusively to those sys- tems whose characteristics do not change upon addition of Na+. With the information available, however, it is impossible to distinguish whether the transport taking place in K+ in our preparations is due to: 1) a truly Na+-independent system or 2 ) the operation of a low cationic specificity system involving one or the other of the Na+- or Li+-activated systems described above.
Absence of Evidence for the Contamination of Our Brush Border Membrane Preparations by Basolateral Membrane
Vesicles We needed to consider the possibility that the transport
observed in K' is due to the contamination of our preparations by basolateral membrane vesicles. It is generally accepted that the basolateral membrane contains a true Na+-independent transport system that we have classified as being of the "red blood cell type," different from the Na+-dependent system(s) characterizing the brush border (7). As we shall see, however, neither the information available in the literature nor that provided in this paper permit establishing unequivocally the identity of the transport taking place in our K+ experiments.
Red blood cell-type D-glucose transport is characterized operationally by: 1) taking place downhill; 2) being unaffected by Na+ or other alkali-metal ions; 3) being strongly and specifically inhibited by cytochalasin B (essentially complete inhibition at 0.1 mM cytochalasin B); and 4) having a sub- strate specificity different from that of the brush border membrane carrier (or carriers; for more about this point, see below).
Brush border membrane preparations are usually described as being contaminated with basolateral membranes because of their containing red blood cell-type glucose transport activ- ity. However, as we pointed out elsewhere (7), the distinction needs to be made (but cannot be made at present, given our limited knowledge) whether this transport activity is due to basolateral membrane contamination or, rdher, represents an activity intrinsic to the brush border membrane. The second possibility is suggested (but not demonstrated) by the observation that, when our brush border preparations were subjected to chromatography in Sepharose 6B columns, a treatment capable of separating brush border and basolateral membranes (37), the ratio of glucose uptake in Na+ and in K+ remained constant? Identical Na+/K+ glucose uptake ratios were also obtained when brush border vesicles were prepared from enterocytes originating from different levels along the villus?
Effect of Cytochalasin B on D-Glucose Transport On the assumption that it is an inhibitor specific for the
basolateral carrier, we next investigated the effect of cyto-
'E. Brot-Laroche, M.-A. Serrano, B. Delhomme, and F. Alvarado, unpublished experiments performed by using the Weiser method (38).
M.-A. Serrano, unpublished observations.
6174 Temperature and Intestinal D-Glucose/Na+ Cotransport
chalasin B on glucose uptake by our brush border vesicle preparations in the presence of alkali-metal ions. Taken as a whole, our results (Table 111) do not support the widely held belief that sensitivity to inhibition by cytochalasin B dem- onstrates that a transport system is of the red blood cell type. At least part of the transport taking place in the presence of either Na+ or Li+ is sensitive to cytochalasin B inhibition, indicating that the situation is more complicated than previ- ously thought.
If, for the sake of the argument, we accept that all of the glucose uptake observed in the presence of K+ represents a red cell-type system, we can subtract the corresponding amount (e.g., 136 pmol; experiment at 10 mM glucose, Table 111) to correct the total uptake data in the presence of either Na+ or Li+. In the Na+ experiments, the data at 10 mM glucose give a net uptake = 666 - 136 = 530 pmol-s-l, which in the presence of cytochalasin B drops to 279 pmol. Therefore, when Na+ is present, net D-glucose uptake can be decomposed into two components: 1) cytochalasin B-sensitiue (251 pmol, representing 47% of the total) and 2) cytochalasin B-insensi- tiue (279 pmol, 53%). But this straightforward interpretation of the experimental findings poses the problem of establishing the exact nature of the cytochalasin B-sensitive component. Its sensitivity to cytochalasin B inhibition would identify this system as belonging to the red blood cell type, according to current belief. However, this conclusion would conflict with the fact that the uptake is Na+-activated. It is generally agreed that the red blood cell-type basolateral membrane carrier is Na+-independent although, here too, reports are often contra- dictory, even when emanating from the same laboratory (30,
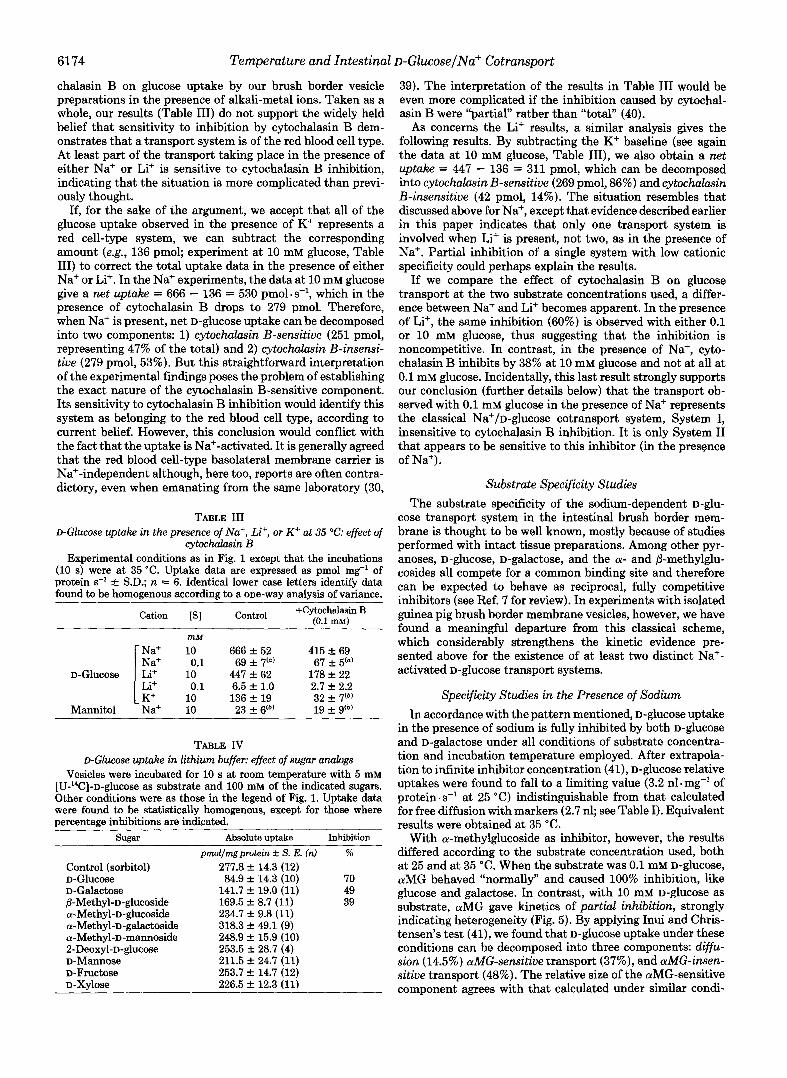
TABLE I11 D-Glucose uptake in the presence of Na+, Li+, or K+ at 35 "C: effect of
cytochalasin B Experimental conditions as in Fig. 1 except that the incubations
(10 s) were at 35 "C. Uptake data are expressed as pmol mg" of protein s-l & S.D.; n = 6. Identical lower case letters identify data found to be homogenous according to a one-way analysis of variance.
Cation [SI
mM
control +Cytochalasin B (0.1 mM)
Na+ 10 666 f 52 415 -C 69 Na+ 0.1 69 f 7'") 67 f 5'")
D-Glucose Li' 10 [ Li+ 447 f 62 178 f 22
K+ 10 0.1 6.5 f 1.0
136 f 19 2.7 -C 2.2
Mannitol Na+ 10 32 f 7'b)
23 f 6(b) 19 f 9(b)
TABLE IV D-Glucose uptake in lithium buffer: effect of sugar analogs
Vesicles were incubated for 10 s at room temperature with 5 mM [U-14C]-~-glucose as substrate and 100 mM of the indicated sugars. Other conditions were as those in the legend of Fig. 1. Uptake data were found to be statistically homogenous, except for those where percentage inhibitions are indicated.
Sugar Absolute uptake Inhibition pmollmgprotein * S . E. fn) %
Control (sorbitol) 277.8 f 14.3 (12) D-Glucose 84.9 f 14.3 (10) 70 D-Galactose 141.7 f 19.0 (11) 49 0-Methyl-D-glucoside 169.5 f 8.7 (11) 39 a-Methyl-D-glucoside 234.7 f 9.8 (11) a-Methyl-D-galactoside 318.3 f 49.1 (9) a-Methyl-D-mannoside 248.9 f 15.9 (10) 2-Deoxyl-~-glucose 253.5 f 28.7 (4) D-Mannose 211.5 +. 24.7 (11) D-Fructose 253.7 & 14.7 (12) D-Xylose 226.5 +- 12.3 (11)
39). The interpretation of the results in Table I11 would be even more complicated if the inhibition caused by cytochal- asin B were "partial" rather than "total" (40).
AS concerns the Li' results, a similar analysis gives the following results. By subtracting the K+ baseline (see again the data at 10 mM glucose, Table 111), we also obtain a net uptake = 447 - 136 = 311 pmol, which can be decomposed into cytochalasin B-sensitive (269 pmol, 86%) and cytochalasin B-insensitive (42 pmol, 14%). The situation resembles that discussed above for Na+, except that evidence described earlier in this paper indicates that only one transport system is involved when Li+ is present, not two, as in the presence of Na+. Partial inhibition of a single system with low cationic specificity could perhaps explain the results.
If we compare the effect of cytochalasin B on glucose transport at the two substrate concentrations used, a differ- ence between Na+ and Li+ becomes apparent. In the presence of Li+, the same inhibition (60%) is observed with either 0.1 or 10 mM glucose, thus suggesting that the inhibition is noncompetitive. In contrast, in the presence of Na+, cyto- chalasin B inhibits by 38% at 10 mM glucose and not at all at 0.1 mM glucose. Incidentally, this last result strongly supports our conclusion (further details below) that the transport ob- served with 0.1 mM glucose in the presence of Na+ represents the classical Na+/D-glucose cotransport system, System I, insensitive to cytochalasin B inhibition. It is only System I1 that appears to be sensitive to this inhibitor (in the presence of Na+) .
Substrate Specificity Studies The substrate specificity of the sodium-dependent D-gh-
cose transport system in the intestinal brush border mem- brane is thought to be well known, mostly because of studies performed with intact tissue preparations. Among other pyr- anoses, D-glucose, D-galaCtOSe, and the a- and /3-methylglu- cosides all compete for a common binding site and therefore can be expected to behave as reciprocal, fully competitive inhibitors (see Ref. 7 for review). In experiments with isolated guinea pig brush border membrane vesicles, however, we have found a meaningful departure from this classical scheme, which considerably strengthens the kinetic evidence pre- sented above for the existence of at least two distinct Na+- activated D-glucose transport systems.
Specificity Studies in the Presence of Sodium In accordance with the pattern mentioned, D-glucose uptake
in the presence of sodium is fully inhibited by both D-glucose and D-galactose under all conditions of substrate concentra- tion and incubation temperature employed. After extrapola- tion to infinite inhibitor concentration (41), D-glucose relative uptakes were found to fall to a limiting value (3.2 nl. mg-l of protein. s-l at 25 "C) indistinguishable from that calculated for free diffusion with markers (2.7 nl; see Table I). Equivalent results were obtained at 35 "C.
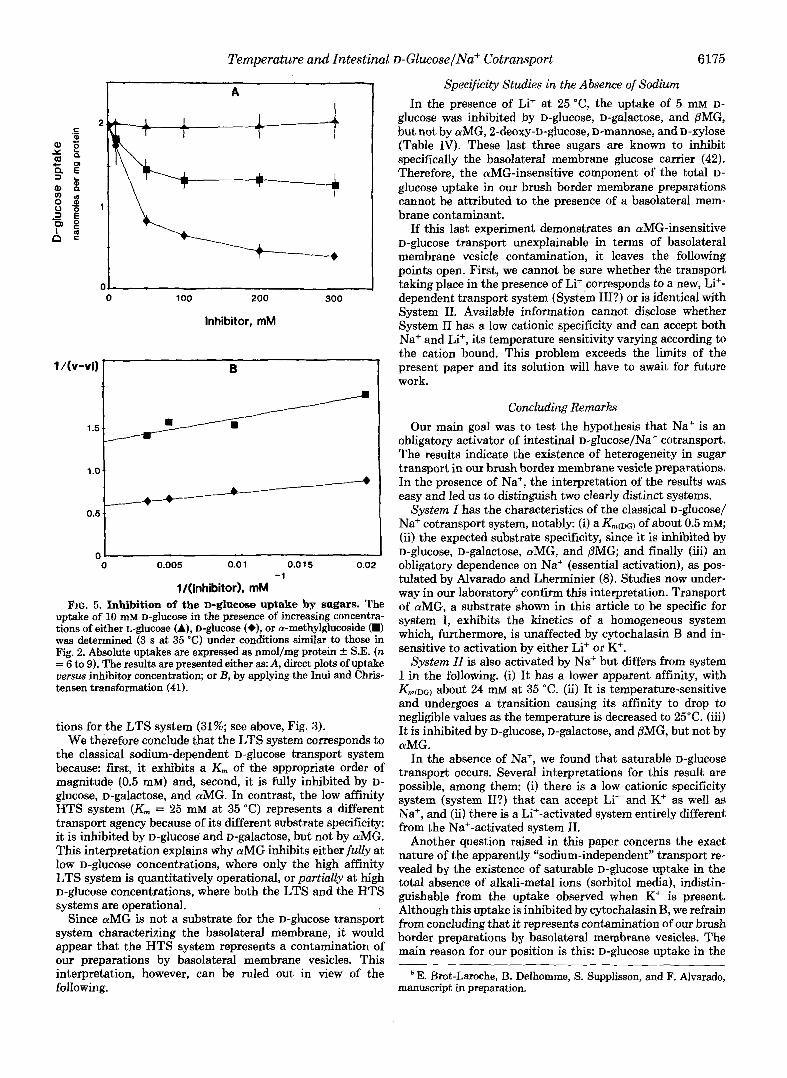
With a-methylglucoside as inhibitor, however, the results differed according to the substrate concentration used, both at 25 and at 35 "C. When the substrate was 0.1 mM D-glucose, aMG behaved "normally" and caused 100% inhibition, like glucose and galactose. In contrast, with 10 mM D-glucose as substrate, aMG gave kinetics of partial inhibition, strongly indicating heterogeneity (Fig. 5). By applying Inui and Chris- tensen's test (41), we found that D-glucose uptake under these conditions can be decomposed into three components: diffu- sion (14.5%) aMG-sensitive transport (37%), and d G - i n s e n - sitiue transport (48%). The relative size of the aMG-sensitive component agrees with that calculated under similar condi-
Temperature and Intestinal D-Glucose/Na+ Cotransport 6175
A
-~ -~ 0 100 200 300
.~
Inhibitor, mM
1Av-vi) 1 B I
1 0 0.005 0.0 1 0.0 15 0.02
l/(inhibitor), mM FIG. 5. Inhibition of the D-glucose uptake by sugars. The
uptake of 10 mM D-ghlCOSe in the presence of increasing concentra- tions of either L-glucose (A), D-glucose (+), or a-methylglucoside (m) was determined (3 s at 35 "C) under conditions similar to those in Fig. 2. Absolute uptakes are expressed as nmol/mg protein & S.E. (n = 6 to 9). The results are presented either as: A, direct plots of uptake uesus inhibitor concentration; or B, by applying the Inui and Chris- tensen transformation (41).
-1
tions for the LTS system (31%; see above, Fig. 3). We therefore conclude that the LTS system corresponds to
the classical sodium-dependent D-glucose transport system because: first, it exhibits a K, of the appropriate order of magnitude (0.5 mM) and, second, it is fully inhibited by D- glucose, D-galaCtOSe, and aMG. In contrast, the low affinity HTS system (Km = 25 mM at 35 "C) represents a different transport agency because of its different substrate specificity: it is inhibited by D-glucose and D-galaCtOSe, but not by aMG. This interpretation explains why aMG inhibits either fully at low D-glucose concentrations, where only the high affinity LTS system is quantitatively operational, or partially at high D-glucose concentrations, where both the LTS and the HTS systems are operational.
Since aMG is not a substrate for the D-glucose transport system characterizing the basolateral membrane, it would appear that the HTS system represents a contamination of our preparations by basolateral membrane vesicles. This interpretation, however, can be ruled out in view of the following.
Specificity Studies in the Absence of Sodium In the presence of Li+ at 25 "C, the uptake of 5 mM D-
glucose was inhibited by D-glucose, D-galactose, and PMG, but not by aMG, 2-deoxy-D-glucose7 D-mannose, and D-xylose (Table IV). These last three sugars are known to inhibit specifically the basolateral membrane glucose carrier (42). Therefore, the aMG-insensitive component of the total D- glucose uptake in our brush border membrane preparations cannot be attributed to the presence of a basolateral mem- brane contaminant.
If this last experiment demonstrates an aMG-insensitive D-glucose transport unexplainable in terms of basolateral membrane vesicle contamination, it leaves the following points open. First, we cannot be sure whether the transport taking place in the presence of Li+ corresponds to a new, Li+- dependent transport system (System III?) or is identical with System 11. Available information cannot disclose whether System I1 has a low cationic specificity and can accept both Na+ and Li+, its temperature sensitivity varying according to the cation bound. This problem exceeds the limits of the present paper and its solution will have to await for future work.
Concluding Remarks Our main goal was to test the hypothesis that Na+ is an
obligatory activator of intestinal D-ghcose/Na* cotransport. The results indicate the existence of heterogeneity in sugar transport in our brush border membrane vesicle preparations. In the presence of Na+, the interpretation of the results was easy and led us to distinguish two clearly distinct systems.
System 2 has the characteristics of the classical D-glucose/ Na+ cotransport system, notably: (i) a K m ( D ~ ) of about 0.5 mM; (ii) the expected substrate specificity, since it is inhibited by D-glUCOSe, D-galactose, aMG, and PMG; and finally (iii) an obligatory dependence on Na+ (essential activation), as pos- tulated by Alvarado and Lherminier (8). Studies now under- way in our laboratory5 confirm this interpretation. Transport of aMG, a substrate shown in this article to be specific for system I, exhibits the kinetics of a homogeneous system which, furthermore, is unaffected by cytochalasin B and in- sensitive to activation by either Li+ or K+.
System ZI is also activated by Na+ but differs from system I in the following. (i) It has a lower apparent affinity, with K,,D~) about 24 mM at 35 "c. (ii) It is temperature-sensitive and undergoes a transition causing its affinity to drop to negligible values as the temperature is decreased to 25°C. (iii) It is inhibited by D-glucose, D-galactose, and PMG, but not by aMG.
In the absence of Na+, we found that saturable D-glucose transport occurs. Several interpretations for this result are possible, among them: (i) there is a low cationic specificity system (system II?) that can accept Li' and K+ as well as Na+, and (ii) there is a Li+-activated system entirely different from the Na+-activated system 11.
Another question raised in this paper concerns the exact nature of the apparently "sodium-independent" transport re- vealed by the existence of saturable D-glUCOSe uptake in the total absence of alkali-metal ions (sorbitol media), indistin- guishable from the uptake observed when K+ is present. Although this uptake is inhibited by cytochalasin B, we refrain from concluding that it represents contamination of our brush border preparations by basolateral membrane vesicles. The main reason for our position is this: D-glucose uptake in the
E. Brot-Laroche, B. Delhomme, S. Supplisson, and F. Alvarado, manuscript in preparation.

6176 Temperature and Intestinal D-Glucose/Na+ Cotransport
presence of Li+ is entirely unaffected by inhibitors of the basolateral membrane carrier, such as X-deoxy-~-glucose, D- mannose, and D-xylose. Any basolateral contamination in our preparations would be readily apparent in the presence of Li', meaning that at least a fraction of the total uptake in Li+ would have been affected by the sugars listed above.
Clearly, more work is required to establish the nature of the transport system(s) involved in our experiments under Na+-free conditions.
Acknowledgments-We would like to acknowledge the invaluable help of Stkphane Supplisson with the computer graphics and the assistance of Barbara Alvarado in checking the manuscript.
REFERENCES
1. Brot-Laroche, E., Serrano, M.-A., Delhomme, B., and Alvarado,
2. Crane, R. K. (1966) in Intracellular Transport (Warren, K. B.,
3. Schultz, S. G., and Curran, P. F. (1970) Physiol. Rev. 5 0 , 637-
4. Alvarado, F. (1976) in Intestinal Ion Transport (Robinson, J. W.
5. Crane, R. K. (1977) Reu. Physiol. Biochem. Pharmacol. 78 ,99-
6. Kimmich, G. A. (1981) Fed. Proc. 40,2474-2479 7. Brot-Laroche, E., and Alvarado, F. (1983) in Intestinal Transport
(Gilles-Baillien, M., and Gilles, R., eds) pp. 147-169, Springer- Verlag, Berlin, Heidelberg, New York
8. Alvarado, F., and Lherminier, M. (1982) J. Physiol. (Paris) 78,
9. Lucas, M. L., and Cannon, M. J. (1983) Biochem. Biophys. Acta
10. Austin, P. W., Hardy, F. E., Buchanan, J. G., and Baddiley, J. (1963) J. Chem. SOC. ( L o n d . ) 1021,5350-5353
11. Stahl, E. (1969) in Thin Layer Chromatography. A Laboratory Handbook, 2nd Ed., Springer-Verlag, Berlin, Heidelberg, New York
12. Hauser, H., Howell, K., Dawson, R. M. C., and Bowyer, D. E. (1980) Biochem. Biophys. Acta 602,567-577
13. Brot-Laroche, E., and Alvarado, F. (1984) Biochem. Biophys. Acta
14. Hopfer, U., Nelson, K., Perrotto, J., and Isselbacher, K. J. (1973)
15. Kessler, M., Tannenbaum, V., and Tannenbaum, C. (1978)
16. van Melle, G., and Robinson, J. W. L. (1981) J. Physiol. (Paris)
F. (1984) Ann. N. Y. Acad. Sci. 456,47-50
ed) pp. 71-102, Academic Press, New York
718
L., ed) pp. 117-152, MTP Press, Lancaster, England
159
131-145
730941-48
775,175-181
J, Biol. Chem. 248,25-32
Biochem. Biophys. Acta 509,348-359
77.1011-1016
17. Robinson, J. W. L., and van Melle, G. (1983) J. Phvsiol. (Lord.) 334,177-187 .
18. Snedecor. G. W.. and Cochran. W. G. (1967) Statistical Methods. 6th Ed.; Iowa State University Press, Ames, IA
19. Dixon, W. J., and Massey, F. J., Jr. (1969) Introduction to Statistical Analysis, Chapter 10, McGraw-Hill, New York
20. Alvarado, F. (1966) Biochem. Biophys. Acta 112,292-306 21. Alvarado, F., Lherminier, M., and Phan, H.-H. (1984) J. Physiol.
22. Turner, R. J., and Silverman, M. (1977) Proc. Natl. Acad. Sci. U.
23. Turner, R. J., and Silverman, M. (1978) Biochem. Biophys. Acta
24. Fairclough, P., Malathi, P., Preiser, H., and Crane, R. K. (1979) Biochem. Biophys. Acta 553,295-306
25. Kaunitz, J., Gunther, R., and Wright, E. M. (1982) Proc. Natl. Acad. Sci. U. S. A. 79,2315-2318
26. Turner, R. J., and Moran, A. (1982) Am. J. Physiol. 2 4 2 , 406- 414
27. Lelievre-Pegorier, M., Jean, T., Ripoche, P., and Poujeol, P. (1983) Am. J. Physiol. 245,367-373
28. Orita, Y., Fukuhara, Y., Yanase, M., Okoda, N., Nahanishi, T., Horio, M., Moriyama, T., Ando, A., and Abe, H. (1984) Biochem. Biophys. Acta 771,195-200
29. Fukuhara, Y., and Turner, R. J. (1984) Biochem. Biophys. Acta
30. Kinne, R., Murer, H., Kinne-Saffran, E., Thees, M., and Sachs,
31. De Smedt, H., and Kinne, R. (1981) Biochem. Biophys. Acta 648,
32. Brasitus, T. A., Schachter, D., and Mamouneas, T. G. (1979)
33. Brasitus, T. A., Yeh, K.-Y., Holt, P. R., and Schachter, D. (1984)
34. Chesney, R. W., Sacktor, B., andRowen, R. (1973) J. Biol. Chem.
35. Dorando, F. C., and Crane, R. K. (1984) Biochem. Biophys. Acta
36. Alvarado, F., and Brot-Laroche, E. (1984) J. Physiol. (Lond.)
37. Carlsen, J., Christiansen, K., and Bro, B. (1983) Biochem. Bio-
38. Weiser, M. M. (1973) J. Biol. Chem. 248,2536-2541 39. Murer, H., Hopfer, U., and Kinne, R. (1976) in Current Views in
Gastroenterology (Van&, V., and Balint, G. A., eds) Vol II., pp. 77-91, Hungarian Society of Gastroenterology, Budapest
40. Alvarado, F. (1978) J. Physiol. (Paris) 74,633-639 41. Inui, Y., and Christensen, H. N. (1966) J. Gen. Physiol. 50,203-
42. Wright, E. M., van Os, C. H. and Micheff, A. K. (1980) Biochem.
. I
(Lond.) 355,493-527
S. A. 74,2825-2829
5 1 1,470-486
770,73-78
G., (1975) J. Membr. Biol. 21,375-395
247-253
Biochemistry 18,41364144
Biochem. Biophys. Acta 778,341-348
248,2182-2191
772,273-287
3 4 8 , 4 5
phys. Acta 727,412-415
224
Biophys. Acta 597,112-124