the iodine content of norwegian foods and diets
TRANSCRIPT
The iodine content of Norwegian foods and diets
Lisbeth Dahl1,*, Lars Johansson2, Kare Julshamn1 and Helle Margrete Meltzer31National Institute of Nutrition and Seafood Research (NIFES), PO Box 176 Sentrum, N-5804 Bergen, Norway:2Directorate for Health and Social Affairs, Oslo, Norway: 3Division of Environmental Medicine, Norwegian Instituteof Public Health, Oslo, Norway
Submitted 6 May 2003: Accepted 8 October 2003
Abstract
Objectives: To examine dietary iodine sources and to estimate the dietary iodineintake of the Norwegian population.Design: Food iodine analyses carried out in Norway during the last 10 years werecompiled, and iodine intake calculated on the basis of food intake data from nation-wide dietary surveys among children and adults. The food intake of adults wasmeasured by a self-administrated food-frequency questionnaire, which coveredhabitual diet during the past year. The food intake of children was measured bydietary record during four consecutive days.Setting: Neither household nor industrial iodisation of salt is mandatory in Norway,but some brands of table salt have 5mg of iodine added per gram of NaCl. In spite ofthis, the population has been considered iodine-replete for decades, i.e. having aniodine intake well above the Recommended Dietary Allowance of 150mg day21. Thisassumption has not been substantiated by dietary surveys.Subjects: The adults included 1374 females and 1298 males aged 16–79 years. Thechildren included 185 girls and 206 boys aged 4 years, 411 girls and 404 boys aged9 years, and 517 girls and 492 boys aged 13 years.Results: The calculated iodine intake was in the range of 100–250mg day21 in themajority of the adult population. The mean iodine intake was 136mg day21
(170mg I/10 MJ) among women and 176mg day21 (161mg I/10 MJ) among men. Forchildren the iodine intake was in the range of 100–120mg day21. Milk and dairyproducts contributed approximately 55% and 70% of the dietary iodine intake inadults and children, respectively. Fish contributed more than 20% of the iodineintake in adults and about 10% in children. The iodine contribution of drinkingwater was negligible.Conclusions: While fish has the highest natural concentration of iodine and as such isan excellent iodine source, milk and diary products are the main determinants ofiodine intake in the Norwegian population. Iodisation of cow fodder has beenmandatory in Norway since 1950 and provides an efficient alternative to universal saltiodisation. Our results show that the dietary iodine intake of adults is in the rangeconsidered to be sufficient. The dietary intake of iodine was at recommended levelsamong the youngest children; however, it decreased among adolescents, especiallyamong girls.
KeywordsIodine
DietIodine intake
Food stuffsNorway
Iodine is an essential trace element required for normal
activity of the thyroid hormones thyroxine and triiodothyr-
onine. Clinical and sub-clinical manifestations of iodine
deficiency, termed iodine deficiency disorders (IDD),
affect all stages of human life and are characterised by a
variety of conditions1,2. The disorders induced by iodine
deficiency constitute a major nutritional problem world-
wide and about 2.2 billion people in 130 countries are at
risk of iodine deficiency3. To eliminate IDD the most
common and widely used intervention is iodine fortifica-
tion, using salt as the vehicle4.
The public health implications of iodine intake in
Norway have moved from the historical problem of
endemic goitre described in some parts of the country
during the 1930s and 1940s to concerns about excessive
iodine intake5,6. However, there has never been systematic
monitoring of the iodine concentration of Norwegian
foodstuffs or the iodine intake from a typical Norwegian
diet. Studies performed in 1971–72 and 1985 in selected
groups of Norwegians showed satisfactory iodine
excretion in urine6. The contribution of iodised salt
(5mg I/g NaCl) is considered to be insignificant6 because
q The Authors 2003*Corresponding author: Email [email protected]
Public Health Nutrition: 7(4), 569–576 DOI: 10.1079/PHN2003554
only some brands of table salt are iodised and not
industrial salt7. Cow fodder is controlled by legislation in
Norway and since 1950 has had iodine (as KI) added at the
rate of 2 mg I/kg NaCl to protect the health of the animals8.
This addition of iodine also results in higher iodine content
in milk and dairy products. The maximum limit for iodine
in fodder is set at 10 mg I/kg in Norway8 and the European
Union (EU). The best natural source of iodine is marine
fish and other marine products9.
In Norway, the recommended daily intake of iodine is
90mg for children aged 4–6 years, 120mg for children
aged 7–10 years and 150mg for children older than 10
years and adults10. These recommendations are in line
with those set by the World Health Organization (WHO)4.
The lowest recommended daily intake of iodine is set at
70mg and the upper limit of intake is set at 1 mg for adults
in the Nordic countries11 and in the Recommended Dietary
Allowances12. The Scientific Committee on Food (SCF) of
the EU has recently set the maximum intake of iodine to
600mg per day13.
To assess the dietary intake of iodine in a population
and in subgroups of the population, reliable and accurate
data of iodine concentrations of individual food items are
needed. The aim of the present study was to estimate the
iodine intake in the Norwegian population by using new
data on the iodine concentration of foodstuffs and
drinking water, and food intake data from representative
samples of Norwegians. This allowed us to evaluate iodine
intake in Norway in relation to recommended and upper
levels of intake.
Materials and methods
Samples and sampling
Analyses of iodine in 1010 samples representing 102
different Norwegian foodstuffs during the last 10 years
have been included in the present study. The majority of
the analyses of iodine in fish fillets (n ¼ 538) and milk and
dairy products (n ¼ 85) were reported by Julshamn et al.9
and Dahl et al.14, respectively. Seventy-four iodine
analyses of foodstuffs were listed in the Norwegian food
composition table15 and the remaining 313 analyses of
iodine have not been published earlier (Table 1).
The samples of foodstuffs included in the present study,
with the exception of fish fillets9 and milk and dairy
products14, were taken according to available production
and marketing statistics for foodstuffs from various
geographical areas, manufacturers, etc. Each composite
sample included several sub-samples from various areas
or manufacturers. When a particular manufacturer
dominated the market, the composite sample from this
manufacturer consisted of sub-samples from various
production dates.
Twelve different meat and meat products were analysed
for iodine, i.e. lamb, pork, beef, sausages, hamburgers,
minced meat, grilled chicken and five different meat
sandwich fillets. The iodine content of bread (n ¼ 17), rice
(n ¼ 2), pasta (n ¼ 2), beans (n ¼ 1), peas (n ¼ 1),
biscuits (n ¼ 5) and cereals products (n ¼ 4) constitute
the group of bread and cereals. Twenty different vegetables
and eight different fruits and berries were included.
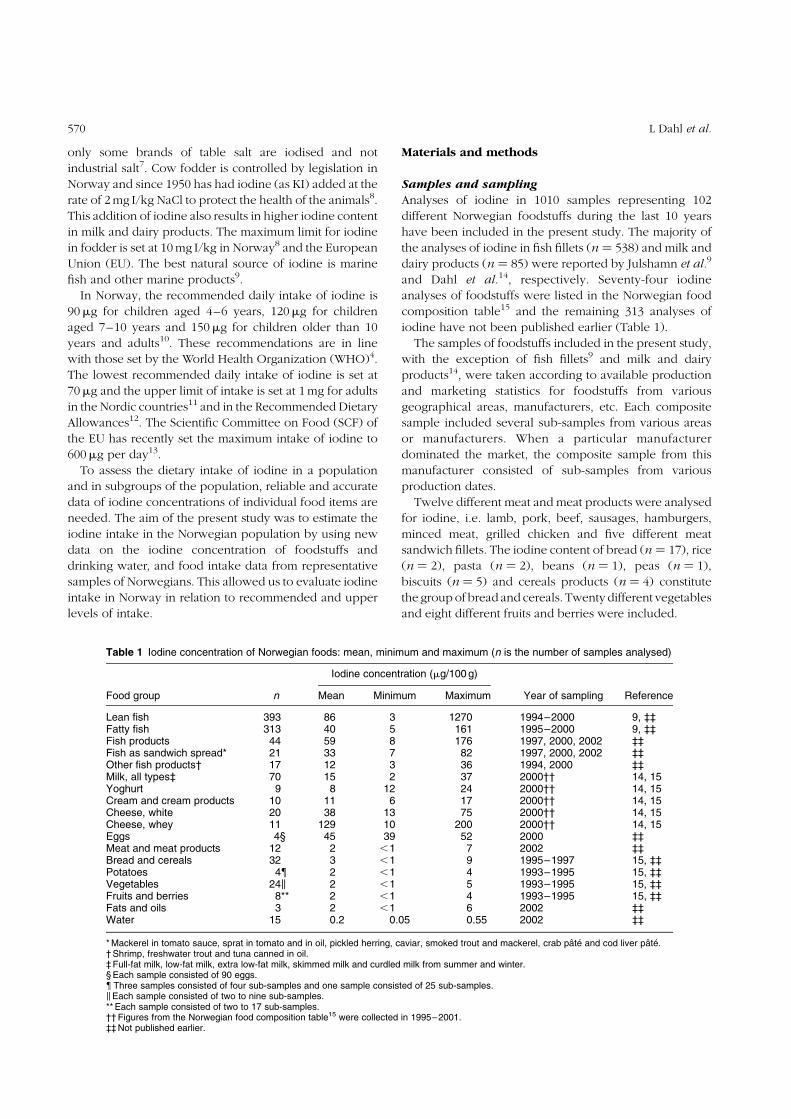
Table 1 Iodine concentration of Norwegian foods: mean, minimum and maximum (n is the number of samples analysed)
Iodine concentration (mg/100 g)
Food group n Mean Minimum Maximum Year of sampling Reference
Lean fish 393 86 3 1270 1994–2000 9, ‡‡Fatty fish 313 40 5 161 1995–2000 9, ‡‡Fish products 44 59 8 176 1997, 2000, 2002 ‡‡Fish as sandwich spread* 21 33 7 82 1997, 2000, 2002 ‡‡Other fish products† 17 12 3 36 1994, 2000 ‡‡Milk, all types‡ 70 15 2 37 2000†† 14, 15Yoghurt 9 8 12 24 2000†† 14, 15Cream and cream products 10 11 6 17 2000†† 14, 15Cheese, white 20 38 13 75 2000†† 14, 15Cheese, whey 11 129 10 200 2000†† 14, 15Eggs 4§ 45 39 52 2000 ‡‡Meat and meat products 12 2 ,1 7 2002 ‡‡Bread and cereals 32 3 ,1 9 1995–1997 15, ‡‡Potatoes 4{ 2 ,1 4 1993–1995 15, ‡‡Vegetables 24k 2 ,1 5 1993–1995 15, ‡‡Fruits and berries 8** 2 ,1 4 1993–1995 15, ‡‡Fats and oils 3 2 ,1 6 2002 ‡‡Water 15 0.2 0.05 0.55 2002 ‡‡
* Mackerel in tomato sauce, sprat in tomato and in oil, pickled herring, caviar, smoked trout and mackerel, crab pate and cod liver pate.† Shrimp, freshwater trout and tuna canned in oil.‡ Full-fat milk, low-fat milk, extra low-fat milk, skimmed milk and curdled milk from summer and winter.§ Each sample consisted of 90 eggs.{Three samples consisted of four sub-samples and one sample consisted of 25 sub-samples.kEach sample consisted of two to nine sub-samples.** Each sample consisted of two to 17 sub-samples.†† Figures from the Norwegian food composition table15 were collected in 1995–2001.‡‡ Not published earlier.
L Dahl et al.570
Drinking water (tap water) samples were collected from
15 different locations in Norway by the Norwegian Food
Control Authority. The water samples were collected in
August 2002 in Vadsø, Kautokeino, Alta, Tromsø, Bodø,
Mosjøen, Trondheim, Alesund, Hamar, Gol, Rjukan, Oslo,
Kristiansand, Stavanger and Bergen. The water samples
were collected in clean glass containers, after allowing the
water to run for 5 to 10 s. Samples were sent to our
laboratory and stored at 48C until analysis.
Chemical analysis and analytical quality control
The iodine concentrations in the foodstuffs and drinking
water were determined by inductively coupled plasma–
mass spectrometry9,16. The 35 samples of milk and dairy
products reported in the Norwegian food composition
table15 were analysed for their iodine content by neutron
activation analysis. The limit of detection (LOD),
calculated according to the three-sigma criterion, was
estimated from the variance of the analytical blank values
(n ¼ 20). The LOD was estimated to be 0.06 ng ml21. The
limit of quantification (LOQ), calculated according to the
three-sigma criterion, was estimated to 15 ng g21 (dry
mass) when 0.2 g of sample was used for analysis, and
with a dilution factor of 50. This corresponds to a LOQ of
approximately 2–4mg kg21 (wet weight).
Study population
Food intake among adults was derived from a representa-
tive nation-wide dietary survey of 1374 women and 1298
men aged 16–79 years in March, June, September and
November 1997 (Norkost 1997)17.
Food intake of children was derived from representa-
tive nation-wide dietary surveys of children aged 4, 9 and
13 years conducted during 2000–01 (Ungkost-2000)18,19.
The 4-year-old children participated in a survey
performed from August to December 200118. Data from
206 boys and 185 girls are included in the present study.
Dietary surveys among nation-wide and representative
samples of 4th graders (9 years) and 8th graders
(13 years) were conducted in August to December
200019. Data from 404 boys and 411 girls aged 9 years and
492 boys and 517 girls aged 13 years are included in the
present study.
Food intake
Food intake among adults was measured by a self-
administrated food-frequency questionnaire (FFQ). The
frequency of intake was reported per day, week or month
depending on which kind of food was asked about. The
portions were reported as pieces, glasses, cups, decilitres
or spoons. The FFQ was supposed to cover the habitual
diet during the past year and included questions about
how often and how much was eaten of approximately 180
foods and dishes. The FFQ has been validated20–23.
Further details and results from the Norkost 1997 survey
have been published elsewhere17.
The food intake of children was reported for four
consecutive days in a pre-coded diary with lists of the most
common foodstuffs and beverages in Norway. In addition,
open lines to register the intakes of food items and
beverages not mentioned in the list were included in the
diary. The portion size was given as units, e.g. beverages
was given as number of glasses. A book with pictures of
different sizes of glass, thickness of slices of bread and
portion sizes of different meals was enclosed with the
diary. Further details and results of the Ungkost-2000
survey have been published elsewhere18,19.
Iodine intake
Iodine intake was calculated on the basis of the food
intake of each adult participant. The mean food intake and
the iodine intake are reported, as well as percentiles for
iodine intake among adults. For children the iodine intake
was calculated on the basis of the mean food intake for
boys and girls separately in each age group. The mean
iodine concentration of the food groups given in Table 1
was used in the calculations. The iodine content of water
(1.7mg l21) was used to calculate the iodine contribution
from all beverages based on the findings by Rasmussen
et al.24 and Pedersen et al.25.
Results
Iodine concentrations of Norwegian foods
The average and range of iodine concentration found in
each food group are listed in Table 1. In general, the
highest average iodine concentrations were found in the
food groups fish, milk and eggs. The average iodine
content of lean fish was generally more than twice that of
fatty fish. Several processed fish products were also rich in
iodine. The average iodine concentration in all types of
milk produced in the summer was 83mg l21 and 212mg l21
in milk produced in the winter. No differences were found
between average iodine content within the same season
for the different types of milk analysed, e.g. skimmed milk
versus full-fat milk. The average iodine concentration of all
milk during the year was used in the present study. The
iodine concentration in the different types of cheese did
not vary with the fat content. The concentration range of
iodine in white cheese and whey cheese indicated the
influence of the seasonal variation in the milk used.
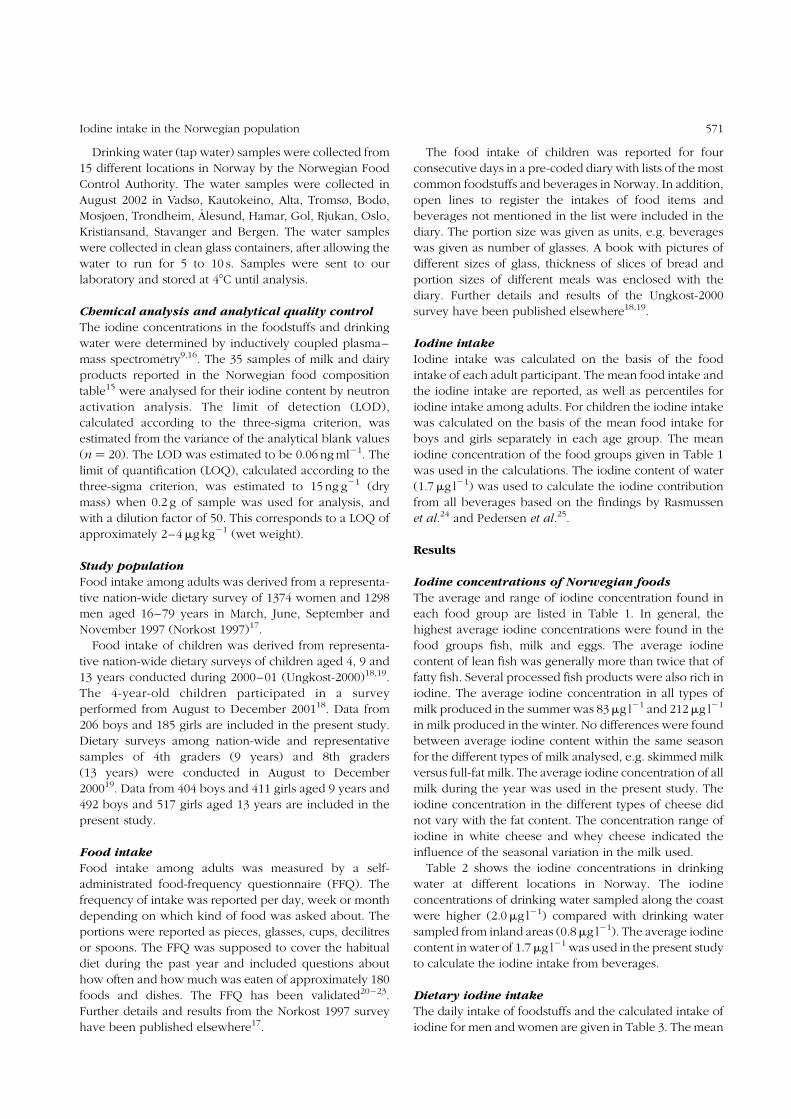
Table 2 shows the iodine concentrations in drinking
water at different locations in Norway. The iodine
concentrations of drinking water sampled along the coast
were higher (2.0mg l21) compared with drinking water
sampled from inland areas (0.8mg l21). The average iodine
content in water of 1.7mg l21 was used in the present study
to calculate the iodine intake from beverages.
Dietary iodine intake
The daily intake of foodstuffs and the calculated intake of
iodine for men and women are given in Table 3. The mean
Iodine intake in the Norwegian population 571
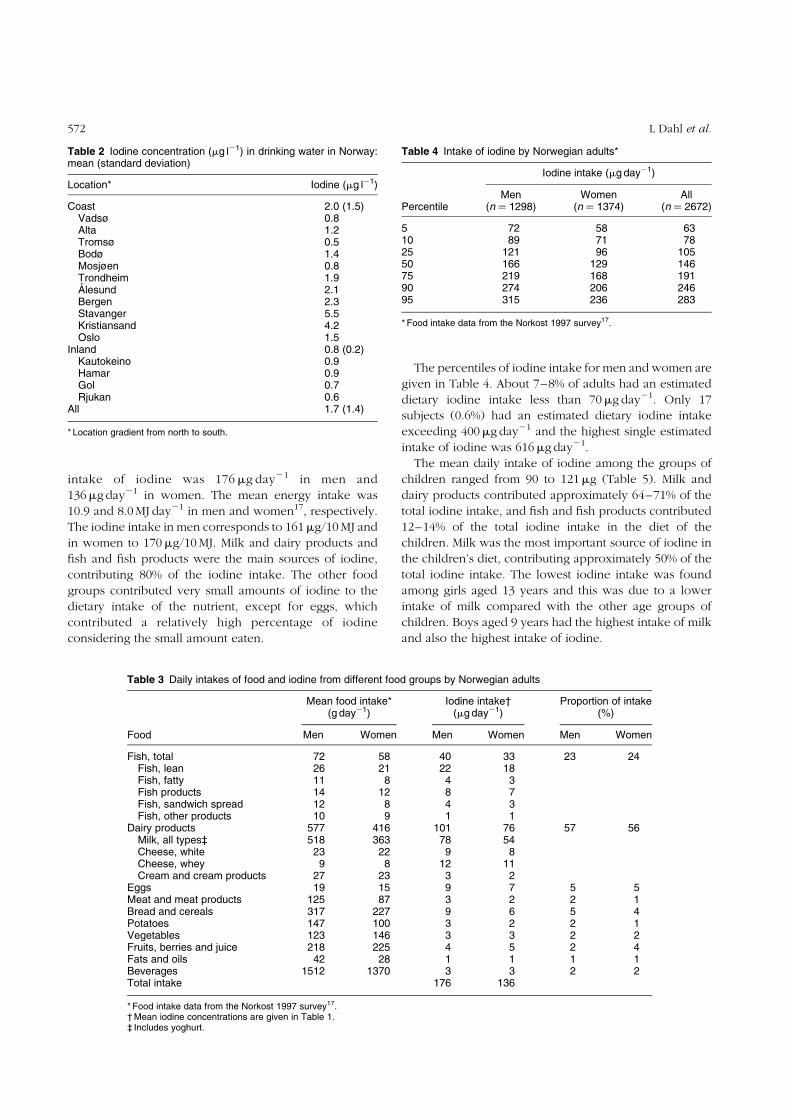
intake of iodine was 176mg day21 in men and
136mg day21 in women. The mean energy intake was
10.9 and 8.0 MJ day21 in men and women17, respectively.
The iodine intake in men corresponds to 161mg/10 MJ and
in women to 170mg/10 MJ. Milk and dairy products and
fish and fish products were the main sources of iodine,
contributing 80% of the iodine intake. The other food
groups contributed very small amounts of iodine to the
dietary intake of the nutrient, except for eggs, which
contributed a relatively high percentage of iodine
considering the small amount eaten.
The percentiles of iodine intake for men and women are
given in Table 4. About 7–8% of adults had an estimated
dietary iodine intake less than 70mg day21. Only 17
subjects (0.6%) had an estimated dietary iodine intake
exceeding 400mg day21 and the highest single estimated
intake of iodine was 616mg day21.
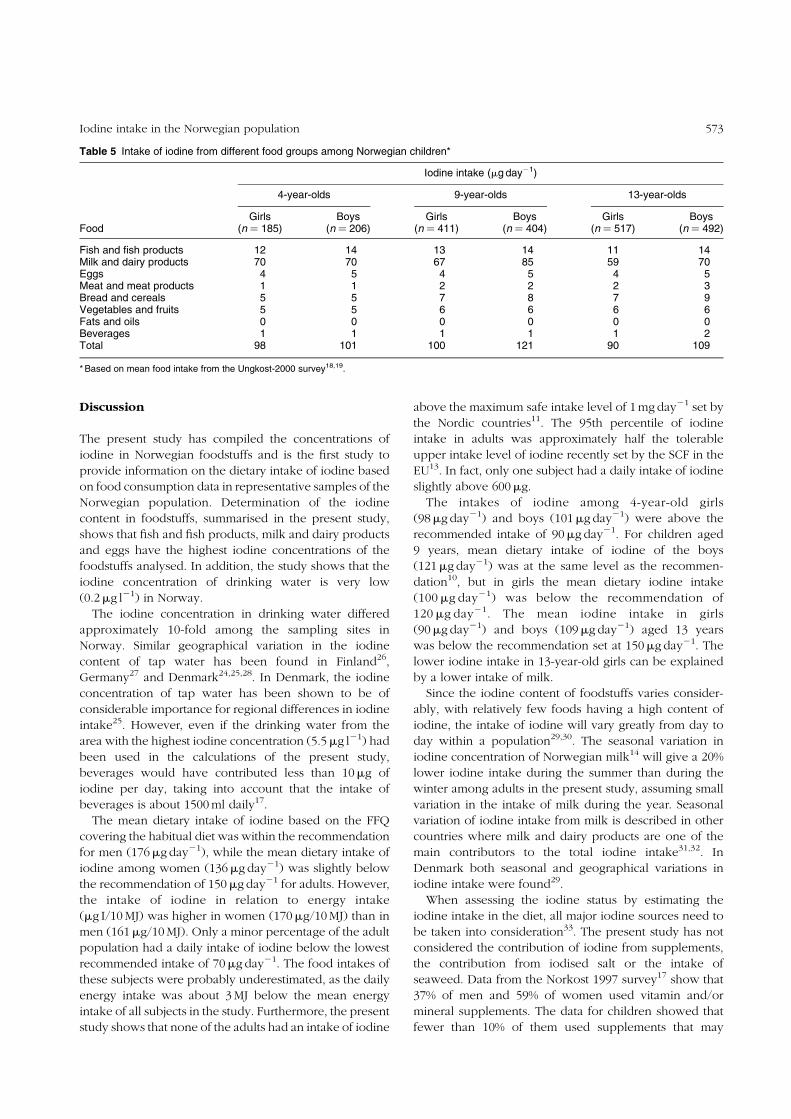
The mean daily intake of iodine among the groups of
children ranged from 90 to 121mg (Table 5). Milk and
dairy products contributed approximately 64–71% of the
total iodine intake, and fish and fish products contributed
12–14% of the total iodine intake in the diet of the
children. Milk was the most important source of iodine in
the children’s diet, contributing approximately 50% of the
total iodine intake. The lowest iodine intake was found
among girls aged 13 years and this was due to a lower
intake of milk compared with the other age groups of
children. Boys aged 9 years had the highest intake of milk
and also the highest intake of iodine.
Table 2 Iodine concentration (mg l21) in drinking water in Norway:mean (standard deviation)
Location* Iodine (mg l21)
Coast 2.0 (1.5)Vadsø 0.8Alta 1.2Tromsø 0.5Bodø 1.4Mosjøen 0.8Trondheim 1.9Alesund 2.1Bergen 2.3Stavanger 5.5Kristiansand 4.2Oslo 1.5
Inland 0.8 (0.2)Kautokeino 0.9Hamar 0.9Gol 0.7Rjukan 0.6
All 1.7 (1.4)
* Location gradient from north to south.
Table 4 Intake of iodine by Norwegian adults*
Iodine intake (mg day21)
PercentileMen
(n ¼ 1298)Women
(n ¼ 1374)All
(n ¼ 2672)
5 72 58 6310 89 71 7825 121 96 10550 166 129 14675 219 168 19190 274 206 24695 315 236 283
* Food intake data from the Norkost 1997 survey17.
Table 3 Daily intakes of food and iodine from different food groups by Norwegian adults
Mean food intake*(g day21)
Iodine intake†(mg day21)
Proportion of intake(%)
Food Men Women Men Women Men Women
Fish, total 72 58 40 33 23 24Fish, lean 26 21 22 18Fish, fatty 11 8 4 3Fish products 14 12 8 7Fish, sandwich spread 12 8 4 3Fish, other products 10 9 1 1
Dairy products 577 416 101 76 57 56Milk, all types‡ 518 363 78 54Cheese, white 23 22 9 8Cheese, whey 9 8 12 11Cream and cream products 27 23 3 2
Eggs 19 15 9 7 5 5Meat and meat products 125 87 3 2 2 1Bread and cereals 317 227 9 6 5 4Potatoes 147 100 3 2 2 1Vegetables 123 146 3 3 2 2Fruits, berries and juice 218 225 4 5 2 4Fats and oils 42 28 1 1 1 1Beverages 1512 1370 3 3 2 2Total intake 176 136
* Food intake data from the Norkost 1997 survey17.† Mean iodine concentrations are given in Table 1.‡ Includes yoghurt.
L Dahl et al.572
Discussion
The present study has compiled the concentrations of
iodine in Norwegian foodstuffs and is the first study to
provide information on the dietary intake of iodine based
on food consumption data in representative samples of the
Norwegian population. Determination of the iodine
content in foodstuffs, summarised in the present study,
shows that fish and fish products, milk and dairy products
and eggs have the highest iodine concentrations of the
foodstuffs analysed. In addition, the study shows that the
iodine concentration of drinking water is very low
(0.2mg l21) in Norway.
The iodine concentration in drinking water differed
approximately 10-fold among the sampling sites in
Norway. Similar geographical variation in the iodine
content of tap water has been found in Finland26,
Germany27 and Denmark24,25,28. In Denmark, the iodine
concentration of tap water has been shown to be of
considerable importance for regional differences in iodine
intake25. However, even if the drinking water from the
area with the highest iodine concentration (5.5mg l21) had
been used in the calculations of the present study,
beverages would have contributed less than 10mg of
iodine per day, taking into account that the intake of
beverages is about 1500 ml daily17.
The mean dietary intake of iodine based on the FFQ
covering the habitual diet was within the recommendation
for men (176mg day21), while the mean dietary intake of
iodine among women (136mg day21) was slightly below
the recommendation of 150mg day21 for adults. However,
the intake of iodine in relation to energy intake
(mg I/10 MJ) was higher in women (170mg/10 MJ) than in
men (161mg/10 MJ). Only a minor percentage of the adult
population had a daily intake of iodine below the lowest
recommended intake of 70mg day21. The food intakes of
these subjects were probably underestimated, as the daily
energy intake was about 3 MJ below the mean energy
intake of all subjects in the study. Furthermore, the present
study shows that none of the adults had an intake of iodine
above the maximum safe intake level of 1 mg day21 set by
the Nordic countries11. The 95th percentile of iodine
intake in adults was approximately half the tolerable
upper intake level of iodine recently set by the SCF in the
EU13. In fact, only one subject had a daily intake of iodine
slightly above 600mg.
The intakes of iodine among 4-year-old girls
(98mg day21) and boys (101mg day21) were above the
recommended intake of 90mg day21. For children aged
9 years, mean dietary intake of iodine of the boys
(121mg day21) was at the same level as the recommen-
dation10, but in girls the mean dietary iodine intake
(100mg day21) was below the recommendation of
120mg day21. The mean iodine intake in girls
(90mg day21) and boys (109mg day21) aged 13 years
was below the recommendation set at 150mg day21. The
lower iodine intake in 13-year-old girls can be explained
by a lower intake of milk.
Since the iodine content of foodstuffs varies consider-
ably, with relatively few foods having a high content of
iodine, the intake of iodine will vary greatly from day to
day within a population29,30. The seasonal variation in
iodine concentration of Norwegian milk14 will give a 20%
lower iodine intake during the summer than during the
winter among adults in the present study, assuming small
variation in the intake of milk during the year. Seasonal
variation of iodine intake from milk is described in other
countries where milk and dairy products are one of the
main contributors to the total iodine intake31,32. In
Denmark both seasonal and geographical variations in
iodine intake were found29.
When assessing the iodine status by estimating the
iodine intake in the diet, all major iodine sources need to
be taken into consideration33. The present study has not
considered the contribution of iodine from supplements,
the contribution from iodised salt or the intake of
seaweed. Data from the Norkost 1997 survey17 show that
37% of men and 59% of women used vitamin and/or
mineral supplements. The data for children showed that
fewer than 10% of them used supplements that may
Table 5 Intake of iodine from different food groups among Norwegian children*
Iodine intake (mg day21)
4-year-olds 9-year-olds 13-year-olds
FoodGirls
(n ¼ 185)Boys
(n ¼ 206)Girls
(n ¼ 411)Boys
(n ¼ 404)Girls
(n ¼ 517)Boys
(n ¼ 492)
Fish and fish products 12 14 13 14 11 14Milk and dairy products 70 70 67 85 59 70Eggs 4 5 4 5 4 5Meat and meat products 1 1 2 2 2 3Bread and cereals 5 5 7 8 7 9Vegetables and fruits 5 5 6 6 6 6Fats and oils 0 0 0 0 0 0Beverages 1 1 1 1 1 2Total 98 101 100 121 90 109
* Based on mean food intake from the Ungkost-2000 survey18,19.
Iodine intake in the Norwegian population 573
contain iodine18,19. There is no documentation as to what
extent and in what amount the vitamin and mineral
supplements contain iodine in Norway. However, it is
reasonable to assume that about 25% of the most
commonly used vitamin and mineral supplements contain
70 to 150mg I per tablet. When it comes to iodised salt,
only some brands of table salt are fortified with iodine, and
regulations permit only the addition of 5mg of iodine per g
of NaCl7. Thus iodised salt will add only about 15mg day21
to our intake of iodine if 3 g of iodised table salt is used
daily. Industrial salt used in food production is not
supplemented with iodine7. The intake of seaweed in
Norway is unknown, but consumption is expected to be
restricted to small subgroups of the population.
The daily intake of iodine by adults in other countries
has recently been calculated by different dietary methods.
In Denmark, the median daily intake of iodine was in the
range of 85–168mg in different groups of the popu-
lation29. The daily intake of iodine has been calculated in
several studies in The Netherlands and found to be in the
range of 85–293mg34. The mean intake of iodine is
calculated to be approximately 340mg day21 in Finland31
and 119mg day21 in Germany35. In the UK the daily iodine
intake was found to be in the range of 166–277mg in
studies carried out from 1985 to 199736–38. The intake of
iodine in The Netherlands34 of boys and girls aged 4–6
years was similar to those found in the present study,
whereas the intake of iodine in children and adolescents
aged 7–15 years was higher compared with findings in the
present study.
The WHO/International Council for Control of Iodine
Deficiency Disorders/United Nations Children’s Fund
criterion for assessing iodine status is the iodine
concentration in urine4. Iodine intake assessed in studies
performed in 1971–726 and 19856 in several selected
groups of Norwegians showed mean urinary iodine
excretion in the range of 173–260mg/24 h, which
indicates sufficient intake of iodine. A recent study of
two selected groups of Norwegians39 showed median
urinary iodine excretion of 117 and 85mg l21, indicating
sufficient iodine intake and mild deficiency, respectively.
The urinary iodine excretion of more than half of the
population of Western and Central Europe indicates that
they are at risk of iodine deficiency40.
According to Vitti et al.41, most nations of Western and
Central Europe have weak or non-existent governmental
programmes to address the risk of iodine deficiency.
Universal salt iodisation is the agreed strategy for
achieving iodine sufficiency world-wide4. Although
Norway has never had mandatory iodisation of salt,
iodine deficiency has disappeared. The increase in the
iodine content of milk and related dairy products
through fodder fortification, and also the more wide-
spread use of saltwater fish, explains the eradication of
endemic goitre in Norway5,6. The present study shows
clearly that the iodine fortification of cow fodder is of
importance for the iodine intake of Norwegians, and the
fortification of cow fodder seems to be an effective way to
provide a population with sufficient iodine. Other studies
have claimed that iodine may occur in milk as a result of
the use of iodophores as cow teat sterilisers and
equipment sanitisers42,43. The dairies in Norway do not
use sanitisers or disinfectants containing iodophores14. In
Britain, the eradication of endemic goitre was mainly due
to changes in farming practices of milk and the marketing
of milk44. The more widespread use of fortified fodder in
Northern Europe compared with Southern Europe, where
pasture feeding is available for a greater part of the year,
may therefore explain why countries in Northern Europe
are likely to be more iodine-sufficient compared with
countries in Southern Europe.
The importance of milk and fish for total iodine intake
found in the present study may put certain groups of the
population at risk of low intake of iodine, i.e. subjects with
allergy to milk or fish, vegetarians who do not consume
fish, milk and dairy products and others with a low
consumption of milk and fish. Results from two different
studies in the UK45,46 indicated that different vegetarian
diets supplied less iodine than non-vegetarian diets.
In conclusion, milk, dairy products and fish are the main
sources of iodine in the Norwegian diet. The iodine
contribution of drinking water is negligible. The calculated
iodine intake based on an FFQ covering the habitual diet
showed that iodine intake was in the range of 100–
250mg day21 in the majority of the adult population. The
dietary intake of iodine was at the recommended level for
the youngest children; however, it decreased among
adolescents, especially girls. The study verifies the
importance of a regular intake of milk and dairy products,
as well as seafood, to meet the requirement for iodine in
the diet.
Acknowledgements
Berit Engen Solli and Jan Brenna at NIFES are acknowl-
edged for skilful technical assistance with the iodine
analyses. Employees at the Norwegian Food Control
Authority are kindly thanked for collecting the water
samples. The Norwegian Research Council (NFR) is
thanked for financially supporting this work (Project no.
120824/112).
References
1 Hetzel BS. Iodine deficiency disorders (IDD) and theireradication. Lancet 1983; ii: 1126–9.
2 Delange F. The disorders induced by iodine deficiency.Thyroid 1994; 4: 107–28.
3 Hetzel BS. Eliminating iodine deficiency disorders – the roleof the International Council in the global partnership.Bulletin of the World Health Organization 2002; 80(5):410–3.
4 World Health Organization (WHO)/United NationsChildren’s Fund/International Council for Control of Iodine
L Dahl et al.574
Deficiency Disorders. Assessment of the Iodine DeficiencyDisorders and Monitoring their Elimination. A Guide forProgramme Managers, 2nd ed. WHO/NHD/01.1. Geneva:WHO, 2001.
5 Devold O, Batt F, Closs K, Backer J. En strumaundersøkelsefra Modum. Norsk Magasin for Lægevitenskap 1937; 7:900–37 [in Norwegian].
6 Frey H, Rosenlund B, Try K, Theodorsen L. Urinary excretionof iodine in Norway. Delange F, ed. Iodine Deficiency inEurope. New York: Plenum Press, 1993; 297–300.
7 Ministry of Health. Generell forskrift for produksjon ogframbud m.v. av næringsmidler [Regulation of GeneralProduction of Food Offered to Consumers, online], 2002.Available at http://www.snt.no/rettsregler/forskrifter/hd-19830708-1252.html [in Norwegian].
8 Ministry of Agriculture. Forskrift om forvarer [Regulation ofFeeding Stuff, online], 2002. Available at from http://www.lovdata.no/for/sf/ld/ld-20021107-1290.html [in Norwegian].
9 Julshamn K, Dahl L, Eckhoff K. Determination of iodine inseafood by inductively coupled plasma/mass spectrometry.Journal of AOAC International 2001; 84: 1976–83.
10 National Council on Nutrition and Physical Activity. Norskenæringsstoffanbefalinger [Norwegian Nutrient Recommen-dations]. Oslo: National Council on Nutrition and PhysicalActivity, 1997 [in Norwegian].
11 Sandstrom B, Aro A, Becker W, Lyhne N, Pedersen JI,Porsdottir I. Nordiska narings-rekommendationer 1996[Nordic Nutrition Recommendations 1996 ]. Nord 1996; 28.Copenhagen: Nordic Council of Ministers, 1996 [in Swedish].
12 Subcommittee of the Tenth Edition of the RDAs, Food andNutrition Board Commission on Life Sciences, NationalResearch Council. Iodine. In: Recommended DietaryAllowances. Washington, DC: National Academy Press,1989; 213–6.
13 European Commission. Opinion of the Scientific Committeeon Food on the Tolerable Upper Intake Level ofIodine [online]. Available at http://europa.eu.int/comm/food/fs/sc/scf/out146_en.pdf. Accessed 7 October 2002.
14 Dahl L, Opsahl JA, Meltzer HM, Julshamn K. Iodineconcentration in Norwegian milk and dairy products. BritishJournal of Nutrition 2003; 90: 679–85.
15 Rimestad AH, Borgejordet A, Norunn KV, Sygnestveit K,Løken EB, Trygg K, et al. Den store matvaretabellen[Norwegian Food Composition Table]. Oslo: Gyldendalundervisning, 2001 [in Norwegian].
16 Fecher PA, Goldmann I, Nagengast A. Determination ofiodine in food samples by inductively coupled plasma massspectrometry after alkaline extraction. Journal of AnalyticalAtomic Spectrometry 1998; 13: 977–82.
17 Johansson L, Solvoll K. Norkost 1997. Landsomfattendekostholdsundersøkelse blant menn og kvinner i alderen16–79 ar [National Dietary Survey among Males andFemales, 16–79 years]. Publication No. 2. Oslo: NationalCouncil on Nutrition and Physical Activity, 1999[in Norwegian].
18 Pollestad M, Øverby N, Andersen L. Ungkost-2000. Kostholdblant 4-aringer: Landsomfattende kostholdsundersøkelse[Dietary Intake among 4 years old Children]. Oslo:Directorate for Health and Social Affairs, Division ofNutrition, 2002 [in Norwegian].
19 Øverby N, Andersen L. Ungkost-2000: Landsomfattendekostholdsundersøkelse blant elever i 4-og 8. klasse i Norge[National Dietary Survey among 4- and 8-grade Pupils inNorway]. Oslo: Directorate for Health and Social Affairs,Division of Nutrition, 2002 [in Norwegian].
20 Nes M, Frost Andersen L, Solvoll K, Sandstad B, Hustvedt B,Løvø A, et al. Accuracy of a quantitative food frequencyquestionnaire applied in elderly Norwegian women.European Journal of Clinical Nutrition 1992; 42: 809–21.
21 Solvoll K, Lund-Larsen K, Søyland E, Sandstad B, Drevon C.
A quantitative food frequency questionnaire evaluated in agroup of dermatologic outpatients. Scandinavian Journal ofNutrition 1993; 37: 150–5.
22 Andersen LF, Solvoll K, Drevon C. Very long-chain n–3 fattyacids as biomarkers for intake of fish and n–3 fatty acidsconcentrates. American Journal of Clinical Nutrition 1996;64: 305–11.
23 Andersen LF, Solvoll K, Johansson LRK, Salminen I, Aro A,Drevon CA. Evaluation of a food frequency questionnairewith weighed records, fatty acids and alpha-tocopherol inadipose tissue and serum. American Journal of Epidemiol-ogy 1999; 150: 75–87.
24 Rasmussen LB, Larsen EH, Ovesen L. Iodine content indrinking water and other beverages in Denmark. EuropeanJournal of Clinical Nutrition 2000; 54: 57–60.
25 Pedersen KM, Laurberg P, Nøhr S, Jorgensen A, Andersen S.Iodine in drinking water varies by more than 100-fold inDenmark. Importance for iodine content of infant formulas.European Journal of Endocrinology 1999; 140: 400–3.
26 Hasanen E. Iodine content of drinking water and diseases ofcirculatory system. Annales Medicinae Experimentalis etBiologiae Fenniae 1970; 48: 117–21.
27 Felgentraeger HJ. Zum jodgehaltes der umwelt in der DDRund seine beziehungen zum gesundheitzustand derbevolkerung. Zeitschrift fur die gesamte Hygiene und ihreGrenzgebiete 1984; 30: 154–5 (in German).
28 Andersen S, Petersen SB, Laurberg P. Iodine in drinkingwater in Denmark is bound in humic substances. EuropeanJournal of Endocrinology 2002; 147: 663–70.
29 Rasmussen LB, Ovesen L, Bulow I, Jørgensen T, Knudsen N,Laurberg P, et al. Dietary iodine intake and urinary iodineexcretion in a Danish population: effect of geography,supplements and food choice. British Journal of Nutrition2002; 87: 61–9.
30 Wild CP, Andersson C, O’Brien NM, Wilson L, Woods JA. Acritical evaluation of the application of biomarkers inepidemiological studies on diet and health. British Journalof Nutrition 2001; 86: S37–53.
31 Varo P, Saari E, Koivistoinen P. Iodine in Finnish foods.International Journal for Vitamin and Nutrition Research1982; 52: 80–9.
32 Ministry of Agriculture, Fisheries and Food. Iodine in Milk[online]. Food Surveillance Information Sheet No. 196, 2000.Available at http://www.food.gov.uk/science/surveillance/maffinfo/2000/maff-2000-198.
33 Tokudome S, Tokudome Y, Moore MA. Dietary iodinesources other than fish. European Journal of ClinicalNutrition 2002; 56: 467–8.
34 Brussaard JH, Hulshof K, Lowik MRH. Calculated iodineintake before and after simulated iodization (Dutch NutritionSurveillance System). Annals of Nutrition & Metabolism1995; 39: 85–94.
35 Manz F, Bohmer T, Gartner R, Grossklaus R, Klett M,Schneider R. Quantification of iodine supply: representativedata on intake and urinary excretion of iodine from theGerman population in 1996. Annals of Nutrition &Metabolism 2002; 46: 128–38.
36 Lee SM, Lewis J, Buss DH, Holcombe GD, Lawrance PR.Iodine in British foods and diets. British Journal of Nutrition1994; 72: 435–46.
37 Rose M, Miller P, Baxter M, Appleton G, Crews H, CroasdaleM. Bromine and iodine in 1997 UK total diet study samples.Journal of Environmental Monitoring 2001; 3: 361–5.
38 Ministry of Agriculture, Fisheries and Food (MAFF). NutrientAnalysis of Liquid Pasteurised Milk. Food SurveillanceInformation Sheet No. 128. London: HM Stationery Office,1997.
39 Dahl L, Meltzer HM, Opsahl JA, Julshamn K. Iodine intakeand status in two groups of Norwegians. ScandinavianJournal of Nutrition 2003; 47(4): 170–8.
Iodine intake in the Norwegian population 575
40 Vitti P, Rago T, Aghini-Lombardi F, Pinhera A. Iodinedeficiency in Europe. Public Health Nutrition 2001; 4:529–35.
41 Vitti P, Delange F, Pincherra A, Zimmermann M, Dunn JT.Europe is iodine deficient [correspondence]. Lancet 2003;361: 1226.
42 Franke PA, Goldman I, Osland RB. Factors affecting iodineconcentration of milk of individual cows. Journal of DairyScience 1983; 66: 997–1002.
43 Galton DM, Peterson LG, Erb HM. Milk iodine residues inherds practicing iodophors premilking teat disinfection.Journal of Dairy Science 1986; 69: 267–71.
44 Phillips DIW. Iodine, milk and the elimination of endemicgoitre in Britain: the story of an accidental public healthtriumph. Journal of Epidemiology and Community Health1997; 51: 391–3.
45 Lightowler HJ, Davies GJ. Iodine intake and iodinedeficiency in vegans as assessed by the duplicate-portiontechnique and urinary iodine excretion. British Journal ofNutrition 1998; 80: 529–35.
46 Remer T, Neubert A, Manz F. Increased risk of iodinedeficiency with vegetarian nutrition. British Journal ofNutrition 1999; 81: 45–9.
L Dahl et al.576