the influence of use-related, environmental, and managerial factors on soil loss from recreational...
TRANSCRIPT
lable at ScienceDirect
Journal of Environmental Management 90 (2009) 1483–1493
Contents lists avai
Journal of Environmental Management
journal homepage: www.elsevier .com/locate/ jenvman
The influence of use-related, environmental, and managerial factors on soilloss from recreational trails
Nathaniel D. Olive a, Jeffrey L. Marion b,*
a Warnell School of Forestry and Natural Resources, Recreation and Tourism program, University of Georgia, Athens, Georgia 30601, USAb Virginia Tech Field Station, Forestry Department (0324), USGS Patuxent Wildlife Research Center, Blacksburg, Virginia 24061, USA
a r t i c l e i n f o
Article history:Received 9 March 2006Received in revised form10 September 2008Accepted 7 October 2008Available online 4 December 2008
Keywords:Recreation impactTrail impactTrail erosionSoil erosionTrail impact monitoringTourism impact
* Corresponding author. Tel.: þ1 540 231 6603; faxE-mail address: [email protected] (J.L. Marion).
0301-4797/$ – see front matter Published by Elsevierdoi:10.1016/j.jenvman.2008.10.004
a b s t r a c t
Recreational uses of unsurfaced trails inevitably result in their degradation, with the type and extent ofresource impact influenced by factors such as soil texture, topography, climate, trail design and main-tenance, and type and amount of use. Of particular concern, the loss of soil through erosion is generallyconsidered a significant and irreversible form of trail impact. This research investigated the influence ofseveral use-related, environmental, and managerial factors on soil loss on recreational trails and roads atBig South Fork National River and Recreation Area, a unit of the U.S. National Park Service. Regressionmodeling revealed that trail position, trail slope alignment angle, grade, water drainage, and type of useare significant determinants of soil loss. The introduction of individual and groups of variables intoa series of regression models provides improved understanding and insights regarding the relativeinfluence of these variables, informing the selection of more effective trail management actions. Studyresults suggest that trail erosion can be minimized by avoiding ‘‘fall-line’’ alignments, steep grades, andvalley-bottom alignments near streams, installing and maintaining adequate densities of tread drainagefeatures, applying gravel to harden treads, and reducing horse and all-terrain vehicle use or restrictingthem to more resistant routes.This research also sought to develop a more efficient Variable Cross-Sectional Area method for assessingsoil loss on trails. This method permitted incorporation of CSA measures in a representative samplingscheme applied to a large (24%) sample of the park’s 526 km trail system. The variety of soil lossmeasures derived from the Variable CSA method, including extrapolated trail-wide soil loss estimates,permit an objective quantification of soil erosion on recreational trails and roads. Such data supportrelational analyses to increase understanding of trail degradation, and long-term monitoring of thenatural and recreational integrity of the trail system infrastructure.
Published by Elsevier Ltd.
1. Introduction
Recreation-related impacts in protected natural areas are anincreasing concern for land managers, who are generally guided bymandates requiring the preservation of natural conditions andprovision of recreational opportunities (Hammitt and Cole, 1998;Leung and Marion, 2000). Impacts to flora, fauna, and waterresources are generally most pronounced at locations receivingconcentrated visitor use, including trails, campsites and varioustypes of day-use recreation sites. Of these impacts, managers ofNational Park Service (NPS) backcountry areas identified trailimpacts as the most widespread and challenging problem (Marionet al., 1993). Soil erosion was cited as the most widespread trail
: þ1 540 231 3698.
Ltd.
impact, with 44% of managers indicating it as a problem in ‘‘manyor most areas’’ of their parks. Such challenges are likely to continueas trail-related recreational uses continue to expand, as suggestedby the U.S. National Survey on Recreation and the Environment,which identified substantial increases in horseback riding (45%),bicycling (53%), hiking (183%) and backpacking (217%) from 1983 to2000 (Cordell and Overdevest, 2001).
Common trail impacts include vegetation loss and composi-tional change, tread widening, muddiness, proliferation ofinformal (visitor-created) trails, and soil erosion (Hall and Kuss,1989; Hill and Pickering, 2006; Marion and Leung, 2001).Furthermore, soil erosion from trails can degrade more distantnatural systems, such as aquatic resources and organisms harmedby increased turbidity and sedimentation (Hammitt and Cole,1998). Trail erosion, in particular, is a significant managementconcern because it is irreversible without costly managementactions that may further impact resources or increase the

N.D. Olive, J.L. Marion / Journal of Environmental Management 90 (2009) 1483–14931484
development and artificiality of recreation settings. Whensubstantial, trail erosion can degrade visitor experiences and createdifficult or unsafe travel conditions (Leung and Marion, 1996;Marion and Leung, 2001). Park visitors have also demonstrateda low tolerance to erosion on hiking trails and near stream banks inprotected natural areas (Noe et al., 1997).
Scientific understanding of factors influencing the trail erosionprocess can lead managers to the most effective means fordesigning and managing sustainable trail systems (Farrell andMarion, 2002; Leung and Marion, 1996; Newsome et al., 2002)(Table 1). While the action of water, and to a lesser extent, wind,feet, hooves, and tires, are the direct causal forces of erosion, otherinfluential factors can be managed to minimize the loss of trail soils(Newsome et al., 2004; Summer, 1980). For example, under-standing the specific nature of impacts resulting from different trailuse types can guide managers in developing visitor and trailmanagement practices to minimize erosion. Marion (1994)observed that the heavy ground pressure exerted by horse hoovesaccelerates erosion and muddiness on trails by removing vegetativeand organic cover, compacting underlying soils to an impermeablehardpan, and churning or displacing surface soil particles makingthem more available for erosion or prone to muddiness.
Managers can limit contributing factors to erosion, such as trailalignments that allow topography to channel water along treads,while maintaining trails or managing visitors to provide safe andsustainable recreational opportunities. Comparisons of tramplingand erosion indicators by use type has found horse use to besignificantly more impacting than hiking, llama use, and mountainbiking (Cole and Spildie, 1998; Dale and Weaver, 1974; Marion andWimpey, 2007; Newsome et al., 2004; Thurston and Reader, 2001;Wilson and Seney, 1994). This is largely attributable to the heavyweight of horses and riders, exerting a ground pressure ofapproximately 43,590 kg-force/m2 for shod horses, compared to2039 kg-force/m2 for a hiker wearing boots (Liddle, 1997). Motor-ized uses, including 2- and 4-wheel drive vehicles, all-terrainvehicles and motorcycles, have a greater potential for impact thannon-motorized uses due to a number of factors (Liddle, 1997). Tiresthat spin at higher rates of speed cause more substantial abrasiondamage to vegetation, roots and soils. Meyer (2001) observed thatall-terrain vehicle (ATV) impacts from pressure-bearing tires canresult in shearing and pumping actions that readily breakdown soilstructure and lead to particle erosion. The greater weight andground pressure of vehicles also cause greater soil compaction,shearing, and displacement – actions that cause soil ruttingthrough the compaction or displacement of soil.
Table 1Attributes of environmental, managerial and use-related factors that contribute to great
Factors Attributes contributing togreater erosion susceptibility
EnvironmentalGeology Soils with homogeneous texture soils; fine-
and coarse-grained soil texturesClimate High precipitation ratesTopography Steep landforms; high elevation; proximity to rivers and streamVegetation Mature forests; mesic forests; broad-leafed ground vegetation
ManagerialTrail design Steep trail grades; trails aligned congruent with prevailing slop
tread not outsloped; lack of grade reversalsMaintenance Non-existent or ineffective tread drainage featuresVisitor-related Failure to regulate type or amount of use;
lack of low-impact behavior education
Use-relatedUse amount High use in sensitive vegetation and/or soil typesUse type Improper use type for environmental and design factorsUser behavior Failure to stay on maintained path; high use during wet conditi
High quality information about trail and environmental condi-tions is critical for trail design, construction, and long-term main-tenance. Trail managers and researchers, often faced with limitedbudgets and specific data needs, must choose from differentinformation gathering methods and techniques that meet anappropriate balance between efficiency, data accuracy, and reli-ability. A review of methods by Hammitt and Cole (1998) found thatthe Cross-Sectional Area (CSA) method was the most accurate andreliable methodological approach, but that it was less efficient thanothers. However, alternate methods, such as simple maximumincision measures or categorical erosion ratings, are incapable ofproviding trail-wide estimates of soil loss. Refinement of the CSAmethod could increase efficiency and preserve data quality.
The primary objective of this exploratory research is to improveunderstanding of the relationships and relative influence of factorsinfluencing Cross-Sectional Area soil loss to improve guidance forland management professionals responsible for managingsustainable trails systems. A secondary objective is to develop andapply a Variable Cross-Sectional Area method that more efficientlymeasures trail soil loss and explore its statistical utility in analysesseeking to understand factors that influence trail erosion. Studyresults include management implications of the regression anal-yses and the utility of the new trail erosion assessment procedurefor trail condition assessment and monitoring.
2. Methods
2.1. Study area
The study area for this research was Big South Fork NationalRiver and Recreation Area (BSFNR), located in south-central Ken-tucky and north-central Tennessee, USA. This National Park Service(NPS) managed park encompasses 50,990 ha and receives nearly900,000 visitors annually, with trail-related recreational activitiesaccounting for a large portion of total visitor use. The BSFNRcontains approximately 526 km of single and multi-use trails usedprimarily by horseback riders, though ATV use, hiking, andmountain biking are also common recreational activities.
Approximately one-half of the BSFNR is a river gorge featuringmany sheer bluffs and deep narrow drainages that feed into the BigSouth Fork River – designated an Outstanding National ResourceWaters area. Six mussel species are federally listed as endangeredand are threatened by sedimentation in park waterways (NationalPark Service, 2003). Vegetation consists of river birch and sycamorein floodplains; hemlock in narrow gorges and along streams; beech,
er susceptibility of trail soil erosion.
Citations
Bratton et al. (1979), Bryan (1977), Burde and Renfro (1986),Helgath (1975), Meyer (2002), Whinam and Comfort (1996)
s
es; Birchard and Proudman (2000), Cole (1989), Farrell and Marion (2002),Hesselbarth and Vachowski (2000), IMBA (2004)
Cole (1983), Deluca et al. (1998), Farrell and Marion (2002), Leung andMarion (1999b), Sun and Liddle (1993)
ons
N.D. Olive, J.L. Marion / Journal of Environmental Management 90 (2009) 1483–1493 1485
sugar maple, and yellow birch-with oaks on the middle and lowerslopes; mixed oaks and hickory in gently sloping upland areas; andVirginia pine on dry ridges and cliff-lines. Gorge soils are in theRamsey–Hartells–Grimsely–Gilpin group complex, and plateausoils are in the Hartsells–Lonewood–Ramsey–Gilpin groupcomplex. While richer in the floodplains, they are generally, thin,acidic, and sandy.
2.2. Sampling and measurement procedures
A use type stratified random sample, taken from the BSFNRGeographic Information System recreational trails and primitiveroads database, was produced using the SPSS Random Sampleprocedure. The objective of the use type stratification was to matchthe proportion of trail mileage for use types in the sample to theproportion of trail mileage for use types in the population. Wherenecessary, trails were subdivided into 9.7 km segments to avoidunder-sampling longer trails. Of the resulting trail population(526 km, 171 trail segments) a large (24%) sample was taken(126 km, 47 trail segments). This was to ensure an adequatequantitative representation of diverse environmental, managerial,and use-related factors for an accurate inventory of baselineconditions for the entire trail system (Cole, 1983). Amount of use(high, medium, low) and percentage use by mode of travel (horse,hike, mountain bike, ATV) were categorically assigned for eachsegment by a knowledgeable park trail manager. This individual hasextensive observational knowledge of current and historical trailuse patterns and his judgments provided the best available infor-mation. Segments receiving an estimate of 75% or more of any usetype were categorized as representative of that type for use typeanalyses; remaining segments were categorized as ‘‘mixed use.’’
A point-sampling method using a systematic interval followinga randomized start was used to locate transects along each trailwhere trail conditions were assessed (Farrell and Marion, 2002;Marion and Leung, 2001). An interval of 152 m was used followingguidance provided by Leung and Marion (1999a). A measuringwheel (1.2 m circumference) was used to identify transect loca-tions. At each sample point, a transect was established perpendic-ular to the trail tread with endpoints defined by visuallypronounced changes in non-woody vegetation height (trampled vs.untrampled), cover, composition, or, when vegetation cover isminimal or absent, by disturbance to organic litter. The objectivewas to define the trail tread that receives the majority (>95%) oftraffic, selecting the most visually obvious boundaries that can bemost consistently identified. Temporary stakes were placed at theseboundaries and the distance between was measured as treadwidth. The percentage of this width with visible human-placedgravel was also estimated to the nearest 5%.
The grade of the trail and the trail slope alignment angle, thedifference in compass bearing between the prevailing landformslope (aspect) and the trail’s alignment angle at the sample point,were assessed at each transect. A trail aligned along the contour
Stake
V3 V4
I2 I3 I4I1
V5V2
V1
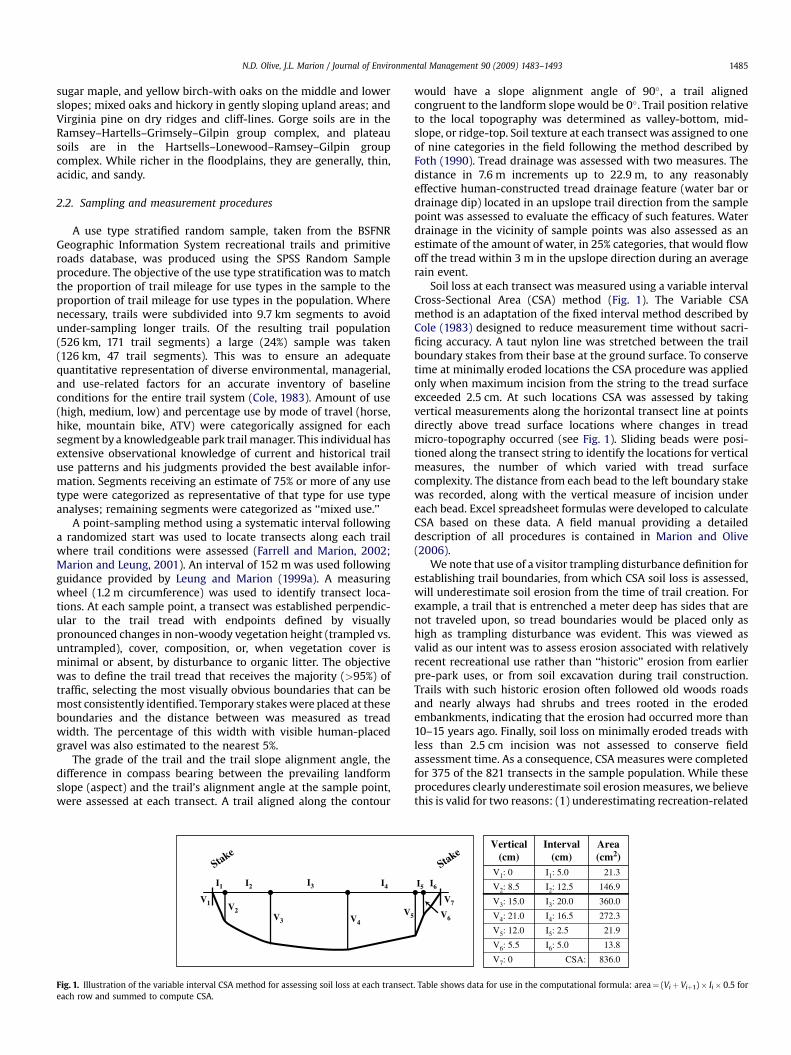
Fig. 1. Illustration of the variable interval CSA method for assessing soil loss at each transecteach row and summed to compute CSA.
would have a slope alignment angle of 90�, a trail alignedcongruent to the landform slope would be 0�. Trail position relativeto the local topography was determined as valley-bottom, mid-slope, or ridge-top. Soil texture at each transect was assigned to oneof nine categories in the field following the method described byFoth (1990). Tread drainage was assessed with two measures. Thedistance in 7.6 m increments up to 22.9 m, to any reasonablyeffective human-constructed tread drainage feature (water bar ordrainage dip) located in an upslope trail direction from the samplepoint was assessed to evaluate the efficacy of such features. Waterdrainage in the vicinity of sample points was also assessed as anestimate of the amount of water, in 25% categories, that would flowoff the tread within 3 m in the upslope direction during an averagerain event.
Soil loss at each transect was measured using a variable intervalCross-Sectional Area (CSA) method (Fig. 1). The Variable CSAmethod is an adaptation of the fixed interval method described byCole (1983) designed to reduce measurement time without sacri-ficing accuracy. A taut nylon line was stretched between the trailboundary stakes from their base at the ground surface. To conservetime at minimally eroded locations the CSA procedure was appliedonly when maximum incision from the string to the tread surfaceexceeded 2.5 cm. At such locations CSA was assessed by takingvertical measurements along the horizontal transect line at pointsdirectly above tread surface locations where changes in treadmicro-topography occurred (see Fig. 1). Sliding beads were posi-tioned along the transect string to identify the locations for verticalmeasures, the number of which varied with tread surfacecomplexity. The distance from each bead to the left boundary stakewas recorded, along with the vertical measure of incision undereach bead. Excel spreadsheet formulas were developed to calculateCSA based on these data. A field manual providing a detaileddescription of all procedures is contained in Marion and Olive(2006).
We note that use of a visitor trampling disturbance definition forestablishing trail boundaries, from which CSA soil loss is assessed,will underestimate soil erosion from the time of trail creation. Forexample, a trail that is entrenched a meter deep has sides that arenot traveled upon, so tread boundaries would be placed only ashigh as trampling disturbance was evident. This was viewed asvalid as our intent was to assess erosion associated with relativelyrecent recreational use rather than ‘‘historic’’ erosion from earlierpre-park uses, or from soil excavation during trail construction.Trails with such historic erosion often followed old woods roadsand nearly always had shrubs and trees rooted in the erodedembankments, indicating that the erosion had occurred more than10–15 years ago. Finally, soil loss on minimally eroded treads withless than 2.5 cm incision was not assessed to conserve fieldassessment time. As a consequence, CSA measures were completedfor 375 of the 821 transects in the sample population. While theseprocedures clearly underestimate soil erosion measures, we believethis is valid for two reasons: (1) underestimating recreation-related
Vertical(cm)
Interval(cm)
Area(cm2)
V1: 0 I1: 5.0 21.3
V2: 8.5 I2: 12.5 146.9
V3: 15.0 I3: 20.0 360.0
V4: 21.0 I4: 16.5 272.3
V5: 12.0 I5: 2.5 21.9
V6: 5.5 I6: 5.0 13.8
V7: 0 CSA: 836.0
Stake
V6
I6I5
V7
. Table shows data for use in the computational formula: area¼ (Viþ Viþ1)� Ii� 0.5 for

N.D. Olive, J.L. Marion / Journal of Environmental Management 90 (2009) 1483–14931486
erosion is better than including soil loss caused by older pre-parktrail or woods road uses or by trail construction work, and (2)focusing soil loss measures on more recent erosion is moremanagerially relevant for monitoring purposes and managementdecision making purposes.
2.3. Analyses
A series of multivariate regression analyses were run to examinethe relative influence and relationships of numerous independentvariables on the dependent Variable CSA. Coefficients of determi-nation were compared between models to build a dynamic statis-tical representation of field conditions that allowed analyses offactors that influenced erosion. Influential variables were identifiedthrough forward and backward step-wise selection procedures indeveloping relational models of trail erosion. The focus of theseanalyses is on soil erosion because park staff and study findingsrevealed this form of trail degradation to be the most significantproblem relating to the sustainability of park resources and trail-dependent recreational uses.
Categorical indicators (e.g., type of use) were analyzed bycreating related sets of ‘‘dummy’’ variables. However, sinceregression procedures do not allow dummy variables to be includedin complete sets, literature findings and managerial relevance wereconsidered in producing two conceptual groupings of variables: (1)a baseline model of control variables, and (2) a set of main variableswith a high degree of managerial relevancy and statisticallysignificant effects on soil erosion. This separation was also done tostatistically control for factors that have been shown in past liter-ature to influence dependent variable values. Insignificant variablesdetracting from the relational model were excluded to avoidspecification error.
2.3.1. Control variablesBaseline variables for the relational model take into consider-
ation less influential variables that make significant contributionsto CSA. Included variables are soil texture, water drainage, use level,and gravel percentage. Similar soil textures were aggregated tocreate the dummy variable categories loam, sandy loam, organicsoil, and the reference category clay. Use levels are categorized aslow, medium, and the reference category high.
2.3.2. Main variablesFour main independent variables were chosen on the basis of
statistical significance, findings present in the literature, andmanagerial relevancy: trail position, trail slope alignment angle,use type, and trail grade. Trail position was categorized as ridge,mid-slope, and the reference category valley. Use type was cate-gorized into hike, mountain bike, ATV, mixed, and the referencecategory horse.
2.3.3. Analysis methodologyDescriptive statistics were calculated to characterize the trail
sample for all variables included in the analyses. Weighted least-squares regression analyses were used to examine the relationshipsand interactions of influential variables on soil erosion (CSA). One-way analysis of variance (ANOVA) tests were used within regres-sion procedures to test for significant differences in effects on CSA.Dummy variable categories were tested with ANOVA relative toreference (omitted) categories. Finally, product terms werecomputed and tested using ANOVA for interactions between trailgrade and slope alignment angle, and slope alignment angle anduse type. Means for these variables were centered in the process toavoid multicollinearity.
Preliminary analyses revealed severe skew in the dependentvariable, caused by a large number of zero values, where CSA was
assumed to be zero because maximum incision was less than2.5 cm. Also, a fanned pattern in distribution of standardizedresiduals revealed heteroskedasticity, which was found to bea function of extreme outliers and the distance of sample points totrailheads: as points increased in distance from trailheads, a patternof irregularity in errors was observed.
To address these issues CSA was recoded as a binary response,where only values greater than zero (N¼ 375) were included inrelational analyses. This was appropriate because the zero valuesdid not undergo the CSA measurement procedure, and the distri-bution of CSA error values is assumed to be normally distributed inOLS regression. A weighted least-squares procedure was includedin analyses to control the effects of distance, and six extreme high-end outliers were excluded (N¼ 369) to meet the assumption ofhomoskedasticity and provide an unbiased regression line fit. Inaddition, Tobit top and bottom end censuring regression using thestatistical program Stata 8.3 was applied for comparison to the fullsample base (N¼ 821) to address concerns that binary resultswould be biased due to the exclusion of zero measure ‘‘success’’cases. By using the binary sample, interactions between mainvariables were studied from the computation of relevant productterms. The variance inflation factor (VIF) and a correlations matrixwere examined for each variable in regression modeling to detectany unacceptable levels of multicollinearity. Neither cut-off pointsof 4 (VIF) and 0.75 (correlations) were violated, indicating thatmulticollinearity was not a problem.
Finally, to summarize the magnitude of use type contrasts, CSAvalues were extrapolated from each trail transect to the trail 76 mbefore and after the transect location to provide an estimate of totalsoil loss for each trail segment in cubic meters. Corrected calcula-tions were required for the initial and final trail transects as theirintervals were less than the standard 152 m.
3. Results
3.1. Multivariate results
Results from a series of regression analyses indicate the indi-vidual (Table 2) and collective (Table 3) contribution of each maineffect variable to CSA, as terms are added into the statisticallycontrolled regression model. This exploratory approach revealshow well-known factors quantitatively contribute in relativedegrees to explain the variation in CSA values. In both tables,adjusted coefficients of multiple determination (R2) represent theproportion of explained variation in CSA by the included inde-pendent variables. Table 2 presents five regression models thatshow the individual effects as each main variable is added. After thevariability explained by the control set is removed (Model 1;R2¼ 0.10), the main variables are added individually in order ofgreatest to least variation explained. Trail topographic positionexplains the most variation in CSA (11%), showing that whencompared to trails in the river valley, mid-slope and ridge-toppositioned trails have significantly less soil loss (�755 cm2 and�1032 cm2, respectively; p< 0.01). Note that the valley positionserved as the ‘‘reference’’ category for this dummy coded variable,and has, by definition, a coefficient of 0.
Following trail position, trail alignment and use type eachexplain an additional 4% of CSA variance (Table 2). Trail alignment isa highly significant factor (p< 0.01), revealing that as trail slopealignments shift from orientations parallel to landform slopes (0�)to alignments along the contour (90�), that CSA values decline anestimated 8 cm2 per degree of increase. The use type variableshowed significant differences between hiking and horse ridinguses, with substantially less erosion (�697 cm2; p< 0.01) on hikingtrails. Interestingly, trail grade, frequently cited as an influentialfactor for trail erosion, did not explain any additional variation in

Table 2Effects of control and main variables across models on Cross-Sectional Area soil loss.
Variables Regression modelsa
(1) (2) (3) (4) (5)
Control variablesSoil texture
Clayb 0 0 0 0 0Sandy loam �329 (0.047)c �394 (0.012) �303 (0.063) �387 (0.020) �258 (0.126)Loam, silt loam �123 (0.445) �323 (0.049) �58 (0.744) �97 (0.586) �90 (0.602)Organic soil �858 (0.021) �800 (0.024) �832 (0.024) �581 (0.110) �832 (0.028)
Use levelHighb 0 0 0 0 0Medium 407 (0.024) 323 (0.050) 400 (0.021) 613 (0.008) 432 (0.015)Low �297 (0.538) �58 (0.904) �452 (0.348) 219 (0.787) �335 (0.498)Water drainage �13 (0.000) �13 (0.000) �13 (0.001) �13 (0.000) �13 (0.060)Gravel �0.6 (0.816) 3 (0.362) �0.6 (0.781) �5 (0.130) �1 (0.670)
Main variablesTrail position
Valleyb 0Mid-slope �755 (0.000)Ridge �1032 (0.000)Trail alignment �8 (0.000)
Use typeHorseb 0ATV �484 (0.184)Hike �697 (0.000)Bike �942 (0.333)Mixed �594 (0.000)Trail grade 13 (0.060)Constant 1497 2194 1419 1742 1439
Adjusted R2 0.10 0.21 0.14 0.14 0.10
a Unstandardized CSA coefficients, cm2.b Reference category for dummy coded categorical variables.c Two-tailed t-test significance.
N.D. Olive, J.L. Marion / Journal of Environmental Management 90 (2009) 1483–1493 1487
CSA when included with the control variables (Table 2). Post hoctesting revealed that the addition of control variables waterdrainage and soil texture diminishes the influence of trail grade.Results from these regression models aided in selecting contrastingrelationships between factors chosen for the models presented inTable 3.
Interrelationships between individual factors are revealed inTable 3, and provide an improved understanding of how variousassemblages of variables influence erosion. In general, the mainvariable effects are robust across models, though trail gradebecomes a significant factor (p< 0.01) in Models 1, 3, and 4.Although statistically significant, trail grade only explains anadditional 2% of CSA variation. However, a pronounced changeoccurs in the influence of use types when trail grade and trailposition are also included (Models 3 and 4). These models associateATV use with substantially higher levels of erosion than horseriding, in contrast to the lower predicted erosion in Table 2, Model4. Furthermore, with inclusion of all main variables in Model 4(Table 3), the predicted difference in erosion between hiking andhorse use increases from 697 (Table 2, Model 4) to 916 cm2, withhiking trails exhibiting significantly lower soil loss. The fully spec-ified Model 4 has a total explained variance of 32%. The effects ofboth trail alignment and trail grade on CSA remain statisticallysignificant (p< 0.01). The final model predicts that soil loss willincrease 6 cm2 for every degree trail slope alignment deviates fromthe contour, and 23 cm2 for every percent increase in trail grade.
3.2. Interaction effects
Post hoc analyses applied to investigate potential interactioneffects between trail grade and trail slope alignment angle revealedno interaction between product terms. Low values of slope
alignment were correlated with higher values of trail grade, thoughit is not uncommon for trails with low grades to also have low slopealignments. Visual examination of a curve estimation suggestedthat slope alignment angle was a driving influence on CSA soil lossthat was mediated by trail grade.
A similar post hoc analysis found a significant interaction effect(p< 0.01) between trail slope alignment angle and use type, butonly horse use effects persisted across models with other controland main variables. The interaction effect of slope alignment angleon horse trails was revealed strongly as �14 cm2 (p< 0.01) perdegree at the centered mean of slope alignment angle (47�), butwere not found with other use types. Use type contrasts (Table 4)provided by computation of new slope alignment angle values atone standard deviation above (74�) and below (20�) the centeredmean provided a revealing perspective of the level at which trailslope alignment interacts with use type. When slope alignment wasat one standard deviation above the mean, contrasts were strongonly between horse and hiker use (p¼ 0.07), though not significant.At mean slope alignment, the magnitude of difference increasedsignificantly for the hiker and mixed use categories. At one stan-dard deviation below the mean, the interaction between horse useand other types strengthened substantially, with significantlygreater effects from horse use than from hike (�1148, p< 0.01),bike (�1658, p< 0.05), and mixed (�594, p< 0.01) use types. Thesefindings indicate that multiplicative effects of trail slope alignmentcan be expected with horse use at high levels of slope alignment inrelation to hiking use, and as slope alignment angle decreases,differences are more pronounced with other uses. Stated moremeaningfully, horses cause significantly greater erosion on trailsaligned parallel to the landform slope than do hiking, biking, andmixed uses. Furthermore, p values indicated no significant differ-ence between the magnitude of horse impacts and ATV impact

Table 3Relational effects of control and main variables on Cross-Sectional Area soil loss.
Variables Regression modelsa
(1) (2) (3) (4)
Control variablesSoil texture
Clayb 0 0 0 0Sandy loam �303 (0.054)c �323 (0.034) �297 (0.058) �323 (0.034)Loam, silt loam �290 (0.079) �245 (0.134) �142 (0.396) �90 (0.573)Organic soil �755 (0.031) �748 (0.030) �626 (0.069) �587 (0.080)
Use levelHigh b 0 0 0 0Medium 374 (0.024) 348 (0.029) 194 (0.361) 213 (0.024)Low �90 (0.864) �206 (0.639) 439 (0.505) 323 (0.538)Water drainage �13 (0.000) �6 (0.004) �6 (0.009) �5 (0.000)Gravel 2 (0.542) 2 (0.465) �3 (0.372) �3 (0.816)
Main variablesTrail position
Valleyb 0 0 0 0Mid-slope �877 (0.000) �865 (0.000) �1026 (0.000) �1019 (0.000)Ridge �1071 (0.000) �1052 (0.000) �1032 (0.000) �1006 (0.000)Trail alignment �6 (0.000) �6 (0.000)
Use typeHorseb 0 0ATV 432 (0.218) 368 (0.279)Hike �903 (0.000) �916 (0.000)Bike �929 (0.303) �987 (0.262)Mixed �355 (0.033) �432 (0.008)Trail grade 19 (0.002) 13 (0.084) 32 (0.000) 23 (0.001)Constant 2200 2135 2355 2329
Adjusted R2 0.234 0.265 0.287 0.323
a Unstandardized CSA coefficients, cm2.b Reference category for dummy coded categorical variables.c Two-tailed t-test significance.
N.D. Olive, J.L. Marion / Journal of Environmental Management 90 (2009) 1483–14931488
contrasts, which suggested that ATVs also cause greater erosion onsuch ‘‘fall-line’’ trails than do hikers or bikers.
3.3. Magnitude of use type effects
The influence of use type on soil loss is further examined inTable 5, which presents a variety of CSA measures for each type ofuse. Testing of mean CSA values reveals that trails for which thepredominant use is hiking (121 cm2) are not significantly differentfrom mountain biking trails (37 cm2). These use types weresignificantly different from horse (965 cm2) and mixed use(928 cm2) trails, which were significantly different from ATV trails(1584 cm2). CSA measures from trail sample points were alsoextrapolated to each full trail segment to estimate total soil loss.The total estimated amount of soil loss in the sample was 8309 m3.The magnitude of type of use effects was clearly seen between
Table 4Use type contrasts across levels of trail alignment.
Use type contrasts for trail alignmenta
1 s above (x) 74� Mean (x) 47� 1 s below (x) 20�
Use typeHorseb 0 0 0Hike �406 (0.072)c �781 (0.000) �1148 (0.000)ATV 600 (0.135) 271 (0.339) �65 (0.880)Bike �665 (0.441) �1161 (0.074) �1658 (0.028)Mixed �45 (0.835) �316 (0.027) �594 (0.002)
a Unstandardized CSA coefficients, cm2.b Reference category for dummy coded categorical variables.c Two-tailed t-test significance.
horse and hiker uses, which had revealed significant differences(p< 0.01) consistently across the multivariate models.
The CSA m3/km provides a standardized measure, as does thepercentage of the total soil loss from the sample (Table 5). Soil losson horse trails was estimated at 94.9 m3/km, approximately eighttimes more than occurs on hiker trails (11.8 m3/km). In contrast,mountain biking, at 3.5 m3/km, has the lowest estimated level ofsoil loss, about 30% as much as on hiking trails. This finding reflectsa limited mileage of trails where mountain biking was thepredominant use (3.1 km), and these trails received low tomoderate levels of use. While ATV trails had an estimated 143.9 m3
of soil loss per km, the highest of any category, recall that differencewas only significantly higher than horse use when use level was notconsidered. As a percentage of aggregate erosion, erosion fromhorse trails (50.5%) accounts for the majority of soil loss. Mixed usetrails, for which the predominant use is horse riding, account for35.5% of aggregate soil loss, followed by ATVs (8.0%), hikers (5.9%)and mountain bikes (0.1%).
4. Discussion
This research developed and applied a point-sampling methodfor assessing trail conditions on a large (126 km) randomly selectedsample of the BSFNR trail system (526 km). The sample wasrepresentative of the park’s various types and amounts of uses,topographic positions, soil types, and levels of trail design andmaintenance. The new Variable CSA method provided an efficientprocedure for assessing soil loss along trails and communicatingresults in a variety of meaningful measures. In comparison toprevious studies employing more complex and time-consumingCSA variations (Burde and Renfro, 1986; Tinsley and Fish, 1985;

Table 5Mean and estimated total CSA soil loss by use type.
CSA Use type
Horse Hiker Bike ATV Mixed All types
Mean (cm2)a 965� 1462 121� 441 37� 401 1584� 7433 928� 2532 673� 92m3/km 94.9 11.8 3.5 143.9 90.2 65.8Sum (m3) 4194 492 11 662 2950 8309Total sum (%) 50.5 5.9 0.1 8.0 35.5 100
Superscript numerals refer to results from the LSD multiple comparison test for differences between means. Mean values with the same numeral are not significantly different(p< 0.05).
a Mean values with 95% confidence intervals. ANOVA: F¼ 23.8, p< 0.01.
N.D. Olive, J.L. Marion / Journal of Environmental Management 90 (2009) 1483–1493 1489
Yoda and Watanabe, 2000), the Variable CSA method permitted theefficient measurement of soil loss using a point-sampling methodemploying fixed-intervals and a random start so that representa-tive data could be collected. The large dataset permitted theextensive use of regression modeling to investigate the type andextent of influence by use-related, environmental and managerialfactors. The representative sampling schemes employed forselecting trail segments and transects also permitted the extrapo-lation of CSA soil loss measures to volume estimates of aggregatesoil loss for trail segments, the sample, and the entire BSFNR trailsystem. Various standardized measures (mean, m3/km, %) can alsobe derived for making objective comparisons of soil loss across usetypes, trails, or protected areas.
Study findings reveal a trail system with substantial soil erosionproblems, with estimated soil loss of 8309 m3 for the sample and34,687 m3 for the entire trail system. For perspective, theseamounts equate to about 1093 and 4564 single-axel dump trucks(7.6 m3 capacity) of soil for the sample and trail system, respec-tively. These are considered conservative estimates of soil loss asprocedures omitted CSA measures on transects with <2.5 cm ofincision and sought to exclude erosion from historic trail/road usesand trail construction. This substantial loss of soil is considered anessentially irreversible form of recreational impact as the soilcannot be returned or easily replaced. This level of soil loss also hashigh ecological significance due to its potential to threaten waterquality (Fig. 2), and high social/human significance due to increasedhiking difficulty and threats to visitor safety and the aestheticquality of the park’s trail resources. The authors are aware of noother studies that have extrapolated representative soil loss
Fig. 2. Soil loss from this heavily used horse trail drains directly into a small stream.Field staff noted this was a common occurrence.
estimates to a park-wide trail system so comparisons to otherprotected natural areas are not possible.
4.1. Use-related variables
Multivariate regression analysis modeling was directed atimproving understanding of the relative influence of and rela-tionships between various use-related, environmental and mana-gerial variables. Results of this research include importantimplications for trail management, particularly in the design,maintenance, and type of use designations. Type of use was foundto be a substantially greater determinant of trail degradation thanamount of use. As shown in the fully specified regression model(Table 3, Model 4), the range of values for CSA coefficients acrossuse levels is much lower than for type of use and several othervariables. Furthermore, the substantial influence of these othervariables in the model has so altered the ‘‘apparent’’ influence ofuse level that the resulting coefficients suggest that high use trailshave the least erosion. The coefficients for influential and statisti-cally significant variables can be meaningfully interpreted inmultivariate analyses; coefficients for less influential variables arefrequently meaningless. Further, this finding is consistent withother studies that have reported amount of use to be a poorpredictor of soil loss on trails (Cole, 1983; Dale and Weaver, 1974;Dixon et al., 2004; Farrell and Marion, 2002).
In comparison, the wide range in coefficients for type of use,along with their significance, suggests that managers would be farmore successful in limiting soil loss by focusing managementattention on trail type of use designations. These regression modelsand the extrapolated aggregate soil loss estimates presented inTable 5 reveal that ATV and horse use are significantly greatercontributors to soil loss than are hiking and mountain biking uses.These data are not presented to apportion blame to specific usetypes, rather to emphasize that managers seeking to accommodatehorse and ATV uses should acknowledge their higher potential foreroding soil and incorporate improved trail design, construction,maintenance and visitor use management practices to ensure thatthe impacts of such uses are minimal and acceptable.
Additional research on ATV effects is needed to verify thesefindings. One limitation of this study is that ATV use is more recentthan horse and hiker use at BSFNR, and may simply be occurring ontrails and roads that were already substantially eroded. Additionalempirical studies in areas with extensive ATV trail systems andexperimental design studies are needed to extend knowledge ofATV impacts and their management. Given the rapid growth in thisuse type such research is critical to the development of bestmanagement practices. At BSFNR, trails are not currently desig-nated or maintained for ATV use and field staff noted widespreadillegal use on non-motorized trails. Given the greater speed andrange of these vehicles, and their substantial potential for erodingsoil due to engine torque and knobby tires, managers of protectednatural areas should be cautious in allowing their use untilsustainable trail alignments are identified, developed and

N.D. Olive, J.L. Marion / Journal of Environmental Management 90 (2009) 1483–14931490
hardened, and adequate maintenance, monitoring, and visitormanagement programs are implemented to ensure unacceptableresource impacts do not occur.
4.2. Environmental variables
Among environmental attributes, trail position was the stron-gest and most robust determinant of soil loss across models. Valleypositions were significantly more eroded than mid-slope and ridgetrails. However, this result is likely influenced by a combination ofperiodic flooding-related erosion of trail substrates and of being ina lower watershed position where water runoff volumes and ratesare highest. Some implications of these results are that: (1) trailplacement in floodplains should be avoided, (2) valley positionedtrails should be located above frequent flood-levels and designedwith side-hill alignments that can be easily drained, and (3) moreerosive types of uses (e.g., horse and ATV use) should be restrictedfrom riparian area trails where possible.
Trail alignment to the landform slope as a determinant of soilloss was also identified as a major and robust influence. This vari-able has been rarely mentioned in the research and trail mainte-nance literature (see Leung and Marion, 1996) yet this researchrevealed it to be a better determinant of soil loss than trail grade(compare Models 1 & 2, Table 3). Trails routed across slopes (closerto the contour) have significantly less soil loss because the terrainon one side of the trail is always lower, allowing easier treaddrainage by outsloped treads, water bars, drainage dips or gradereversals. In contrast, it is often impossible to remove water fromthe incised treads of ‘‘fall-line’’ trails aligned with landform slopes.Many existing formal and informal trails are aligned with landformslopes because little or no tread construction was needed to createthe trail; many were simply ‘‘walked in’’ by trail users. These resultsindicate that while construction costs are greater for side-hill(bench-constructed) trails, such alignments are inherently moresustainable – facilitating water drainage and suffering less erosionover time when properly maintained. The most sustainable trailsemploy side-hill designs with periodic grade reversals to removeflowing water; reliance on tread outsloping, water bars, or drainagedips to remove water require continual maintenance to maintaintheir efficacy (Birchard and Proudman, 2000; Marion and Leung,2004).
The multiplicative interaction effect of slope alignment anglewith horse use reveals the need to maintain a consistently highalignment angle (e.g.,>48�) for trails receiving horse use, as it morethan doubles the additive alignment effects on trail erosion. Horsetrails with segment slope alignments at 47� or less should bemonitored closely, frequently maintained, and relocated or re-designated for another use if erosion cannot be abated. Based onthe ATV coefficients in Table 4 these same findings and implicationsalso apply to ATV trails.
Other studies and trail maintenance books have long empha-sized, but rarely quantified, the influence of trail grade on soilerosion (Birkby, 1996; Bratton et al., 1979; Hesselbarth andVachowski, 2000; Tinsley and Fish, 1985). As determined by thebest regression model, CSA increases 23 cm2 for every 1% increasein trail grade (Table 3, Model 4). This estimate is an approximationof the influence of grade that incorrectly suggests a linear rela-tionship. Research on forest roads show that erosion rates increasewith increasing slope, rising exponentially at the highest grades(Dissmeyer and Foster, 1984; Liddle, 1997).
Regression modeling and post hoc testing revealed trail grade tohave some complex interrelationships with other variables. Forexample, results show that water drainage and soil texturediminished the effect of trail grade. Trails can have steeper gradeswithout suffering significant erosion if tread soils have heteroge-neous textures, such as loams, particularly when substantial
amounts of rock are also present (Bryan, 1977; Welch and Churchill,1986). Adequate densities of functional tread drainage featuresmust also be present. While Post Hoc testing found no significantinteraction between trail grade and slope alignment angle thesevariables are correlated: ‘‘fall-line’’ trails often have steeper grades.The addition of use type to the regression model strengthened theinfluence of trail grade (compare models 1 and 3, Table 3); possiblythe inclusion of trail grade accounts for higher erosion rates onsteeper horse and ATV trails. The influence of trail grade is retained(though diminished) even with the addition of trail slope alignmentangle (compare models 3 and 4, Table 3); fall-line trails in flatterterrain have limited erosion potential in contrast to fall-line trails insteep terrain. These empirical data support an earlier speculationby Leung and Marion (1996): ‘‘the importance of slope alignmentangle increases in its significance as trail grade increases.’’
All regression models found clay soil textures to have greatersoil loss than the other soil types, particularly in comparison tosandy loam and organic soils (Tables 2 and 3). Clay is a homoge-neous-textured soil, which is more prone to erosion than soils witha wide range of particle sizes, such as loams (Hammitt and Cole,1998; Liddle, 1997). Clay soils also compact tightly and causegreater runoff than other soil textures. Organic soils are quicklyeroded from most trail treads, except in flatter terrain and depo-sitional environments that receive eroded soils.
4.3. Managerial variables
Managers do have control over attributes addressed underenvironmental variables (e.g., trail slope alignment angle andgrade), but only when designing new trails or relocating segmentsof existing trails. On pre-existing trails, managers have greatercontrol over attributes such as tread drainage and applying gravelto reduce erosion. Water drainage remained a highly significantdeterminant of soil loss in all but one regression model, indicatingthe importance of this management variable. One reasoncontributing to the significant amount of soil loss on BSFNR trailswas the relative paucity of tread drainage features. For example,drainage of water from the trail within 3 m in an up-hill traildirection was rated as 0% for 51% of the sample points. The pres-ence and distance to human-constructed tread drainage features(water bars or drainage dips) were also assessed in an up-hilldirection from each sample point (see Section 2). These data wereunusable in regression equations because only 59 drainagefeatures were found; 768 (93%) of the sample points had nodrainage feature placed within 30.5 m. Regardless, an analysis ofCSA soil loss by proximity to drainage features was statisticallysignificant (ANOVA F¼ 4.2, p< 0.05), with mean CSA of 361 cm2
for sample points with a drainage feature within 7.6 m in an up-hilldirection, 1013 cm2 for points with a feature within 7.7–15.2 m,and 1626 cm2 for points with a feature within 15.3–22.9 m. Clearlythese features are highly effective if placed in sufficient density(which varies with trail grade) and periodically cleaned to main-tain their effectiveness.
Gravel application was not a significant determinant of soil lossin any of the regression equations. This result is likely due to therelative rarity of gravel application; only 36 of the 369 samplepoints (10%) included in these analyses had gravel coverage of 50%or more. This unexpected finding was investigated further in thestudy’s research report after selecting only cases where gravelcover was present (N¼ 162) (Marion and Olive, 2006). Trail gradewas included in the analysis to examine the extent to which gravellimits soil loss with increasing grade. Fig. 3 illustrates the results ofan ANOVA test (General Linear Model) that revealed the model andboth indicators to be highly significant (F (model)¼ 6.2, p< 0.01; F(gravel)¼ 9.9, p< 0.01; F (grade)¼ 13.3, p< 0.01) with an insig-nificant interaction term. Trails with little or no visible gravel cover

Trail Grade
4000
3500
3000
2500
2000
1500
1000
500
0
CSA
(cm
2) E
stim
ated
Mar
gina
l Mea
ns
61 - 10031 - 601 - 30
Gravel Cover
12 - 17 18 - 486 - 110 - 5
Fig. 3. The influence of gravel application and trail grade on CSA soil loss (source:Marion and Olive, 2006).
N.D. Olive, J.L. Marion / Journal of Environmental Management 90 (2009) 1483–1493 1491
have significantly greater erosion, particularly at grades above 11%.Graveling is most effective on trails with grades less than 12%,particularly for trails with 61–100% gravel coverage. Anotherimportant implication is that well-graveled trails reduced soil losson the steepest trails (18–48%) by approximately 75% (Fig. 3).
4.4. Research needs
Additional research is needed to investigate methods for stan-dardizing assessments of soil loss when permanent transects arenot employed. This is particularly critical when the objective of soilloss measures is to monitor change over time. Differences injudgments for establishing transect lines are likely to be moreconsistent within surveys than between surveys. Improveddiagrams, more detailed procedures, and photos are needed tominimize subjectivity involved with fixing transect endpoints andheight. Investigations of the accuracy, precision and efficiency ofalternative CSA procedures are also needed. For example, does thesmall gain in efficiency associated with the Variable CSA methodcome at a cost in accuracy or precision?
Inclusion of the trail slope alignment indicator is recommendedin future studies investigating soil loss on recreational trails androads. Its relationship to trail grade and other variables requiresfurther examination across the entire range of slope alignmentangles. Some significant relationships revealed in this study alsoprovide a basis for future experimental designs seeking to inves-tigate the complex interplay between influential factors of soil loss.While this study demonstrated the importance of trail slopealignment angle, its results provide only general guidance indetermining the point at which alignment angles become unac-ceptably low. Furthermore, how does guidance to avoid low trailslope alignment angles (e.g., less than 20�), compare to otherguidance such as the ‘‘Half Rule’’ proposed by the InternationalMountain Biking Association (IMBA, 2004)? This rule states thattrail grade should never exceed half of the landform grade to keepwater from diverting down the tread.
The substantial and continuing increases in mountain bikingand ATV riding require additional research attention to understandthe unique impacts associated with these relatively new activities.Such research can provide new knowledge to develop bestmanagement practices for the design, construction, and mainte-nance of trails able to sustain these uses with minimal resourceimpacts.
It is also useful to consider why the best regression model (Table3, model 4) explains only 32% of the variation in CSA. While wesought to accurately measure and incorporate a variety of relevantenvironmental, use-related, and managerial variables into theregression analyses it is helpful to speculate on what future studiesmight do to increase their explanatory power. In our judgment,potentially significant variables not accounted for are the relatedfactors of trail age and amount and efficacy of trail maintenancework. For example, a poorly designed trail that is relatively new orthat has been consistently well-maintained would not showsubstantial soil loss, while a well-designed trail that is old and/orhas not been maintained over time might show substantial erosion.Improved measurements of factors included in this study could alsohelp, particularly in assessing the amount of use and changes inamount or type of use over time. Applications of experimentaldesigns capable of evaluating the relative influence of a variety ofinfluential variables are likely to have greater success, though thelarge number of variables that require evaluation present signifi-cant changes to this approach as well.
Finally, research on the fate of eroded soil from trails is alsoneeded, particularly in riparian environments. How much of thesoil eroded from trails reaches water bodies and what is the nature,extent and ecological significance of its impact to aquaticorganisms?
5. Conclusion
A trail system, that facilitates access to remote destinations,provides safe, high quality recreational experiences, and concen-trates traffic on durable treads maintained to minimize resourcedegradation can only result from professional planning andmanagement. This research sought to inform such management byinvestigating the influence of use-related, environmental andmanagerial factors on soil loss on recreational trails and roads atBSFNR. Substantial tread erosion was documented on trails wherehorse and ATV uses are predominant while hiking and mountainbiking trails are generally in good condition. The potential transportof eroded soils into park waterways and the potential for negativesedimentation and turbidity impacts to federally listed endangeredmussels, trout populations, and other aquatic organisms are criticalmanagement concerns.
A complex interplay of factors, both casual and non-causal, hasbeen suggested by previous research as influencing soil erosion ontrails. Regression modeling of environmental, managerial, and use-related influences revealed that trail position, trail slope alignmentangle, grade, water drainage, and type of use are all significantlyinfluential variables in the best trail soil loss model. Improvedunderstanding and insights regarding the relative influence ofthese variables permits the selection of more effective trailmanagement actions, and can be used to justify difficult decisionsor to garner staffing and funding support within land managementagencies. For example, these study results suggest that trail erosioncan be minimized by avoiding ‘‘fall-line’’ alignments, steep grades,and valley-bottom alignments near streams, by installing andmaintaining adequate densities of tread drainage features, applyinggravel to harden treads, and by reducing horse and ATV use orrestricting them to more resistant routes. Surveys of existing trailalignments can identify segments or trails requiring reroutes withimproved alignments. It is important to recognize that some trailsegments cannot be maintained to prevent resource degradationand that substantial one-time investment in realignments will bemore than compensated by avoiding substantial soil loss and long-term savings in repeated, and often unsuccessful, maintenancework.
A secondary objective of this research was the development andapplication of a more efficient Variable CSA method for assessing

N.D. Olive, J.L. Marion / Journal of Environmental Management 90 (2009) 1483–14931492
soil loss. Though additional research is needed to evaluate itsaccuracy, precision and efficiency, the Variable CSA methodpermitted incorporation of CSA measures in a representativesampling scheme that included 821 trail transects. The efficiency ofcollecting soil loss data over such a large sample was increased byomitting CSA measures at minimally eroded transects (inci-sion< 2.5 cm), reducing the number of assessed transects to 375.The variety of soil loss measures derived from the Variable CSAmethod, including extrapolated trail-wide soil loss estimates,permit an objective quantification of soil erosion on recreationaltrails and roads. Such data support relational analyses, as presentedin this paper, to increase understanding of trail degradation and therelative importance of causal and influential factors.
The Variable CSA method also efficiently yields data applicableto the long-term monitoring of trail erosion and contributes to animproved understanding and communication of trail infrastructurecondition. This is particularly important, as backcountry trails areoften ‘‘out of sight and mind’’ for policy makers. Incorporation oftrail condition indicators into carrying capacity planning andmanagement decision making frameworks such as the VisitorExperience and Resource Protection (VERP) and Limits of Accept-able Change (LAC) can ensure that land managers monitor trailconditions for comparison to standards of quality. VERP and LACrequire implementation of corrective actions when standards areviolated, assisting managers in meeting legislative mandates bymaintaining the natural and recreational integrity of their trailsystem infrastructure. As popular demand for trail experiencesincreases and funds for the proper design, construction, andmaintenance of trail resources remain in competition with othermanagement budgetary needs, it is increasingly important toprovide an objective and effective voice for trail conditions.
Acknowledgements
This paper was derived from the Master of Education research ofthe first author at The University of Georgia. Scholarly review andassistance in conducting the study and preparing this manuscriptwas received by the student’s graduate Committee that includedMichael Tarrant, Jeff Marion, Diane Samdahl, and Kenneth Cordell.We especially acknowledge and thank Tomas McNulty for hisstatistical consulting guidance in conducting the regressionmodeling. Funding support was received from the National ParkService, Big South Fork National River and Recreation Area.
References
Birchard, W., Proudman, B., 2000. Appalachian trail design: construction andmaintenance. In: Appalachian Trail Conference. Harpers Ferry, WV.
Birkby, R.C., 1996. Lightly on the Land: The SCA Trail-building and MaintenanceManual. The Mountaineers, Seattle, WA.
Bratton, S.P., Hickler, M.G., Graves, J.H., 1979. Trail erosion patterns in Great SmokyMountains National Park. Environmental Management 3, 431–445.
Burde, J.H., Renfro, J.R., 1986. Use impacts on the Appalachian Trail. In: Proceedingsof the National Wilderness Research Conference: Current Research, GeneralTechnical Report INT-212. USDA Forest Service, Intermountain Research Station,Ogden, UT, pp. 138–143.
Bryan, R.B., 1977. The influence of soil properties on degradation of mountain hikingtrails at Grovelsjon. Geografiska Annaler 59A, 49–65.
Cole, D.N., 1983. Assessing and monitoring backcountry trail conditions. ResearchPaper INT-303. USDA Forest Service, Intermountain Forest and Range Experi-ment Station, Ogden, UT.
Cole, D.N., 1989. Low-impact recreational practices for wilderness and backcountry.General Technical Report INT-265. USDA Forest Service, IntermountainResearch Station, Ogden, UT.
Cole, D.N., Spildie, D.R., 1998. Hiker, horse, and llama trampling effects on nativevegetation in Montana, USA. Journal of Environmental Management 53, 61–71.
Cordell, K.H., Overdevest, C., 2001. Footprints on the Land: an Assessment ofDemographic Trends and the Future of Natural Lands in the United States.Sagamore Publishing, Champaign, IL.
Dale, D., Weaver, T., 1974. Trampling effects on vegetation of the trail corridors ofnorth Rocky Mountain Forests. Journal of Applied Ecology 11, 767–772.
Deluca, T.H., Patterson, W.A., Freimund, W.A., Cole, D.N., 1998. Influence of llamas,horses, and hikers on soil erosion from established recreation trails in westernMontana, USA. Environmental Management 22, 255–262.
Dissmeyer, G.E., Foster, G.R., 1984. A Guide for Predicting Sheet and Rill Erosion onForest Land, Technical Publication R8 TP 6. USDA Forest Service.
Dixon, G., Hawes, M., McPherson, G., 2004. Monitoring and modelling walking trackimpacts in the Tasmanian Wilderness World Heritage Area, Australia. Journal ofEnvironmental Management 71, 305–320.
Farrell, T.A., Marion, J.L., 2002. Trail impacts and trail impact management related toecotourism visitation at Torres del Paine National Park, Chile. Leisure/Loisir:Journal of the Canadian Association for Leisure Studies 26, 31–59.
Foth, H.D., 1990. Fundamentals of Soil Science, eighth ed. John Wiley & Sons, NewYork.
Hall, C.N., Kuss, F.R., 1989. Vegetation alteration along trails in Shenandoah NationalPark,Virginia. Biological Conservation 48, 211–227.
Hill, W., Pickering, C.M., 2006. Vegetation associated with different walking tracktypes in the Kosciuszko alpine area, Australia. Journal of EnvironmentalManagement 78, 24–34.
Hammitt, W.E., Cole, D.N., 1998. Wildland Recreation: Ecology and Management.John Wiley and Sons, New York.
Helgath, S.F., 1975. Trail deterioration in the Selway-Bitterroot Wilderness. ResearchNote INT-193. USDA Forest Service, Intermountain Research Station, Ogden, UT.
Hesselbarth, W., Vachowski, B., 2000. Trail construction and maintenance notebook.Rpt No. 4E42A25-TN. Missoula, MT: USDA Forest Service, Technology andDevelopment Program. In: Hill, W., Pickering, C.M. (Eds.), Vegetation Associatedwith Different Walking Track Types in the Kosciuszko Alpine Area, Australia.Journal of Environmental Management 78, 24–34. 2006.
IMBA, 2004. Trail Solutions: IMBA’s Guide to Building Sweet Singletrack. TheInternational Mountain Bicycling Association, Boulder, CO.
Leung, Y.-F., Marion, J.L., 1996. Trail degradation as influenced by environmental factors:a state-of-knowledge review. Journal of Soil and Water Conservation 51, 130–136.
Leung, Y.-F., Marion, J.L., 1999a. The influence of sampling interval on the accuracyof trail impact assessment. Landscape and Urban Planning 43, 167–179.
Leung, Y.-F., Marion, J.L., 1999b. Assessing trail conditions in protected areas:application of a problem assessment method in Great Smoky MountainsNational Park. U.S.A. Environmental Conservation 26, 270–279.
Leung, Y.-F., Marion, J.L., 2000. Recreational impacts in wilderness: a state-of-knowledge review. In: Cole, D.N., McCool, S.F., Borrie, W.T., O’Loughlin, J. (Eds.),Proceedings: Wilderness Science in a Time of Change. Wilderness Ecosystems,Threats, and Management. May 23–27, 1999, Missoula, MT, vol. 5. USDA ForestService, Rocky Mountain Research Station, Ogden, UT, pp. 23–48. ProceedingsRMRS-P-15-Vol-5.
Liddle, M.J., 1997. Recreation Ecology: The Ecological Impact of Outdoor Recreationand Ecotourism. Chapman & Hall, London.
Marion, J.L., 1994. An assessment of trail conditions in Great Smoky MountainsNational Park. Research/Resources Management Report. USDI National ParkService, Southeast Region, Atlanta, GA.
Marion, J.L., Leung, Y.-F., 2001. Trail resource impacts and an examination of alter-native assessment techniques. Journal of Park and Recreation Administration19, 24–25.
Marion, J.L., Leung, Y.-F., 2004. Environmentally sustainable trail management. In:Buckley, R. (Ed.), Environmental Impact of Tourism. CABI Publishing, Cam-bridge, MA, pp. 229–244.
Marion, J.L., Olive, N., 2006. Assessing and understanding trail degradation: resultsfrom big south fork national river and recreational area. Research/ResourcesManagement Report. USDI National Park Service, Big South Fork National Riverand Recreation Area, Onieda, TN.
Marion, J.L., Wimpey, J., 2007. Environmental impacts of mountain biking: sciencereview and best practices. In: Webber, Pete (Ed.), Managing Mountain Biking.International Mountain Biking Association, Boulder, CO, pp. 94–111.
Marion, J.L., Roggenbuck, J.W., Manning, R.E., 1993. Problems and practices inbackcountry recreation management: a survey of National Park ServiceManagers. Natural Resources Report NPS/NRVT/NRR-93/12. USDI National ParkService, Denver, CO.
Meyer, K.G., 2002. Managing degraded off-highway vehicle trails in wet, unstable,and sensitive environments. Rpt No. 2E22A68. USDA Forest Service, Technologyand Development Program, Missoula, MT.
Fork National River and Recreation Area: Kentucky/Tennessee National ParkService, 2003. Big South. Supplemental Draft General Management Plan andEnvironmental Impact Statement. USDI National Park Service, Oneida, TN.
Newsome, D.E., Cole, D.N., Marion, J.L., 2004. Environmental impacts associatedwith recreational horse riding. Environmental Impact of Tourism. CABIPublishing, Cambridge, MA, pp. 61–82.
Newsome, D., Milewski, A., Phillips, N., Annear, R., 2002. Effects of horse riding onNational Parks and other natural ecosystems in Australia: implications formanagement. Journal of Ecotourism 1, 52–74.
Noe, F.P., Hammitt, W.E., Bixler, R.D., 1997. Park user perceptions of resource and useimpacts under varied situations in national parks. Journal of EnvironmentalManagement 49, 323–336.
Summer, R.M., 1980. Impact of horse traffic on trails in Rocky Mountains NationalPark. Journal of Soil and Water Conservation 35, 85–87.
Sun, D., Liddle, M.J., 1993. A survey of trampling effects of vegetation and soil ineight tropical and subtropical sites. Environmental Management 17, 497–510.
Thurston, E., Reader, R.J., 2001. Impacts of experimentally applied mountain bikingand hiking on vegetation and soil of a deciduous forest. EnvironmentalManagement 27, 397–409.

N.D. Olive, J.L. Marion / Journal of Environmental Management 90 (2009) 1483–1493 1493
Tinsley, B.E., Fish, E.B., 1985. Evaluation of trail erosion in Guadalupe MountainsNational Park, Texas. Landscape Planning 12, 29–47.
Welch, D.M., Churchill, J., 1986. Hiking Trail Conditions in Pangnirtung Pass, 1984,Baffin Island, Canada. Parks Canada Report, Ottawa, Canada.
Whinam, J., Comfort, M., 1996. The impact of commercial horse riding on sub-alpineenvironments at Cradle Mountain, Tasmania, Australia. Journal of Environ-mental Management 47, 61–70.
Wilson, J.P., Seney, J.P., 1994. Erosional impact of hikers, horses, motorcycles, andoff-road bicycles on mountain trails of Montana. Mountain Research andDevelopment 14, 77–88.
Yoda, A., Watanabe, T., 2000. Erosion of mountain hiking trail over a seven-yearperiod in Daisetsuzan National Park, Central Hokkaido, Japan. In: Proceedings ofthe National Wilderness Research Conference, RMRS-P-15-VOL-5. USDA ForestService, Rocky Mountain Research Station, Ogden, UT, pp. 1172–1178.