the influence of climate and management on surface soil ... · pdf fileplant available...
TRANSCRIPT
THE INFLUENCE OF CLIMATE AND MANAGEMENT ON SURFACE SOIL HEALTH WITHIN THE
INLAND PACIFIC NORTHWEST
By
Jason G. Morrow
A thesis submitted in partial fulfillment of the requirements for the degree of
MASTER OF SCIENCE IN SOIL SCIENCE
WASHINGTON STATE UNIVERSITY Department of Crop and Soil Science
August 2014
© Copyright by Jason G. Morrow, 2014 All Rights Reserved
ii
To the Faculty of Washington State University:
The members of the Committee appointed to examine the thesis of Jason G. Morrow find it
satisfactory and recommend that it be accepted.
___________________________________ David R. Huggins, Ph.D., Chair
___________________________________ Lynne Carpenter-Boggs, Ph.D.
___________________________________ John P. Reganold, Ph.D.

iii
ACKNOWLEDGEMENT
I would like to thank Dr. Dave Huggins, Dr. Lynne Carpenter-Boggs, and Dr. John
Reganold for their support throughout the course of this research; in their own way they each
offered valuable guidance that was essential to the completion of this research. Also, I would
like to acknowledge the site managers associated with the research stations comprising this
study: Jodi Johnson-Maynard (Kambitsch Farm; Genesee, ID), Hero Gollany (Pendleton, OR),
Stephen Machado (Moro, OR), and Hall Collins (Prosser, WA).
I would also like to thank Dr. Jeff Smith for the use of his lab in conducting many of the
analyses critical to this study. Dr. Stewart Higgins and Debbie Bikfasy also offered valuable
guidance throughout much of the laboratory work. John Morse and Jack Niedbala made much
of the laboratory work more manageable with their time and effort. And, of course, the very
valuable moral support of my family, friends, and lab mates helped to keep me going during the
more challenging times.
Last, I would like to acknowledge Regional Approaches to Climate Change (REACCH),
the grant that made this all possible.
iv
THE INFLUENCE OF CLIMATE AND MANAGEMENT ON SURFACE SOIL HEALTH WITHIN THE
INLAND PACIFIC NORTHWEST
ABSTRACT
by Jason G. Morrow, M.S.
Washington State University
August 2014
Chair: David R. Huggins
Surface soils influence ecosystem health through their role in nutrient cycling and
decomposition, gas exchange, water infiltration, and erosion. Soil organic matter (SOM) is
critical to soil functioning and subsequently to soil and ecosystem health. Across four dryland
sites and one irrigated site within the inland Pacific Northwest (PNW), the objectives were to
assess the influence of climate, tillage, and cropping intensity on surface soil health by
measuring soil C and N properties related to SOM as well as nutrient availability (NO3-, NH4
+, Ca,
Mg, P, K, S, Mn, Fe, Zn, B, Cu) quantified by PRSTM probes (Western Ag Innovations, Saskatoon,
Canada).
A multivariate regression of mean annual temperature (MAT) and precipitation (MAP),
tillage, and cropping intensity revealed that MAP explained 57% of soil organic carbon (SOC)
variability and 69% of total soil N variability. When MAP was removed from the model, MAT
explained 42% and 49%, respectively, of SOC and total N variability. Both the hydrolyzable and
non-hydrolyzable fractions of SOC were equally sensitive to climate, indicating no relationship
between chemical recalcitrance and climate sensitivity. Permanganate oxidizable carbon
(POXC) was representative of SOM stabilization, while one-day carbon mineralization was
v
representative of microbial activity and SOM mineralization. Both POXC and mineralization
potential may be increased by cropping diversification, and stabilized inputs, such as compost,
along with no-till, may increase POXC.
An increase in MAT across the region was associated with a decrease in potential
nitrogen mineralization (PNM) (r = -0.73), potential denitrification (PDR) (r = -0.66), and basal
denitrification (BDR) (r = -0.34). An increase in MAP was associated with an increase in PNM (r
= 0.60) and PDR (r = 0.55), but was not related to BDR. Tillage intensity was correlated with
PNM (r = -0.32), PDR (r = 0.32), and BDR (r = 0.32), whereas cropping intensity was correlated
only with PNM (r = 0.40). Plant available nutrients displayed varying correlations with soil C and
N properties, management, and climate factors. Overall, POXC and carbon mineralization were
the most important indicators of surface soil health.
vi
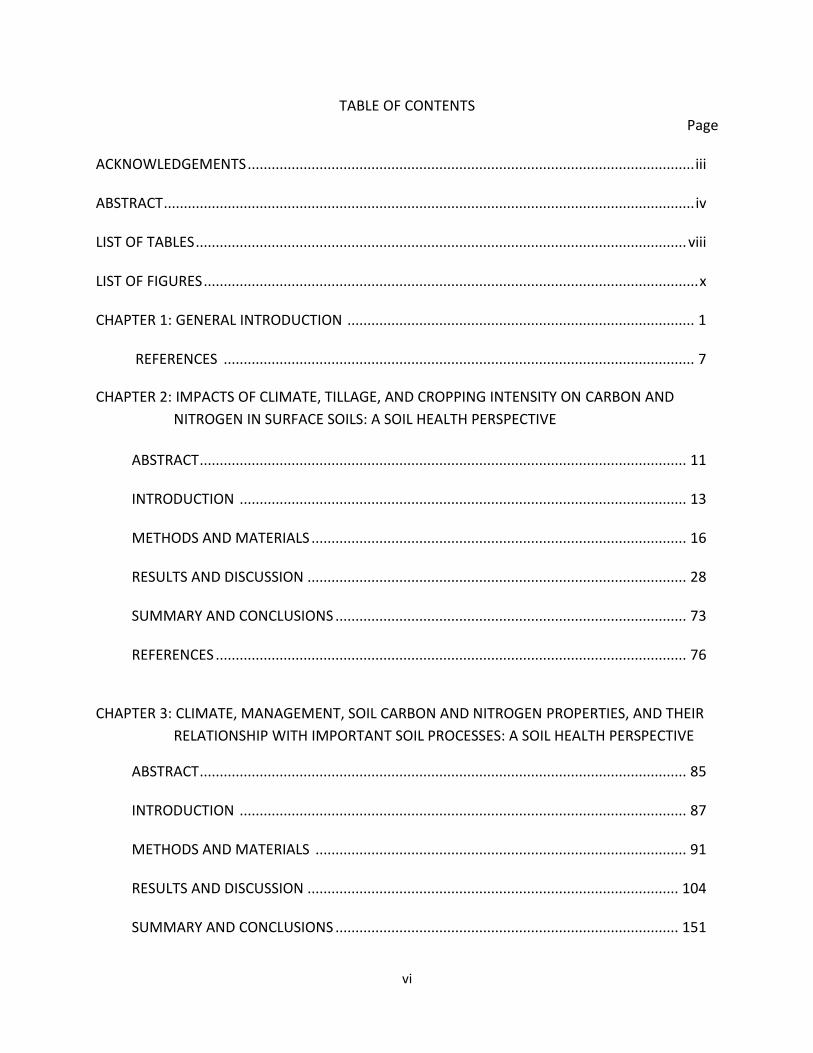
TABLE OF CONTENTS Page
ACKNOWLEDGEMENTS ................................................................................................................ iii ABSTRACT ..................................................................................................................................... iv LIST OF TABLES ........................................................................................................................... viii LIST OF FIGURES ............................................................................................................................ x CHAPTER 1: GENERAL INTRODUCTION ....................................................................................... 1 REFERENCES ...................................................................................................................... 7
CHAPTER 2: IMPACTS OF CLIMATE, TILLAGE, AND CROPPING INTENSITY ON CARBON AND
NITROGEN IN SURFACE SOILS: A SOIL HEALTH PERSPECTIVE
ABSTRACT .......................................................................................................................... 11
INTRODUCTION ................................................................................................................ 13 METHODS AND MATERIALS .............................................................................................. 16 RESULTS AND DISCUSSION ............................................................................................... 28 SUMMARY AND CONCLUSIONS ........................................................................................ 73 REFERENCES ...................................................................................................................... 76 CHAPTER 3: CLIMATE, MANAGEMENT, SOIL CARBON AND NITROGEN PROPERTIES, AND THEIR
RELATIONSHIP WITH IMPORTANT SOIL PROCESSES: A SOIL HEALTH PERSPECTIVE
ABSTRACT .......................................................................................................................... 85
INTRODUCTION ................................................................................................................ 87 METHODS AND MATERIALS ............................................................................................. 91 RESULTS AND DISCUSSION ............................................................................................. 104 SUMMARY AND CONCLUSIONS ...................................................................................... 151
vii
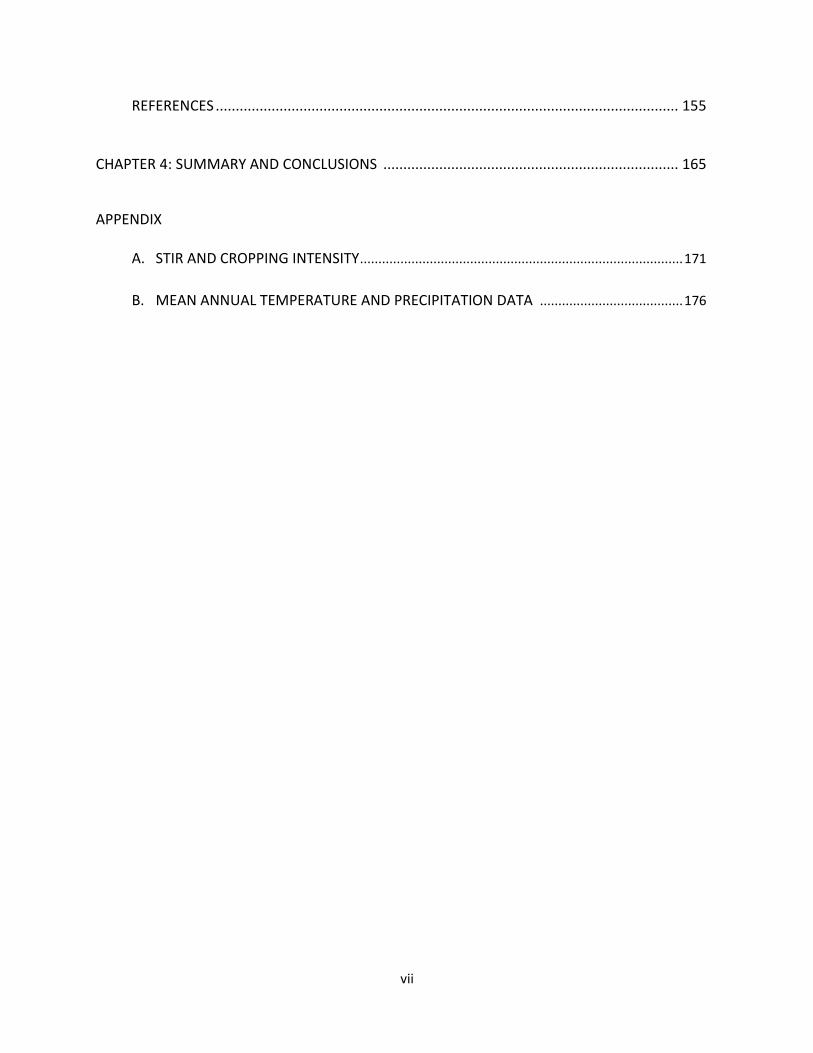
REFERENCES .................................................................................................................... 155 CHAPTER 4: SUMMARY AND CONCLUSIONS .......................................................................... 165
APPENDIX
A. STIR AND CROPPING INTENSITY ........................................................................................ 171
B. MEAN ANNUAL TEMPERATURE AND PRECIPITATION DATA ....................................... 176
viii
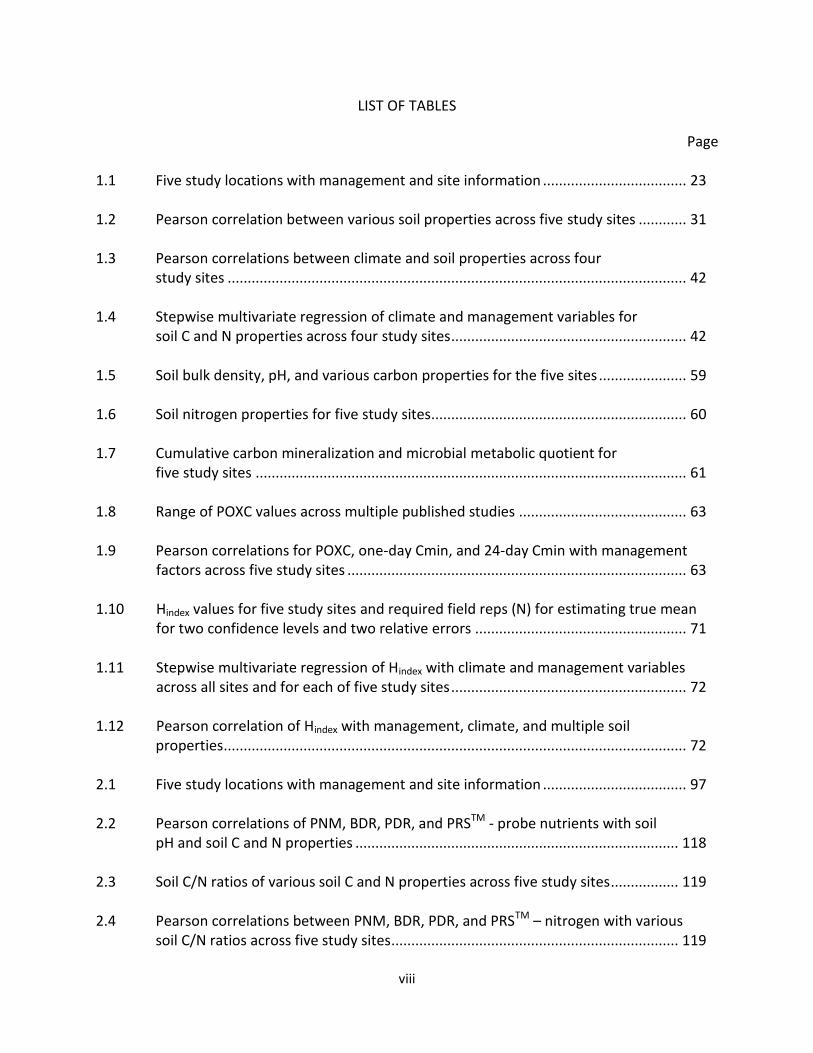
LIST OF TABLES
Page
1.1 Five study locations with management and site information .................................... 23 1.2 Pearson correlation between various soil properties across five study sites ............ 31 1.3 Pearson correlations between climate and soil properties across four
study sites ................................................................................................................... 42
1.4 Stepwise multivariate regression of climate and management variables for soil C and N properties across four study sites ........................................................... 42
1.5 Soil bulk density, pH, and various carbon properties for the five sites ...................... 59 1.6 Soil nitrogen properties for five study sites ................................................................ 60 1.7 Cumulative carbon mineralization and microbial metabolic quotient for five study sites ............................................................................................................ 61
1.8 Range of POXC values across multiple published studies .......................................... 63 1.9 Pearson correlations for POXC, one-day Cmin, and 24-day Cmin with management
factors across five study sites ..................................................................................... 63 1.10 Hindex values for five study sites and required field reps (N) for estimating true mean
for two confidence levels and two relative errors ..................................................... 71 1.11 Stepwise multivariate regression of Hindex with climate and management variables
across all sites and for each of five study sites ........................................................... 72 1.12 Pearson correlation of Hindex with management, climate, and multiple soil properties .................................................................................................................... 72 2.1 Five study locations with management and site information .................................... 97
2.2 Pearson correlations of PNM, BDR, PDR, and PRSTM - probe nutrients with soil pH and soil C and N properties ................................................................................. 118 2.3 Soil C/N ratios of various soil C and N properties across five study sites ................. 119 2.4 Pearson correlations between PNM, BDR, PDR, and PRSTM – nitrogen with various soil C/N ratios across five study sites ........................................................................ 119
ix
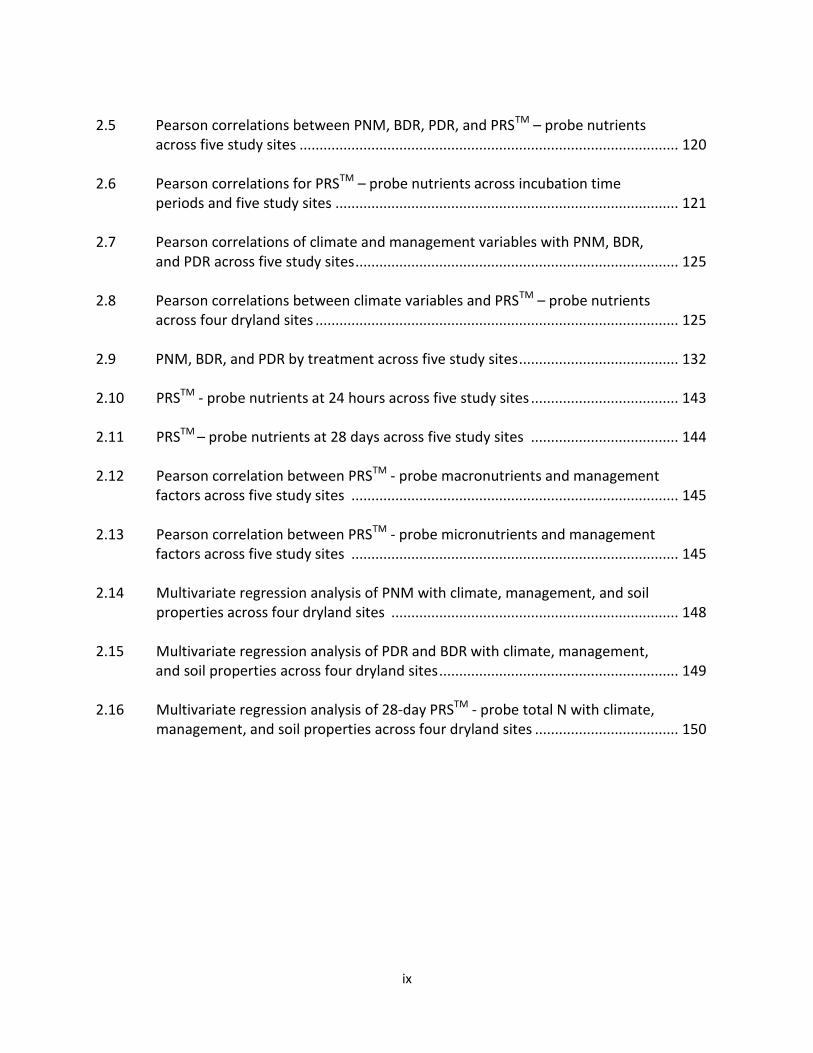
2.5 Pearson correlations between PNM, BDR, PDR, and PRSTM – probe nutrients across five study sites ............................................................................................... 120 2.6 Pearson correlations for PRSTM – probe nutrients across incubation time periods and five study sites ...................................................................................... 121 2.7 Pearson correlations of climate and management variables with PNM, BDR, and PDR across five study sites ................................................................................. 125 2.8 Pearson correlations between climate variables and PRSTM – probe nutrients across four dryland sites ........................................................................................... 125 2.9 PNM, BDR, and PDR by treatment across five study sites ........................................ 132 2.10 PRSTM - probe nutrients at 24 hours across five study sites ..................................... 143 2.11 PRSTM – probe nutrients at 28 days across five study sites ..................................... 144 2.12 Pearson correlation between PRSTM - probe macronutrients and management factors across five study sites .................................................................................. 145 2.13 Pearson correlation between PRSTM - probe micronutrients and management factors across five study sites .................................................................................. 145 2.14 Multivariate regression analysis of PNM with climate, management, and soil
properties across four dryland sites ........................................................................ 148 2.15 Multivariate regression analysis of PDR and BDR with climate, management, and soil properties across four dryland sites ............................................................ 149 2.16 Multivariate regression analysis of 28-day PRSTM - probe total N with climate,
management, and soil properties across four dryland sites .................................... 150
x
LIST OF FIGURES
Page
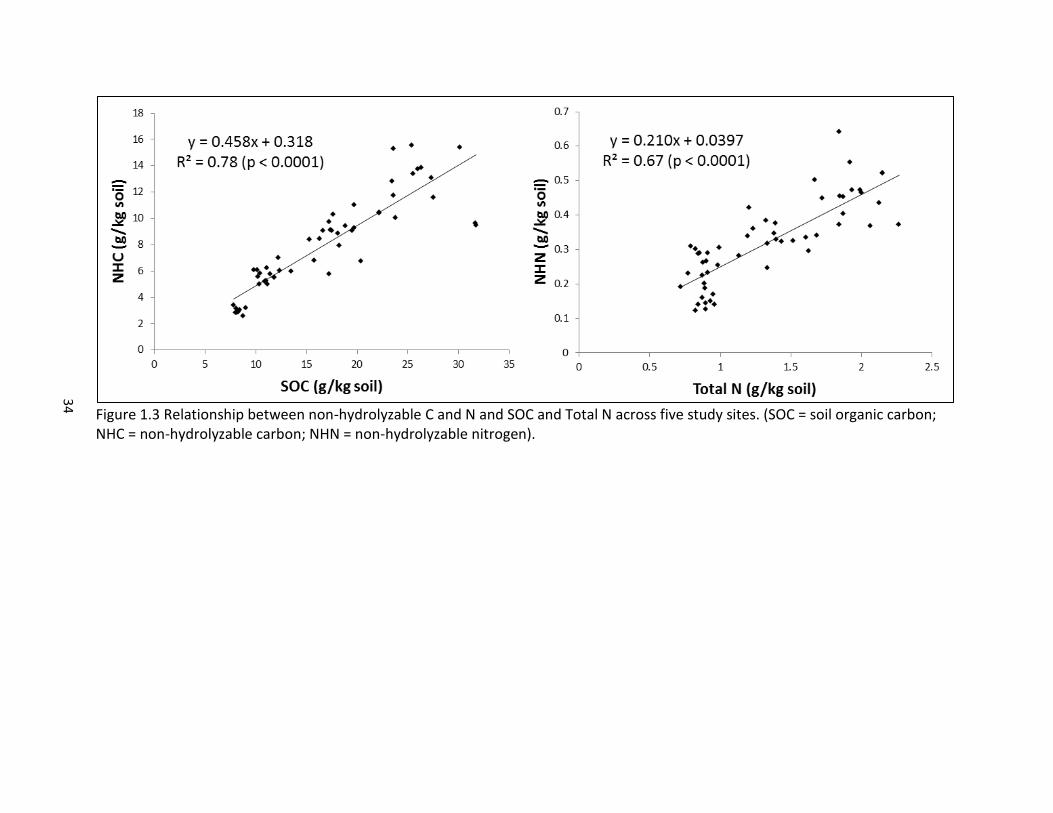
1.1 Relationship between POXC and various soil C and N properties across five study sites ............................................................................................................................. 32 1.2 C/N relationship of various soil C and N properties across five study sites ............... 33 1.3 Relationship of non-hydrolyzable C and N with SOC and total N across
five study sites ............................................................................................................ 34
1.4 Relationship of SOC, total N, NHC, NHN, HC, and HN with temperature and precipitation ratio for four dryland study sites .......................................................... 43
1.5 Future climate scenarios and SOC and total N across four dryland study sites ............................................................................................................................. 44 1.6 Management influence on stabilization and mineralization of SOM ......................... 62 1.7 STIR does not influence proportion of SOC as NHC .................................................... 64

xi
DEDICATION
For all my family and friends who have helped to keep me smiling and provided endless support
and encouragement throughout this project
1
CHAPTER 1
GENERAL INTRODUCTION
The Columbia Plateau of the dryland Inland Pacific Northwest is comprised of 62,000
km2 of which 60% is in dryland crop production (Schillinger & Papendick, 2008). Prior to the
introduction of agriculture to this region, the landscape was dominated by expanses of
bluebunch wheatgrass [Pseudoroegneria spicata] and big sagebrush [Artemisia tridentata].
Dryland wheat farming now dominates the landscape, and in the higher rainfall zones located in
the eastern parts of this region, world record wheat yields have been reported (Kok et al.,
2009).
While the introduction of agriculture to this landscape was the basis for its settlement, it
did not come without a price. This region has also been historically associated with some of
the highest erosion rates in the United States, ranging from 3 to 67 Mg ha-1 yr-1 (1.3 to 30 T ac-1
yr-1), far exceeding the 2.2 to 11.2 Mg ha-1 yr-1 (1.0 to 5.0 T ac-1 yr-1) that is considered
acceptable for sustained productivity (Williams et al., 2009; Kok et al., 2009) and representing a
significant environmental threat to downstream water bodies.
To combat these high erosion rates, management practices that result in decreased
surface disturbance and increased soil-surface crop residue cover are recommended and
include increased cropping intensity and conservation tillage or no-tillage. Through RUSLE2
simulations, Kok et al. (2009) demonstrated the efficacy of these management practices in
mitigating soil erosion; erosion rates in high and intermediate precipitation zones have been
reduced by as much as 75% and in low rainfall zones by as much as 50%. This is an example of a
quantifiable and visible threat to soil productivity and environmental health that has been
mitigated through the introduction of appropriate management practices.
2
There are less visible yet still significant consequences that have resulted from the
transition of native landscapes to agricultural landscapes. For example, in a Palouse silt loam in
Eastern Washington, Purakayastha et al. (2008) revealed that 100 years of cultivation with a
moldboard plow resulted in a 64% reduction in soil organic carbon (SOC) compared to native
prairie and 28 years of no-till contained SOC levels 19% below that of native prairie. However,
disturbance from agriculture need not be associated with an inevitable decline in SOC, as many
have demonstrated with appropriate management SOC of various managed systems located in
other regions can surpass that of native systems (Barrow, 1969; Ridley et al., 1990; Ismail et al.,
1994).
SOC is an important component of soil organic matter (SOM), which contributes to soil
productivity and many of the important ecosystem functions provided by soil in the context of
terrestrial ecosystems, including 1) promotion of plant growth; 2) biogeochemical cycling of
nutrients; 3) provision of habitat for soil organisms; and 4) partitioning, storage, translocation,
and decontamination of water (Brady & Weil, 2010; Campbell, 1999). These vital services
provide the context for the somewhat abstract concept of soil health, which has various
definitions presented by many authors and can be distilled down to the ability of a soil to
function effectively at present and into the future (Doran & Parkin, 1994). Evaluating crop
rotations and management practices through the lens of soil health can help assure sustained
soil productivity and minimize environmental impacts.
Several studies have shown that changes in the active fraction of soil carbon and
nitrogen can serve as an early assessment of the impacts of management practices on soil
health (Franzluebbers and Arshad, 1996; Dou et al., 2008; Culman et al., 2013). Particularly,
3
POXC (Weil, 2003), soil microbial biomass carbon and nitrogen (Powlson and Brookes, 1987),
carbon mineralization (Franzluebbers et al., 2000), acid hydrolysis (Rovira and Vallejo, 2002),
and water extractable carbon and nitrogen (Haney et al., 2012) have been identified as
meaningful and sensitive portions of the active carbon and nitrogen pool that effectively
differentiate among management impacts on SOM.
A range of climatic conditions span the inland PNW, where mean annual precipitation
ranges from a low of 150 mm in south-central Washington and increases along a west-to-east
gradient to a high of 600 mm in eastern Washington and into Idaho (Schillinger et al., 2006). A
mean annual temperature gradient also exists in the region and runs inversely to the
precipitation gradient, ranging from 8.4oC in the wetter regions in eastern Washington and into
Idaho to 10.9oC in the drier regions of south-central Washington. This climatic gradient is also
an important consideration in assessing soil health, as precipitation and temperature represent
important drivers of soil C and N dynamics. In water-limited regions such the Inland Pacific
Northwest, rainfall drives biomass production, and in-turn, C inputs to the soil (Wynn et al.
2006), while decomposition rates, particularly of the labile SOM pool, are influenced by
temperature and other soil factors (Davidson and Janssens, 2006). It follows that SOC is
positively correlated with annual rainfall in water-limited regions, while negatively correlated
with annual temperature (Post et al., 1982).
Furthermore, in the face of climate change, it becomes increasingly important to
understand how climatic factors influence soil health. In natural ecosystems, a steady state in
soil carbon dynamics with regard to climate is reached after centuries, or even millennia (Mann,
4
1986). In this state of equilibrium, abiotic factors, along with biological activity, dictate SOC
levels through influence on biomass production and decomposition rates.
However, there is uncertainty as to how microbial decomposers will respond to increasing
temperatures (Craine et al., 2012). Moreover, research has shown the importance of
considering the interaction of management factors, climate factors, and SOM dynamics. For
example, while temperature and precipitation represent important controls on C and N input
and output, a priming effect (PE), resulting from the addition of fresh organic matter, has also
been observed (Bingeman et al., 1953). This PE has been shown to be both negative (decrease
in SOM decomposition) (Guenet et al., 2010; Zimmerman et al., 2011) and positive (increase in
SOM decomposition) (Nottingham et al., 2009; Guenet et al., 2012). Thiessen et al., (2013)
demonstrated a net positive PE with the addition of fresh organic matter, but observed that the
rate of change of PE varied with temperature, representing both the complexity and
importance of understanding how management and climate can interact to influence SOM
dynamics and subsequently soil health.
Chapter 2 of this thesis explores the relationship between different fractions of the soil
C and N pools and quantifies the influence of management practices, particularly tillage
practices and cropping intensification, on soil C and N properties across five sites within the
inland Pacific Northwest. Additionally, this chapter elucidates the influence of climate factors,
namely mean annual temperature and precipitation, on soil C and N properties within the
context of management factors. Last, this chapter provides an evaluation of a soil health index
that has recently been discussed among local farmers and government entities and has shown
promise by some in distinguishing between management impacts on soil health.
5
Ultimately, certain soil biochemical processes are the great integrator of soil properties,
management, and climate and are a central component of soil health. Specifically, nitrogen
mineralization, denitrification, and nutrient availability are three important features of soils
that are critical to soil productivity and are environmentally significant. A major component of
the nitrogen cycle, nitrogen mineralization represents the ability of the microbial population to
decompose plant residue and SOM and to provide an important source of plant-available
nutrients, two functions which are an important component of soil health (Doran & Parkin,
1994). Furthermore, nitrogen mineralization is a process dependent on a diverse microbial
community of bacteria, fungi, and actinomycetes that are influenced by soil temperature, water
content, and aeration while they feed on SOM and fresh crop residues to convert organic N to
inorganic N (Schepers and Meisinger, 1994).
Also nested within the nitrogen cycle, denitrification is the antithesis of N mineralization
and represents both a loss of nitrogen from the soil N pool as well as a source of nitrous oxide
(N2O) in the atmosphere, a major greenhouse gas with global warming potential 298 times that
of CO2 (Pittelkow, 2013). Several factors have potential to influence soil denitrification,
including soil aeration, pH, soil temperature, the presence of denitrifiers, and NO3- and C
availability (Sylvia et al., 2005).
Nutrient availability is also an important consideration with regard to soil health due to
its role in soil productivity. Plant macro- and micronutrient availability is dependent on a
number of factors, including SOM, texture, CEC, as well as management factors such as tillage
(Havlin et al., 1999). Ion exchange resins (IER) have a long history in agricultural research
(Schlenker, 1942), and are one method of measuring plant-available nutrients and the rates
6
they are released (Qian and Schoenau, 2001) and measurements using IERs have been shown
to correlate well with plant nutrient uptake (Lajtha, 1988; Qian and Schoenau, 1995).
Additionally, IER measurements have displayed sensitivity to soil temperature and moisture
content, as well as to microbial competition for nutrients (Huang and Schoenau, 1997).
Chapter 3 of this thesis presents the relationship between soil C and N data and these
three important soil processes – nitrogen mineralization, denitrification, and nutrient
availability using IERs. Additionally, this chapter relates these processes to tillage practices and
cropping intensification, as well as to mean annual temperature and precipitation in order to
identify the role of these first-order factors in regional soil health.
The fact that the concept of soil health has been around for decades is a testament to its
value. However, contrary to water quality and air quality, no set of accepted standards have
yet been universally recognized for soil health (Karlen and Stott, 1994). However, whereas air
and water resources have a relatively direct and immediate impact on human health, the
impact of soil health on society can be less immediate, more circuitous, yet just as important.
To be sure, soil is a finite resource and the vision of a future with an uncertain climate coupled
with increasing pressure from an ever-increasing world population provides a backdrop for
both broader awareness of soil health issues as well as an opportunity for increased
understanding in the scientific community of the multiplicity of factors influencing this precious
resource and its fundamental effects on society.
7
REFERENCES
Barrow, N.J. 1969. The accumulation of soil organic matter under pasture and its effect on soil properties. Australian Journal of Experimental Agriculture and Animal Husbandry. 9(39): 437-444.
Bingeman, C.W., J.E. Varner, and W.P. Martin. 1953. The effect of the addition of organic materials on the decomposition of an organic soil. Soil Science Society of America Proceedings. 17(1): 34-38.
Brady N.C., and R.R. Weil. 2010. The Nature and Properties of Soils, 13th ed. Prentice-Hall, Upper Saddle River, NJ.
Campbell, C.A., V.O. Biederbeck, B.G. McConkey, D. Curtin, and R.P. Zentner. 1999. Soil Quality – Effect of tillage and fallow frequency: Soil organic matter quality as influenced by tillage and fallow frequency in a silt loam in southwestern Saskatchewan. Soil Biology & Biochemistry. 31(1): 1-7.
Craine, J.M., N. Fierer, K.K. McLauchlan, and A.J. Elmore. 2012. Reduction of the temperature sensitivity of soil organic matter decomposition with sustained temperature increase. Biogeochemistry. 113(1-3): 359-368.
Culman, S.W., S.S. Snapp, J.M. Green, and L.E. Gentry. 2013. Short- and long-term labile soil carbon and nitrogen dynamics reflect management and predict corn agronomic performance. Soil Fertility & Crop Nutrition. 105(2): 493-502.
Davidson, E.A., and I.A. Janssens. 2006. Temperature sensitivity of soil carbon decomposition and feedbacks to climate change. Nature. 440(7081): 165-173.
Doran J.W. and T.B. Parkin. 1994. Defining and assessing soil quality. In Defining Soil Quality for a Sustainable Environment. Edited by J.W. Doran, J.A.E. Molina, and R.F. Harris. SSSA Publication Number 35, Madison, WI. pp 3-21.
Dou, F., A. L. Wright, and F.M. Hons. 2008. Sensitivity of labile soil organic carbon to tillage in wheat-based cropping systems. Soil Science Society of America Journal. 72(5): 1445-1453.
Franzluebbers, A.J., R.L. Haney, C.W. Honeycutt, H.H. Schomberg, and F.M. Hons. 2000. Flush of carbon dioxide following rewetting of dried soil relates to active organic pools. Soil Science Society of America Journal. 64(2): 613-623.
Franzluebbers, A.J., and M.A. Arshad. 1996. Soil organic matter pools during early adoption of conservation tillage in Northwestern Canada. Soil Science Society of America Journal. 60(1): 1422-1427.
Guenet, B., J. Leloup, X. Raynaud, G. Bardoux, and L. Abbadie. 2010. Negative priming effect on mineralization in a soil free of vegetation for 80 years. European Journal of Soil Science. 61(3): 384-391.
8
Guenet, B., S. Juarez, G. Bardoux, L. Abbadie, and C. Chenu. 2012. Evidence that stable C is as vulnerable to priming as is more labile C in soil. Soil Biology & Biochemistry. 52(1): 43-48.
Haney R.L., A.J. Franzluebbers, V.L. Jin, M. Johnson, E.B. Haney, M.J. White, R.D. Harmel. 2012. Soil organic C:N vs. water-extractable organic C:N. Open Journal of Soil Science. 2: 269-274.
Havlin, J. L., J.D. Beaton, S.L. Tisdale, and W.L. Nelson. 1999. Soil fertility and fertilizers: An introduction to nutrient management.6th ed. Prentice Hall, Upper Saddle River, NJ.
Huang, W.Z., and J.J. Schoenau. 1997. Seasonal and spatial variations in soil nitrogen and phosphorus supply rates in a boreal aspen forest. Canadian Journal of Soil Science. 77(4): 597-612.
Ismail, I., R.L. Blevins, and W.W. Frye. 1994. Long-term no-tillage effects on soil properties and continuous corn yields. Soil Science Society of America Journal. 58(1): 193-198.
Karlen, D.L., and D.E. Stott. 1994. A framework for evaluating physical and chemical indicators of soil quality. In Defining Soil Quality for a Sustainable Environment. Edited by J.W. Doran, J.A.E. Molina, and R.F. Harris. SSSA Publication Number 35, Madison, WI. pp 53-72.
Kok, H., R.I. Papendick, and K.E. Saxton. 2009. STEEP: Impact of long-term conservation farming research and education in Pacific Northwest wheatlands. Journal of Soil and Water Conservation. 64(4): 253:264.
Lajtha, K. 1988. The use of ion-exchange resin bags for measuring nutrient availability in an arid ecosystem. Plant and Soil. 105(1): 105-111.
Mann, L.K. 1986. Changes in soil carbon storage after cultivation. Soil Science. 142(1): 279-288.
Nottingham, A.T., H. Griffiths, P.M. Chamberlain, A.W. Stott, and E.V.J. Tanner. 2009. Soil priming by sugar and leaf-litter substrates: a link to microbial groups. Applied Soil Ecology. 42(3): 183-190.
Pittelkow, C.M., M.A. Adviento-Borbe, J.E. Hill, J. Six, C. van Kessel, and B.A Linquist. 2013. Yield-scaled global warming potential of annual nitrous oxide and methane emissions from continuously flooded rice in response to nitrogen input. Agriculture, Ecosystem & Environment. 177(1): 10-20.
Post, W.M., W.R. Emanuel, P.J. Zinke, and A.G. Stangenberger. 1982. Soil carbon pools and world life zones. Nature. 298(1): 156-159.
Powlson, D.S., and P.C. Brookes. 1987. Measurement of soil microbial biomass provides an early indication of Changes in total soil organic matter due to straw incorporation. Soil Biology & Biochemistry. 19(2): 159-164.
9
Purakayastha, T.J., D.R. Huggins, and J.L. Smith. 2008. Carbon sequestration in native prairie, perennial grass, no-till, and cultivated Palouse silt loam. Soil Science Society of America Journal. 72(2): 534-540.
Qian, P., and J.J. Schoenau. 1995. Assessing nitrogen mineralization from organic matter using anion exchange membranes. Fertilizer Research. 40(2): 143-148.
Qian, P., and J.J. Schoenau. 2001. Practical applications of ion exchange resins in agricultural and environmental soil research. Canadian Journal of Soil Science. 82(1): 9-21.
Ridley, A.M., K.R. Helyar, and W.J. Slattery. 1990. Soil acidification under subterranean clover (Trifolium subterraneum L.) pastures in north-eastern Victoria. Australian Journal of Experimental Agriculture. 30(2): 195-201.
Rovira, P., and V.R. Vallejo. 2002. Labile and recalcitrant pools of carbon and nitrogen in organic matter decomposing at different depths in soil: an acid hydrolysis approach. Geoderma. 107(2002): 109-141.
Schepers, J.S., J.J. Meisinger. 1994. Field indicators of nitrogen mineralization. In Soil Testing: Prospects for Improving Nutrient Recommendations. Edited by J.L. Havlin and J.S. Jacobsen. SSSA Publication Number 40, Madison, WI. pp 31-47.
Schillinger, W.F., and R.I. Papendick. 2008. Then and now: 125 years of dryland wheat farming in the inland Pacific Northwest. Agronomy Journal. 100(3): S166-S182.
Schillinger, W.F., R.I. Papendick, S.O. Guy, P.E. Rasmussen, and C. Van Kessel. 2006. Dryland cropping in the Western United States. In Dryland Agriculture Research Issues. Edited by G. Peterson, P. Unger, and B. Payne. American Society of Agronomy Monograph Series. pp 365-393.
Schlenker, F.S. 1942. Availability of absorbed ions to plant growing in quartz and substrate. Soil Science. 54(1): 247-251.
Sylvia, D.M., J.J. Fuhrmann, P.G. Hartzel, and D.A. Zuberer. 2005. Principles and applications of soil microbiology, 2nd ed. Prentice-Hall, Upper Saddle River, NJ.
Thiessen, S., G. Gleixner, T. Wutzler, and M. Reichstein. 2013. Both priming and temperature sensitivity of soil organic matter decomposition depend on microbial biomass – An incubation study. Soil Biology & Biochemistry. 57(1): 739-748.
Weil, R.R., K.R. Islam, M.A. Stine, J.B. Gruver, and S.E. Samson-Liebig. 2003. Estimating active carbon for soil quality assessment: A simplified method for laboratory and field use. American Journal of Alternative Agriculture. 18(1): 3-17.
Williams, J.D., H.T. Gollany, M.C. Siemens, S.B. Wuest, and D.S. Long. 2009. Comparison of runoff, soil erosion, and winter wheat yields from no-till and inversion tillage production systems in northeastern Oregon. Journal of Soil and Water Conservation. 64(1): 43-52.

10
Wynn, J.G., M.I. Bird, L. Vellen, E. Grand-Clement, J. Carter, and S.L. Berry. 2006. Continental-scale measurement of the soil organic carbon pool with climatic, edaphic, and biotic controls. Global Biogeochemical Cycles. 20(1): 1-12.
Zimmerman, A.R., B. Gao, and M.Y. Ahn. 2011. Positive and negative carbon mineralization priming effects among a variety of biochar-amended soils. Soil Biology and Biochemistry. 43(6): 1169-1179.
11
CHAPTER 2
IMPACTS OF CLIMATE, TILLAGE, AND CROPPING INTENSITY ON CARBON AND NITROGEN IN
SURFACE SOILS: A SOIL HEALTH PERSPECTIVE
ABSTRACT
Surface soils comprise a critical interface and influence soil health through their role in
nutrient cycling and decomposition, gas exchange, water infiltration, and erosion. In this study,
we tested multiple surface soil C and N properties across five agricultural sites within the inland
Pacific Northwest (PNW) to assess the influence of climate, tillage, and cropping intensity on
surface soil health (0-10 cm). Tillage systems ranged from no-till to tillage with a moldboard
plow, and cropping intensification systems ranged from winter wheat (WW)/fallow to perennial
cropping systems. Mean annual precipitation (MAP) across the study sites ranged from 200
mm to 663 mm, and mean annual temperature (MAT) ranged from 8.4oC to 10.9oC. MAP was
positively correlated with SOC and total N, and MAT negatively correlated with SOC and total N.
In a multivariate regression of MAP, MAT, tillage and cropping intensity versus soil health
measures, MAP was the dominant variable, explaining 57% of SOC variability and 69% of total
soil N variability. When MAP was removed from the model, MAT became the dominant
variable, explaining 42% and 49%, respectively, of SOC and total N variability. Both
hydrolyzable and non-hydrolyzable fractions of SOC were equally sensitive to climate, indicating
no relationship between chemical recalcitrance and climate sensitivity. Permanganate
oxidizable carbon (POXC) was significantly correlated with non-hydrolyzable carbon (NHC) (r =
0.84), non-hydrolyzable nitrogen (NHN) (r = 0.80), hydrolyzable carbon (r = 0.90), and
hydrolyzable nitrogen (r = 0.90) and considered representative of stabilized soil organic matter
(SOM).
12
POXC, however, was not strongly correlated with one-day carbon mineralization (Cmin)
(r = 0.42). These two soil properties, POXC and one-day Cmin, were used to provide
complementary information regarding the influence of tillage and cropping intensity on surface
soil health. The sensitivity of SOM stabilization, represented by POXC, to tillage varied across
the five study sites, ranging from not significant to a strong negative correlation (r = -0.84), and
sensitivity of SOM stabilization to cropping intensity varied as well, ranging from negative (r = -
0.46) to positive (r = 0.46). One-day Cmin sensitivity to tillage intensity ranged from not
significant to a strong negative correlation (r = -0.87), and sensitivity to cropping intensity
ranged from not significant to a positive correlation (r = 0.61).
Interpretation of results in this study along with the literature suggests that both values
may be enhanced by cropping diversification; stabilized inputs along with low disturbance may
particularly enhance POXC. Both the hydrolyzable soil C (HC) and non-hydrolyzable soil C (NHC)
were sensitive to tillage intensity. However NHC/SOC, which is considered to reflect SOM
quality, was not sensitive to tillage intensity. These results support that resistance to acid
hydrolysis is not equivalent to resistance to biodegradation under changes in land use.
Last, review of a soil health index utilizing water extractable C (WEOC) and N (WEON)
along with one-day Cmin revealed the sensitivity of this index to both climate and
management; however, the inherent variability of these measurements indicates that the
number of field replications must be considered beforehand to aid in a meaningful
interpretation of results. While a scale of 0 to 50 has previously been associated with the index,
a more moderate scale of 0 to 14 is more appropriate for the inland PNW.
13
INTRODUCTION
Soil health has been discussed among scientists in analytical terms at least as far back as
the 1940s (Jenny, 1941) and most assuredly by farmers in descriptive terms since the advent of
agriculture. A uniting theme of modern definitions of soil health is its capacity to function
effectively at present and in the future (Doran & Parkin, 1994). Essential soil functions in the
context of terrestrial ecosystems, including agriculture, are listed by Brady and Weil (2010): 1)
promotion of plant growth; 2) biogeochemical cycling of nutrients; 3) provision of habitat for
soil organisms; and 4) partitioning, storage, translocation, and decontamination of water. Soil
organic matter (SOM) is crucial to these functions and therefore an important attribute of soil
health and integral to soil productivity and the overall physical well-being of soils (Campbell,
1999). Furthermore, surface soils, the focus of this study (0-10-cm), greatly influence erosion
potential, water infiltration, exchange of gases such as nitrous oxide, and nutrient cycling, all
factors which are crucial to soil conservation and influence soil and environmental health
(Franzluebbers, 2002).
Climate variables, such as mean annual temperature and precipitation, are important
factors, which influence SOM levels and dynamics (Jenny, 1941). The inland Pacific Northwest
(PNW), the focus area of this study, is a water-limited region. In water-limited regions, rainfall
drives biomass production and in-turn, residue inputs to the soil (Wynn et al., 2006), while
decomposition rates are influenced by temperature and other soil factors (Davidson and
Janssens, 2006). It follows that SOM is positively correlated with annual rainfall in drier regions,
while negatively correlated with annual temperature (Post et al., 1982). In the inland PNW,
climate change models predict warmer and wetter springs in the future, translating to an
14
increase in annual average temperature and precipitation (Littell, 2009). In natural ecosystems,
a state of equilibrium in SOM dynamics with regard to climate is reached after centuries, or
even millennia (Mann, 1986), and considering both the increase in biomass production and
decomposition that may result from this shift in climate, implications of climate change on SOM
dynamics and soil health within the inland PNW are unclear.
Tillage and cropping intensity are also two variables which numerous researchers have
identified as impacting SOM and soil health (Schomberg & Jones, 1999; Deen and Katkai, 2003;
Liebig et al., 2004). Increasing soil disturbance alters SOM dynamics by altering substrate
availability and decomposition rates. Tillage facilitates microbial degradation of SOM by
promoting crop-residue-soil contact and placing residues into a moister sub-surface
environment as compared to surface placemen under NT (Halverson et al., 2002) and by
creating a more oxidative environment and reduced soil aggregation (Denef et al., 2004).
Therefore, operations that reduce soil disturbance have the potential to increase SOM.
Accordingly, in a review of SOC data across the PNW, Brown and Huggins (2012) found
that conversion from conventional till (CT) to NT resulted in net SOC accumulation in the
surface 30 cm during the initial years of NT adoption. In a Palouse silt loam in Eastern
Washington, Purakayastha et al., (2008) revealed that 100 years of cultivation with a
moldboard plow resulted in a 64% reduction in SOC compared to native prairie; the greatest
gains in SOC in the surface 10-cm was achieved through 28 years of NT with a diverse crop
rotation including two cereal grains and a grain legume that resulted in SOC levels 19% below
that of native prairie. Similarly, in this same study, Purakayastha and co-workers reported that
soil microbial biomass, an important measure of the active portion of soil carbon, was 34%
15
greater in the surface 10 cm after 28 years of NT than after only four years of NT. Likewise,
multiple studies have documented the detrimental impact of tillage on total N of surface soils
(Martel and Paul, 1974; Wienhold and Halvorson, 1998).
Other studies have emphasized that cropping intensification, or reduction of fallow,
along with the adoption of NT, are necessary to mitigate a decline in SOM. For example,
Halvorson et al. (2002) evaluated the impacts of tillage on SOC sequestration in dryland
cropping systems in the Great Plains and found that a spring wheat-winter wheat-sunflower
rotation under NT was effective at building SOC and total N in the surface 15.2 cm while spring
wheat-fallow under both NT and CT was not. Even further emphasizing the nuances and
important considerations associated with cropping intensification, Huggins et al. (2007) found
that along with reduced tillage intensity, annual cropping systems that enhanced biomass
input, represented by continuous corn or corn-soybean, were more effective than annual
cropping with less biomass input, represented by continuous soybean, at mitigating SOC losses.
Soil erosion, also highly influenced by tillage and cropping intensity, represents another
major threat to soil health, and studies show that a reduction in tillage along with an increase in
cropping intensity are important considerations in combating erosion’s destructive forces
(Williams and Wuest, 2011). In the inland PNW, soil erosion rates on the order of 3 to 50 Mg
soil ha-1 are not uncommon and can far exceed USDA’s established threshold for sustained
productivity of 2.2 to 11.2 Mg soil ha-1 (Williams et al., 2009). NT or reduced tillage and
increased cropping intensity work together to increase surface residue cover and promote
improved macroaggregate formation, two factors that increase surface infiltration and result in
less runoff and less soil movement (Williams et al., 2009).
16
The active fraction of SOC and total N has been shown to be a key indicator for an early
assessment of management practice impacts on soil health (Franzluebbers and Arshad, 1996a;
Dou et al., 2008; Culman et al., 2013), and an early assessment is critical to reversing or slowing
this decline in SOM resulting from management practices. Particularly, permanganate
oxidizable carbon (POXC) (Weil, 2003), soil microbial biomass carbon and nitrogen (Powlson
and Brookes, 1987), carbon mineralization (Franzluebbers et al., 2000), acid hydrolysis (Rovira
and Vallejo, 2002), and water extractable carbon and nitrogen (Haney et al., 2012) have been
identified as measureable SOM constituents that are sensitive to management impacts on
SOM.
In this study, we focus on the impact of climate, tillage, and cropping intensity on these
SOM constituents. Specifically, the objectives of this study were to 1) explore the relationship
between the soil C and N properties measured; 2) assess the influence of mean annual
temperature and precipitation on soil C and N properties; 3) quantify the influence of tillage
and cropping intensification on soil health and SOM quality; and 4) apply values obtained in this
study to a recently developed soil health index and assess its application to the inland PNW. In
addition, published literature values from other regions are presented to provide context for
values reported in this study and to give a comparative sense of soil health within the region.
METHODS AND MATERIALS
Site Descriptions
Research plots located in five long-term agricultural research centers within the dryland
and irrigated cropping regions of the inland PNW comprise the basis of this study. These
research plots are located at the following research centers: Kambitsch Farm near Genesee, ID
17
operated by the University of Idaho; Palouse Conservation Field Station near Pullman, WA;
Pendleton Research Station near Pendleton, OR, and Sherman Research Station near Moro, OR,
both associated with the Columbia Basin Agricultural Research Center near Pendleton, OR; and
Irrigated Agricultural Research Center near Prosser, WA. These five sites were selected based
on the cropping systems present as well as the range of climactic conditions collectively
represented by the sites. Together, the five sites span four agroecological classes (AECs), or
land use classifications that represent unique biophysical and socioeconomic conditions that
result in distinct cropping systems (Huggins et al., 2011): (1) annual cropping (limited annual
fallow); (2) annual crop-fallow transition (e.g. 3-yr rotations with fallow every third year); (3)
grain-fallow (e.g. 2-yr wheat-fallow rotation); and (4) irrigated. Following is a description of
these sites. For the purposes of this study, unless otherwise noted, the winter wheat portion
of rotations represents the crop present during sampling.
Kambitsch Farm, University of Idaho – Genesee, ID (AEC 1)
The Kambitsch experimental plots selected for this research originated in 2000 to study
the effects of tillage on soil properties and crop growth. The experimental design is a split-plot
randomized complete block design and sub-plots are 6.1 m by 80.5 m; however, as winter
wheat was the only crop sampled, in the context of this study, the experimental design
simplifies to a randomized complete block design. Prior to 2000, the site was managed strictly
with conventional tillage. The predominant soil type is a Palouse silt loam (fine-silty, mixed,
superactive, mesic Pachic Ultic Haploxeroll). The crop rotation present since 2010 includes
winter wheat (WW) (Triticum aestivum) -spring cereal (SC) (barley - Hordeum vulgare or spring
wheat) - spring legume (SL) (garbanzo – Cicer arietinum or spring pea - Pisum sativum) with
18
tillage as the management variable (Table 1.1). Prior to 2010, crop sequences were not
randomized and additional management details can be found in Johnson-Maynard et al. (2007).
In 2010, whole plots were subdivided into three equal subplots with the present crop rotation
randomized across these subplots. The whole plot tillage treatments that were present prior to
2010 remained the same after subdividing to allow for crop randomization within a given tillage
treatment. CT plots are tilled a few days prior to planting for both fall and spring planted crops
using a Glenco Soil Saver followed by a Will-Rich 2500 field cultivator. NT and CT plots are
planted with a Flexi-Coil No-Till drill at 25.4-cm row spacing.
Palouse Conservation Field Station – Pullman, WA (AEC 1)
Soils at this site consist predominately of Palouse (fine-silty, mixed, superactive, mesic
Pachic Ultic Haploxeroll) and Thatuna (fine-silty, mixed, superactive, mesic Oxyaquic Argixerolls)
silt loam. Plots range in size from a minimum of 11 m wide to accommodate field-scale
equipment up to 30 m in width and from 100- to 350-m in length as needed to capture
significant portions of soil and landscape variability. The plots selected for study include five
cropping systems established in 2001 and arranged in a randomized complete block design with
three replications. The five cropping systems include two perennial systems, two, 3-year
annual cropping systems that are continuous NT and one organic system that is a combination
of perennial and annual crops (Table 1.1). The perennial systems include a native prairie
system and a perennial tall wheatgrass system. The native perennial system was established in
accordance with Conservation Reserve Program (CRP) guidelines and planted with Idaho Fescue
(Festuca idahoensis) and Bluebunch Wheatgrass (Agropyron spicatum). The perennial
wheatgrass plots were planted with a tall wheatgrass, developed from a hybrid of annual wheat
19
and Thinopyrum, a cool-season perennial grass known to produce large quantities of
aboveground biomass. The annual, NT cropping systems include two rotations: WW-SB-SW and
WW-SL-SW. These plots are seeded with a Cross Slot® inverted-T opener no-till drill at 25.4-cm
row spacing. The organic cropping system is a reduced tillage alfalfa (Medicago sativa)-cereal-
SL rotation managed according to organic agriculture protocols. The organic system was
planted to a spring pea green manure crop during collection of the soil samples analyzed for
this study.
Pendleton Station, Columbia Agriculture Research Center – Pendleton, OR (AEC 2)
The management variables studied at this site are tillage and cropping intensity. Three
different rotations were selected for study and consist of WW-NT fallow rotation under NT
initiated in 1982, a WW-fallow rotation with CT initiated in 1997, and a WW-winter pea (WP)
(Pisum sativum) rotation under NT initiated in 1997 (WP was inserted in the rotation in 2012;
prior to 2012 the rotation was WW-NT fallow). Prior to 1997, these latter two rotations were
under CT that used a mold-board plow. Soils in these plots are predominately a Walla-Walla silt
loam (coarse-silty, mixed, superactive, mesic Typic Haploxerolls). Plots are 2.0 m by 33.5 m and
the experimental design is a factorial design using tillage and fertilizer rate (0 and 120 kg ha-1
banded) as the treatments with four reps for each factorial combination Only fertilized plots in
WW were selected for this study, and the plots were subsequently modeled as randomized
complete block design (Table 1.1). For all plots, WW is planted in mid-October and harvested in
mid to late July. A moldboard plow is used on CT plots for primary tillage in spring of the fallow
year. These plots are also rod-weeded as necessary through the summer fallow season until
20
fall planting of WW. All plots are seeded with a Noble No-Till modified deep furrow drill at
25.4-cm row spacing.
Sherman Station, Columbia Agriculture Research Center – Moro, OR (AEC 3)
Experimental plots located in Moro, Oregon, were initiated in 2003 to compare NT and
CT for annual cropping, as well as two- and three-year rotations with and without a fallow
period. The predominate soil type at the site is a Walla Walla silt loam (coarse-silty, mixed,
superactive, mesic Typic Haploxeroll). The following four rotation and tillage treatments were
selected for this study: WW – fallow under CT, and WW-WP, WW-fallow, WW-SB-fallow all
under NT management (Table 1.1). Plots are 15 m by 105 m, and the experimental design is a
randomized complete block design with three blocks. CT plots are tilled in the spring using a
chisel plow and rod weeded as necessary from May to August. Winter wheat is seeded in
September or early October at 40 cm row spacing. NT plots are direct seeded using a Fabro
drill at 30-cm row spacing.
Prosser Irrigated Agricultural Research Station – Prosser, WA (AEC 4)
This experiment was established in the fall of 2011 to study winter cover crop and NT
management effects on crop productivity, water use efficiency, and N and C cycling. Due to the
short history of this site, only plots not under a winter cover crop were selected for the
purposes of this study and tillage was selected as the management variable. The crop rotation
is WW-Sweet Corn (Zea mays)-potato (Solanum tuberosum); all crops are irrigated throughout
the growing season as needed. The predominate soil type is a Warden silt loam (coarse-silty,
mixed, superactive, mesic Xeric Haplocambids). All plots, NT and CT, are disced prior to potato
21
planting and after harvest of potatoes prior to planting WW. Otherwise, NT pots receive
minimum disturbance. WW is planted using a Fabro drill at 16.5 cm row spacing. Plots are 4.9
m by 14.6 m and the experimental design is randomized complete block design (Table 1.1).
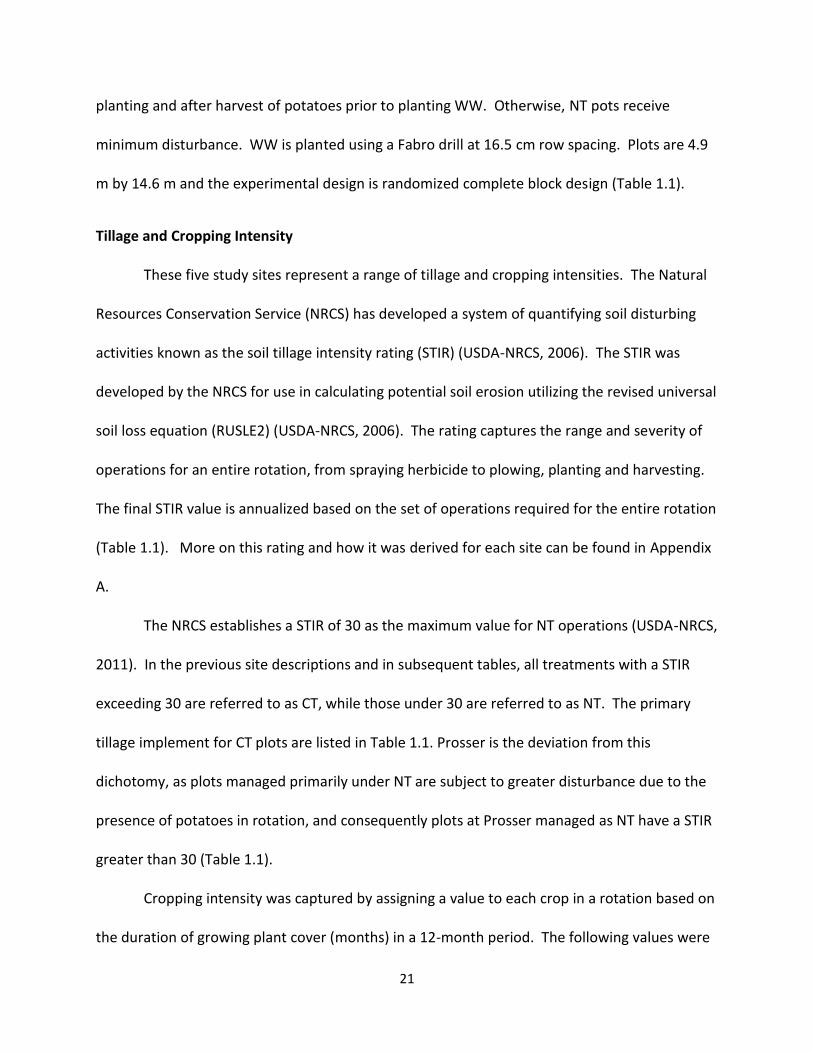
Tillage and Cropping Intensity
These five study sites represent a range of tillage and cropping intensities. The Natural
Resources Conservation Service (NRCS) has developed a system of quantifying soil disturbing
activities known as the soil tillage intensity rating (STIR) (USDA-NRCS, 2006). The STIR was
developed by the NRCS for use in calculating potential soil erosion utilizing the revised universal
soil loss equation (RUSLE2) (USDA-NRCS, 2006). The rating captures the range and severity of
operations for an entire rotation, from spraying herbicide to plowing, planting and harvesting.
The final STIR value is annualized based on the set of operations required for the entire rotation
(Table 1.1). More on this rating and how it was derived for each site can be found in Appendix
A.
The NRCS establishes a STIR of 30 as the maximum value for NT operations (USDA-NRCS,
2011). In the previous site descriptions and in subsequent tables, all treatments with a STIR
exceeding 30 are referred to as CT, while those under 30 are referred to as NT. The primary
tillage implement for CT plots are listed in Table 1.1. Prosser is the deviation from this
dichotomy, as plots managed primarily under NT are subject to greater disturbance due to the
presence of potatoes in rotation, and consequently plots at Prosser managed as NT have a STIR
greater than 30 (Table 1.1).
Cropping intensity was captured by assigning a value to each crop in a rotation based on
the duration of growing plant cover (months) in a 12-month period. The following values were

22
used for this study: perennial crops – 0.83 (10 months divided by 12 months), fall planted crops
– 0.75 (9 months divided by 12 months), spring planted crops – 0.33 (4 months divided by 12
months). The intensity rating for a rotation was derived by summing this value for each crop in
the rotation and averaging across the length of the rotation (Table 1.1). More details on
calculating cropping intensity values for each cropping system are available in Appendix A.
23
Table 1.1 Five study locations with management and site information.
† MAP = mean annual precipitation; MAT = mean annual temperature (Climate data from NOAA from 1955 to 2012; Appendix B). ŧ WW = winter wheat; SC = spring cereal; SL = spring legume; SB = spring barley; SW = spring wheat; WP = winter pea. ‡ STIR = Soil Tillage Intensity Rating. § No-till disced during potato sequence.
Experimental
Design Soil Type MAP† (mm) MAT
† (
oC)
No Till 14.4 Double Opener
Conventional 88.3 Chisel Plow
Native (CRP) Grasses0.83 N/A 0.15
Perennial Tall Wheat Grass0.83 N/A 0.45
Alfalfa - cereals - SL (organic)0.49 No Till 22.8
Sweep/ Single
Opener
WW - SB - SW0.47 6.3
WW- SL - SW0.47 5.2
WW - Fallow0.38 1982 12.9
WW - WP0.75 1997 25.2
WW - Fallow0.38 1997 Conventional 88.2 Mold-board
WW - chem fallow0.38 7.4
WW - WP0.75 14.4
WW - SB - Fallow0.36 9.7
WW - Fallow0.38 Conventional 70.9 Chisel Plow
WW - Sweet Corn - PotatoNo Till 68.6
Double Opener /
Disc§
WW - Sweet Corn - PotatoConventional 78.1 Ripped/Disc
Location
Year
Established Tillage EquipmentCrop Rotationŧ
Cropping
Intensity
20000.47
STIR‡
Rating
WSU Irrigated Agricultural
Research Center - Prosser, WA
(N 46.29o, W 119.74o)
Palouse Conservation Field
Station - Pullman, WA
(N 46.73o, W 117.18o)
8.4530Palouse/Thatuna
Silt Loam
Randomized
Complete Block
Design (3 reps)
Columbia Basin Agriculture
Reseach Center - Pendleton, OR
(N 45.44o , W 118.37o)
Randomized
Complete Block
Design (4 reps)
Walla Walla Silt
Loam417
Rondomized
Complete Block
Design (4 reps)
Warden Silt
Loam
Columbia Basin Agriculture
Agriculture Reseach Center -
Moro, OR (N 45.48o, W 120.69o)
Randomized
Complete Block
Design (3 reps)
Walla Walla Silt
Loam
WW - SC - SLKambitsch Farm - Genesee, ID
(N 46.58o , W 116.95o)
Palouse Silt
Loam663 8.6
Rondomized
Complete Block
Design - (4 reps)
288 9.4
2011
2003
0.54200
No Till
No Till
10.9
2001
Modified Deep
Furrow
Single Opener
N/A
Double OpenerNo Till
10.3
24
Soil Sampling
Each site was sampled in June and July of 2013 prior to harvest from 0- to 10-cm,
collecting 50 to 60 samples across each plot using a hand-operated soil probe (2.0 cm inside
diameter). Four bulk density cores (3.0 cm inside diameter) were also collected from 0 to 10
cm from each subject plot using a hand operated soil probe; these samples were also used to
determine field water content. All samples were immediately placed on ice in the field and
transferred to cold storage at 4oC until further processing.
Laboratory Analysis
Physical Characterization & Soil pH
Bulk density and water content represent the physical indicators comprising this study.
Gravimetric soil water content was determined from the bulk density cores after drying at
104oC for 24 hours. Bulk density was determined from the oven-dried weight of samples and
the volume of the core sampler following the method of Veihmeyer and Hendrickson (1948). In
addition to these physical properties, soil pH was also measured using a 1:1 soil-water mixture
(Eckert, 1991).
Soil Carbon Fractionation
Total soil C (SOC) and N were determined by dry combustion using a CHN autoanalyzer
(LECO CHN-1000, Leco Corp., St Joseph, MI, USA) (Tabatabai and Bremner, 1970). Acid
hydrolysis was performed with a modified version of the method described by Paul et al.
(1997). In short, air dry soil was ground to a fine powder and 1.0 g of soil refluxed at 115oC for
16 hours with 6.0-M HCl. This suspension was then washed with deionized water through a
glass-fiber filter and the recovered sample dried at 40oC for 72 hours. Samples were then
25
analyzed for total C and N as mentioned previously, representing NHC and NHN, and the
hydrolyzability of samples calculated based on mass balance.
Microbial biomass C and N (MBC/MBN) was performed on 10-g oven-dry weight soil
using the chloroform fumigation-extraction method as outlined by Voroney et al. (2008). Soils
were brought to field capacity (estimated at 25% water content for Kambitsch, PCFS,
Pendleton, and Moro and 20% for Prosser) and incubated at 20oC for 48 hours prior to
fumigation with ethanol-free chloroform. Instead of a 0.5-M K2SO4 extraction, fumigated and
non-fumigated soils were extracted using 30 ml of deionized water, shaken for 30 minutes
using an oscillating shaker then filtered through 0.2-µm nylon filter after centrifuging for 5
minutes at 3200 rpm (1500g). The filtrate was frozen until analyzing for C and N on a high-
temperature combustion Shimadzu total organic carbon (TOC) analyzer.
Water extractable organic C and N (WEOC, WEON) analyses were performed according
to established laboratory protocol at the USDA/ARS Soil Biogeochemistry lab at Washington
State University. Soils were dried at 40oC for 24 hours and sieved to 2.0 mm prior to adding
12.5 ml of 18-MΩ water (purified to remove C) to 5.0-g oven-dry weight equivalent soil. This
soil- water mixture was shaken for one minute on an oscillating shaker, centrifuged for five
minutes at 5000 rpm, then filtered through 0.2-µm nylon filter paper. The collected filtrate was
frozen until analyzing for C and N on a high-temperature combustion Shimadzu TOC machine.
Samples were also analyzed for inorganic N and WEON determined from subtracting out this
inorganic fraction. Carbonates were assessed using the same high-temperature combustion
Shimadzu TOC machine with a 1.0-M HCl solution; however no carbonates were detected and
all C values presented can be considered representative of organic C.
26
Permanganate oxidizable carbon (POXC) was performed according to the method of
Weil et al. (2003) in which 0.02-M KMnO4 is used. This methodology was developed by Weil et
al. (2003) as a sensitive analysis to capture a representative portion of active soil carbon that is
most influenced by management, as opposed to the method developed by Blair et al. (1995),
which attempts to capture and define the entire active carbon pool using a more concentrated
permanganate solution. Additionaly, the method developed by Weil et al., (2003) is available in
a field kit version, making this a low cost and highly accessible soil property to meaasure. This
procedure was performed in triplicate on 2.5-g oven-dry weight equivalent soil that was air
dried for 24 hours and sieved to 2.0 mm. Absorbance was measured on a Spectra Max M2
single cuvette reader set at 550 nm as recommended by Weil et al. (2003).
Mineralizable Carbon Potential
Measurement of carbon mineralization (Cmin) from re-wetted soils was performed on
laboratory-incubated soil in triplicate as a measure of active carbon and soil microbial activity.
Soils were oven dried at 40oC for 24 hours then sieved to 2.0 mm (Haney et al., 2008).
Processed soils were then packed to a dry bulk density of 1.0 g cm-3 in 40-ml glass vials with
rubber top septa through which gas samples were collected using a syringe and needle at the
designated times. Prior to bringing samples to field capacity, they were covered with a
breathable film which allows oxygen exchange while preventing moisture loss and incubated at
20oC for 24 hours. After this incubation time, water was added to bring samples to field
capacity (estimated at 25% water content for Kambitsch, PCFS, Pendleton, and Moro and 20%
for Prosser), which was designated as time zero. Gas samples were collected at 24 hours, and
3, 7, 10, 17, and 24 days. At these sampling times, vials with soils at field capacity were flushed
27
with a breathing-air mixture containing approximately 200-ppm CO2, and gas samples were
collected immediately after flushing on every tenth sample and two hours after flushing from
every sample. The CO2 evolution rate was calculated as the difference between average time
zero CO2 and CO2 measured at two hours (McLauchlan and Hobbie, 2004). Samples were run
on a Shimadzu gas chromatograph equipped with an automated valve system for routing gas
samples to the electron capture (ECD) and flame ionization (FID) detectors.
Statistical Analysis
Treatment effects on soil properties were analyzed using General Linear Model in SAS
System for Windows Version 9.3 (SAS Institute, 2012) and means were separated using Fisher’s
protected Least Significant Difference (LSD) test at the p = 0.10 level. Within a site, sources of
variation in the statistical model were field (block) and agroecosystem treatment. Tukey’s
mean separation procedure was used to identify significant differences when the global F-test
was non-significant (p > 0.10). Cumulative Cmin values were analyzed using mixed models with
repeated measures (SAS Institute, 2012). Unless specifically stated otherwise, all statistical
differences represent p < 0.10. In performing multivariate analysis, model entry was also set at
p < 0.10. A less rigorous alpha was selected for this study due to both the short management
histories associated with some of the sites (Table 1.1) and the inherent spatial variability of
many of the soil C and N properties measured. In consideration of these two factors, an alpha
of 0.10 was considered a judicious step towards minimizing type II errors (failing to reject a
false null hypothesis).
28
RESULTS AND DISCUSSION
Soil C and N Relationships
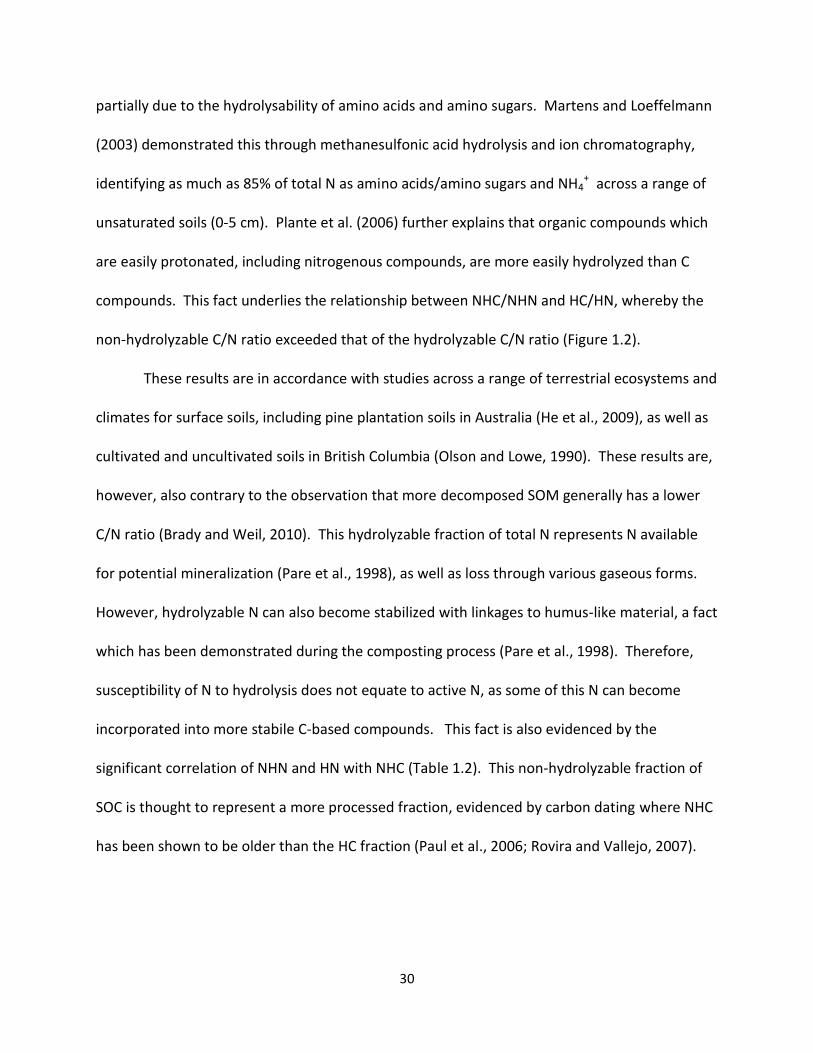
A high degree of correlation exists between many of the measured soil C and N
properties (Table 1.2). One-day Cmin was significantly correlated with 24-day Cmin (r = 0.70),
suggesting that short-term Cmin can be extrapolated to gauge the active organic carbon pool
and associated processes, particularly nutrient cycling and decomposition capacity
(Franzluebbers et al., 2000). Similarly, Franzluebbers et al. (2000) dound that 3-day Cmin was
as effective as Cmin after 24 days, MBC, and SOC at identifying significant changes resulting
from management practices. Other researchers have found a strong correlation across a range
of conditions between Cmin data and other measures of active C, particularly MBC (r = 0.93)
(Franzluebbers et al., 2000); the correlation in our study was significant, albeit weaker (r = 0.31)
(Table 1.5).
A less pronounced correlation of Cmin with MBC than was cited in the literature could
be due to differences in methodology. In Franzluebbers et al. (2000), soil microbial biomass
was determined by chloroform fumigation followed by ten days of incubation, which is more
similar to Cmin measurements than the chloroform-fumigation-extraction method employed in
this study, in which microbial biomass was measured separately from Cmin. Haney et al. (2008)
noted a significant relationship between one-day Cmin and WEOC (r2 = 0.76) and WEON (r2 =
0.86); this relationship between one-day Cmin and the water extractable fraction of soil C and
N, however, was not significant in the present study (Table 1.2). This finding indicates that
Cmin may have been fueled by additional sources of C and N than just the water extractable
29
fraction of soil C and N, or vice-versa, that WEOC and WEON contained constituents in addition
to that which fueled one-day Cmin.
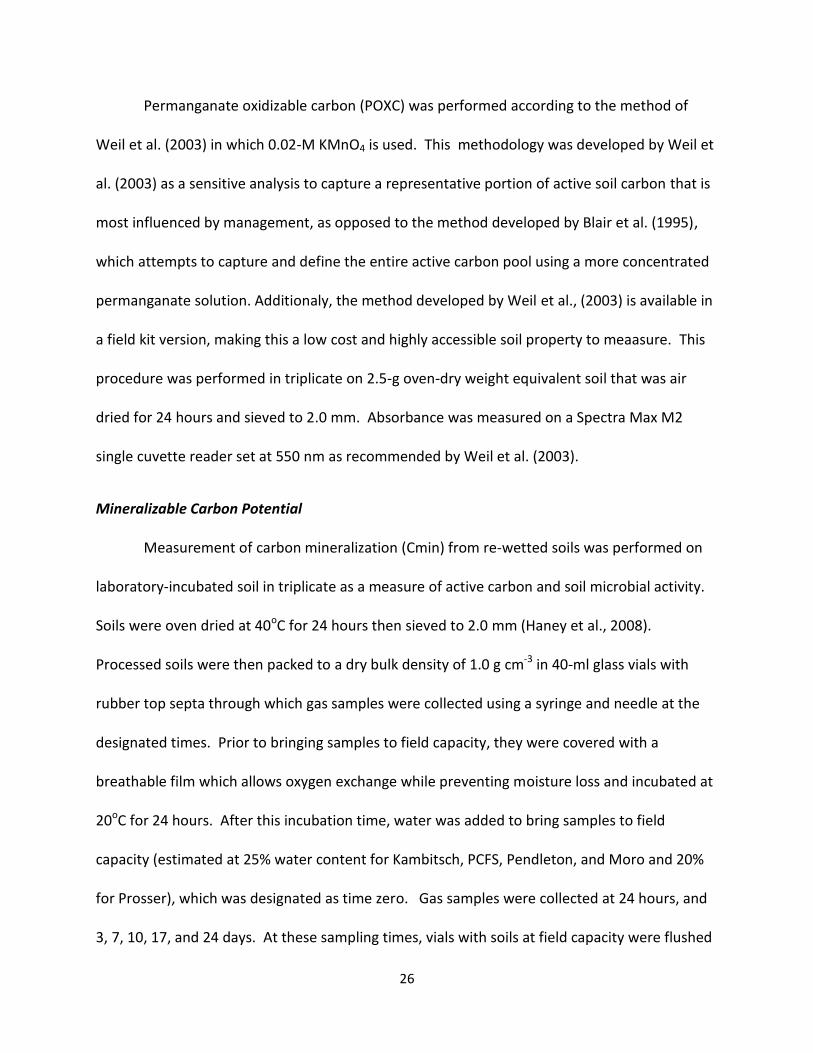
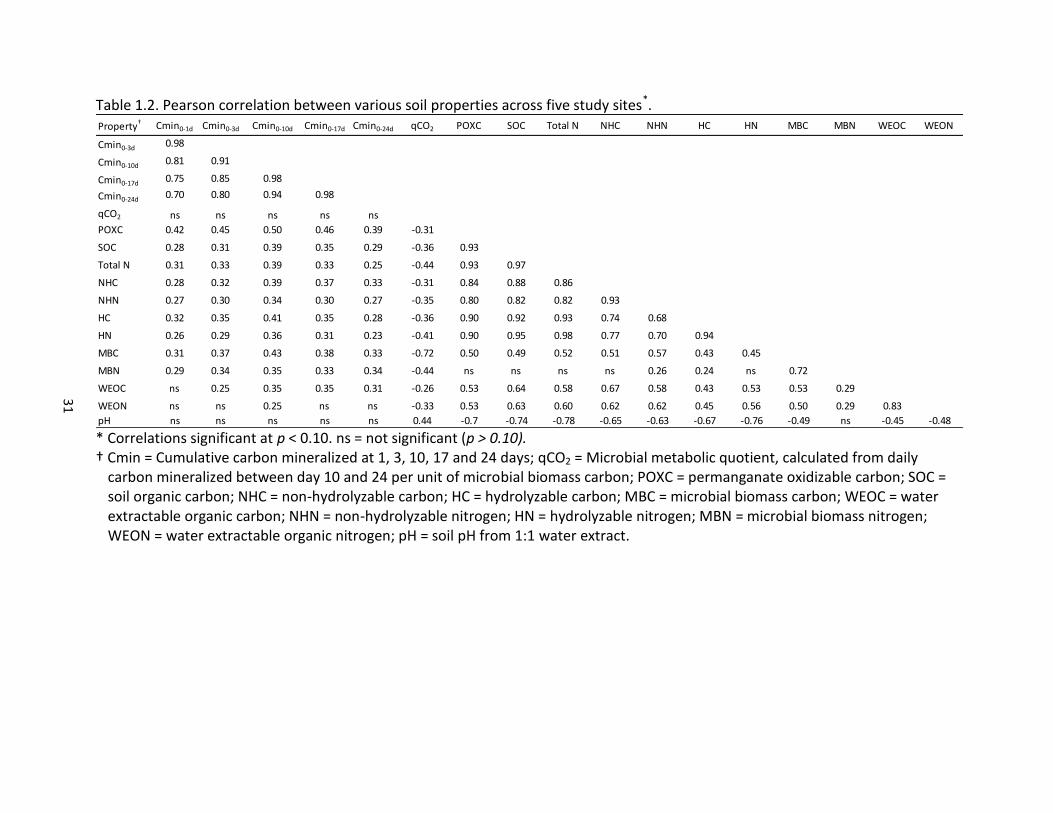
Across all study sites, POXC was strongly correlated with multiple soil properties,
including SOC and total N, as well as with the hydrolyzable and non-hydrolyzable fractions of
SOC and total N (Table 1.2, Figure 1.1). Others have demonstrated a comparable relationship
between POXC and SOC (Culman et al., 2012; Lucas and Weil, 2012; Culman et al., 2013); to the
authors’ knowledge, however, nowhere in the literature has this relationship between POXC
and results of acid hydrolysis been noted.
The relationship between POXC and the more highly active pools of C and N, as
represented by Cmin, microbial biomass, and WEOC and WEON, was not as strongly correlated
(Table 1.2, Figure 1.1). In corn, soybean and wheat rotations in Michigan Culman et al. (2013)
found poor correlations between POXC and one-day Cmin, and concluded that the two
measurements responded differently to management. POXC was more influenced by stabilized
C inputs, while Cmin was more influenced by substrate diversity.
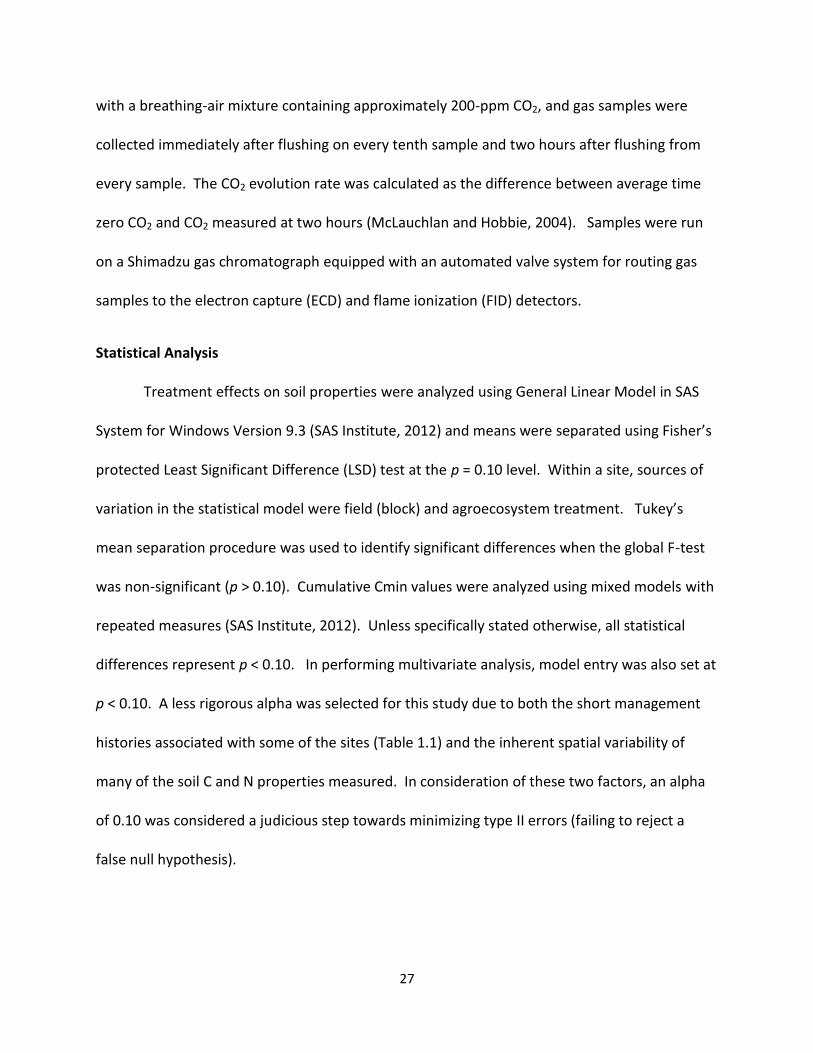
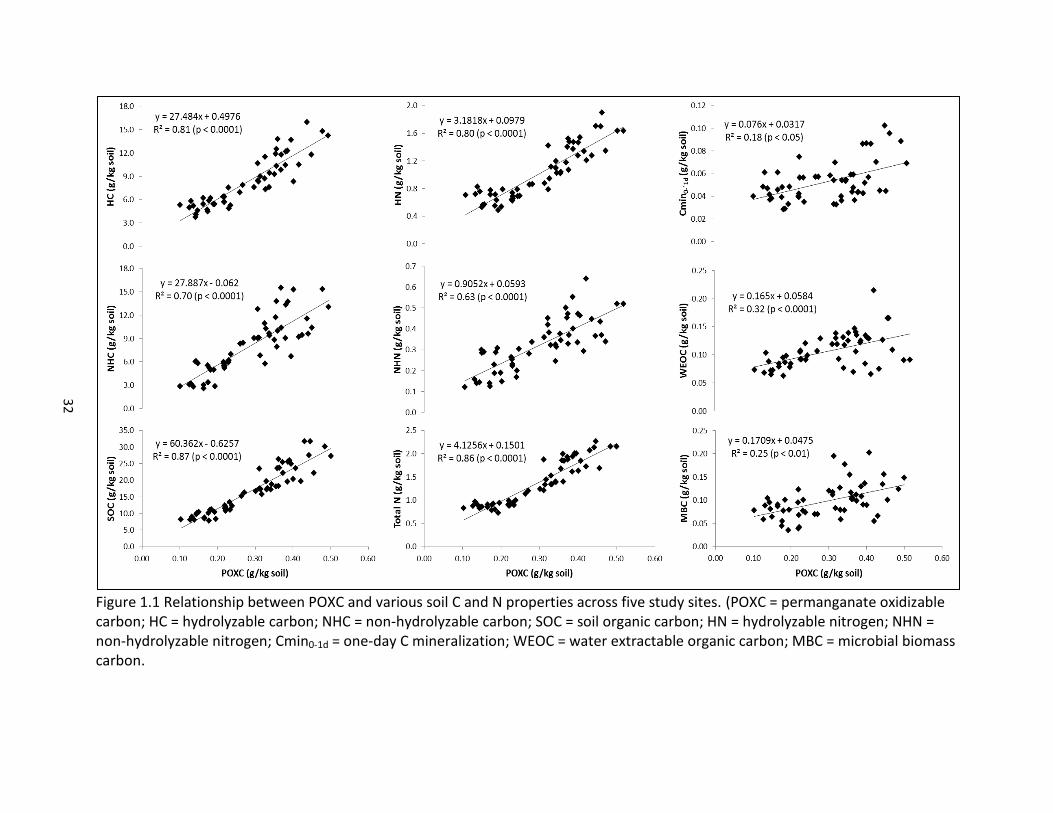
The slope for the C/N regression line for the most labile soil C and N pools, the water
extractable and microbial biomass fractions, was similar. This relationship is representative of
the active nature of these constituents of SOM, which is also indicated by the significant
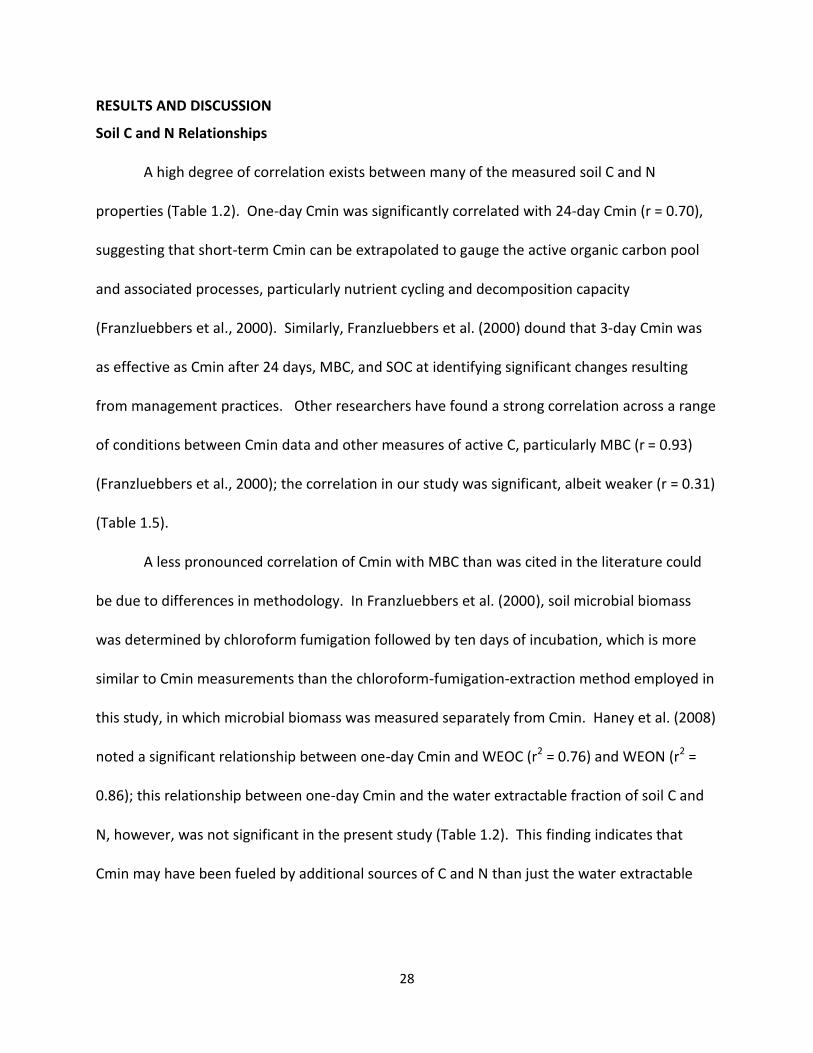
correlation between these properties (Figure 1.2, Table 1.2). The slope of the regression line
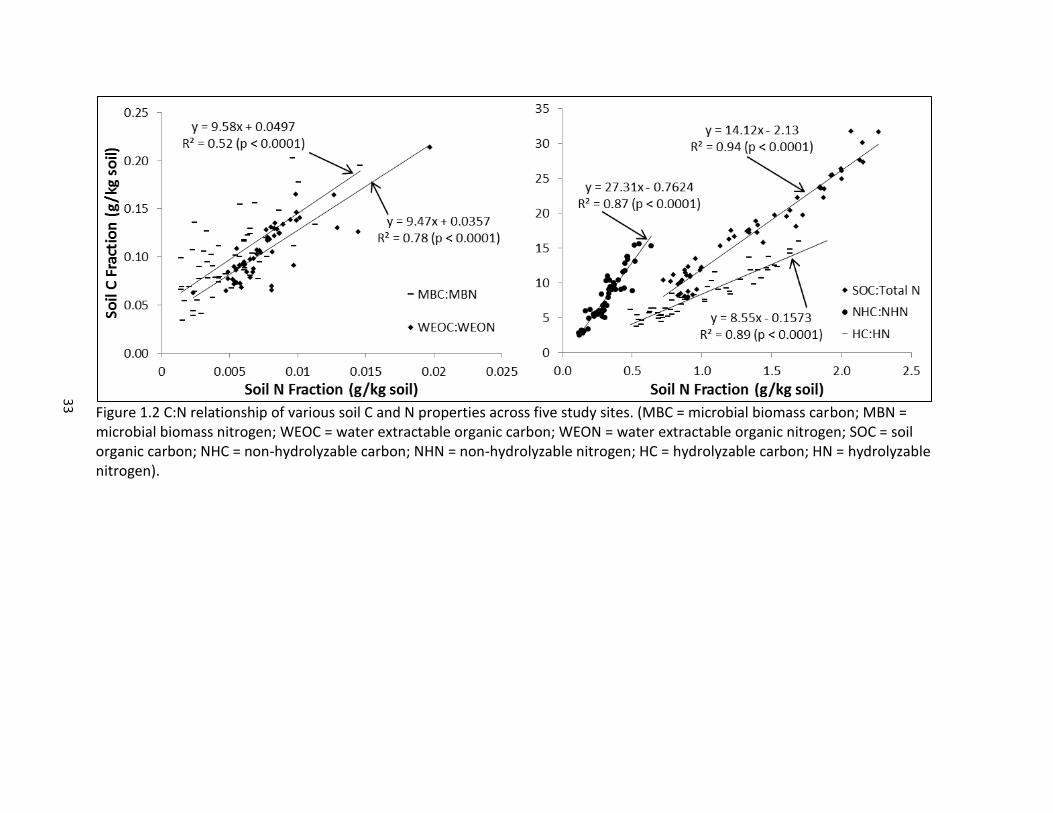
for the non-hydrolyzable fraction of SOC exceeded the fraction of total N that was non-
hydrolyzable N (Figure 1.3).
Olson and Lowe (1990) found similar results in cultivated soils and concluded that
nitrogenous organic compounds were more susceptible to hydrolysis than SOM as a whole,
30
partially due to the hydrolysability of amino acids and amino sugars. Martens and Loeffelmann
(2003) demonstrated this through methanesulfonic acid hydrolysis and ion chromatography,
identifying as much as 85% of total N as amino acids/amino sugars and NH4+ across a range of
unsaturated soils (0-5 cm). Plante et al. (2006) further explains that organic compounds which
are easily protonated, including nitrogenous compounds, are more easily hydrolyzed than C
compounds. This fact underlies the relationship between NHC/NHN and HC/HN, whereby the
non-hydrolyzable C/N ratio exceeded that of the hydrolyzable C/N ratio (Figure 1.2).
These results are in accordance with studies across a range of terrestrial ecosystems and
climates for surface soils, including pine plantation soils in Australia (He et al., 2009), as well as
cultivated and uncultivated soils in British Columbia (Olson and Lowe, 1990). These results are,
however, also contrary to the observation that more decomposed SOM generally has a lower
C/N ratio (Brady and Weil, 2010). This hydrolyzable fraction of total N represents N available
for potential mineralization (Pare et al., 1998), as well as loss through various gaseous forms.
However, hydrolyzable N can also become stabilized with linkages to humus-like material, a fact
which has been demonstrated during the composting process (Pare et al., 1998). Therefore,
susceptibility of N to hydrolysis does not equate to active N, as some of this N can become
incorporated into more stabile C-based compounds. This fact is also evidenced by the
significant correlation of NHN and HN with NHC (Table 1.2). This non-hydrolyzable fraction of
SOC is thought to represent a more processed fraction, evidenced by carbon dating where NHC
has been shown to be older than the HC fraction (Paul et al., 2006; Rovira and Vallejo, 2007).
31
Table 1.2. Pearson correlation between various soil properties across five study sites*.
* Correlations significant at p < 0.10. ns = not significant (p > 0.10). † Cmin = Cumulative carbon mineralized at 1, 3, 10, 17 and 24 days; qCO2 = Microbial metabolic quotient, calculated from daily
carbon mineralized between day 10 and 24 per unit of microbial biomass carbon; POXC = permanganate oxidizable carbon; SOC = soil organic carbon; NHC = non-hydrolyzable carbon; HC = hydrolyzable carbon; MBC = microbial biomass carbon; WEOC = water extractable organic carbon; NHN = non-hydrolyzable nitrogen; HN = hydrolyzable nitrogen; MBN = microbial biomass nitrogen; WEON = water extractable organic nitrogen; pH = soil pH from 1:1 water extract.
Property† Cmin0-1d Cmin0-3d Cmin0-10d Cmin0-17d Cmin0-24d qCO2 POXC SOC Total N NHC NHN HC HN MBC MBN WEOC WEON
Cmin0-3d 0.98
Cmin0-10d 0.81 0.91
Cmin0-17d0.75 0.85 0.98
Cmin0-24d 0.70 0.80 0.94 0.98
qCO2 ns ns ns ns ns
POXC 0.42 0.45 0.50 0.46 0.39 -0.31
SOC 0.28 0.31 0.39 0.35 0.29 -0.36 0.93
Total N 0.31 0.33 0.39 0.33 0.25 -0.44 0.93 0.97
NHC 0.28 0.32 0.39 0.37 0.33 -0.31 0.84 0.88 0.86
NHN 0.27 0.30 0.34 0.30 0.27 -0.35 0.80 0.82 0.82 0.93
HC 0.32 0.35 0.41 0.35 0.28 -0.36 0.90 0.92 0.93 0.74 0.68
HN 0.26 0.29 0.36 0.31 0.23 -0.41 0.90 0.95 0.98 0.77 0.70 0.94
MBC 0.31 0.37 0.43 0.38 0.33 -0.72 0.50 0.49 0.52 0.51 0.57 0.43 0.45
MBN 0.29 0.34 0.35 0.33 0.34 -0.44 ns ns ns ns 0.26 0.24 ns 0.72
WEOC ns 0.25 0.35 0.35 0.31 -0.26 0.53 0.64 0.58 0.67 0.58 0.43 0.53 0.53 0.29
WEON ns ns 0.25 ns ns -0.33 0.53 0.63 0.60 0.62 0.62 0.45 0.56 0.50 0.29 0.83
pH ns ns ns ns ns 0.44 -0.7 -0.74 -0.78 -0.65 -0.63 -0.67 -0.76 -0.49 ns -0.45 -0.48
32
Figure 1.1 Relationship between POXC and various soil C and N properties across five study sites. (POXC = permanganate oxidizable carbon; HC = hydrolyzable carbon; NHC = non-hydrolyzable carbon; SOC = soil organic carbon; HN = hydrolyzable nitrogen; NHN = non-hydrolyzable nitrogen; Cmin0-1d = one-day C mineralization; WEOC = water extractable organic carbon; MBC = microbial biomass carbon.
33
Figure 1.2 C:N relationship of various soil C and N properties across five study sites. (MBC = microbial biomass carbon; MBN = microbial biomass nitrogen; WEOC = water extractable organic carbon; WEON = water extractable organic nitrogen; SOC = soil organic carbon; NHC = non-hydrolyzable carbon; NHN = non-hydrolyzable nitrogen; HC = hydrolyzable carbon; HN = hydrolyzable nitrogen).
34
Figure 1.3 Relationship between non-hydrolyzable C and N and SOC and Total N across five study sites. (SOC = soil organic carbon; NHC = non-hydrolyzable carbon; NHN = non-hydrolyzable nitrogen).
35
Mean Annual Temperature and Precipitation Influence on Soil C and N
The four non-irrigated sites selected for this study span a mean annual precipitation
(MAP) gradient that increases by 130% from Moro (288 mm) to Kambitsch (663 mm), and a
mean annual temperature (MAT) gradient that increases by 23% from PCFS (8.4oC) to
Pendleton (10.3oC). The Prosser site was excluded from this analysis because it is an irrigated
site. The MAT and MAP gradients across the site locations considered collectively were used to
assess the impact of these climate variables on soil C and N properties.
Across the four dryland cropping sites, POXC, SOC, total N, HC, NHC, HN, and NHN were
positively correlated with MAP and negatively correlated with MAT (Table 1.3). In a multivariate
analysis of climate along with management variables, MAP explained 57% and 69% respectively
of the variation in SOC and total N. If MAP is removed from the model, MAT becomes the
dominant significant variable, explaining 42% of SOC variation and 49% of total N variation
(Table 1.4).
The hydrolyzable and non-hydrolyzable fractions of soil C and N are subject to a similar
influence by MAP and MAT as SOC and total N (Table 1.4). MAP explains 50% of NHC variation,
55% of NHN variation, and a slightly greater percent of variation in the hydrolyzable fraction,
explaining 57% of HC variation and 63% of HN variation (Table 1.4). As with SOC and total N, if
MAP is removed from the model, MAT becomes the significant factor in explaining the variation
in the hydrolyzable and non-hydrolyzable fractions of SOC and total N. As already presented,
POXC is strongly correlated with SOC, total N, as well as the hydrolyzable and non-hydrolyzable
fractions, and it follows that POXC is similarly influenced by climate variables (Tables 1.3 and
1.4).
36
The more active soil properties measured in this study, including WEON, MBC, and one-
day Cmin, were positively correlated with MAP, while only WEON along with WEOC displayed a
significant correlation with MAT (Table 1.3). The microbial metabolic quotient (qCO2) is an
indicator of microbial efficiency, whereby an increase in qCO2 indicates a decrease in microbial
efficiency (Smith et al., 2002). In the present study, qCO2 displayed a negative relationship
with MAP (Table 1.3), indicating a decrease in MAP was associated with a decrease in microbial
efficiency. MAP was also an important factor, more so than management factors, in explaining
the variation in MBC (r2 = 0.22), one-day Cmin (r2 = 0.12), qCO2 (r2 = 0.26), and WEON (r2 = 0.14).
Variation in MBN was not explained by management or climate factors (Table 1.4). When MAP
was removed from the model, MAT was not a signficant variable in explaining variation in these
more active soil properties (Table 1.4).
This multivariate analysis of climate along with management indicates that soil C and N
of surface soils within the scale covered by this study were influenced by MAP and MAT more
so than STIR and cropping intensity. Similar results were found by Colman and Schimel (2013),
who found that on a continental scale across 84 different soils, mean annual precipitation and
temperature could explain 60% of the observed variation in SOC.
In the inland Pacific Northwest, future climate scenarios predict rising mean annual
temperatures and precipitation (Littell et al., 2009). MAT tends to influence decomposition
more so than productivity where growing degree days are sufficient, while MAP in drier regions
increases productivity, and thus inputs of SOM to the soil, more than it increases
decomposition (Weil and Magdoff, 2004). Similarly, Kirschbaum (2000) demonstrated that net
37
primary productivity was more sensitive to water availability and decomposition more sensitive
to temperature.
This interplay of temperature and precipitation on SOM dynamics is also supported by
studies showing that the ratio of MAT (oC) to MAP (mm x 0.01) (climate ratio) displays a strong
correlation with SOC; SOC levels are highest when this ratio is near one and drops as this value
increases (Weil and Magdoff, 2004). This relationship holds true for the current study as well,
where SOC and total N along with the hydrolyzable and non-hydrolyzable fractions are greatest
at PCFS and Kambitsch, which have a climate ratio nearest 1.0, and these soil properties
decrease as this ratio increases (Figure 1.4).
These figures indicate that a disproportionate rise in MAT uncoupled from a rise in MAP
would result in slow degradation of surface SOM across the region. For the inland PNW,
climate models predict a 1.7oC to 2.2oC rise in MAT by 2050 and a 2.2oC to 3.6oC rise in MAT by
2100, and correspondingly 5 to 15% rise in MAP by the middle and latter part of the 21st
century (REACCH, 2014). Applying the extremes of these climate predictions to present day
climate ratios results in an increase in climate ratios across the study sites, and subsequently a
decline in average SOC and total N across the region for 2050 and 2100 (Figure 1.5); for
example, SOC for 2050 and 2100 at Pendleton, based on forecasted shifts in MAT and MAP, is
8.4% and 10.1% respectively below the present day average for Pendleton across treatments
(Figure 1.5).
While this prediction demonstrates the susceptibility of SOM to climate change,
understanding how SOM pools of different turnover times are impacted by climate variables is
an important part of predicting SOM dynamics under future climate scenarios. Plante et al.
38
(2010) demonstrated temperature sensitivity of SOM resistant to acid hydrolysis as well as the
particulate organic matter fraction, typically considered labile C, to decomposition under
elevated temperatures. This is supported by results from the present study, where the
hydrolyzable and non-hydrolyzable fractions of SOM were sensitive to MAT (Tables 1.3 and
1.4), and further supports that chemical recalcitrance alone does not explain residence times of
SOC (Conant et al., 2011). Lefevre et al. (2014) demonstrated in an analysis of long-term bare-
fallow soils that SOM pools with longer turnover times exhibited greater temperature
sensitivity than SOM pools with shorter turnover times, as would be indicated by enzyme
kinetic theory which dictates greater temperature sensitivity of more recalcitrant compounds
(Davidson and Janssens, 2006).
Drawing similar conclusions from the present study is complicated by the fact that MAP
and MAT are confounded across the four dryland sites. Enzyme kinetic theory (Davidson and
Janssens, 2006) and results from Lefevre et al. (2013), however, support results in the present
study wherein pools with the shortest turnover times, namely MBC, MBN, and one-day Cmin
did not display sensitivity to the MAT gradient, while pools known for a longer turnover time,
namely SOC, total N, and the hydrolyzable and non-hydrolyzable fractions, did display a
temperature sensitivity (Table 1.3 and 1.4). However, this can also be explained by the
achievement of a steady state prior to performing MBC, MBN, and Cmin incubations, as soils
were incubated for at least 24 hours at room temperature prior to analyses, thus minimizing
the influence of MAT. Likewise, incubating soils over short periods under different
temperatures has shown greater sensitivity to temperature than soils under steady state
(Conant et al., 2011).
39
Due to the confounded nature of MAT and MAP in the present study, utilizing the
climate ratio can provide insight regarding climate sensitivity and soil C and N turnover time. A
comparison of the hydrolyzable and non-hydrolyzable fractions of SOC with the climate ratio
reveals that the NHC fraction, which is understood to have a longer turnover time than the HC
fraction (Paul et. al, 2006, Rovira and Vallejo, 2007), did not display a greater sensitivity to the
climate ratio than the HC fraction. This is indicated similarity (p > 0.10) between the slopes of
the regression line of NHC and HC with the climate ratio (Figure 1.4). The HN fraction,
composed primarily of amino acids and amino sugars (Martens and Loeffelmann, 2003),
however did display greater sensitivity to the climate ratio than the NHN fraction (Figure 1.4).
This is consistent with the previous discussion of HN, in which it was established that a portion
of HN may be stabilized by the presence of more processed material, such as NHC, and
therefore a decline in NHC leads to a decline in HN (Figure 1.4), and is also the result of soil C/N
ratios established through microbial activity.
Conant et al. (2011) reviewed multiple cross-site studies spanning a temperature
gradient and found three different categories of relationship between SOM, turnover time, and
temperature sensitivity: 1) three studies reported temperature sensitivity increased with a
decrease in SOM turnover time; 2) eight studies reported no apparent relationship between
temperature and SOM turnover time; and 3) one study reported temperature sensitivity
increased with an increase in SOM turnover time. These varying results in published studies
demonstrate the complexity of factors involved in understanding how SOM pools with varying
turnover times will respond to a changing climate. The present study incorporates both MAT
40
and MAP and indicates based on NHC and HC results, no apparent relationship between
turnover time and the climate ratio, MAT/MAP x 0.01.
Studies utilizing carbon isotope measurements and radiocarbon dating can also prove
insightful for understanding the fate of SOM under conditions that promote increased
decomposition. Balesdent et al. (1990) evaluated C4 abundance of SOC under no-till maize 18
years after conversion from grassland and found that 83% of the SOC within the upper 400 kg
m-2 soil was derived from the original grassland, suggesting that annual inputs from agriculture
to the slower SOM pool compared to that from the native grassland were minimal. Similarly, in
an analysis of the source of SOC in a forest soil that had been cleared and cultivated for 35
years under fertilized, continuous maize with biomass returned to the soil, Poirier (2006) found
that the NHC of the cultivated soil within the tilled layer not only decreased with cultivation by
65%, but 92% of NHC was inherited from forest C prior to cultivation. The results from these
two studies are likely the outcome of a reduction in quantity of SOM input, a decrease in
recalcitrant inputs, and/or an increase in disturbance or erosion resulting from a switch from
native conditions to agricultural conditions (Hassink, 1997; Huggins et al., 1998; Krull et al.,
2003). These studies also demonstrate that a loss of SOM, particularly the fraction with a
longer turnover time, resulting from an increase in decomposition may not be easily replaced
under traditional cropping systems. Subsequently, an increase in C and N inputs, as may result
from an increase in precipitation, is only a component in countering loss of biochemically
recalcitrant SOM that can result from an increase in decomposition.
Constraints other than intrinsic chemical recalcitrance are also an important
consideration in SOM turnover, most notably physico-chemical and physical stabilization (Krull
41
et al., 2003). In interpretation of continental SOC and microbial respiration, Colman and
Schimel (2013) theorized that as SOM pools increase, microbes are less capable of decomposing
a constant proportion of the increasing total SOM. This is at least partly due to spatial
separation of microbes from increasingly protected SOM, which diminishes microbial capacity
to degrade SOM. The inverse of this statement indicates that regions with lower SOM will be
inherently more susceptible to SOM degradation under an increase in temperature. Physical
protection of SOM through promotion of management strategies conducive to micro- and
macroaggregate formation is crucial to protecting and/or building SOM under climate change.
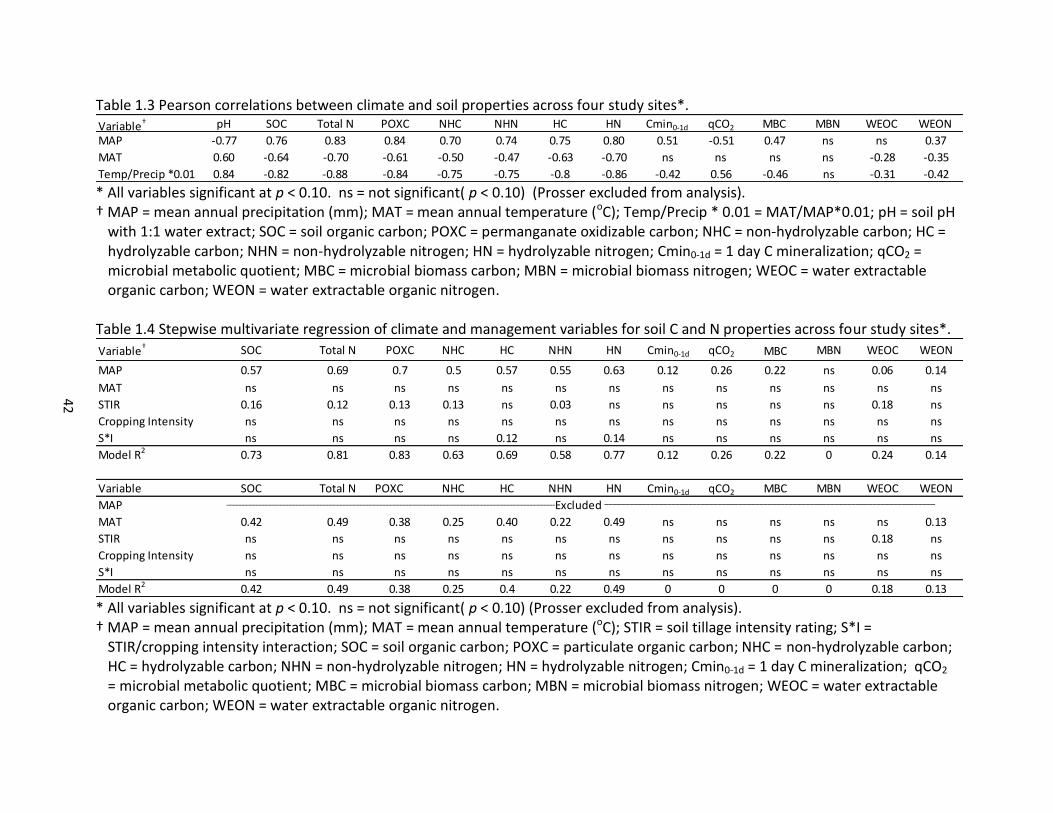
42
Table 1.3 Pearson correlations between climate and soil properties across four study sites*.
* All variables significant at p < 0.10. ns = not significant( p < 0.10) (Prosser excluded from analysis). † MAP = mean annual precipitation (mm); MAT = mean annual temperature (oC); Temp/Precip * 0.01 = MAT/MAP*0.01; pH = soil pH
with 1:1 water extract; SOC = soil organic carbon; POXC = permanganate oxidizable carbon; NHC = non-hydrolyzable carbon; HC = hydrolyzable carbon; NHN = non-hydrolyzable nitrogen; HN = hydrolyzable nitrogen; Cmin0-1d = 1 day C mineralization; qCO2 = microbial metabolic quotient; MBC = microbial biomass carbon; MBN = microbial biomass nitrogen; WEOC = water extractable organic carbon; WEON = water extractable organic nitrogen.
Table 1.4 Stepwise multivariate regression of climate and management variables for soil C and N properties across four study sites*.
* All variables significant at p < 0.10. ns = not significant( p < 0.10) (Prosser excluded from analysis). † MAP = mean annual precipitation (mm); MAT = mean annual temperature (oC); STIR = soil tillage intensity rating; S*I =
STIR/cropping intensity interaction; SOC = soil organic carbon; POXC = particulate organic carbon; NHC = non-hydrolyzable carbon; HC = hydrolyzable carbon; NHN = non-hydrolyzable nitrogen; HN = hydrolyzable nitrogen; Cmin0-1d = 1 day C mineralization; qCO2 = microbial metabolic quotient; MBC = microbial biomass carbon; MBN = microbial biomass nitrogen; WEOC = water extractable organic carbon; WEON = water extractable organic nitrogen.
Variable† pH SOC Total N POXC NHC NHN HC HN Cmin0-1d qCO2 MBC MBN WEOC WEON
MAP -0.77 0.76 0.83 0.84 0.70 0.74 0.75 0.80 0.51 -0.51 0.47 ns ns 0.37
MAT 0.60 -0.64 -0.70 -0.61 -0.50 -0.47 -0.63 -0.70 ns ns ns ns -0.28 -0.35
Temp/Precip *0.01 0.84 -0.82 -0.88 -0.84 -0.75 -0.75 -0.8 -0.86 -0.42 0.56 -0.46 ns -0.31 -0.42
Variable† SOC Total N POXC NHC HC NHN HN Cmin0-1d qCO2 MBC MBN WEOC WEON
MAP 0.57 0.69 0.7 0.5 0.57 0.55 0.63 0.12 0.26 0.22 ns 0.06 0.14
MAT ns ns ns ns ns ns ns ns ns ns ns ns ns
STIR 0.16 0.12 0.13 0.13 ns 0.03 ns ns ns ns ns 0.18 ns
Cropping Intensity ns ns ns ns ns ns ns ns ns ns ns ns ns
S*I ns ns ns ns 0.12 ns 0.14 ns ns ns ns ns ns
Model R2 0.73 0.81 0.83 0.63 0.69 0.58 0.77 0.12 0.26 0.22 0 0.24 0.14
Variable SOC Total N POXC NHC HC NHN HN Cmin0-1d qCO2 MBC MBN WEOC WEON
MAP
MAT 0.42 0.49 0.38 0.25 0.40 0.22 0.49 ns ns ns ns ns 0.13
STIR ns ns ns ns ns ns ns ns ns ns ns 0.18 ns
Cropping Intensity ns ns ns ns ns ns ns ns ns ns ns ns ns
S*I ns ns ns ns ns ns ns ns ns ns ns ns ns
Model R2 0.42 0.49 0.38 0.25 0.4 0.22 0.49 0 0 0 0 0.18 0.13
__________________________________________________________________________________________________Excluded _______________________________________________________________________________
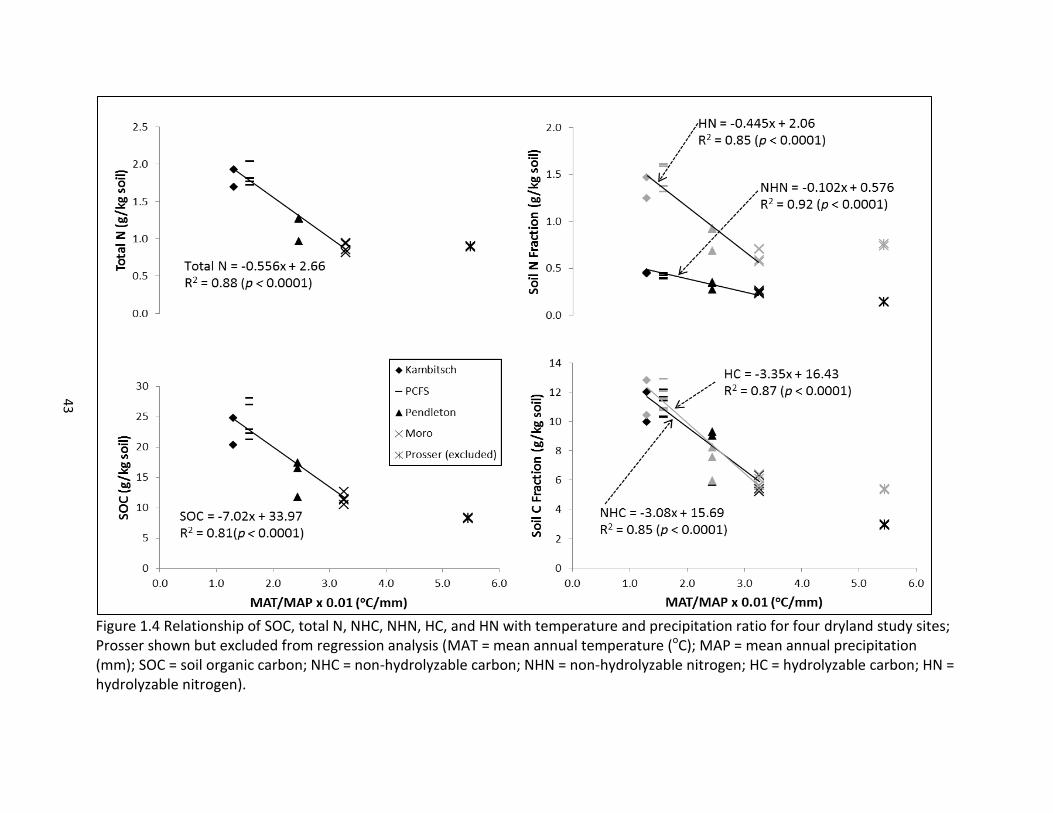
43
Figure 1.4 Relationship of SOC, total N, NHC, NHN, HC, and HN with temperature and precipitation ratio for four dryland study sites; Prosser shown but excluded from regression analysis (MAT = mean annual temperature (oC); MAP = mean annual precipitation (mm); SOC = soil organic carbon; NHC = non-hydrolyzable carbon; NHN = non-hydrolyzable nitrogen; HC = hydrolyzable carbon; HN = hydrolyzable nitrogen).
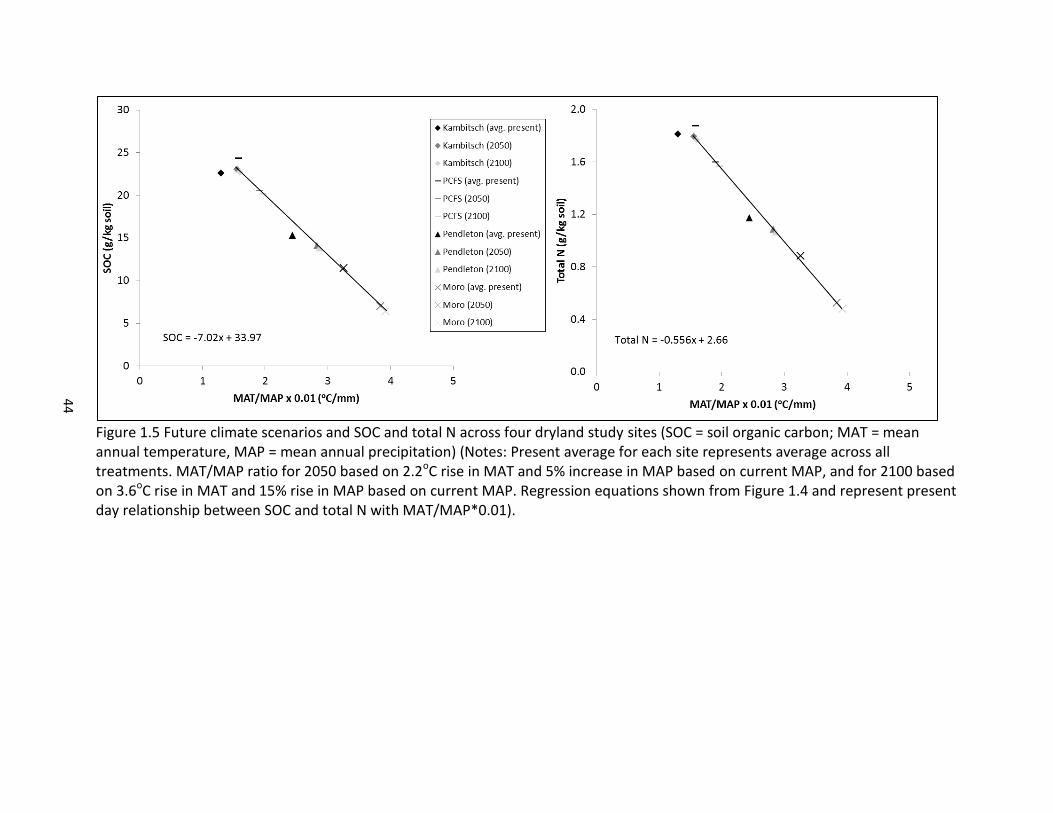
44
Figure 1.5 Future climate scenarios and SOC and total N across four dryland study sites (SOC = soil organic carbon; MAT = mean annual temperature, MAP = mean annual precipitation) (Notes: Present average for each site represents average across all treatments. MAT/MAP ratio for 2050 based on 2.2oC rise in MAT and 5% increase in MAP based on current MAP, and for 2100 based on 3.6oC rise in MAT and 15% rise in MAP based on current MAP. Regression equations shown from Figure 1.4 and represent present day relationship between SOC and total N with MAT/MAP*0.01).
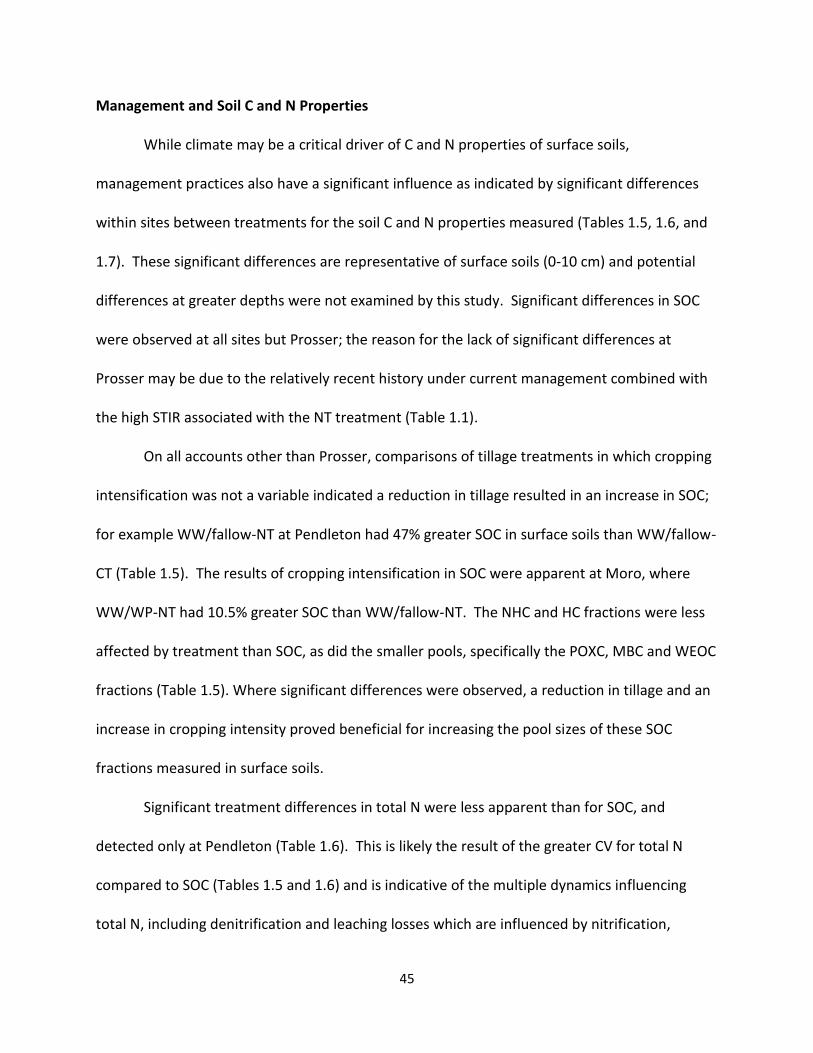
45
Management and Soil C and N Properties
While climate may be a critical driver of C and N properties of surface soils,
management practices also have a significant influence as indicated by significant differences
within sites between treatments for the soil C and N properties measured (Tables 1.5, 1.6, and
1.7). These significant differences are representative of surface soils (0-10 cm) and potential
differences at greater depths were not examined by this study. Significant differences in SOC
were observed at all sites but Prosser; the reason for the lack of significant differences at
Prosser may be due to the relatively recent history under current management combined with
the high STIR associated with the NT treatment (Table 1.1).
On all accounts other than Prosser, comparisons of tillage treatments in which cropping
intensification was not a variable indicated a reduction in tillage resulted in an increase in SOC;
for example WW/fallow-NT at Pendleton had 47% greater SOC in surface soils than WW/fallow-
CT (Table 1.5). The results of cropping intensification in SOC were apparent at Moro, where
WW/WP-NT had 10.5% greater SOC than WW/fallow-NT. The NHC and HC fractions were less
affected by treatment than SOC, as did the smaller pools, specifically the POXC, MBC and WEOC
fractions (Table 1.5). Where significant differences were observed, a reduction in tillage and an
increase in cropping intensity proved beneficial for increasing the pool sizes of these SOC
fractions measured in surface soils.
Significant treatment differences in total N were less apparent than for SOC, and
detected only at Pendleton (Table 1.6). This is likely the result of the greater CV for total N
compared to SOC (Tables 1.5 and 1.6) and is indicative of the multiple dynamics influencing
total N, including denitrification and leaching losses which are influenced by nitrification,
46
denitrification, and immobilization (Luxhoi et al., 2006). At Pendleton, the NHN and HN
fractions were 26% and 34%, respectively, greater under NT than for CT, while cropping
intensification under NT did not significantly influenced these fractions. At Moro, however,
cropping intensification under NT, represented by WW/WP-NT, did have 20% greater HN than
WW/fallow NT, while tillage without cropping intensification did not significantly influence HN
(Table 1.6). Significant differences in MBN were detected only at Moro, where an increase in
cropping intensity with WP under NT resulted in 123% greater MBN than WW/fallow-CT
cropping. WEON varied significantly by treatment at both Moro and Pendleton, where CVs
were also lower than at other sites (Table 1.5). At Moro, NT without cropping intensification
resulted in 16% greater WEON than CT, and at Pendleton, 60% greater WEON under NT than
CT. At Moro, cropping intensification with WP under NT also resulted in significantly greater
WEON than WW/fallow NT cropping (Table 1.5).
Significant differences in cumulative Cmin between treatments increased with
increasing incubation time (Table 1.6). At day one, significant differences in Cmin were
detected only at Pendleton, whereas at 24 days, significant differences in Cmin were detected
at all sites but Prosser. At all sites where significant differences were observed, the greatest
values for each site at one-day Cmin persisted so that they also had the greatest values for 24-
day Cmin, and similarly for the lowest values, indicating that trends established after one-day
readings persist through longer incubation periods, and in some instances result in significant
differences.
This trend is also indicated by the significant relationship between one-day Cmin and 24-
day Cmin already discussed. Where significant differences were observed at 24 days, NT
47
consistently had higher Cmin than CT, regardless of cropping intensity (Table 1.5). Cropping
intensification under NT also resulted in significantly greater 24-day Cmin than less intensely
cropped systems under NT; the exception to this was PCFS where NT annual cropping systems
had significantly greater 24-day Cmin than perennial cropping systems. The microbial
metabolic quotient varied significantly by treatment only at PCFS and Moro (Table 1.5). At PCFS
significant differences in qCO2 overlapped between perennial and annual cropping systems;
however, the perennial cropping systems were lower, indicating greater microbial efficiency.
Similarly, at Moro, significantly lower qCO2 values were observed for more intensely
cropped/diversified systems under NT.
Management and SOM Stabilization and Mineralization
As previously demonstrated, POXC captures a range of information about the soil as it is
highly correlated with overall SOC and N as well as the hydrolyzable and non-hydrolyzable
fractions. Therefore, increasing POXC can be considered indicative of building SOM.
Furthermore, Culman et al. (2012) established that across a range of geographic regions, soil
types, and depth increments, POXC was representative of the processed fraction of SOC,
indicated by its stronger association with the smaller size and higher density fraction of
particulate organic carbon (POC) than with the larger and lighter fraction of POC, concluding
that POXC is indicative of more stabilized SOM. Culman et al. (2013) further supports this
conclusion by showing that POXC was particularly sensitive to compost additions in corn-based
rotations.
In the present study, the association of POXC with stabilized SOM is supported by the
strong correlation between POXC and the non-hydrolyzable and hydrolyzable fractions of SOM
48
(Table 1.2), as all components of SOM are essential for its formation and stabilization (Paul et
al, 2006). POXC, however, is less strongly correlated with Cmin, most notably one-day Cmin
(Table 1.2), an observation which is representative of the highly active fraction of SOM and
indicative of soil microbial activity, nutrient cycling, and decomposition (Franzluebbers et al.,
2000) and has also been shown to be a sensitive predictor of yields in corn rotations (Culman et
al., 2013). A comparison of POXC and one-day Cmin (Figure 1.6) can thus provide important
information about surface soils with regard to the impacts of tillage and cropping intensity on
SOM stabilization and mineralization, and subsequently on surface soil health. The ease and
accessibility of measuring these two soil properties also adds value to this comparison, as
commercialized versions are available that have demonstrated a significant correlation with
laboratory generated data for POXC (r2 = 0.98)( HachTM palm-top calorimeter; Weil et al. 2003)
and one-day Cmin (r2 = 0.82) ( SolvitaTM gel system; Haney et al., 2008).
Placement of values measured in the present study in the context of published values
provides a comparative assessment of soil health within the inland PNW and also helps to
elucidate management impacts on SOM stabilization and mineralization. Reported values for
POXC in surface soils span an almost threefold range, with the highest values reported in
Kansas grasslands and the lowest values reported in cultivated cropland on the East Coast
(Table 1.8). Culman et al. (2012) reports an average value of 626 mg POXC kg-1 soil (±242)
across a range of treatments, depths, and soil types that span the continental United States,
whereas in the present study 292 mg POXC kg-1 soil (±107) was the average value across
treatments for the surface soils tested (Table 1.8). Of course, methodology varies somewhat
across these measurements, particularly with sieving. Weil et al. (2003), however, found the
49
influence of sieving to be minimal in POXC values, noting that crushing aggregates from a
maximum diameter of 2.0 mm down to 0.10 mm increased the amount of POXC 7-12%. In the
present study, samples were sieved to 2-mm. With this is in mind, this comparison of average
POXC values indicates that soils within the dryland PNW are below average in POXC and
subsequently SOM stabilization within surface soils, when compared to available data across a
broad range of conditions.
Correlation of management variables with POXC on a site-by-site basis emphasizes the
importance of reducing tillage intensity in improving SOM stabilization and is demonstrated by
the significant negative correlation between STIR and POXC at 3 of 5 study sites (Table 1.9); at
the other two sites, either there was not a significant STIR gradient, as is the case with PCFS, or
as with Prosser, only two years under tillage treatments was not sufficient time to detect
differences. At Pendleton and Moro, which have both a STIR and cropping intensity gradient
(Table 1.1), NT without cropping intensification resulted in significantly greater POXC than CT,
and at Moro, cropping intensification with a legume further increased POXC significantly within
NT treatments (Table 1.5, Figure 1.6). Subsequently, POXC displayed a significant correlation to
cropping intensity at Moro as well as PCFS; however, the direction of this relationship was
positive at Moro and negative at PCFS.
This negative relationship between POXC and cropping intensity at PCFS is likely the
result of the perennial systems, which were assigned a greater cropping intensity value than the
annual systems (Table 1.1) but also have apparently not provided sufficient aboveground
biomass inputs to exceed the annual systems in POXC or other measures of SOC (Table 1.5).
This condition may be due to fertilization of annual crops at PCFS resulting in greater
50
production of aboveground biomass compared to unfertilized perennial crops. These same
differences, where POXC of annual cropping systems exceeds that of perennial systems, would
likely not be expressed at deeper depths where biomass inputs from roots of perennial crops
generally exceed that of annual crops.
Contrary to these results at PCFS for surface soils, however, published results document
greater POXC values associated with perennial based systems. For example, Culman et al.
(2010), documented 36% greater POXC (0-10 cm) in native grassland compared to a cultivated
wheat-based cropping system and associated this difference with more complex soil food webs
in the native system. In Maryland, Spargo et al. (2011) found that an organically managed
system with cereal rye and hairy vetch as cover crops in a corn-soybean-wheat rotation had
greater POXC than conventionally managed systems, further emphasizing the role of cropping
intensification, along with diversity, in increasing POXC. Mirsky et al. (2008) found that annual
applications of liquid dairy manure applied to meet crop N requirements enhanced POXC in
corn-based rotations and also concluded that crops such as corn and cereal grains with high
C/N ratios and phenolic acids are associated with higher POXC. This latter finding cannot be
substantiated with the present findings because cereal-only rotations did not contain
significantly more POXC than rotations containing a legume, as demonstrated at Moro and PCFS
(Table 1.5, Figure 1.6).
These findings along with the present findings collectively indicate that low disturbance
systems with a diversity of inputs, whether from cover cropping/green manures or soil
amendments applied to meet nutrient requirements, are critical to enhancing POXC and
subsequently SOM stabilization. The significant correlation between POXC and the
51
hydrolyzable and non-hydrolyzable fractions of SOC and total N further supports the need for
diversification, represented by soil amendments, perennials, and legumes, as a diverse cropping
system in theory is better equipped to supply both the recalcitrant and active SOM needed to
increase POXC and enhance SOM stabilization. Due to the dryland cropping nature and
commodity-crop orientation of much of the inland PNW cropland, crop rotation options are
limited. However, in regions where the climate or access to irrigation can support
diversification, inclusion of cover crop/green manures in shoulder seasons or the use of soil
amendments such as manures and composts, along with the continued adoption of no-till
practices, may prove beneficial in improving POXC readings, and subsequently SOM
stabilization.
As with POXC, comparing Cmin values across regions and studies can also provide a
perspective on where soils in the inland PNW reside with regard to what this important soil
property represents from a soil health perspective. Franzluebbers et al. (1996b) reports a range
of one-day Cmin values, summarized from the literature across studies spanning multiple
ecosystems and climates that range from 8.9 to 58.8 mg CO2-C kg-1 soil. In evaluating the
efficacy of a commercialized version of measuring one-day Cmin, Haney et al. (2008) reported
values ranging from less than 10 mg CO2-C kg-1 soil to greater than 100 mg CO2-C kg-1 soil for
soils from 16 states spanning multiple regions of the continental United States; details on the
types of management systems, however, are not reported with these values. In analyzing the
influence of management on Cmin and its ability to predict corn performance in Michigan,
Culman et al. (2013) reported values ranging from less than 40 to near 60 mg CO2-C kg-1 soil in
continuous corn and from greater than 40 to greater than 80 mg CO2-C kg-1 soil in corn-soy-
52
wheat rotations. Values obtained in the present study vary from 34 to 81 mg CO2-C kg-1 soil
(Table 1.7, Figure 1.6), and fall within this range reported in the literature.
Yet, it is important to understand how management factors influence Cmin in order to
prevent its decline and subsequently a decline in SOM mineralization. Many factors have the
potential to influence microbial respiration, including management factors that alter the
abundance and nature of the active fraction of SOM and in turn impact microbial populations.
The present study showed fewer significant differences in one-day Cmin than with POXC and
24-day Cmin (Table 1.7, Figure 1.6), and correlations of one-day Cmin with STIR and cropping
intensity were also not as pronounced as for 24-day Cmin and POXC with these management
variables (Table 1.9); this phenomenon is likely the result of greater CV values for one-day Cmin
than for both POXC and 24-day Cmin (Tables 1.5 and 1.7), indicative of greater spatial variability
of one-day Cmin. This lack of differences must be considered in light of the inherent spatial
variability of one-day Cmin, which may mask biologically meaningful differences (Kravchenko
and Robertson, 2011). If the significance level is reduced to p <0.30, significant differences for
one-day Cmin begin to resemble 24-day Cmin (data not shown). Therefore, while the value of
one-day Cmin lies partially in its ease of measurement and wide accessibility, 24-day Cmin
results in the present study can provide support of interpretation of one-day Cmin results
(Table 1.7).
As with POXC, correlations on a site-by-site basis reinforce the role of reducing
disturbance in increasing Cmin, as indicated by the negative correlation between STIR and one-
day Cmin at two of five sites and three of five sites for 24-day Cmin (Table 1.9). PCFS and
Prosser were the two sites that did not show a significant correlation between Cmin and STIR,
53
and as with POXC, lack of a tillage gradient (PCFS) and short history under tillage treatments
(Prosser) (Table 1.1) apply to this lack of a significant correlation as well. Likewise, Bowman et
al. (1990) showed a substantial decrease in 21-day Cmin resulting from conversion of native
prairie in the Great Plains dominated by four species of grass and patches of cacti to tilled
wheat-fallow, documenting a 72% decline in Cmin of the surface 15 cm after 60 years of
cultivation, and noted that 87% of this decline occurred in the first 3 years.
The cropping intensity gradient at Pendleton is significantly associated with one-day
Cmin, and with 24-day Cmin at Pendleton, Moro, and PCFS. Results at Pendleton and Moro for
24-day Cmin indicate that NT without cropping intensification can significantly increase Cmin,
while intensification with a legume further increases Cmin under NT (Table 1.7, Figure 1.6);
furthermore, this significant increase in Cmin resulting from intensification occurred at
Pendleton after only one year of intensification with WP (Table 1.1).
Results from these sites, though, do not provide sufficient evidence to deduce if this
increase in Cmin is the result of intensification with a legume, or merely intensification.
Cropping intensification at PCFS was negatively associated with 24-day Cmin, and as with POXC,
this implies that the perennial systems, which were assigned a greater cropping intensity value
than the annual systems (Table 1.1), did not provide sufficient inputs to fuel greater Cmin than
the annual systems. Results for 24-day Cmin for annual cropping systems at PCFS suggest that
inclusion of legumes in rotation, compared to an all cereal rotation, do not significantly increase
Cmin (Table 1.7), indicating that greater Cmin under more intensely cropped systems at Moro
and Pendleton may be the result of intensification rather than diversifying with a legume.
54
Culman et al. (2013), however, found that diverse rotations had a beneficial impact on
one-day Cmin, where crop rotations with a legume in rotation enhanced one-day Cmin
compared to continuous corn, thereby supporting the idea that substrate quality resulting from
diversification is important in enhancing mineralization. In support of diversification of biomass
inputs, Spehn et al. (2000) demonstrated that a log-linear decrease of heterotrophic bacterial
abundance, the drivers of mineralization, was associated with a decrease in plant species
richness, suggesting that a diversified C substrate pool appeals to a wide range of heterotrophic
organisms. In the present study, significant differences in microbial biomass did not prevail
across all sites, yet at Moro, the more diverse rotations did have significantly greater MBC than
rotations with strictly WW (Table 1.5).
A possible corollary to findings by Spehn et al, (2000) and Culman et al. (2013) is that a
diversity of inputs appeals to broader taxa of organisms and a diversity of organisms with niche
roles is as important as microbial biomass in mineralization. In a review of microcosm studies,
Setala et al. (1998) approached this observation from a different perspective in concluding that
declining species diversity can alter carbon mineralization through a reduction in trophic level
interactions. These findings all suggest that a diversity of plant species along with
intensification is important in maintaining and enhancing Cmin.
Management and SOM Quality
An important measure of the quality of SOM is the distribution between labile and
recalcitrant pools (Rovira and Vallejo, 2002), and a current paradigm of SOM dynamics suggests
that with increased decomposition, SOM quality decreases as the active fraction critical to soil
microbial processes comprises a smaller portion of the total SOM (Plant et al., 2006; Rovira and
55
Vallejo, 2007). The fraction of SOC in the present study that was resistant to acid hydrolysis did
not show sensitivity to STIR (Figure 1.7). Values of the fraction of SOC as NHC were around
50%, except for Prosser where values were 36% for both treatments; no significant differences
in NHC/SOC between treatments within sites were observed (data not shown).
These results are contrary to the idea that the NHC pool represents a strictly recalcitrant
pool and the HC pool a more active pool (Rovira and Vallejo, 2002); if this were the case, the
proportion of SOC as NHC under increased tillage should increase due to enhanced
mineralization of HC (Paul et al., 2006). Multiple studies, though, have dated NHC as much
older than HC and SOC, supporting that NHC is associated with a more recalcitrant pool (Martel
and Paul, 1974; Paul et al., 2001; Paul et al., 2006). This finding is also in light of findings that
have shown recent plant residues contribute to NHC through addition of lignin (Collins et al.
2000), which is known to be resistant to acid hydrolysis (Rovira and Vallejo, 2002). Abiven et al.
(2011) measured lignin content at the various growth stages for wheat and at maturity
documented lignin content ranging from 2.4% in leaves to 13.4% in roots; this contribution to
NHC from recent plant residue is thought to be negligible (Paul et al., 2006, Rovira and Vallejo,
2007). Furthermore, while researchers express some uncertainty around findings due to
assumptions behind the methodology, several studies utilizing C tracing methods have shown
that residue lignin turns over faster than bulk soil C (Abiven et al., 2011), thereby dampening
the influence of lignin-C relative to bulk SOC.
The significant correlation between NHC and HC in the present study indicates that both
pools are impacted by increased disturbance (Table 1.2), as was also demonstrated for climate.
This observation is consistent with other studies, such as Paul et al. (2006), who found that the
56
ratio of NHC to SOC was greater in low or no disturbance systems and concluded that factors
other than biochemical recalcitrance influence the proportion and age of NHC in soils; they also
cited Poirier et al. (2005) in stating that resistance to acid hydrolysis is not equivalent to
resistance to biodegradation resulting from land-use changes. The corollary is that NHC does
not accurately represent the passive SOM pool (Paul et al., 2006), an observation which is
supported by results from the present study showing that both NHC and HC were impacted by
tillage or erosion.
The complexity of the interaction of chemical recalcitrance and physical protection was
evaluated by He et al. (2009), who observed that chemically recalcitrant SOM is associated with
physical protection, and that labile C compounds may become stabilized through protection
into microaggregates. This observation indicates that a certain degree of biochemical
recalcitrance is afforded to physically-protected labile C with time. Biochemical stabilization of
labile C has been observed to occur through a series of condensation reactions known as the
browning reaction (Krull et al., 2003).
This phenomenon is supported by results from Prosser which has greater sand content
than other sites, affording less protection than more fine-textured soils of the other sites with
higher silt content (Krull et al., 2003; Plante et al., 2006), and a corresponding lower NHC% than
the other sites (Figure 1.7). Furthermore, Plante et al. (2006) established the importance of
texture, revealing a greater %NHC associated with the silt-sized fraction than with the clay-sized
fraction, and partially explained this by suggesting microaggregate derived silt-sized fractions
are made up of a combination of both silt-sized particles and similarly sized clay-based
microaggregates.
57
Therefore, while NHC and HC represent finite pools based on chemical recalcitrance, the
reality of in-situ recalcitrance is a continuum where a portion of the HC pool is part of the
passive C pool through physical protection, and a portion of the NHC pool is susceptible to
biodegradation. The susceptibility of recalcitrant SOM to mineralization has been noted in
studies which examine the priming effect (PE), whereby the ability of microorganisms to
degrade recalcitrant SOM is impacted by fresh additions of labile C (Thiessen et al. (2013),
emphasizing the role of physical protection in preserving NHC as well.
While NHC and HC cannot be clearly connected to a recalcitrant and active pool, the
%NHC considered in the context of other findings with regard to management practices can
help to elucidate how management practices within the dryland PNW impact SOM quality. In a
transect of soils between Minnesota and Pennsylvania, Paul et al. (2001) found the fraction of
SOC as NHC ranged from 33% to 65%. They found that %NHC varied both with depth, which
has also been related in other studies (Collins et al., 2000), decreasing at lower profiles, and
with soil type; however, for agricultural soils that were grassland derived, the NHC of surface
soils (0-20 cm) was 49% and 50% for the two sites measured, similar to results from the present
study.
Additionally, Collins et al. (2000) noted an increase in the mean residence time with
decreasing sand content, suggesting that increasing sand content is associated with decreasing
NHC, a theme that has already been discussed with regard to results from Prosser. Across a
range of land use types including grassland, forested, and no-till agriculture (depth in soil profile
not noted), Paul et al. (2006) observed that NHC comprised approximately 55% of SOC. Thus,
present findings are in alignment with NHC% reported across a range of terrestrial ecosystems

58
as well as in other climates, and help to establish that soil texture exerts a significant influence
on %NHC, and subsequently on SOM quality.
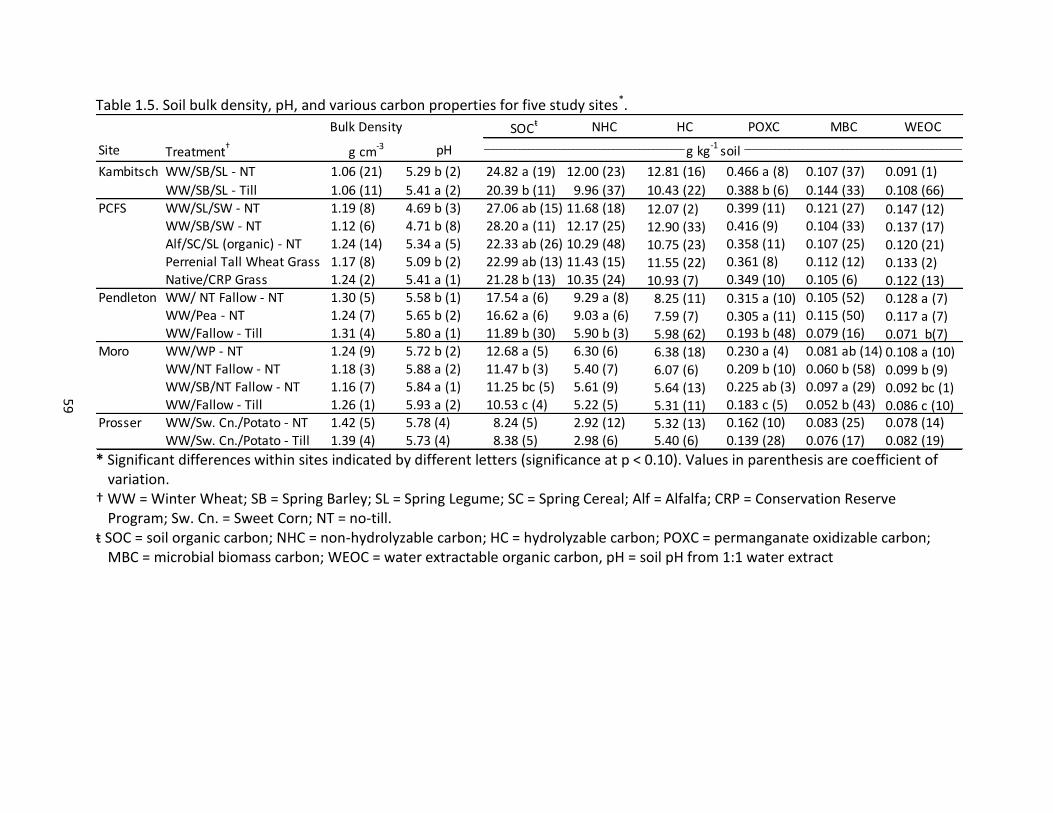
59
Table 1.5. Soil bulk density, pH, and various carbon properties for five study sites*.
* Significant differences within sites indicated by different letters (significance at p < 0.10). Values in parenthesis are coefficient of
variation. † WW = Winter Wheat; SB = Spring Barley; SL = Spring Legume; SC = Spring Cereal; Alf = Alfalfa; CRP = Conservation Reserve
Program; Sw. Cn. = Sweet Corn; NT = no-till. ŧ SOC = soil organic carbon; NHC = non-hydrolyzable carbon; HC = hydrolyzable carbon; POXC = permanganate oxidizable carbon;
MBC = microbial biomass carbon; WEOC = water extractable organic carbon, pH = soil pH from 1:1 water extract
Bulk Density SOCŧ NHC HC POXC MBC WEOC
Site Treatment†
g cm-3 pH
Kambitsch WW/SB/SL - NT 1.06 (21) 5.29 b (2) 24.82 a (19) 12.00 (23) 12.81 (16) 0.466 a (8) 0.107 (37) 0.091 (1)
WW/SB/SL - Till 1.06 (11) 5.41 a (2) 20.39 b (11) 9.96 (37) 10.43 (22) 0.388 b (6) 0.144 (33) 0.108 (66)
PCFS WW/SL/SW - NT 1.19 (8) 4.69 b (3) 27.06 ab (15) 11.68 (18) 12.07 (2) 0.399 (11) 0.121 (27) 0.147 (12)WW/SB/SW - NT 1.12 (6) 4.71 b (8) 28.20 a (11) 12.17 (25) 12.90 (33) 0.416 (9) 0.104 (33) 0.137 (17)Alf/SC/SL (organic) - NT 1.24 (14) 5.34 a (5) 22.33 ab (26) 10.29 (48) 10.75 (23) 0.358 (11) 0.107 (25) 0.120 (21)Perrenial Tall Wheat Grass 1.17 (8) 5.09 b (2) 22.99 ab (13) 11.43 (15) 11.55 (22) 0.361 (8) 0.112 (12) 0.133 (2)Native/CRP Grass 1.24 (2) 5.41 a (1) 21.28 b (13) 10.35 (24) 10.93 (7) 0.349 (10) 0.105 (6) 0.122 (13)
Pendleton WW/ NT Fallow - NT 1.30 (5) 5.58 b (1) 17.54 a (6) 9.29 a (8) 8.25 (11) 0.315 a (10) 0.105 (52) 0.128 a (7)WW/Pea - NT 1.24 (7) 5.65 b (2) 16.62 a (6) 9.03 a (6) 7.59 (7) 0.305 a (11) 0.115 (50) 0.117 a (7)WW/Fallow - Till 1.31 (4) 5.80 a (1) 11.89 b (30) 5.90 b (3) 5.98 (62) 0.193 b (48) 0.079 (16) 0.071 b(7)
Moro WW/WP - NT 1.24 (9) 5.72 b (2) 12.68 a (5) 6.30 (6) 6.38 (18) 0.230 a (4) 0.081 ab (14) 0.108 a (10)WW/NT Fallow - NT 1.18 (3) 5.88 a (2) 11.47 b (3) 5.40 (7) 6.07 (6) 0.209 b (10) 0.060 b (58) 0.099 b (9)WW/SB/NT Fallow - NT 1.16 (7) 5.84 a (1) 11.25 bc (5) 5.61 (9) 5.64 (13) 0.225 ab (3) 0.097 a (29) 0.092 bc (1)WW/Fallow - Till 1.26 (1) 5.93 a (2) 10.53 c (4) 5.22 (5) 5.31 (11) 0.183 c (5) 0.052 b (43) 0.086 c (10)
Prosser WW/Sw. Cn./Potato - NT 1.42 (5) 5.78 (4) 8.24 (5) 2.92 (12) 5.32 (13) 0.162 (10) 0.083 (25) 0.078 (14)
WW/Sw. Cn./Potato - Till 1.39 (4) 5.73 (4) 8.38 (5) 2.98 (6) 5.40 (6) 0.139 (28) 0.076 (17) 0.082 (19)
________________________________________________________________ g kg
-1 soil
____________________________________________________________________
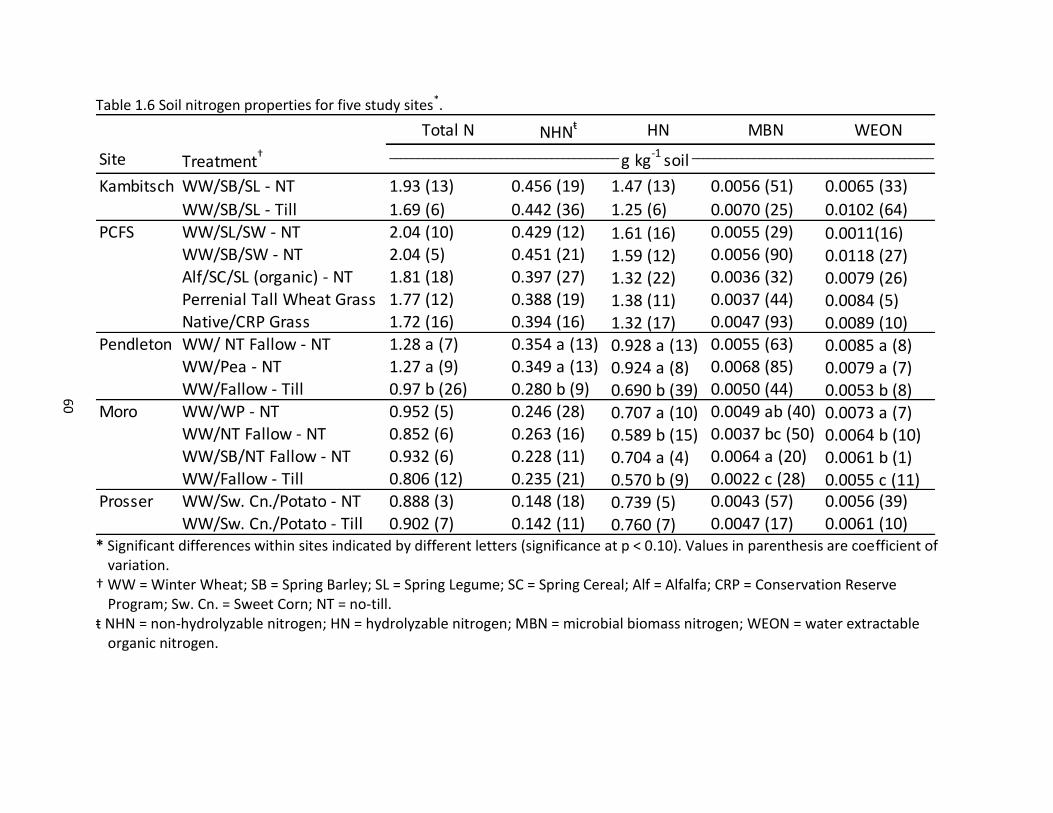
60
Table 1.6 Soil nitrogen properties for five study sites*.
* Significant differences within sites indicated by different letters (significance at p < 0.10). Values in parenthesis are coefficient of
variation. † WW = Winter Wheat; SB = Spring Barley; SL = Spring Legume; SC = Spring Cereal; Alf = Alfalfa; CRP = Conservation Reserve
Program; Sw. Cn. = Sweet Corn; NT = no-till. ŧ NHN = non-hydrolyzable nitrogen; HN = hydrolyzable nitrogen; MBN = microbial biomass nitrogen; WEON = water extractable
organic nitrogen.
Total N NHNŧ HN MBN WEON
Site Treatment†
Kambitsch WW/SB/SL - NT 1.93 (13) 0.456 (19) 1.47 (13) 0.0056 (51) 0.0065 (33)
WW/SB/SL - Till 1.69 (6) 0.442 (36) 1.25 (6) 0.0070 (25) 0.0102 (64)
PCFS WW/SL/SW - NT 2.04 (10) 0.429 (12) 1.61 (16) 0.0055 (29) 0.0011(16)WW/SB/SW - NT 2.04 (5) 0.451 (21) 1.59 (12) 0.0056 (90) 0.0118 (27)Alf/SC/SL (organic) - NT 1.81 (18) 0.397 (27) 1.32 (22) 0.0036 (32) 0.0079 (26)Perrenial Tall Wheat Grass 1.77 (12) 0.388 (19) 1.38 (11) 0.0037 (44) 0.0084 (5)Native/CRP Grass 1.72 (16) 0.394 (16) 1.32 (17) 0.0047 (93) 0.0089 (10)
Pendleton WW/ NT Fallow - NT 1.28 a (7) 0.354 a (13) 0.928 a (13) 0.0055 (63) 0.0085 a (8)WW/Pea - NT 1.27 a (9) 0.349 a (13) 0.924 a (8) 0.0068 (85) 0.0079 a (7)WW/Fallow - Till 0.97 b (26) 0.280 b (9) 0.690 b (39) 0.0050 (44) 0.0053 b (8)
Moro WW/WP - NT 0.952 (5) 0.246 (28) 0.707 a (10) 0.0049 ab (40) 0.0073 a (7)WW/NT Fallow - NT 0.852 (6) 0.263 (16) 0.589 b (15) 0.0037 bc (50) 0.0064 b (10)WW/SB/NT Fallow - NT 0.932 (6) 0.228 (11) 0.704 a (4) 0.0064 a (20) 0.0061 b (1)WW/Fallow - Till 0.806 (12) 0.235 (21) 0.570 b (9) 0.0022 c (28) 0.0055 c (11)
Prosser WW/Sw. Cn./Potato - NT 0.888 (3) 0.148 (18) 0.739 (5) 0.0043 (57) 0.0056 (39)
WW/Sw. Cn./Potato - Till 0.902 (7) 0.142 (11) 0.760 (7) 0.0047 (17) 0.0061 (10)
_________________________________________ g kg
-1 soil
____________________________________________
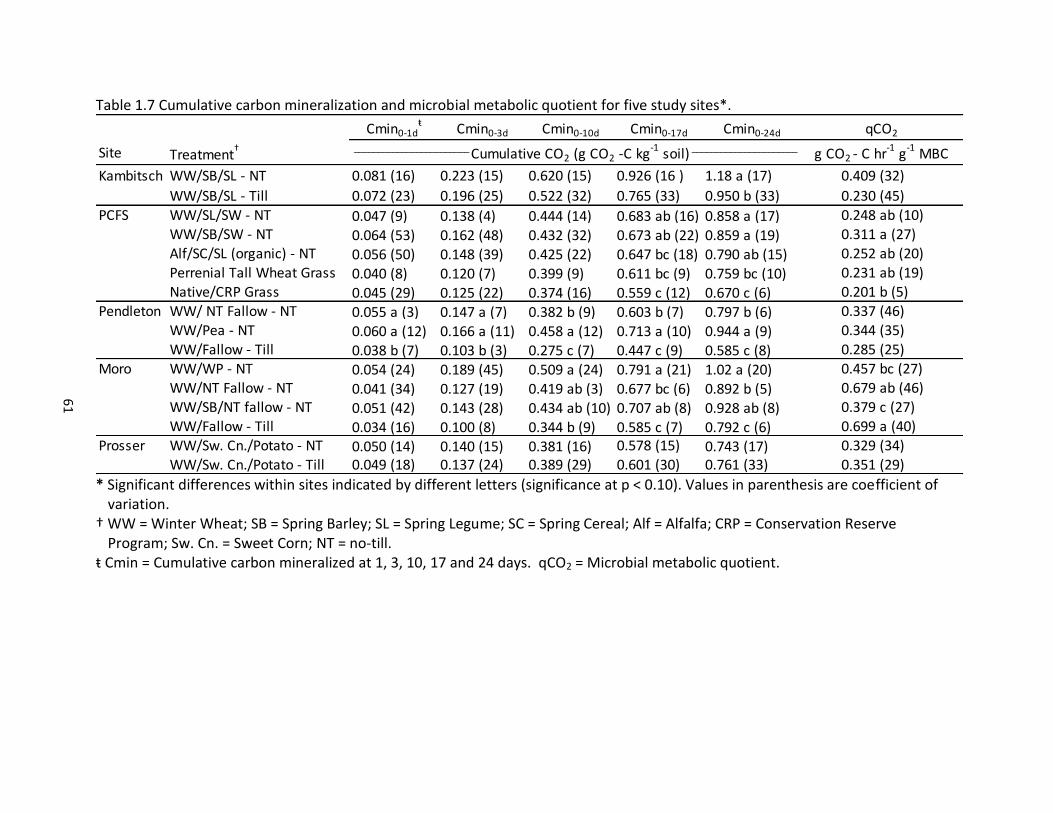
61
Table 1.7 Cumulative carbon mineralization and microbial metabolic quotient for five study sites*.
* Significant differences within sites indicated by different letters (significance at p < 0.10). Values in parenthesis are coefficient of
variation. † WW = Winter Wheat; SB = Spring Barley; SL = Spring Legume; SC = Spring Cereal; Alf = Alfalfa; CRP = Conservation Reserve
Program; Sw. Cn. = Sweet Corn; NT = no-till. ŧ Cmin = Cumulative carbon mineralized at 1, 3, 10, 17 and 24 days. qCO2 = Microbial metabolic quotient.
Cmin0-1dŧ
Cmin0-3d Cmin0-10d Cmin0-17d Cmin0-24d qCO2
Site Treatment† g CO2 - C hr
-1 g
-1 MBC
Kambitsch WW/SB/SL - NT 0.081 (16) 0.223 (15) 0.620 (15) 0.926 (16 ) 1.18 a (17) 0.409 (32)
WW/SB/SL - Till 0.072 (23) 0.196 (25) 0.522 (32) 0.765 (33) 0.950 b (33) 0.230 (45)
PCFS WW/SL/SW - NT 0.047 (9) 0.138 (4) 0.444 (14) 0.683 ab (16) 0.858 a (17) 0.248 ab (10)WW/SB/SW - NT 0.064 (53) 0.162 (48) 0.432 (32) 0.673 ab (22) 0.859 a (19) 0.311 a (27)
Alf/SC/SL (organic) - NT 0.056 (50) 0.148 (39) 0.425 (22) 0.647 bc (18) 0.790 ab (15) 0.252 ab (20)
Perrenial Tall Wheat Grass 0.040 (8) 0.120 (7) 0.399 (9) 0.611 bc (9) 0.759 bc (10) 0.231 ab (19)Native/CRP Grass 0.045 (29) 0.125 (22) 0.374 (16) 0.559 c (12) 0.670 c (6) 0.201 b (5)
Pendleton WW/ NT Fallow - NT 0.055 a (3) 0.147 a (7) 0.382 b (9) 0.603 b (7) 0.797 b (6) 0.337 (46)WW/Pea - NT 0.060 a (12) 0.166 a (11) 0.458 a (12) 0.713 a (10) 0.944 a (9) 0.344 (35)
WW/Fallow - Till 0.038 b (7) 0.103 b (3) 0.275 c (7) 0.447 c (9) 0.585 c (8) 0.285 (25)
Moro WW/WP - NT 0.054 (24) 0.189 (45) 0.509 a (24) 0.791 a (21) 1.02 a (20) 0.457 bc (27)WW/NT Fallow - NT 0.041 (34) 0.127 (19) 0.419 ab (3) 0.677 bc (6) 0.892 b (5) 0.679 ab (46)
WW/SB/NT fallow - NT 0.051 (42) 0.143 (28) 0.434 ab (10) 0.707 ab (8) 0.928 ab (8) 0.379 c (27)
WW/Fallow - Till 0.034 (16) 0.100 (8) 0.344 b (9) 0.585 c (7) 0.792 c (6) 0.699 a (40)Prosser WW/Sw. Cn./Potato - NT 0.050 (14) 0.140 (15) 0.381 (16) 0.578 (15) 0.743 (17) 0.329 (34)
WW/Sw. Cn./Potato - Till 0.049 (18) 0.137 (24) 0.389 (29) 0.601 (30) 0.761 (33) 0.351 (29)
________________________ Cumulative CO2 (g CO2 -C kg
-1 soil)
______________________
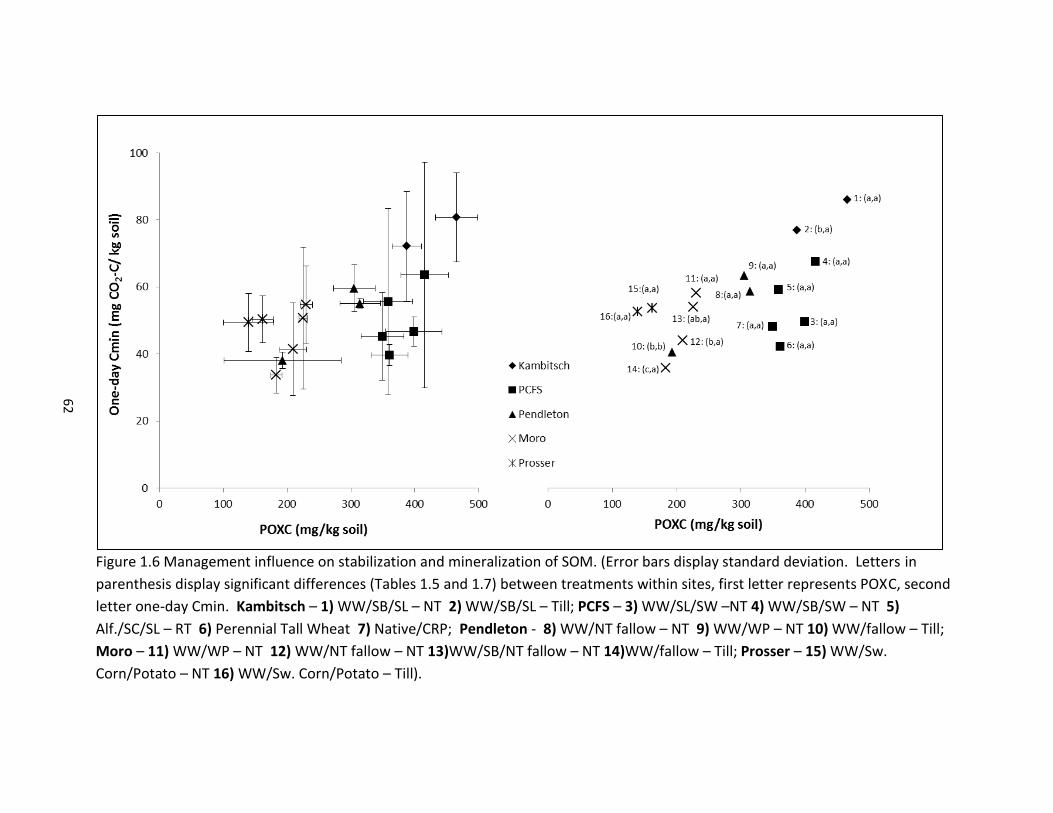
62
Figure 1.6 Management influence on stabilization and mineralization of SOM. (Error bars display standard deviation. Letters in
parenthesis display significant differences (Tables 1.5 and 1.7) between treatments within sites, first letter represents POXC, second
letter one-day Cmin. Kambitsch – 1) WW/SB/SL – NT 2) WW/SB/SL – Till; PCFS – 3) WW/SL/SW –NT 4) WW/SB/SW – NT 5)
Alf./SC/SL – RT 6) Perennial Tall Wheat 7) Native/CRP; Pendleton - 8) WW/NT fallow – NT 9) WW/WP – NT 10) WW/fallow – Till;
Moro – 11) WW/WP – NT 12) WW/NT fallow – NT 13)WW/SB/NT fallow – NT 14)WW/fallow – Till; Prosser – 15) WW/Sw.
Corn/Potato – NT 16) WW/Sw. Corn/Potato – Till).
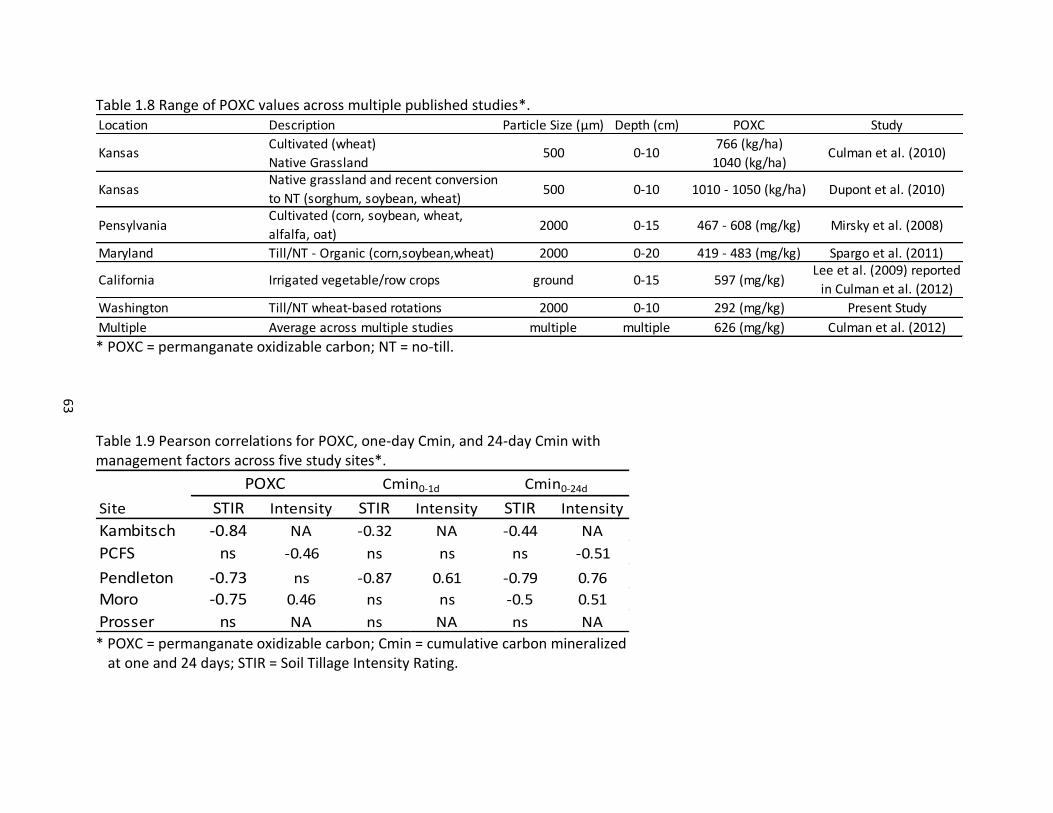
63
Table 1.8 Range of POXC values across multiple published studies*.
* POXC = permanganate oxidizable carbon; NT = no-till.
Table 1.9 Pearson correlations for POXC, one-day Cmin, and 24-day Cmin with management factors across five study sites*.
* POXC = permanganate oxidizable carbon; Cmin = cumulative carbon mineralized
at one and 24 days; STIR = Soil Tillage Intensity Rating.
Location Description Particle Size (µm) Depth (cm) POXC Study
Cultivated (wheat) 766 (kg/ha)
Native Grassland 1040 (kg/ha)
Maryland Till/NT - Organic (corn,soybean,wheat) 2000 0-20 419 - 483 (mg/kg) Spargo et al. (2011)
Washington Till/NT wheat-based rotations 2000 0-10 292 (mg/kg) Present Study
Multiple Average across multiple studies multiple multiple 626 (mg/kg) Culman et al. (2012)
California Irrigated vegetable/row cropsLee et al. (2009) reported
in Culman et al. (2012)597 (mg/kg)0-15ground
PensylvaniaCultivated (corn, soybean, wheat,
alfalfa, oat)Mirsky et al. (2008)467 - 608 (mg/kg)0-152000
500 0-10 Culman et al. (2010)Kansas
KansasNative grassland and recent conversion
to NT (sorghum, soybean, wheat)500 0-10 1010 - 1050 (kg/ha) Dupont et al. (2010)
Site STIR Intensity STIR Intensity STIR Intensity
Kambitsch -0.84 NA -0.32 NA -0.44 NA
PCFS ns -0.46 ns ns ns -0.51
Pendleton -0.73 ns -0.87 0.61 -0.79 0.76
Moro -0.75 0.46 ns ns -0.5 0.51
Prosser ns NA ns NA ns NA
POXC Cmin0-1d Cmin0-24d
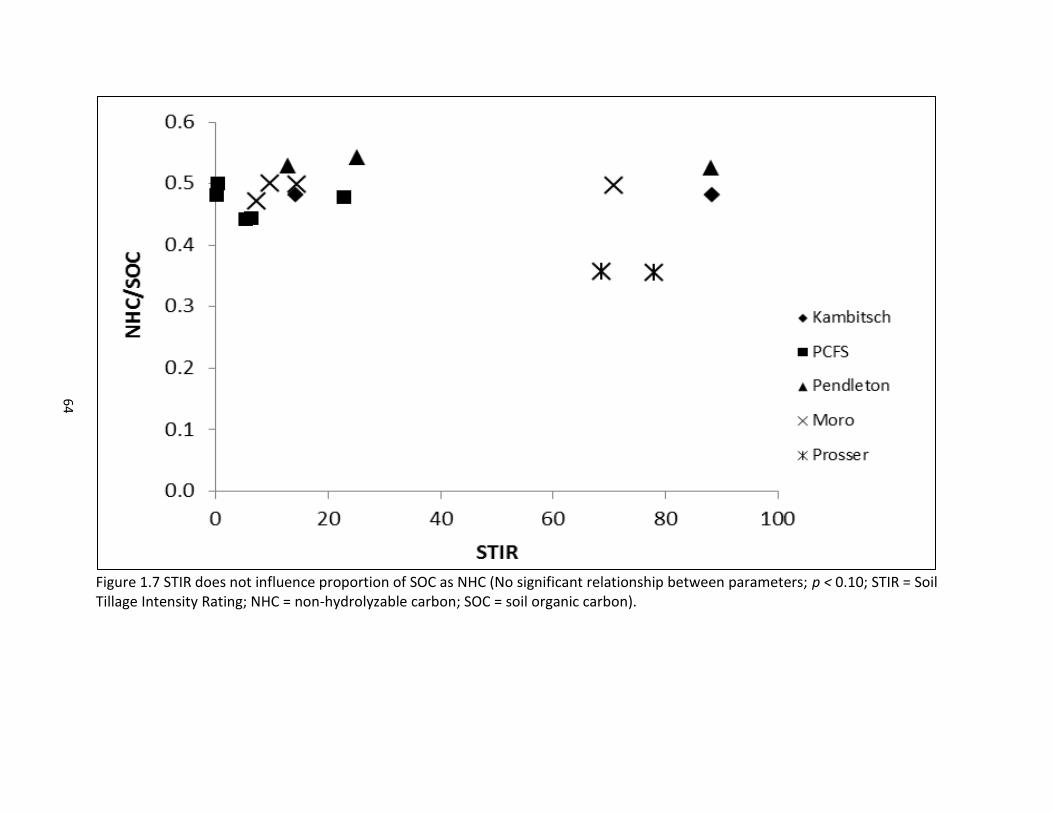
64
Figure 1.7 STIR does not influence proportion of SOC as NHC (No significant relationship between parameters; p < 0.10; STIR = Soil Tillage Intensity Rating; NHC = non-hydrolyzable carbon; SOC = soil organic carbon).
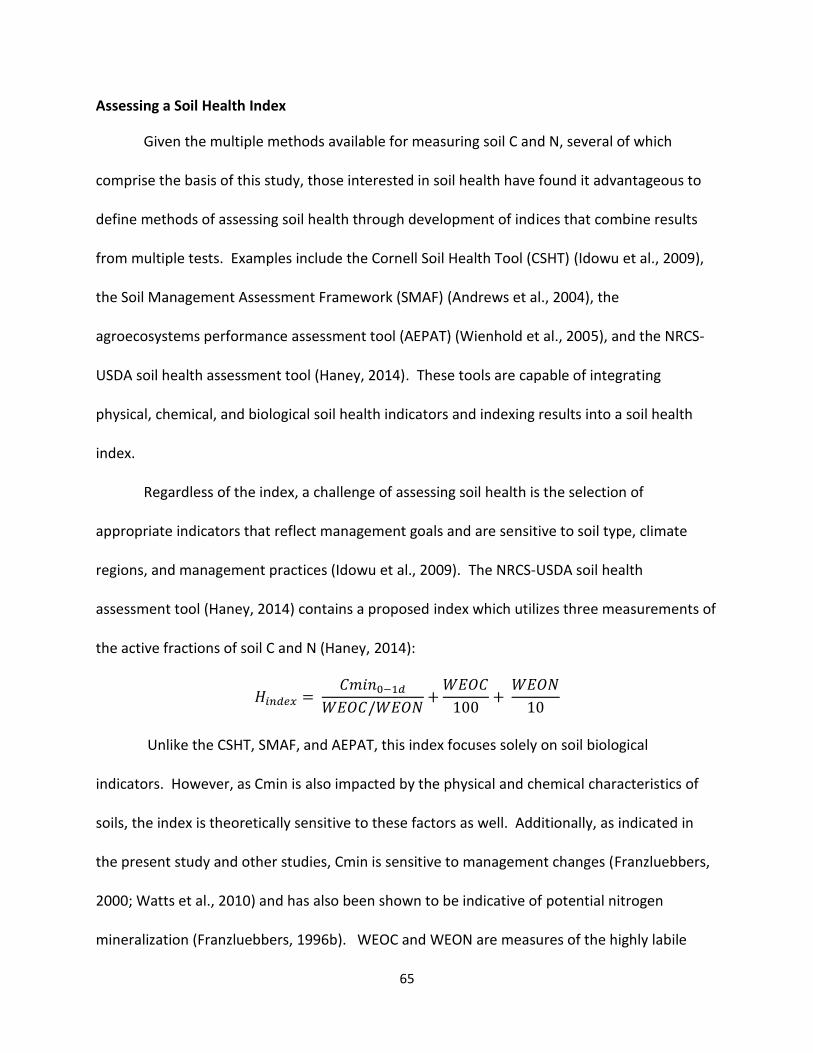
65
Assessing a Soil Health Index
Given the multiple methods available for measuring soil C and N, several of which
comprise the basis of this study, those interested in soil health have found it advantageous to
define methods of assessing soil health through development of indices that combine results
from multiple tests. Examples include the Cornell Soil Health Tool (CSHT) (Idowu et al., 2009),
the Soil Management Assessment Framework (SMAF) (Andrews et al., 2004), the
agroecosystems performance assessment tool (AEPAT) (Wienhold et al., 2005), and the NRCS-
USDA soil health assessment tool (Haney, 2014). These tools are capable of integrating
physical, chemical, and biological soil health indicators and indexing results into a soil health
index.
Regardless of the index, a challenge of assessing soil health is the selection of
appropriate indicators that reflect management goals and are sensitive to soil type, climate
regions, and management practices (Idowu et al., 2009). The NRCS-USDA soil health
assessment tool (Haney, 2014) contains a proposed index which utilizes three measurements of
the active fractions of soil C and N (Haney, 2014):
Unlike the CSHT, SMAF, and AEPAT, this index focuses solely on soil biological
indicators. However, as Cmin is also impacted by the physical and chemical characteristics of
soils, the index is theoretically sensitive to these factors as well. Additionally, as indicated in
the present study and other studies, Cmin is sensitive to management changes (Franzluebbers,
2000; Watts et al., 2010) and has also been shown to be indicative of potential nitrogen
mineralization (Franzluebbers, 1996b). WEOC and WEON are measures of the highly labile
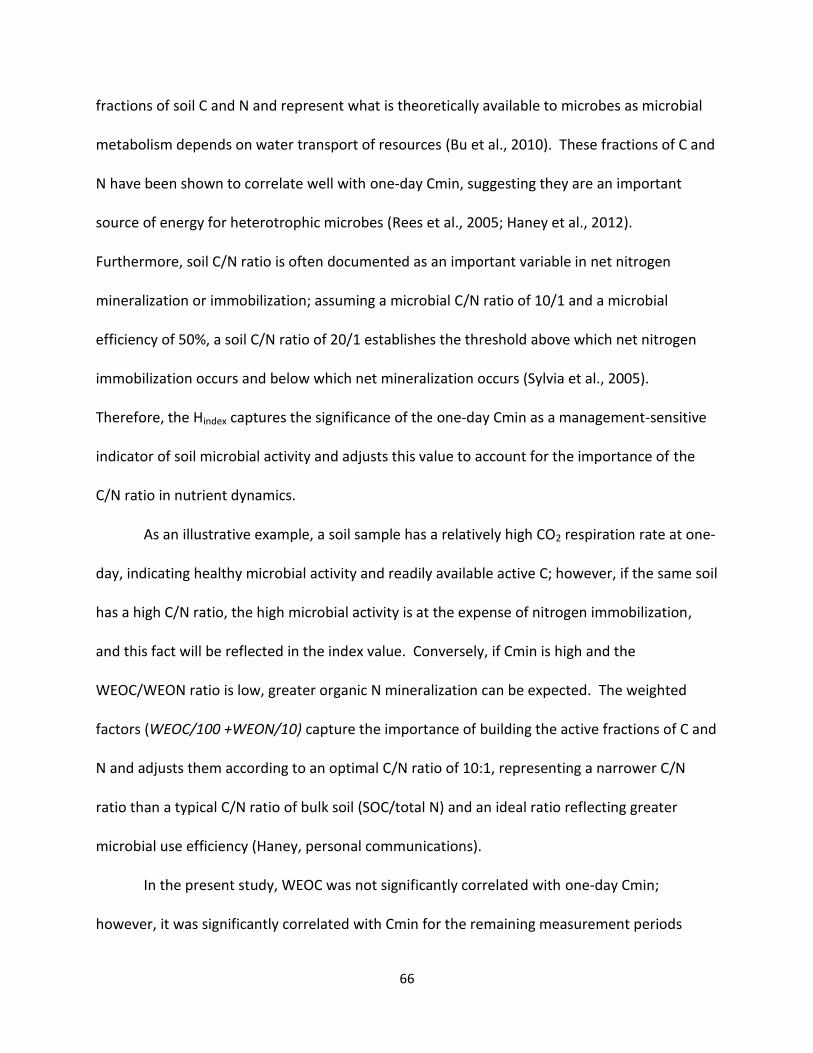
66
fractions of soil C and N and represent what is theoretically available to microbes as microbial
metabolism depends on water transport of resources (Bu et al., 2010). These fractions of C and
N have been shown to correlate well with one-day Cmin, suggesting they are an important
source of energy for heterotrophic microbes (Rees et al., 2005; Haney et al., 2012).
Furthermore, soil C/N ratio is often documented as an important variable in net nitrogen
mineralization or immobilization; assuming a microbial C/N ratio of 10/1 and a microbial
efficiency of 50%, a soil C/N ratio of 20/1 establishes the threshold above which net nitrogen
immobilization occurs and below which net mineralization occurs (Sylvia et al., 2005).
Therefore, the Hindex captures the significance of the one-day Cmin as a management-sensitive
indicator of soil microbial activity and adjusts this value to account for the importance of the
C/N ratio in nutrient dynamics.
As an illustrative example, a soil sample has a relatively high CO2 respiration rate at one-
day, indicating healthy microbial activity and readily available active C; however, if the same soil
has a high C/N ratio, the high microbial activity is at the expense of nitrogen immobilization,
and this fact will be reflected in the index value. Conversely, if Cmin is high and the
WEOC/WEON ratio is low, greater organic N mineralization can be expected. The weighted
factors (WEOC/100 +WEON/10) capture the importance of building the active fractions of C and
N and adjusts them according to an optimal C/N ratio of 10:1, representing a narrower C/N
ratio than a typical C/N ratio of bulk soil (SOC/total N) and an ideal ratio reflecting greater
microbial use efficiency (Haney, personal communications).
In the present study, WEOC was not significantly correlated with one-day Cmin;
however, it was significantly correlated with Cmin for the remaining measurement periods
67
(Table 1.2), while WEON was significantly correlated only with ten-day Cmin. This finding
suggests that WEOC was available for supporting microbial activity but was either not
immediately available during the initial re-wetting period, or contained constituents that were
not immediately available. Furthermore, across all sites, CV for WEON was 36%, compared to
28% for WEOC; this higher CV for WEON may partly explain the lack of correlation with Cmin
readings (Table 1.2). The CV for Cmin across the five sites ranged from 33% at day 1 to 23% at
day 24. As a benchmark, soil organic carbon measurements are typically found to have a CV
ranging from 15%-35% (Pennock et al., 2008).
Significant differences in Hindex were identified only at Pendleton, where CVs were also
lowest across treatments; Pendleton also had the lowest CVs for index parameters (Tables 1.5
and 1.7). A multivariate stepwise analysis of Hindex values with management factors and climate
variables across all study sites revealed that Hindex was primarily sensitive to precipitation, which
explained 31% of the variation in Hindex, increasing with an increase in precipitation (Tables 1.11
and 1.12). At Pendleton, STIR and cropping intensity collectively explained 90% of the
significant variation detected in Hindex (Table 1.11). Furthermore, Hindex displayed a significant
correlation with climate variables and multiple soil properties across all sites (Table 1.12).
Considering that Hindex displayed sensitivity to climate variables across the sites and to STIR and
cropping intensity at Pendleton, where significant differences were measured, differentiating
between moldboard plowing and NT at Pendleton indicates that the index has value for
monitoring soil health within the inland PNW.
However, results also show the difficulty of interpretation due to measurement
variability, and at sites with significant spatial heterogeneity, an increase in the number of field
68
replications tested may be needed to increase power and aid in interpretation of results. Based
on the CVs in the present study, however, the number of field reps needed may be
cumbersomely large in certain instances (Table 1.10). Also, considering that some of the
expected relationships between soil properties were not present in this data set that were cited
in development of the index, particularly a significant relationship between water extractable C
and N and one-day Cmin, it may be informative to further analyze the index at other locations
with a new data set.
At other locations, Hindex values can reportedly range between 0 and 50 (Haney,
personal communications). In theory, higher index values are associated with soils having high
one-day Cmin readings coupled with a low C/N water extractable ratio and high levels of water
extractable C and N. One-day Cmin values have been reported as high as 100 mg CO2-C kg-1 soil
(Haney et al., 2008). Assuming a C/N ratio of 10 and solving algebraically, it is clear the
equation would require a WEOC soil concentration of 2000 mg C kg-1 soil and a WEON
concentration of 200 mg C kg-1 soil to achieve an Hindex value of 50 (at a C/N ratio of 8, WEOC
would be 1500 and WEON 188 mg C kg-1 soil, and at C/N ratio of 15, WEOC would be 3250 and
WEON 217 mg C kg-1 soil for an Hindex value of 50). These values are significantly greater than
what was measured in the present study, where WEOC ranged from 71 to 147 mg C kg-1 soil
and WEON from 5.3 to 11.8 mg N kg-1 soil (Tables 1.5 and 1.6).
Methodology for determining WEOC and WEON can vary, particularly with regard to
soil/solution ratio and shaking time; however values reported in literature are much lower than
values required to achieve Hindex values on the high end of the spectrum. In Quebec, CA,
Chantigny et al. (2010) reported values of WEOC ranging from 118 mg C kg-1 soil for virgin forest
69
to 397 mg C kg-1 soil for agricultural land, and WEON respectively ranging from 4.7 to 49.0 mg N
kg-1 soil. Similarly, in Winnipeg, CA, Xu et al. (2013) reported values for WEOC ranging from
20.8 to 34.1 mg C kg -1 soil for grassland and an organic wheat-alfalfa-flax rotation, and WEON
ranging from 1.3 to 2.3 mg N kg-1 soil in the same systems. In Georgia, Zhang et al. (2011)
report slightly higher values, with WEOC for a cotton-corn rotation with rye as a cover crop
measured at 430 mg C kg-1 soil and WEON at 87 mg N kg -1 soil.
Consideration of this range of values for natural and agricultural lands indicates that a
Hindex value on the higher end of the spectrum may not be realistic and more modest values
should be targeted. Based on the above cited literature, 200 mg C kg-1 soil is an average WEOC
value across a range of conditions and climates and is slightly higher than the highest value of
147 mg C kg-1 soil for WEOC measured in the present study; a one-day Cmin of 100 mg CO2-C
kg-1 soil is on the high end reported in the literature and also slightly higher than the highest
value of 81.0 mg CO2-C kg-1 soil measured in the present study. Using these values in the index
and an idealized C/N ratio of 10 provides a more modest index range of 0 to 14 and a scale for
which to evaluate Hindex values within the inland PNW.
As already reported in the present study, Cmin values are sensitive to disturbance and
potentially to cropping diversity, increasing with a decrease in disturbance and an increase in
cropping diversity. In studying the influence of management practices on WEOC and WEON, Xu
et al. (2013) found that rotations incorporating a perennial legume such as alfalfa had higher
WEOC and WEON and attributed this to the rooting mechanisms of perennial crops as well as to
an increase in root exudates and improved soil structure. In support of this hypothesis,
Marinari et al. (2010) found that WEOC was highest in a diverse 7-year rotation that included

70
winter wheat (2), soybeans, maize, clover (2), and potatoes with rye as a catch crop grown after
wheat and soybeans. In the present study, WEOC and WEON tended to be higher in NT (Tables
1.5 and 1.6), indicating a detrimental impact of increased tillage intensity on WEOC and WEON.
These results, considered with literature results, suggest that Cmin along with WEOC and
WEON, and subsequently Hindex, can be simultaneously improved by increasing crop diversity,
with the inclusion of legumes, and decreasing tillage intensity.
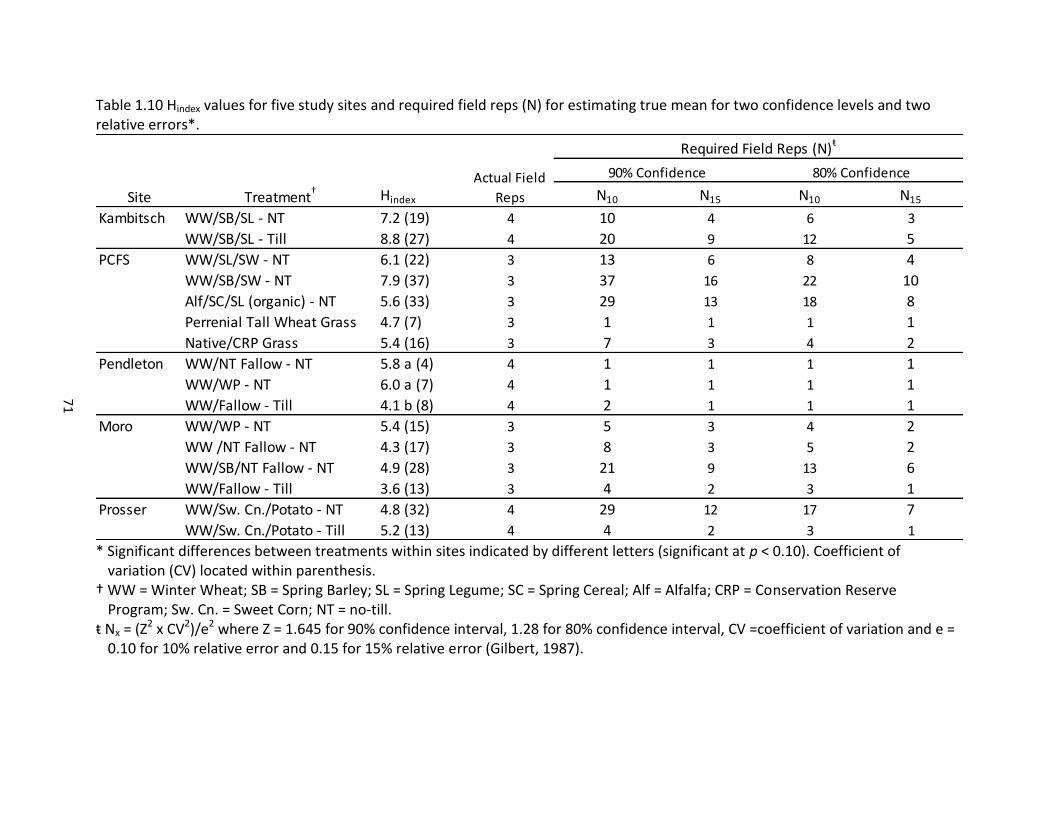
71
Table 1.10 Hindex values for five study sites and required field reps (N) for estimating true mean for two confidence levels and two relative errors*.
* Significant differences between treatments within sites indicated by different letters (significant at p < 0.10). Coefficient of
variation (CV) located within parenthesis. † WW = Winter Wheat; SB = Spring Barley; SL = Spring Legume; SC = Spring Cereal; Alf = Alfalfa; CRP = Conservation Reserve
Program; Sw. Cn. = Sweet Corn; NT = no-till. ŧ Nx = (Z2 x CV2)/e2 where Z = 1.645 for 90% confidence interval, 1.28 for 80% confidence interval, CV =coefficient of variation and e =
0.10 for 10% relative error and 0.15 for 15% relative error (Gilbert, 1987).
N10 N15 N10 N15
Kambitsch WW/SB/SL - NT 7.2 (19) 4 10 4 6 3
WW/SB/SL - Till 8.8 (27) 4 20 9 12 5
PCFS WW/SL/SW - NT 6.1 (22) 3 13 6 8 4
WW/SB/SW - NT 7.9 (37) 3 37 16 22 10
Alf/SC/SL (organic) - NT 5.6 (33) 3 29 13 18 8
Perrenial Tall Wheat Grass 4.7 (7) 3 1 1 1 1
Native/CRP Grass 5.4 (16) 3 7 3 4 2
Pendleton WW/NT Fallow - NT 5.8 a (4) 4 1 1 1 1
WW/WP - NT 6.0 a (7) 4 1 1 1 1
WW/Fallow - Till 4.1 b (8) 4 2 1 1 1
Moro WW/WP - NT 5.4 (15) 3 5 3 4 2
WW /NT Fallow - NT 4.3 (17) 3 8 3 5 2
WW/SB/NT Fallow - NT 4.9 (28) 3 21 9 13 6
WW/Fallow - Till 3.6 (13) 3 4 2 3 1
Prosser WW/Sw. Cn./Potato - NT 4.8 (32) 4 29 12 17 7
WW/Sw. Cn./Potato - Till 5.2 (13) 4 4 2 3 1
Actual Field
RepsHindexTreatment†
Site
Required Field Reps (N)ŧ
90% Confidence 80% Confidence
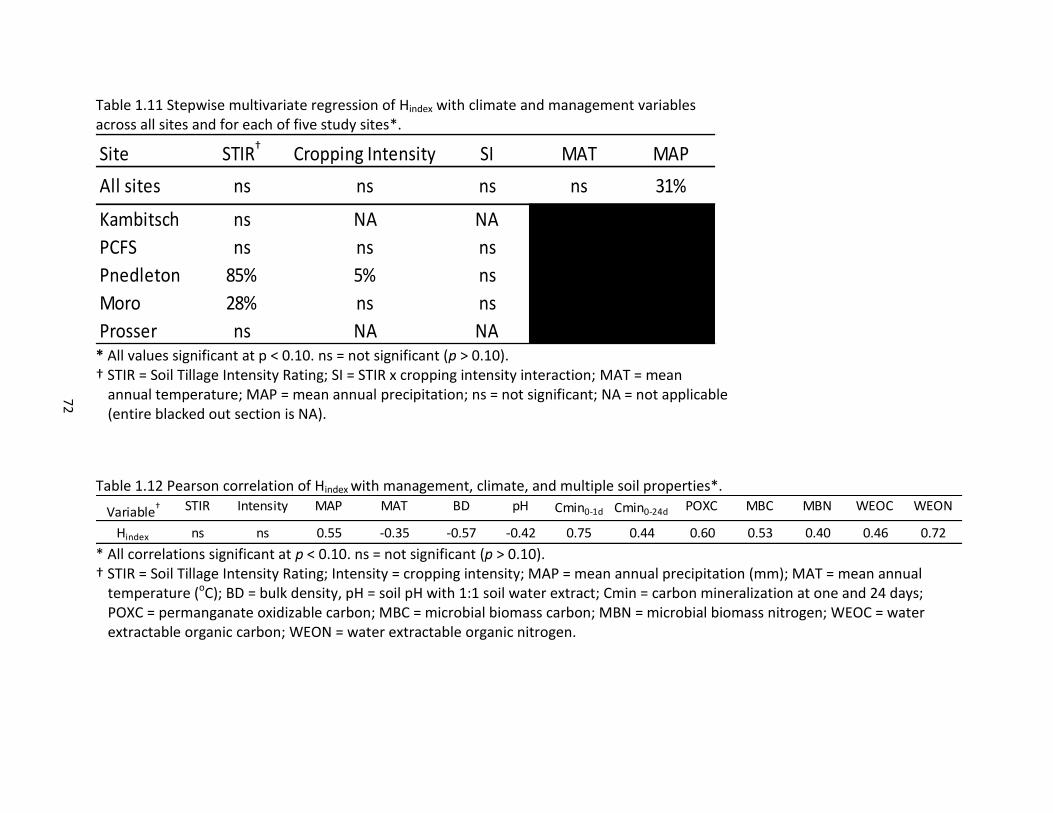
72
Table 1.11 Stepwise multivariate regression of Hindex with climate and management variables across all sites and for each of five study sites*.
* All values significant at p < 0.10. ns = not significant (p > 0.10). † STIR = Soil Tillage Intensity Rating; SI = STIR x cropping intensity interaction; MAT = mean
annual temperature; MAP = mean annual precipitation; ns = not significant; NA = not applicable (entire blacked out section is NA).
Table 1.12 Pearson correlation of Hindex with management, climate, and multiple soil properties*.
* All correlations significant at p < 0.10. ns = not significant (p > 0.10). † STIR = Soil Tillage Intensity Rating; Intensity = cropping intensity; MAP = mean annual precipitation (mm); MAT = mean annual
temperature (oC); BD = bulk density, pH = soil pH with 1:1 soil water extract; Cmin = carbon mineralization at one and 24 days; POXC = permanganate oxidizable carbon; MBC = microbial biomass carbon; MBN = microbial biomass nitrogen; WEOC = water extractable organic carbon; WEON = water extractable organic nitrogen.
Site STIR† Cropping Intensity SI MAT MAP
All sites ns ns ns ns 31%
Kambitsch ns NA NA
PCFS ns ns ns
Pnedleton 85% 5% ns
Moro 28% ns ns
Prosser ns NA NA
Variable† STIR Intensity MAP MAT BD pH Cmin0-1d Cmin0-24d POXC MBC MBN WEOC WEON
Hindex ns ns 0.55 -0.35 -0.57 -0.42 0.75 0.44 0.60 0.53 0.40 0.46 0.72
73
SUMMARY AND CONCLUSIONS
Multiple soil C and N properties were measured in this study and a few key soil
properties exhibited a significant correlation with other soil properties. Specifically, POXC
displayed a significant and strong correlation with SOC, total N, and the hydrolyzable and non-
hydrolyzable fractions of SOM; however the correlation of POXC with the more highly active
fractions of SOM, including one-day Cmin, and the microbial or water extractable fractions of
SOM, was not as strong. One-day Cmin was significantly correlated with cumulative Cmin
values throughout the incubation period, up to 24 days, and to a lesser extent with the
microbial biomass fraction. These results suggest that POXC is representative of building SOM
and SOM stabilization. Conversely, Cmin provides unique information about soil health not
captured by POXC, particularly microbial activity, decomposition, and nutrient cycling. This
finding that POXC and Cmin each provide unique information about soil health, coupled with
the ease of measurement and commercial availability of both tests (one-day Cmin test:
SolvitaTM gel system; POXC: HachTM palm top colorimeter), underlies the significance and
applicability of a coupling of these two measurements in analyzing soil health.
A multivariate regression of MAP, MAT, and tillage and cropping intensity, revealed that
MAP explains 57% of SOC variability and 69% of total N variability. When MAP was removed
from the model, MAT became the dominant variable, explaining 42% and 49%, respectively, of
SOC and total N variability. This result indicates that MAP is the main variable driving soil C and
N dynamics in the inland PNW. Furthermore, both the hydrolyzable and non-hydrolyzable
fractions of SOC were equally sensitive to climate, indicating that both chemically recalcitrant
and labile SOM is susceptible to a changing climate.
74
POXC, and subsequently SOM stabilization, showed sensitivity to tillage and, to a lesser
extent, cropping intensity. Values reported in the literature for POXC (419 – 1050 mg POXC kg-1
soil) indicate that soils within the inland PNW are below average in stabilized SOM (292 mg
POXC kg-1 soil). Along with the input of stabilized SOM, as has been reported in the literature,
other studies coupled with present findings suggest that cropping diversification along with NT
are essential to building POXC. Cmin values also showed sensitivity to both tillage and
cropping intensity. Cmin is, however, subject to variability from the spatial heterogeneity of
factors that influence this important soil property, and this fact must be considered in
interpretation of results. Values for one-day Cmin measured in the present study (34.0 – 81.0
mg CO2-C kg-1 soil) were within the range of values reported in the literature across a range of
conditions (8.9 to 100-mg CO2-C kg-1 soil), indicating that microbial activity, decomposition and
nutrient cycling capacity of soils are within an acceptable range. Results from the present study
along with literature findings suggest that cropping intensification/diversification along with NT
is also critical to enhancing Cmin.
The present study also revealed sensitivity of both NHC and HC to tillage intensity. This
result indicates that while these soil properties represent finite pools based on chemical
recalcitrance, resistance to hydrolysis is not equivalent to resistance to biodegradation under
land-use changes. Subsequently, NHC cannot be considered representative of only the passive
pool and HC representative of only the active pool; the reality of in-situ recalcitrance is a
continuum where a portion of the HC pool is part of the passive C pool through physical
protection, and a portion of the NHC pool is susceptible to biodegradation. It follows that the
75
fraction of SOC as NHC, thought to be reflective of SOM quality, is not an accurate indicator for
gauging the influence of management on soil health.
Last, evaluation of a soil health index which utilizes one-day Cmin, WEOC, and WEON
revealed sensitivity of this index to both climate and management. However, inherent
variability of the measurement made detecting significant differences in index values
associated with tillage and cropping intensity difficult, indicating the evaluation of soil health
using the index may benefit from increased field replication/samples. Values for the index for
soils in the inland PNW range from 3.6 to 8.8, whereas 0 to 50 is the reported range of potential
values; a range of 0-14, however is more realistic for soils within the inland PNW. Evaluation of
soil health using POXC and one-day Cmin provides important information about SOM
stabilization and nutrient cycling capacity, while the soil health index evaluated provides
information on building the more active fraction of SOM and, through consideration of an
important soil C/N ratio, offers insight on nutrient cycling capacity. Depending on management
goals, either method of gauging soil health, POXC coupled with one-day Cmin or Hindex, appears
to have applicability within inland PNW cropping systems.
76
REFERENCES Abiven, S., A. Heim, and M.W.I. Schmidt. 2011. Lignin content and chemical characteristics in
maize and wheat vary between plant organs and growth stages: consequences for assessing lignin dynamics in soil. Plant and Soil. 343(1/2): 369-378.
Andrews, S.S., D.L. Karlen, and C.A. Cambardella. 2004. The soil management assessment
framework: A quantitative soil quality evaluation method. Soil Science Society of America Journal. 68(6): 1945-1962.
Balesdent, J., A. Mariotti, and D. Boisgontier. 1990. Effect of tillage on soil organic
mineralization estimated from 13C abundance in maize fields. Journal of Soil Science. 41(4): 587-596.
Blair, G. J., R.D.B. Lefroy, and L. Lisle. 1995. Soil carbon fractions based on their degree of
oxidation, and the development of a carbon management index for agricultural systems. Australian Journal of Agricultural Research. 46(7): 1459-1466.
Bowman, R.A., J.D. Reeder, and L.W. Lober. 1990. Changes in soil properties after 3, 20, and 60
years of cultivation. Soil Science. 150(6): 851-857. Brown, T.T., and D.R. Huggins. 2012. Soil carbon sequestration in the dryland cropping region of
the Pacific Northwest. Journal of Soil and Water Conservation. 67(5): 406-415. Brady N.C., and R.R. Weil. 2010. The Nature and Properties of Soils, 13th ed. Prentice-Hall,
Upper Saddle River, NJ. Bu, X., L. Wang, W. Ma, X. Yu., W.H. McDowell, and H. Ruan. 2010. Spectroscopic
characterization of hot-water extractable organic matter from soils under four different vegetation types along an elevation gradient in the Wuyi Mountains. Geoderma. 159(1/2): 139-146.
Campbell, C.A., V.O. Biederbeck, B.G. McConkey, D. Curtin, and R.P. Zentner. 1999. Soil Quality
– Effect of tillage and fallow frequency: Soil organic matter quality as influenced by tillage and fallow frequency in a silt loam in southwestern Saskatchewan. Soil Biology & Biochemistry. 31(1): 1-7.
Chantigny, M.H., D. Curtin, M.H. Beare, L.G. Greenfield. 2010. Influence of temperature on
water-extractable organic matter and ammonium production in mineral soils. Soil Biology & Biochemistry. 74(2): 517-524.
Collins, H.P., E.T. Elliot, K. Paustian, L.G. Bundy, W.A. Dick, D.R. Huggins, A.J.M. Smucker, and
E.A. Paul. 2000. Soil carbon pools and fluxes in long-term Corn Belt agroecosystems. Soil Biology & Biochemistry. 32(2): 157-168.
77
Colman, B.P., and J.P. Schimel. 2013. Drivers of microbial respiration and net N mineralization
at the continental scale. Soil Biology & Biochemistry. 60(1): 65-76. Conant, R.T., M.G. Ryan, G.I. Agren, H.E. Birge, E.A. Davidson, P.E. Eliasson, S.E . Evans, S.D.
Frey, C.P. Giardina, F.M. Hopkins, R. Hyvonen, M.U.F. Kirschbaum, J.M. Lavallee, J. Leifeld, W.J. Parton, J.M. Steinweg, M.D. Wallenstein, J.A.M Wetterstedt and M.A. Bradford. 2011. Temperature and soil organic matter decomposition rates – synthesis of current knowledge and a way forward. Global Change Biology. 17(11): 3392-3404.
Culman, S.W., S.T. Dupont, J.D. Glover, D.H. Buckley, G.W. Fick, H. Ferris, and T.E. Crews. 2010.
Long-term impacts of high-input annual cropping and unfertilized perennial grass production on soil properties and belowground food webs in Kansas, USA. Agriculture, Ecosystems & Environment. 137(1/2): 13-24.
Culman, S.W., S.S. Snapp, M.A. Freeman, M.E. Schipanski, J. Beniston, R. Lal, L.E. Drinkwater,
A.J. Franzluebbers, J.G. Glover, A.S. Grandy, J. Lee, J. Six, J.E. Maul, S.B. Mirsky, J.T. Spargo, and M.M. Wander. 2012. Permanganate oxidizable carbon reflects a processed soil fraction that is sensitive to management. Soil Science Society of America Journal. 76(2): 494-504.
Culman, S.W., S.S. Snapp, J.M. Green, and L.E. Gentry. 2013. Short- and long-term labile soil
carbon and nitrogen dynamics reflect management and predict corn agronomic performance. Soil Fertility & Crop Nutrition. 105(2): 493-502.
Davidson, E.A., and I.A. Janssens. 2006. Temperature sensitivity of soil carbon decomposition
and feedbacks to climate change. Nature. 440(7081): 165-173. Deen, W., and P.K. Kataki. 2003. Carbon sequestration in a long-term conventional versus
conservation tillage experiment. Soil & Tillage Research. 74(2): 143-150. Denef, K. J. Six, R. Merckx, and K. Paustian. 2004. Carbon sequestration in microaggregates of
no-tillage soils with different clay mineralogy. Soil Science Society of America Journal. 68(6): 1935-1944.
Doran J.W. and T.B. Parkin. 1994. Defining and assessing soil quality. In Defining Soil Quality for
a Sustainable Environment. Edited by J.W. Doran, J.A.E. Molina, and R.F. Harris. SSSA Publication Number 35, Madison, WI. pp 3-21.
Dou, F., A. L. Wright, and F.M. Hons. 2008. Sensitivity of labile soil organic carbon to tillage in
wheat-based cropping systems. Soil Science Society of America Journal. 72(5): 1445-1453.
78
Eckert, D.J. 1991. Chemical attributes of soils subjected to no-till cropping with rye cover crops. Soil Science Society of America Journal. 55(2): 405-409.
Franzluebbers, A.J., and M.A. Arshad. 1996a. Soil organic matter pools during early adoption of
conservation tillage in Northwestern Canada. Soil Science Society of America Journal. 60(1): 1422-1427.
Franzluebbers, A.J., R.L. Haney, F.M. Hons, and D.A. Zuberer. 1996b. Determination of microbial
biomass and nitrogen mineralization following rewetting of a dried soil. Soil Science Society of America Journal. 60(4): 1133-1139.
Franzluebbers, A.J., R.L. Haney, C.W. Honeycutt, H.H. Schomberg, and F.M. Hons. 2000. Flush
of carbon dioxide following rewetting of dried soil relates to active organic pools. Soil Science Society of America Journal. 64(2): 613-623.
Franzluebbers, A.J. 2002. Soil organic matter stratification ratio as an indicator of soil quality.
Soil & Tillage Research. 66(1): 95-106. Gilbert, R.O. 1987. Statistical Methods for Environmental Pollution Monitoring, Van Nostrand,
Reinhold, New York. Halvorson, A.D., B.J. Weinhold, and A.L. Black. 2002. Tillage, nitrogen, and cropping system
effects on soil carbon sequestration. Soil Science Society of America Journal. 66(3): 906-912.
Haney, R.L. 2014. Soil Health. Available at:
http://www.nrcs.usda.gov/Internet/FSE_DOCUMENTS/nrcs144p2_043902.pdf. Last accessed: June 9, 2014.
Haney, R. L., W.H. Brinton, and E. Evans. 2008. Estimating soil carbon, nitrogen, and phosphorus
mineralization from short-term carbon dioxide respiration. Communications in Soil Science and Plant Analysis. 39(17/18): 2706-2720.
Haney R.L., A.J. Franzluebbers, V.L. Jin, M. Johnson, E.B. Haney, M.J. White, R.D. Harmel. 2012.
Soil organic C:N vs. water-extractable organic C:N. Open Journal of Soil Science. 2: 269-274.
Hassink, J. 1997. The capacity of soils to preserve organic C and N by their association with clay
and silt particles. Plant and Soil. 191(1): 77-87. He, Y., C. Chen, Z. Xu, D. Williams, and J. Xu. 2009. Assessing management impacts on soil
organic matter quality in subtropical Australian forests using physical and chemical fractionation as well as 13C NMR spectroscopy. Soil Biology & Biochemistry. 41(3): 640-650.
79
Huggins, D.R., G.A. Buyanovsky, G.H. Wagner, J.R. Brown, R.G. Darmody, T.R. Peck, G.W.
Lesoing, M.B. Vanotti, and L.G. Bundy. 1998. Soil organic C in the tallgrass prairie-derived region of the Corn Belt: effects of long-term crop management. Soil & Tillage Research. 47(3/4): 219-234.
Huggins, D. R., R.R. Allmaras, C.E. Clapp, J.A. Lamb, and G.W. Randall. 2007. Corn-soybean
sequence and tillage effects on soil carbon storage and dynamics. Soil Science Society of America Journal. 71(1): 145-154.
Huggins, D.R., R. Rupp, P. Gessler, W. Pan, D. Brown, S. Machado, J. Abatzoglou, V. Walden and S.
Eigenbrode. 2011. Dynamic agroecological zones for the inland Pacific Northwest, USA. American Geophysical Union, Fall Meeting 2011.
Idowu, O.J., H.M. van Es, G.S. Abawi, D.W. Wolfe, R.R. Schindelbeck, B.N. Moebius-Clune, and
B.K. Gugino. 2009. Use of an integrative soil health test for evaluation of soil management impacts. Renewable Agriculture and Food Systems. 24(3): 214-224.
Jenny, H. 1941. Factors of Soil Formation, New York: McGraw-Hill. Johnson-Maynard, J. L., K. J. Umiker, K. J, and S.O. Guy. 2007. Earthworm dynamics and soil
physical properties in the first three years of no-till management. Soil & Tillage Research. 94(2): 338-345.
Kirschbaum, M.U.F. 2000. Will changes in soil organic carbon act as a positive or negative
feedback on global warming?. Biogeochemistry. 48(1): 21-51. Kravchenko, A.N., and G.P. Robertson. 2011. Whole-profile soil carbon stocks: the danger of
assuming too much from analyses of too little. Soil Science Society of America Journal. 75(1): 235-240.
Krull, E.S., J.A. Baldock, and J.O. Skjemstad. 2003. Importance of mechanisms and processes of
stabilisation of soil organic matter for modeling turnover. Functional Plant Biology. 30(2): 207-222.
Lefevre, R., P. Barre, F.E. Moyano, B.T. Christensen, G. Bardoux, T. Eglin, C. Girardin, S. Houot, T.
Katterer, F. Van Oort, and C. Chenu. 2014. Higher temperature sensitivity for stable than for labile soil organic carbon – Evidence from incubations of long-term bare fallow soils. Global Change Biology. 20(2): 633-640.
Liebig, M.A., D.L. Tanaka, and B.J. Wienhold. 2004. Tillage and cropping effects on soil quality
indicators in the northern Great Plains. Soil & Tillage Research. 78(1): 131-141.
80
Littell, J.S., M. McGuire Elsner, L.C. Whitely Binder, and A.K. Snover (eds). 2009. The Washington Climate Change Impacts Assessment: Evaluating Washington's Future in a Changing Climate - Executive Summary. In The Washington Climate Change Impacts Assessment: Evaluating Washington's Future in a Changing Climate, Climate Impacts Group, University of Washington, Seattle, Washington.
Lucas, S.T., and R.R. Weil. 2012. Can a labile carbon test be used to predict crop responses to
improve soil organic matter management?. Agronomy Journal. 104(4): 1160-1170. Luxhoi, J., S. Bruun, B. Stenberg, T.A. Breland, and L.S. Jensen. 2006. Prediction of gross and net
nitrogen mineralization-immobilization turnover from respiration. Soil Science Society of America Journal. 70(4): 1121-1128.
Mann, L.K. 1986. Changes in soil carbon storage after cultivation. Soil Science. 142(1): 279-288. Marinari, S., K. Liburdi, A. Fliessbach, and K. Kalbitz. 2010. Effects of organic management on
water-extractable organic matter and C mineralization in European arable soils. Soil & Tillage Research. 106(2): 211-217.
Martens, D.A., and K.L. Loeffelmann. 2003. Soil amino acid composition quantified by acid
hydrolysis and anion chromatography-pulsed amperometry. Journal of Agriculture and Food Chemistry. 51(22): 6521-6529.
Martel, Y.A., and E.A. Paul. 1974. Effects of cultivation on the organic matter of grasslands soils
as determined by fractionation and radiocarbon dating. Canadian Journal of Soil Science. 54(4): 419-426.
McLauchlan, K.K., and S.E. Hobbie. 2004. Comparison of labile soil organic matter fractionation
techniques. Soil Science Society of America Journal. 68(1): 1616-1625. Mirsky, S.B., L.E. Lanyon, and B.A. Needelman. 2008. Evaluating soil management using
particulate and chemically labile soil organic matter fractions. Soil Science Society of America Journal. 71(1): 180-185.
Olson, B.M., and L.E. Lowe. 1990. Effects of intensive vegetable production on the hydrolyzable
carbon, nitrogen, and sulfur of a British-Colombia humisol. Canadian Journal of Soil Science. 70(4): 621-628.
Pare, T., H. Dinel, M. Schnitzer, and S. Dumontet. 1998. Transformations of carbon and nitrogen
during composting of animal manure and shredded paper. Biology and Fertility of Soils. 26(3): 173-178.
81
Paul, E.A., H.P. Collins, and S.W. Leavitt. 2001. Dynamics of resistant carbon of Midwestern agricultural soils measured by naturally occurring 14C abundance. Geoderma. 104(3/4): 239-256.
Paul, E.A., R.F. Follett, S.W. Leavitt, A. Halvorson, G.A. Peterson, and D.J. Lyon. 1997.
Radiocarbon dating for determination of soil organic matter pool sizes and dynamics. Soil Science Society of America Journal. 61(1): 1058-1067.
Paul, E. A., S.J. Morris, R.T. Conant, and A.F. Plante. 2006. Does the acid hydrolysis-incubation
method measure meaningful soil organic matter pools? Soil Science Society of America Journal. 70(3): 1023-1035.
Pennock, D., T. Yates, and J. Braidek. 2008. Soil microbial biomass C, N, P, and S. Chapter 1 In:
Soil Sampling and Methods of Analysis. M.R. Carter and E.G. Gregorich (eds.). Canadian Society of Soil Science. CRC Press, Boca Raton FL.
Plante, A.F., R.T. Conant, E.A. Paul, K. Paustian, and J. Six. 2006. Acid hydrolysis of easily
dispersed and microaggreagte-derived silt- and clay-sized fractions to isolate resistant soil organic matter. European Journal of Soil Science. 57(4): 456-467.
Plante, A.F., R.T. Conant, J. Carlson, R. Greenwood, J.M. Shulman, M.L. Haddix, and E.A. Paul.
2010. Decomposition temperature sensitivity of isolated soil organic matter fractions. Soil Biology & Biochemistry. 42(1): 1991-1996.
Poirier, N., S. Derenne, J. Balesdent, C. Chenu, G. Bardoux, A. Mariotti, and C. Largeau.
Dynamics and origin of the non-hydrolyzable organic fraction in a forest and a cultivated temperate soil, as determined by isotopic and microscopic studies. European Journal of Soil Science. 57(5): 719-730.
Post, W.M., W.R. Emanuel, P.J. Zinke, and A.G. Stangenberger. 1982. Soil carbon pools and
world life zones. Nature. 298(1): 156-159. Powlson, D.S., and P.C. Brookes. 1987. Measurement of soil microbial biomass provides an early
indication of changes in total soil organic matter due to straw incorporation. Soil Biology and Biochemistry. 19(2): 159-164.
Purakayastha, T.J., D.R. Huggins, and J.L. Smith. 2008. Carbon sequestration in native prairie,
perennial grass, no-till, and cultivated Palouse silt loam. Soil Science Society of America Journal. 72(2): 534-540.
Regional Approaches to Climate Change (REACCH) Annual Report: Year 3. 2014. Available at:
https://www.reacchpna.org/files/2613/9336/7697/REACCHReportyear3.pdf.
82
Rees, R.M., and J.P. Parker. 2005. Filtration increases the correlation between water extractable organic carbon and soil microbial activity. Soil Biology & Biochemistry. 37(12): 2240-2248.
Rovira, P., and V.R. Vallejo. 2002. Labile and recalcitrant pools of carbon and nitrogen in organic
matter decomposing at different depths in soil: and acid hydrolysis approach. Geoderma. 107(1/2): 109-141.
Rovira, P., and V.R. Vallejo. 2007. Labile, recalcitrant, and inert organic matter in Mediterranean
forest soils. Soil Biology & Biochemistry. 39(1): 202-215. Setala, H., J. Laakso, J. Mikola, and V. Huhta. 1998. Functional diversity of decomposer
organisms in relation to primary production. Applied Soil Ecology. 9(1/3): 25-31. Schomberg, H.H., and O.R. Jones. 1999. Carbon and nitrogen conservation in dryland tillage and
cropping systems. Soil Science Society of America Journal. 63(1): 1359-1366. Smith, J.L., J.J. Halvorson, and H. Bolton Jr. 2002. Soil properties and microbial activity across a
500 m elevation gradient in a semi-arid environment. Soil Biology & Biochemistry. 34(11): 1749-1757.
Spargo, J.T., M.A. Cavigelli, S.B. Mirsky, J.E. Maul, J.J. Meisinger. 2011. Mineralizable soil
nitrogen and labile soil organic matter in diverse long-term cropping systems. Nutrient Cycling in Agroecosystems. 90(2): 254-266.
Spehn, E.M., J. Joshi, B. Schid, J. Alphei, and C. Korner. 2000. Plant diversity and soil
heterotrophic activity in experimental grassland ecosystems. Plant and Soil. 224(2): 217-230.
Sylvia, D.M., J.J. Fuhrmann, P.G. Hartzel, and D.A. Zuberer. 2005. Principles and applications of
soil microbiology, 2nd ed. Prentice-Hall, Upper Saddle River, NJ. Tabatabai, M.A., and J.M. Bremner. 1970. Use of the Leco automatic 70-second carbon analyzer
for total carbon analysis of soils. Soil Science Society of America Proceedings. 34(1): 608-610.
Thiessen, S., G. Gleixner, T. Wutzler, and M. Reichstein. 2013. Both priming and temperature
sensitivity of soil organic matter decomposition depend on microbial biomass – an incubation study. Soil Biology & Biochemistry. 57(1): 739-748.
USDA-NRCS. 2006. The soil tillage intensity rating (STIR). TN Agronomy No. 50. Boise Idaho. USDA-NRCS. 2011. Natural Resources Conservation Service Conservation Practice Standard:
Residue and tillage management no till/strip till/direct seed. Code 329.
83
Veihmeyer, F.J., and A.H. Hendrickson. 1948. Soil density and root penetration. Soil Science.
65(1): 487-493. Voroney, R.P., P.C. Brookes, and R.P. Beyaert. 2008. Soil microbial biomass C, N, P, and S.
Chapter 49 In: Soil Sampling and Methods of Analysis. M.R. Carter and E.G. Gregorich (eds.). Canadian Society of Soil Science. CRC Press, Boca Raton FL.
Watts, D.B., H.A. Torbert, S.A. Prior, and G. Huluka. 2010. Long-term tillage and poultry litter
impacts soil carbon and nitrogen mineralization and fertility. Soil Science Society of America Journal. 74(4): 1239-1247.
Weil, R.R., K.R. Islam, M.A. Stine, J.B. Gruver, and S.E. Samson-Liebig. 2003. Estimating active
carbon for soil quality assessment: A simplified method for laboratory and field use. American Journal of Alternative Agriculture. 18(1): 3-17.
Weil, R.R., and F. Magdoff. 2004. Significance of soil organic matter to soil quality and health. In
Soil Organic Matter in Sustainable Agriculture. Edited by F. Magdoff, and R. W. Ray. CRC Press Inc. Boca Raton, pp 45-65.
Weinhold, B.J., and A.D. Halvorson. 1998. Cropping system influences on several soil quality
attributes in the northern Great Plains. Journal of Soil and Water Conservation. 53(3): 254-258.
Wienhold, B.J., J.L. Pikul Jr., M.A. Liebig, M.M. Mikha, G.E. Varvel, J.W. Doran, and S.S. Andrews.
2005. Cropping systems effects on soil quality in the Great Plains: synthesis from a regional project. Renewable Agriculture and Food Systems. 21(1): 49-59.
Williams, J.D., H.T. Gollany, M.C. Siemens, S.B. Wuest, and D.S. Long. 2009. Comparison of
runoff, soil erosion, and winter wheat yields from no-till and inversion tillage production systems in northeastern Oregon. Journal of Soil and Water Conservation. 64(1): 43-52.
Williams, and S.B. Wuest. 2011. Tillage and no-tillage conservation effectiveness in the intermediate precipitation zone of the inland Pacific Northwest, United States. Journal of Soil and Water Conservation. 66(4): 242-249.
Wynn, J.G., M.I. Bird, L. Vellen, E. Grand-Clement, J. Carter, and S.L. Berry. 2006. Continental-
scale measurement of the soil organic carbon pool with climatic, edaphic, and biotic controls. Global Biogeochemical Cycles. 20(1): 1-12.
Xu, N., H.F. Wilson, J.E. Saiers, and M. Entz. 2013. Effects of crop rotation and management
system on water-extractable organic matter concentration, structure, and bioavailability in a chernozemic agricultural soil. Journal of Environmental Quality. 42(1): 179-190.

84
Zhang, M., Z. He, A. Zhao, H. Zhang, D.M. Endale, and H.H. Schomberg. 2011. Water-extractable
soil organic carbon and nitrogen affected by tillage and manure application. Soil Science.
176(6): 307-312.
85
CHAPTER 3
CLIMATE, MANAGEMENT, SOIL CARBON AND NITROGEN PROPERTIES, AND THEIR
RELATIONSHIP WITH IMPORTANT SOIL PROCESSES: A SOIL HEALTH PERSPECTIVE
ABSTRACT
Certain soil biogeochemical processes are critical to soil productivity and
environmentally significant; therefore, they are an important component of a soil health
assessment. Within the inland Pacific Northwest, we selected four dryland sites and one
irrigated site to assess the relationship of soil C and N properties, mean annual temperature
(MAT) and precipitation (MAP), and tillage and cropping intensity with potential nitrogen
mineralization (PNM), basal (BDR) and potential denitrification (PDR), and plant available
nutrients (NO3-, NH4
+, P, S, Ca, Mg, K, Mn, Fe, Zn, B, Cu) as measured from PRSTM probes
(Western Ag Innovations, Saskatoon, Canada). Tillage practices included in the study ranged
from tillage with a moldboard plow to no-till (NT) and cropping intensification systems ranged
from winter wheat (WW)/fallow to perennial cropping systems. MAP across the study sites
ranged from 200 to 663 mm and MAT ranged from 8.4oC to 10.9oC.
Multiple soil C and N properties displayed a significant positive correlation with PNM;
however, soil organic carbon (SOC) (r = 0.59) and total N (r = 0.67) displayed the highest
correlation. PNM was significantly correlated with 24-hour PRSTM – probe NO3- (r = 0.45) but
not with 28 day PRSTM - probe NO3-. An increase in MAT was associated with a decrease in PNM
(r = -0.73), while an increase in MAP was associated with an increase in PNM (r = 0.60).
Management factors also significantly influenced PNM; PNM was negatively correlated with an
86
increase in tillage intensity (r = -0.32) and positively correlated with cropping intensity (r =
0.40).
PDR was positively correlated with several soil C and N properties, including SOC (r =
0.70), total N (r = 0.57), and PNM (r = 0.69), while BDR was only significantly correlated with
initial soil inorganic N (r = 0.31). Across the four dryland sites, MAT was negatively correlated
with PDR (r = -0.66) and to a lesser extent BDR (r = -0.34), while MAP was only correlated with
PDR (r = 0.55). Tillage intensity was correlated with both BDR (r = 0.32) and PDR (r = 0.32);
however PDR and BDR were not influenced by cropping intensity. This relationship, however,
varied by site according to soil C and N properties and crop rotations with legumes comprising
half or more of the rotations exhibited increased PDR. Additionally, the one irrigated site
experienced BDR and PDR up to an order of magnitude greater than the dryland sites, mainly
attributed to sandier soils and more accessible substrate. Plant available nutrients displayed
varying correlations with soil C and N properties and management and climate factors.
A multivariate regression analysis showed that multiple indices could be combined to
improve prediction of PNM (total n, water extractable carbon, MAT; r2 = 0.81), 28 day PRSTM –
probe total N (24-hour PRSTM total N, total inorganic N, tillage, cropping intensity; r2 = 0.62),
and PDR (total N, permanganate oxidizable carbon, C mineralized at 24 hours, MAT; r2 = 0.64),
but combining these indices did not improve prediction of BDR. This finding reveals that within
the inland PNW, combining indices of more easily measured properties can improve the
prediction of these more difficult-to-measure soil processes so important to soil health.
87
INTRODUCTION
An important objective of assessing soil health is assuring long-term soil productivity
while minimizing or eliminating environmental deterioration (Doran & Parkin, 1994).
Underlying these objectives are soil biogeochemical processes that are critical to soil
productivity and are environmentally significant. Soil organic matter (SOM) is often associated
with soil health as it is critical to many important soil properties and processes. SOM is
associated with building soil aggregate structure, reducing erosion, enhancing water infiltration
and retention, providing a source of energy and nutrients to soil organisms, and through
mineralization, providing an important source of plant nutrients (Haynes, 2005). SOM is
comprised of an assortment of constituents; however, soil organic carbon (SOC) is a dominant
component of SOM (Weil et al., 2003) while total N is variable (Brady and Weil, 2010) but an
important nutrient from a soil health perspective due to both its role in soil productivity and its
potential to be an environmental pollutant. As such, SOC and total N are often targeted when
evaluating SOM, and understanding the relationship between these soil health properties and
important soil processes can make an assessment of soil health more impactful.
It is also critical to understand the influence of management options on soil health as
they can undermine, stabilize, or enhance soil processes (Franzluebbers, 2002). Tillage and
cropping intensification are important management choices as they can alter SOC and total N
dynamics. Cultivation increases soil disturbance and is associated with reduced soil aggregation
and increased oxidation of SOM (Six et al., 2002). Conversely, increasing primary production
through reducing fallow represents a potential mechanism to increase SOM (West and Post,
2002) and maintain or enhance soil processes. Consequently, many have cited improved soil
88
health associated with no-till (NT) management and cropping intensification (Schomberg and
Jones, 1999; Deen and Katkai, 2003; Liebig et al., 2004). However, NT has also been associated
by some researchers with initially increasing bulk density, which has negative consequences for
crop production and SOC inputs to the soil as well as for soil water nutrient dynamics and water
runoff (Franzluebbers et al., 2007). The choice is further complicated by economic
considerations, as adoption of NT can require a significant up-front investment in equipment.
Potential nitrogen mineralization (PNM) is often associated with soil health as it is
driven by the microbial population and is an integrator of biotic and abiotic factors, including
climate, management, and substrate availability and quality. This mineralization process not
only represents the ability of the microbial population to decompose plant residue and SOM,
but it also provides an important source of plant-available nutrients, two functions which are an
important component of soil health (Dorin & Parkin, 1994).
Research is inconclusive regarding the correlation between plant N uptake and PNM,
some demonstrating a strong correlation (Keeney & Bremner, 1966), and others mixed results
(Thicke et al., 1993). Additionally, this correlation has been found to be dependent by some on
the method of determining PNM. Specifically, a study by Curtin and McCallum (2004) found
that N uptake by glasshouse-grown oats derived from mineralization was strongly correlated
with aerobic N determined at 28 days (r2 = 0.79), while anaerobic N measured at 7 days
displayed a poor correlation with plant N uptake under the same conditions (r2 = 0.32).
Nonetheless, for non-leguminous crops, inorganic N availability represents a potential yield-
limiting factor and as such, the N mineralized from SOM by the microbial population represents
a potentially significant pool of N for crop growth (Cabrera et al., 1994); consideration of this
89
source of N represents an opportunity for maximizing N-use efficiency and minimizing
environmental loss (Schomberg et al., 2009). Furthermore, management options such as
cropping intensity and tillage practices, along with climate potentially alter the nature of SOM
and soil microbial biomass; this alteration of SOM in turn will likely influence the PNM
associated with a given soil (Franzluebbers et al., 1994), making it important to understand how
management practices and soil C and N properties alter PNM.
While PNM is a component of the N cycle that represents an important source of N,
denitrification is a component of the N cycle that represents not only a loss of N from the soil N
pool, but also a source of nitrous oxide (N2O) in the atmosphere, a major greenhouse gas with
global warming potential 298 times that of CO2 (Pittelkow, 2013). Agriculture is considered the
largest source of anthropogenic N2O, responsible for 70% of atmospheric N20 emissions from
this subgroup, the major source being agricultural soils (Kroeze, 1999). In particular, soil
denitrification is responsible for 5% of the overall anthropogenic greenhouse effect (IPCC,
2007). While a certain amount of denitrification from agricultural soils is inevitable, a better
understanding of the influence of management as well as soil C and N properties on
denitrification represents an opportunity for mitigation of this anthropogenic source.
Furthermore, as two tenets of soil health are promotion of plant available nutrients and
minimization of environmental impact, both of which are endangered by denitrification,
improved understanding of denitrification represents an opportunity for improving soil health.
In addition to PNM and denitrification, plant macro- and micronutrient availability is an
important soil factor that influences productivity and subsequently soil health. Plant nutrient
90
availability is dependent on a number of factors, including SOM, texture, cation exchange
capacity (CEC), and management factors such as tillage (Havlin et al., 1999).
Ion exchange resins have a long history in agricultural research (Schlenker, 1942) and
are intended to measure plant-available nutrients and their release rate (Qian and Schoenau,
2001). In assessing the relationship between conventional soil tests involving chemical
extraction and those involving exchange resins, Pampolino and Hatano (2000) found that
similar dynamics governing the flow of phosphorus and potassium to plant roots also governed
the rate at which these ions were adsorbed to resins in a laboratory setting, therefore
concluding that exchange resins accurately represent plant-available nutrients. Qian and
Schoenau (1995) found N uptake by canola in a two-week period was more closely
approximated by exchange resins than that measured by incubation and extraction with CaCl2
and cited others who have documented a cumulative inhibitory mineralization effect associated
with traditional incubation/extraction methods. They observed that exchange resins are not
subject to this phenomenon since they act as an ion sink and are influenced by the kinetics of
nutrient release and transport that more traditional soil tests do not capture (Qian and
Schoenau, 2005).
Similar to their 1995 study, Qian and Schoenau (2005) found that N adsorbed to the
exchange membrane of plant root simulators (PRSTM) probes (Western Ag Innovations,
Saskatoon, Canada) used in a 2-week aerobic incubation closely correlated to plant N uptake
across a range of soil types and management histories. Furthermore, Walley et al. (2002) found
NO3- N adsorbed to PRSTM probes after a two-week incubation was significantly correlated with
both wheat yield and plant N accumulation.
91
In consideration of these important soil processes – PNM, denitrification, and plant
macro- and micronutrient supply – and their importance to soil health, the objectives of this
study were to 1) identify the relationship of measured soil C and N properties with PNM,
denitrification, and nutrient supply, 2) explore the influence of mean annual temperature
(MAT) and mean annual precipitation (MAP) within the inland Pacific Northwest (PNW) on
PNM, denitrification, and nutrient supply, and last 3) identify how tillage and cropping
intensification influence PNM, denitrification, and nutrient supply.
METHODS AND MATERIALS
Site Descriptions
Research plots located in five long-term agricultural research centers within the dryland
and irrigated cropping regions of the inland PNW comprise the basis of this study. These
research plots are located at the following research centers: Kambitsch Farm near Genesee, ID,
operated by the University of Idaho; Palouse Conservation Field Station near Pullman, WA;
Pendleton Research Station near Pendleton, OR and Sherman Research Station near Moro, OR,
both associated with the Columbia Basin Agricultural Research Center near Pendleton, OR; and
Irrigated Agricultural Research Center near Prosser, WA. These five sites were selected based
on the cropping systems present as well as the range of climactic conditions collectively
represented by the sites. Together, the five sites span four agroecological classes (AECs), or
land use classifications that represent unique biophysical and socioeconomic conditions that
result in distinct cropping systems (Huggins et al., 2011). The five sites comprising this study
span all four AECs of the inland PNW as defined by Huggins et al. (2011): (1) annual cropping
(limited annual fallow); (2) annual crop-fallow transition (e.g. 3-yr rotations with fallow every
92
third year); (3) grain-fallow (e.g. 2-yr wheat-fallow rotation); and (4) irrigated. Following is a
description of these sites. For the purposes of this study, unless otherwise noted, the winter
wheat portion of rotations represents the crop present during sampling.
Kambitsch Farm, University of Idaho – Genesee, ID (AEC 1)
The Kambitsch experimental plots selected for this research originated in 2000 to study
the effects of tillage on soil properties and crop growth. The experimental design is a split-plot
randomized complete block design and sub-plots are 6.1 m by 80.5 m; however, as winter
wheat was the only crop sampled, in the context of this study, the experimental design
simplifies to randomized complete block design. Prior to 2000, the site was managed strictly
with conventional tillage. The predominant soil type is a Palouse silt loam (fine-silty, mixed,
superactive, mesic Pachic Ultic Haploxeroll). The crop rotation present since 2010 includes
winter wheat (WW) (Triticum aestivum) -spring cereal (SC) (barley - Hordeum vulgare or spring
wheat) - spring legume (SL) (garbanzo – Cicer arietinum or spring pea - Pisum sativum) with
tillage as the management variable (Table 2.1). Prior to 2010, crop sequences were not
randomized and additional management details can be found in Johnson-Maynard et al. (2007).
In 2010, whole plots were subdivided into three equal subplots with the present crop rotation
randomized across these subplots. The whole plot tillage treatments that were present prior to
2010 remained the same after subdividing to allow for crop randomization within a given tillage
treatment. CT plots are tilled a few days prior to planting for both fall and spring planted crops
using a Glenco Soil Saver followed by a Will-Rich 2500 field cultivator. NT and CT plots are
planted with a Flexi-Coil No-Till drill at 25.4-cm row spacing.
93
Palouse Conservation Field Station – Pullman, WA (AEC 1)
Soils at this site consist predominately of Palouse (fine-silty, mixed, superactive, mesic
Pachic Ultic Haploxeroll) and Thatuna (fine-silty, mixed, superactive, mesic Oxyaquic Argixerolls)
silt loam. Plots range in size from a minimum of 11-m wide to accommodate field-scale
equipment up to 30 m in width and from 100- to 350-m in length as needed to capture
significant portions of soil and landscape variability. The plots selected for study include five
cropping systems established in 2001 and arranged in a randomized complete block design with
three replications. The five cropping systems include two perennial systems, two, 3-year
annual cropping systems that are continuous NT planted and one organic system that is a
combination of perennial and annual crops (Table 2.1). The perennial systems include a native
prairie system and a perennial tall wheatgrass system. The native perennial system was
established in accordance with Conservation Reserve Program (CRP) guidelines and planted
with Idaho Fescue (Festuca idahoensis) and Bluebunch Wheatgrass (Agropyron spicatum). The
perennial wheatgrass plots were planted with a tall wheatgrass, developed from a hybrid of
annual wheat and Thinopyrum, a cool-season perennial grass known to produce large quantities
of aboveground biomass. The annual, NT cropping systems include two rotations: WW-SB-SW
and WW-SL-SW. These plots are seeded with a Cross Slot® inverted-T opener no-till drill at
25.4-cm row spacing. The organic cropping system is a reduced tillage alfalfa (Medicago sativa)-
cereal-SL rotation managed according to organic agriculture protocols. The organic system was
planted to a spring pea green manure crop during collection of the soil samples analyzed for
this study.
94
Pendleton Station, Columbia Agriculture Research Center – Pendleton, OR (AEC 2)
The management variables studied at this site are tillage and cropping intensity. Three
different rotations were selected for study and consist of WW-NT fallow rotation under NT
initiated in 1982, a WW-fallow rotation with CT initiated in 1997, and a WW-winter pea (WP)
(Pisum sativum) rotation under NT initiated in 1997 (WP was inserted in the rotation in 2012;
prior to 2012 the rotation was WW-NT fallow). Prior to 1997, these latter two rotations were
under CT that used a mold-board plow. Soils in these plots are predominately a Walla-Walla silt
loam (coarse-silty, mixed, superactive, mesic Typic Haploxerolls). Plots are 2.0 m by 33.5 m and
the experimental design is a factorial design using tillage and fertilizer rate (0 and 120 kg/ha
banded) as the treatments with four reps for each factorial combination Only fertilized plots in
WW were selected for this study, and the plots were subsequently modeled as randomized
complete block design (Table 2.1). For all plots, WW is planted in mid-October and harvested in
mid to late July. A moldboard plow is used on CT plots for primary tillage in spring of the fallow
year. These plots are also rod-weeded as necessary through the summer fallow season until fall
planting of WW. All plots are seeded with a Noble No-Till modified deep furrow drill at 25.4-cm
row spacing.
Sherman Station, Columbia Agriculture Research Center – Moro, OR (AEC 3)
Experimental plots located in Moro, Oregon, were initiated in 2003 to compare NT and
CT for annual cropping, as well as two- and three-year rotations with and without a fallow
period. The predominate soil type at the site is a Walla Walla silt loam (coarse-silty, mixed,
superactive, mesic Typic Haploxeroll). The following four rotation and tillage treatments were
selected for this study: WW-fallow under CT, and WW-WP, WW-fallow, WW-SB-fallow all
95
under NT management (Table 2.1). Plots are 15 m by 105 m, and the experimental design is a
randomized complete block design with three blocks. CT plots are tilled in the spring using a
chisel plow and rod weeded as necessary from May to August. Winter wheat is seeded in
September or early October at 40-cm row spacing. NT plots are direct seeded using a Fabro
drill at 30-cm row spacing.
Prosser Irrigated Agricultural Research Station – Prosser, WA (AEC 4)
This experiment was established in the fall of 2011 to study winter cover crop and NT
management effects on crop productivity, water use efficiency, and N and C cycling. Due to the
short history of this site, only plots not under a winter cover crop were selected for the
purposes of this study and tillage was selected as the management variable. The predominate
soil type is a Warden silt loam (coarse-silty, mixed, superactive, mesic Xeric Haplocambids). The
crop rotation is WW-Sweet Corn (Zea mays)-potato (Solanum tuberosum); all crops are irrigated
throughout the growing season as neededAll plots, NT and CT, are disced prior to potato
planting and after harvest of potatoes prior to planting WW. Otherwise, NT pots receive
minimum disturbance. WW is planted using a Fabro drill at 16.5-cm row spacing. Plots are 4.9
m by 14.6 m and the experimental design is randomized complete block design (Table 2.1).
Tillage and Cropping Intensity
These five study sites represent a range of tillage and cropping intensities. The Natural
Resources Conservation Service (NRCS) has developed a system of quantifying soil disturbing
activities known as the soil tillage intensity rating (STIR) (USDA-NRCS, 2006). The STIR was
developed by the NRCS for use in calculating potential soil erosion utilizing the revised universal
96
soil loss equation (RUSLE2) (USDA-NRCS, 2006). The rating captures the range and severity of
operations for an entire rotation, from spraying herbicide to plowing, planting and harvesting.
The final STIR value is annualized based on the set of operations required for the entire rotation
(Table 2.1). More on this rating and how it was derived for each site can be found in Appendix
A.
The NRCS establishes a STIR of 30 as the maximum value for NT operations (USDA-NRCS,
2011). In the previous site descriptions and in subsequent tables, all treatments with a STIR
exceeding 30 are referred to as CT, while those under 30 are referred to as NT. The primary
tillage implement for CT plots are listed in Table 2.1. Prosser is the deviation from this
dichotomy, as plots managed primarily under NT are subject to greater disturbance due to the
presence of potatoes in rotation, and consequently plots at Prosser managed as NT have a STIR
greater than 30 (Table 2.1).
Cropping intensity was captured by assigning a value to each crop in a rotation based on
the duration of growing plant cover (months) in a 12-month period. The following values were
used for this study: perennial crops – 0.83 (10 months divided by 12 months), fall planted crops
– 0.75 (9 months divided by 12 months), spring planted crops – 0.33 (4 months divided by 12
months). The intensity rating for a rotation was derived by summing this value for each crop in
the rotation and averaging across the length of the rotation (Table 2.1). More details on
calculating cropping intensity values for each cropping system are available in Appendix A.
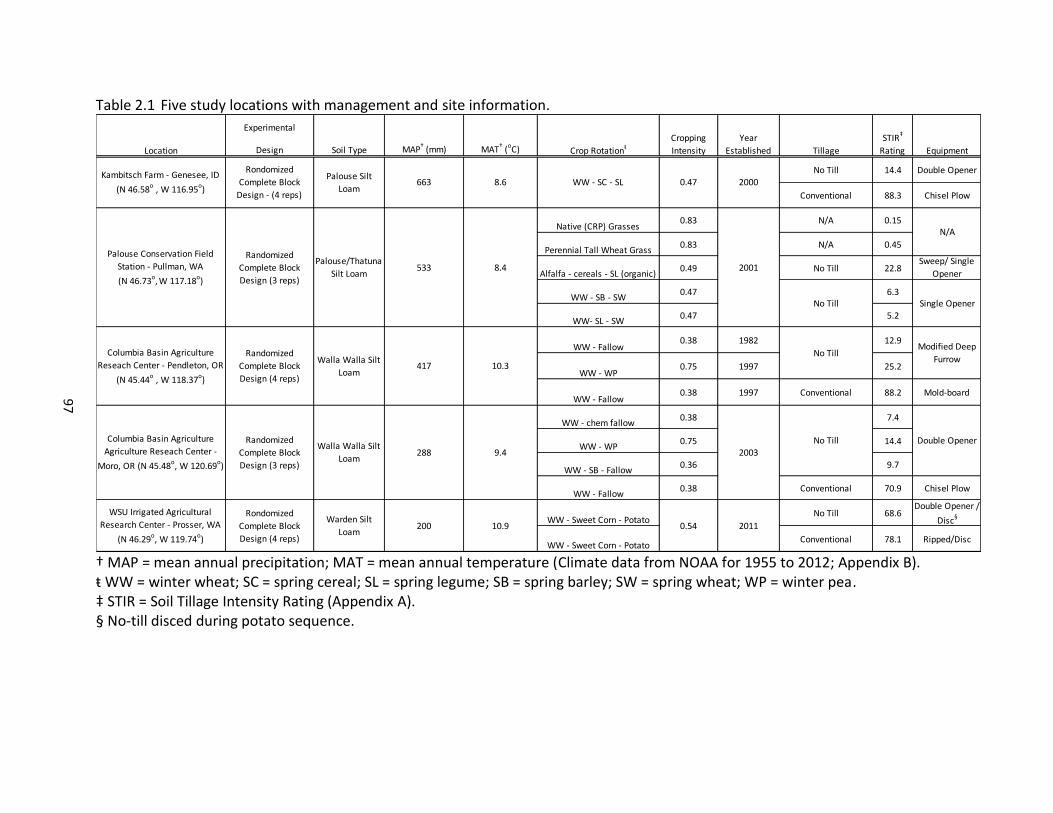
97
Table 2.1 Five study locations with management and site information.
† MAP = mean annual precipitation; MAT = mean annual temperature (Climate data from NOAA for 1955 to 2012; Appendix B). ŧ WW = winter wheat; SC = spring cereal; SL = spring legume; SB = spring barley; SW = spring wheat; WP = winter pea. ‡ STIR = Soil Tillage Intensity Rating (Appendix A). § No-till disced during potato sequence.
Experimental
Design Soil Type MAP† (mm) MAT
† (
oC)
No Till 14.4 Double Opener
Conventional 88.3 Chisel Plow
Native (CRP) Grasses0.83 N/A 0.15
Perennial Tall Wheat Grass0.83 N/A 0.45
Alfalfa - cereals - SL (organic)0.49 No Till 22.8
Sweep/ Single
Opener
WW - SB - SW0.47 6.3
WW- SL - SW0.47 5.2
WW - Fallow0.38 1982 12.9
WW - WP0.75 1997 25.2
WW - Fallow0.38 1997 Conventional 88.2 Mold-board
WW - chem fallow0.38 7.4
WW - WP0.75 14.4
WW - SB - Fallow0.36 9.7
WW - Fallow0.38 Conventional 70.9 Chisel Plow
WW - Sweet Corn - PotatoNo Till 68.6
Double Opener /
Disc§
WW - Sweet Corn - PotatoConventional 78.1 Ripped/Disc
Location
Year
Established Tillage EquipmentCrop Rotationŧ
Cropping
Intensity
20000.47
STIR‡
Rating
WSU Irrigated Agricultural
Research Center - Prosser, WA
(N 46.29o, W 119.74o)
Palouse Conservation Field
Station - Pullman, WA
(N 46.73o, W 117.18o)
8.4533Palouse/Thatuna
Silt Loam
Randomized
Complete Block
Design (3 reps)
Columbia Basin Agriculture
Reseach Center - Pendleton, OR
(N 45.44o , W 118.37o)
Randomized
Complete Block
Design (4 reps)
Walla Walla Silt
Loam417
Rondomized
Complete Block
Design (4 reps)
Warden Silt
Loam
Columbia Basin Agriculture
Agriculture Reseach Center -
Moro, OR (N 45.48o, W 120.69o)
Randomized
Complete Block
Design (3 reps)
Walla Walla Silt
Loam
WW - SC - SLKambitsch Farm - Genesee, ID
(N 46.58o , W 116.95o)
Palouse Silt
Loam663 8.6
Rondomized
Complete Block
Design - (4 reps)
288 9.4
2011
2003
0.54200
No Till
No Till
10.9
2001
Modified Deep
Furrow
Single Opener
N/A
Double OpenerNo Till
10.3
98
Soil Sampling
Each site was sampled in June and July of 2013, prior to harvest, to a depth of 10-cm,
collecting 50 to 60 samples across each plot using a hand-operated soil probe (2.0 cm inside
diameter). Four bulk density cores (3.0 cm inside diameter) were also collected from each
subject plot using a hand-operated soil probe; these samples were also used to determine field
water content. All samples were immediately placed on ice in the field and transferred to cold
storage at 4oC until further processing.
Laboratory Analysis
Physical Characterization and Soil pH
Bulk density and water content represent the physical indicators comprising this study.
Gravimetric soil water content was determined from the bulk density cores after drying at
104oC for 24 hours. Bulk density was determined from the oven-dried weight of samples and
the volume of the core sampler following the method of Veihmeyer and Hendrickson (1948). In
addition to these physical properties, soil pH was also measured using a 1:1 soil-water mixture
(Eckert, 1991).
Soil Carbon Fractionation
Total soil C (SOC) and N were determined by dry combustion using a CHN autoanalyzer
(LECO CHN-1000, Leco Corp., St Joseph, MI, USA) (Tabatabai and Bremner, 1970). Acid
hydrolysis was performed with a modified version of the method described by Paul et al.
(1997). In short, using a roller grinder 1.0 g of air-dry soil was ground to a fine powder and
refluxed at 115oC for 16 hours with 6.0-M HCl. This suspension was then washed with
deionized water through a glass-fiber filter and the recovered sample dried at 40oC for 72
99
hours. Samples were then analyzed for total C and N as mentioned previously and the
hydrolyzability of samples calculated based on SOC and total N before and after acid hydrolysis.
Microbial biomass C and N (MBC/MBN) was performed on 10-g oven-dry weight soil
using the chloroform fumigation-extraction method as outlined by Voroney et al. (2008). Soils
were brought to field capacity (estimated at 25% water content for Kambitsch, PCFS,
Pendleton, and Moro and 20% for Prosser) and incubated at 20oC for 48 hours prior to
fumigation with ethanol-free chloroform. Instead of a 0.5-M K2SO4 extraction, fumigated and
non-fumigated soils were extracted using 30 ml of DI water, shaken for 30 minutes using an
oscillating shaker then filtered through 0.2-µm nylon filter after centrifuging for 5 minutes at
3200 rpm (1500g). The filtrate was frozen until analyzing for C and N on a high-temperature
combustion Shimadzu TOC analyzer.
Water extractable C and N (WEOC, WEON) analyses were performed according to
established laboratory protocol at the USDA/ARS Soil Biogeochemistry lab at Washington State
University. Soils were dried at 40oC for 24 hours and sieved to 2.0 mm prior to adding 12.5 ml
of 18-MΩ water (purified to remove C) to 5.0-g oven-dry weight equivalent soil. This soil water
mixture was shaken for one minute on an oscillating shaker, centrifuged for five minutes at
5000 rpm, then filtered through 0.2-µm nylon filter paper. The collected filtrate was frozen
until analyzing for C and N on a high-temperature combustion Shimadzu TOC machine.
Samples were also analyzed for inorganic N and WEON determined from subtracting out this
inorganic fraction. Carbonates were assessed using the same high-temperature combustion
Shimadzu TOC machine with a 1.0-M HCl solution; however no carbonates were detected and
all C values presented can be considered representative of organic C.
100
Permanganate oxidizable carbon (POXC) was performed according to the method of
Weil et al. (2003) in which 0.02-M KMnO4 is used. This methodology was developed by Weil et
al. (2003) as a sensitive analysis to capture a representative portion of active soil carbon that is
most influenced by management, as opposed to the method developed by Blair et al. (1995)
that attempts to capture and define the entire active carbon pool using a more concentrated
permanganate solution. Additionaly, the method developed by Weil et al., (2003) is available in
a field kit version, making this a low-cost and highly accessible soil property to meaasure. This
procedure was performed in triplicate on 2.5-g oven-dry weight equivalent soil that was air
dried for 24 hours and sieved to 2.0 mm. Absorbance was measured on a Spectra Max M2
single cuvette reader set at 550 nm as recommended by Weil et al. (2003).
Potential Carbon Mineralization
Measurement of carbon mineralization (Cmin) from re-wetted soils was performed on
laboratory-incubated soil in triplicate as a measure of active carbon and soil microbial activity.
Soils were oven dried at 40oC for 24 hours, then sieved to 2.0 mm (Haney et al., 2008).
Processed soils were then packed to a dry bulk density of 1.0 g cm-3 in 40-ml glass vials with
rubber top septa through which gas samples were collected using a syringe and needle at the
designated times. Prior to bringing samples to field capacity, they were covered with a
breathable film which allows oxygen exchange while preventing moisture loss and were
incubated at 20oC for 24 hours. After this incubation time, water was added to bring samples
to field capacity (estimated at 25% water content for Kambitsch, PCFS, Pendleton, and Moro
and 20% for Prosser), which was designated as time zero. Gas samples were collected at 24
hours, and 3, 7, 10, 17, and 24 days. At these sampling times, vials with soils at field capacity
101
were flushed with a breathing-air mixture containing approximately 200-ppm CO2, and gas
samples collected immediately after flushing on every tenth sample and two hours after
flushing from every sample. The CO2 evolution rate was calculated as the difference between
average time zero CO2 and CO2 measured at two hours (McLauchlan and Hobbie, 2004).
Samples were run on a Shimadzu gas chromatograph equipped with an automated valve
system for routing gas samples to the electron capture (ECD) and flame ionization (FID)
detectors.
Potential Nitrogen Mineralization
Anaerobic nitrogen mineralization at 28 days was determined at the five sites in this
study (Table 2.1) according to the methods outlined by Curtin and Campbell (2008), with a
slight deviation in soil preparation and procedure. Soils were sieved to 2.0 mm rather than 4.0
mm, and rather than using field moist soils, soils were dried at 40o C for 24 hours. Additionally,
samples were incubated for 28 days with 12.5 ml of deionized water at a constant temperature
of 40o C. Time zero samples were immediately extracted with 1-M KCl and inorganic N
determined on a Lachat (Hach, Co; Loveland, CO). All samples, including time zero and
incubated samples, were performed in triplicate and net N mineralization was measured as the
average difference between time zero NH4+ and 28-day NH4
+. Herein, 28-day PNM will be
referred to as PNM.
Basal and Potential Denitrification
Basal Denitrification (BDR) and potential denitrification (PDR) were performed in a
manner similar to Drury et al. (2008a) with slight deviations. In preparation for this analysis
102
field-moist soil which had been stored at 4oC for less than 1 month was sieved to 4-mm.
Samples consisting of 20.0 g oven-dry equivalent soil were then weighed into half-pint wide-
mouth canning jars, in triplicate. For both BDR and PDR, samples were incubated for 24 hours
at room temperature (20oC) to allow time for samples to equilibrate. Following this incubation
period, BDR samples were brought to field capacity (estimated at 25% water content for
Kambitsch, PCFS, Pendleton, and Moro and 20% for Prosser) by the addition of the appropriate
amount of deionized water while a 25.0 ml solution containing 300 ug glucose-C g-1 soil and 50
ug NO3-N g-1 was added to PDR samples. An anaerobic environment was created by flushing
with N2 gas through the rubber septa for 60 seconds. Immediately following flushing, a
headspace volume equivalent to 10% of the total headspace volume was removed and an
equivalent amount of acetylene was injected through the rubber septa. Gas samples (9.0 ml)
were collected for both BDR and PDR samples at two and four hours and injected into 5.9-ml
exetainers that had previously been flushed with N2. The N2O concentration of samples was
measured on a gas chromatograph equipped with an automated valve system for routing gas
samples to the electron capture (ECD) and flame ionization (FID) detectors. BDR and PDR rates
are the slope of the regression line when plotted versus time.
PRSTM - Probe Incubations
PRSTM-probe incubations were performed in triplicate on 275 g of oven-dry equivalent
soil. Prior to incubation, field moist soil samples were air dried for 48 hours to achieve uniform
water content. Air-dried soils were then brought to field capacity (estimated at 25% water
content for Kambitsch, PCFS, Pendleton, and Moro and 20% for Prosser) and packed into 335
cm3 plastic vessels to a uniform oven-dry density of 1.0 g cm-3. Immediately after adding water
103
and packing to the desired density, one anion and one cation PRSTM probe were inserted into
each vessel (time zero), the total weight noted, and incubated at room temperature (20oC).
Probes were pulled at 24 hours, and new probes reinserted into the same slots created by the
initial probes. These probes were then pulled at 14 days (total burial length of 13 days) and
new probes reinserted and incubated until day 28 (total burial length of 14 days). Water was
periodically added to keep incubations at starting water content. At the end of each period,
probes were washed with deionized water and stored at 4oC until shipping to Western Ag
Innovations for elution and determination of adsorbed NO3-, NH4
+, Ca, Mg, P, K, S, Mn, Fe, Zn,
and B. PRSTM probes have an exchange resin surface area of 10 cm2, and results were reported
in µg 10 cm-2 per burial time. Due to the nonlinear relationship of ion adsorption, results
cannot be divided by burial time; however values from each burial can be summed to provide a
cumulative value for each nutrient across the duration of the incubation, as was done to
determine cumulative 28-day PRSTM-probe values in this study.
Statistical Analysis
Treatment effects on soil properties were analyzed using General Linear Model in SAS
System for Windows Version 9.3 (SAS Institute, 2012) and means were separated using Fisher’s
protected Least Significant Difference (LSD) test at the p = 0.10 level. Within a site, sources of
variation in the statistical model were field (block) and agroecosystem treatment. Tukey’s
mean separation procedure was used to identify significant differences when the global F-test
was non-significant (p > 0.10). Unless specifically stated otherwise, all statistical differences
represent p < 0.10. In performing multivariate analysis, model entry was also set at p < 0.10. A
less rigorous alpha was selected for this study due to both the short management histories
104
associated with some of the sites (Table 2.1) and the inherent spatial variability of many of the
soil C and N properties measured. In consideration of these two factors, an alpha of 0.10 was
considered a judicious step towards minimizing type II errors (failing to reject a false null
hypothesis).
RESULTS AND DISCUSSION
Potential N Mineralization and Soil Properties
A range of correlations were found between PNM and soil C and N properties (Table
2.2). Within soil C properties, correlations (r) ranged from 0.40 for MBC to 0.59 for SOC, and
within soil N properties, correlations (r) ranged from 0.47 for WEON to 0.67 for total N and HN
(Table 2.2). While PNM is microbially driven, MBC displayed one of the lowest correlations of
soil C properties with PNM (r = 0.40) and MBN was not significantly correlated with PNM (Table
2.2). Bengtsson et al. (2003) suggested microbial biomass measured by chloroform fumigation
is poorly related to PNM because it does not differentiate between growth rates of different
microbial populations, but rather extracts the total microbial biomass; consequently, more
active microbes and their contribution to nitrogen turnover are obscured by less active
microbes. Due to the variation in composition of SOM, ranging from fresh crop residues to
humic substances, Curtin and McCallum (2004) concluded SOC and total N often do not provide
a good indication of PNM.
Contrary to this notion, in a review of 100 published studies on N cycling across multiple
terrestrial ecosystems, Booth et al. (2005) found that bulk soil C and N explained 42% of the
variation in gross mineralization, which was greater than either microbial biomass (27%) or
respiration (25%). Similar to results by Booth and coworkers (2005), in the present study, SOC
105
and total N, along with HN, displayed the strongest correlations of soil C and N properties with
PNM (Table 2.2). Soil pH also displayed a significant negative correlation with PNM (r = -0.62),
reflective of increased biomass production resulting from fertilization and subsequently greater
soil C and N, but also resulting in increased soil acidity.
Bulk soil C/N ratio were all below 20, ranging from 9.3 at Prosser to 13.8 at PCFS (Table
2.3), indicating N was not a limiting factor to PNM, and subsequently the bulk soil C/N ratio was
not significantly correlated with PNM (Table 2.4). Likewise, the water extractable C/N ratio and
hydrolyzable C/N ratio were not significantly correlated with PNM, also reflective of the non-
limiting nature of lower C/N ratios towards PNM.
In contrast, the C/N ratios of the NHC/NHN fraction often exceeded 20 (Table 2.3) and
were positively associated with PNM (Table 2.4). This C/N ratio of the non-hydrolyzable
fraction reflects an older and more biochemically recalcitrant fraction of soil C and N, as
indicated by studies revealing it has a longer turnover time than the SOC (Paul et. al, 2006). It is,
however, not immune to microbial degradation, as has been demonstrated by studies showing
its susceptibility to loss under increased disturbance (Poirier et al., 2005; Paul et al.; 2006) and
to the priming effect through fresh additions of labile C (Thiessen et al., 2013). The positive
correlation between PNM and this C/N ratio may therefore reflect greater substrate availability,
as also indicated by the positive association between PNM and the non-hydrolyzable fractions
of C and N (Table 2.2). The microbial C/N ratios in the present study ranged from 15.2 to 38.3
(Table 2.3). Considering that soil microorganisms maintain a C/N ratio less than the
surrounding environment (Bengtsson et al., 2003), the greater C/N ratios of the microbial
biomass fraction in the present study are not reliable. Extraction efficiencies are typically
106
applied to microbial biomass calculations, ranging from 0.25 to 0.45 for MBC and 0.18 to 0.54
for MBN (Varoney et al., 2008). These extraction efficiencies are, however, based on chemical
extractants or addition of labeled C substrate, whereas in the present study deionized water
was used. The greater microbial C/N ratios in the present study are therefore likely the result
of a higher extraction efficiency associated with MBC compared to MBN. In the absence of
calibrated extraction efficiencies for deionized water, the microbial C/N ratios in the present
study are not accurate; MBC and MBN considered individually, however, can still be considered
a reliable representation of microbial biomass in assessing treatment differences.
The C and N demands of the microbial population influence whether net N
mineralization or immobilization occurs (Sylvia et al. 2005). Microorganisms typically have a
lower C/N ratio than the soil they inhabit; assuming a microbial C/N ratio of 10, a 50% microbial
use efficiency indicates that at soil C/N ratios above 20, microorganisms will immobilize
inorganic N from the soil, whereas at C/N ratios below 20, they will be C limited and net N
mineralization will result (Bengtsson et al., 2003). Across multiple ecosystems, Booth et al.
(2005) found that both substrate quantity and soil C/N ratios influence N mineralization rates.
Conversely, Bengtsson et al. (2003) found that in forests soils, microbial biomass and activity as
measured by ATP content more so than soil C/N ratios were significant in N transformations. In
a study analyzing the role of C quantity and quality on N transformations in cereal based
rotations, Herrmann and Witter (2008) found that consideration of the C/N ratio of the free-
light fraction of SOM, representative of undecomposed organic matter, was an important
consideration in N immobilization. This variety of results in the literature regarding soil C/N
ratios and N transformations indicates that there are important considerations around the
107
paradigm that soil C/N ratios represent an important control on N transformations. Variations
in C/N ratios of different pools of SOM, along with differences in assimilation efficiency of the
microbial biomass between different sites are important considerations and can confound the
relationship between soil C/N ratios and N transformations (Bengtsson et al., 2003).
In this study, cumulative Cmin at 10 days displayed the highest correlation with PNM (r
= 0.40) (Table 2.2). Considering that PNM is microbially driven and CO2 evolution a direct result
of this process, stronger correlations were anticipated. Two factors may have contributed to
these low correlations: 1) varying gross immobilization rates, and 2) the anaerobic nature of the
N mineralization incubation performed. As previously mentioned, net mineralization is partially
dictated by the C/N ratio of the soil; however it is also the product of two opposing processes,
gross mineralization and gross immobilization (Luxhoi et al., 2006). Soil overall C/N ratios
within this study where within range to promote net N mineralization; however material
undergoing decomposition represents an important consideration in N transformations.
Herrmann and Witter (2008) found that the concentration of SOM undergoing decomposition,
represented by the free-light fraction, exhibited a significant correlation with gross
immobilization (r2 = 0.90) and the C/N ratio of this fraction played an important role in N
transformations and could obscure the relationship between Cmin and gross mineralization.
Luxhoi et al. (2006) found similar results when evaluating mineralization and immobilization in
relationship to C/N ratios of plant materials. Their findings revealed a significant correlation
between CO2 evolution rate and both gross immobilization and mineralization rates, but not
between CO2 evolution rate and net mineralization rate. In the present study, neither the C/N
ratio of plant material nor the free-light fraction was determined; the diversity of crops
108
comprising the rotations, however, represent a range of C/N ratios. For example, a
representative wheat straw has a C/N ratio of 80, while legumes such as alfalfa are typically
lower at approximately 13 (Sylvia et al. 2005). This diversity of plant inputs, therefore,
potentially confounded the relationship between Cmin and PNM.
It is also important to consider the nature of both the PNM and Cmin incubations. CO2 is
the product of heterotrophic organisms using oxygen as a terminal electron acceptor.
Anaerobic respiration is carried out by anaerobic or facultative microbes and the terminal
electron acceptor is often nitrate, sulfate, or CO2 (Sylvia et al., 2005). While anaerobic
respiration produces CO2, the Cmin analyses was performed under aerobic conditions, which is
energetically a more efficient process and a possible reason why Cmin values in this study do
not correlate well with anaerobic PNM. Franzluebbers et al. (1996) noted aerobic PNM at 21
days displayed a correlation coefficient (r2) of 0.85 with one-day Cmin across a range of silt and
clay loams from Texas. Lower correlations have been noted by others, however, such as Curtin
and McCallum (2004), who found that Cmin displayed a correlation coefficient (r2) of 0.36 with
aerobic PNM, and a slightly lower correlation of 0.25 with anaerobic PNM, and concluded that
Cmin was not a reliable surrogate for PNM.
Potential N Mineralization and N Supply
PNM was significantly correlated with 24-hour PRSTM-probe NO3- (r = 0.45), but was not
correlated with 28-day cumulative PRSTM-probe NO3- (Table 2.5). Multiple studies have found
that NO3- adsorbed to PRSTM probes is related to plant N uptake, as, for example, in Nyiraneza
et al. (2009), who reported that in-field NO3- adsorbed to PRSTM probes over the duration of
corn maturation in Quebec, Canada, was significantly related to corn N uptake (r = 0.95) as well
109
as corn yield (r = 0.91). Walley et al. (2002) reported weaker, yet still significant, correlations
between NO3- adsorbed to PRSTM probes during a laboratory incubation and spring wheat N
uptake (r = 0.32) and yield (r = 0.37). Nyiraneza and coworkers (2009) also reported PNM from
a seven-day anaerobic incubation was correlated with corn N uptake (r = 0.79) and yield (r =
0.85). In the present study, however, the fact that PNM from a longer incubation is not
correlated with NO3- from an equally long PRSTM-probe incubation suggests that PNM as
measured in this study is a poorly related to plant N uptake.
Potential and Basal Denitrification and Soil Properties
PDR and BDR were significantly correlated (r = 0.37), and despite the added NO3- and C
to the PDR incubation, PDR still exhibited a significant correlation with SOC (r = 0.70) and total
N (r = 0.57) and the other soil C and N pools measured accept for MBC (Table 2.2). Others have
found similar correlations with soil C and N and PDR (Staley et al; 1990; D’Haene et al., 2003). It
is also worth noting that PDR was significantly and positively associated with one-day Cmin, but
negatively associated with the microbial metabolic quotient (qCO2). This correlation indicates
that an increase in microbial activity and efficiency is associated with an increase in PDR and
infers that as denitrification is a microbially mediated process, more efficient use of energy
sources by denitrifiers would allow for an increased opportunity for denitrification.
BDR, on the other hand, did not display the significant correlations displayed by PDR and
was correlated only with soil extractable inorganic N (r = 0.31) and soil pH (r = -0.29) (Table 2.2).
This lack of correlation between BDR and other soil C and N pools may be partially explained by
the greater coefficient of variations (CV) for BDR compared to PDR; for BDR, CVs ranged from
20% to 128%, while for PDR CVs ranged from 14% to 62%. A significant correlation between
110
BDR and soil NO3- and the lack of correlation with soil C properties is indicative that NO3
- may
have been the limiting factor in BDR. This is consistent with the fact that many researchers
report a flux in in-situ denitrification following a fertilizer event containing inorganic N (Aulakh
& Rennie, 1986; Drury et al., 1998; Dusenbury et al., 2008). The negative correlation between
pH and BDR, as well as PDR (Table 2.2), is indicative of fertilization producing not only more
acidic conditions, but also resulting in greater soil C and N availability from increased biomass
production.
As with PNM, C/N ratios were poorly correlated with PDR and BDR (Table 2.4). Others
have noted it is the C/N ratios of fresh crop residues that critically influence denitrification. For
example, Chen et al. (2013) found that in both field and laboratory studies, crop residues
generally enhanced N2O emissions under aerobic conditions but that the C/N ratio of the crop
residue was a significant factor. At C/N ratios less than 45, the effect was positive; at C/N ratios
between 45 and 100 the effect was moderate, and at C/N ratios greater than 100, crop residues
had a negative effect on N2O production. This relationship between crop C/N ratios and
denitrification has also been noted in native systems, such as in the observation by Tiemann
and Billings (2008), who observed that a shift from C4 grasslands to C3 grasslands, which have
lower C/N ratios, was related to an increase in N2O production. This relationship with C/N ratios
of crop residues indicates that as N limits microbial growth and is assimilated to meet microbial
needs, less N is available for mineralization and subsequently for denitrification.
Potential and Basal Denitrification and N Supply
In this study, PDR was significantly correlated to both PNM (r = 0.69) and 28-day PRSTM-
probe NO3- ( r = 0.27) (Table 2.5). Similarly, Alotaibi and Schoenau (2013) found that a decrease
111
in N2O emissions was associated with a decrease in inorganic N adsorbed to PRSTM probes.
Tiemann and Billings (2008) reported N2O emissions were highest when both moisture and
inorganic N availability were highest. These published results along with the significant
correlations in the present study between PDR and inorganic N supply are consistent with
inorganic N as a limiting factor in denitrification and also suggests that soils with a greater
capacity to mineralize N are associated with an increase in N20 emissions. Considering that soil
C is also critical to the turnover of N as a microbial energy source, results in the present study
are consistent with the notion that abundant soil C and inorganic N, along with the presence of
anerobiosis, are the three most commonly cited abiotic and biotic edaphic properties that
influence N2O emissions (Hangs et al., 2013).
Nutrient Supply and Soil Properties
Flow of ions to roots is driven either by diffusion (P, K, Zn, Fe) or mass flow (N, Ca, Mg, S,
Mn, B, Cu) (Havlin et al., 1999). The lack of a water potential gradient in laboratory incubations
results in the prevalence of diffusion of nutrients, which is a slower process than mass flow and
reliant upon a concentration gradient. The prevalence of diffusion in the present study is
supported by the fact that a majority of soil cations and anions measured exhibited significant
correlations (r) across incubation time periods (Table 2.6). Due to the prevalence of diffusion,
soil texture has the potential to influence nutrient diffusion through its impact on tortuosity
(Havlin et al., 1999). Courser soils have a lower tortuosity, and for a given diffusion gradient
and water content, courser soils will have greater diffusion rates. For this reason, Prosser was
excluded from cross-site correlations involving PRSTM nutrients as Prosser has sandier soils than
112
the other sites, a situation which confounds results from the other four sites of similar soil
texture.
PRSTM - Probe N, P, S and Soil Properties
Multiple soil C and N pools exhibited a significant positive relationship with NO3- at 24
hours, while only initial extractable N exhibited a significant relationship with 28-day NO3- (r =
0.42) (Table 2.2). The significant relationship between initial soil extractable N and adsorbed
NO3- at 24 hours and 28 days (Table 2.2) indicates initial inorganic N in the soil at the beginning
of the incubation accounted for an important pool of the N adsorbed at 28 days. Soil C/N ratios
and their role in total N at 24 hours and 28 days were examined and were not significant (Table
2.3). This outcome is likely the result of overall narrow C/N ratios that are subsequently not a
limiting factor in N turnover (Table 2.4).
A shift in relationship between 24-hour and 28-day PRSTM values and soil C and N
properties are potentially insightful. The 24-hour PRSTM values capture in-situ conditions at time
of sample collection and are dependent on the cumulative effect of field conditions and
processes influencing nutrient availability prior to time of sampling. The 28-day PRSTM values
are more influenced by incubation conditions; optimal moisture and temperature conditions
along with mixing of the soil favor enhanced microbial activity and diffusion compared to field
conditions. A significant positive relationship between 24-hour NO3- and POXC (r = 0.49), SOC (r
= 0.49), total N (r = 0.51) and WEON (r = 0.40) is indicative of greater C and N substrate
availability resulting in greater in-situ mineralization (Table 2.2). This finding is also supported
by the significant relationship between 24-hour NO3- and PNM (Table 2.5). At 28 days, these
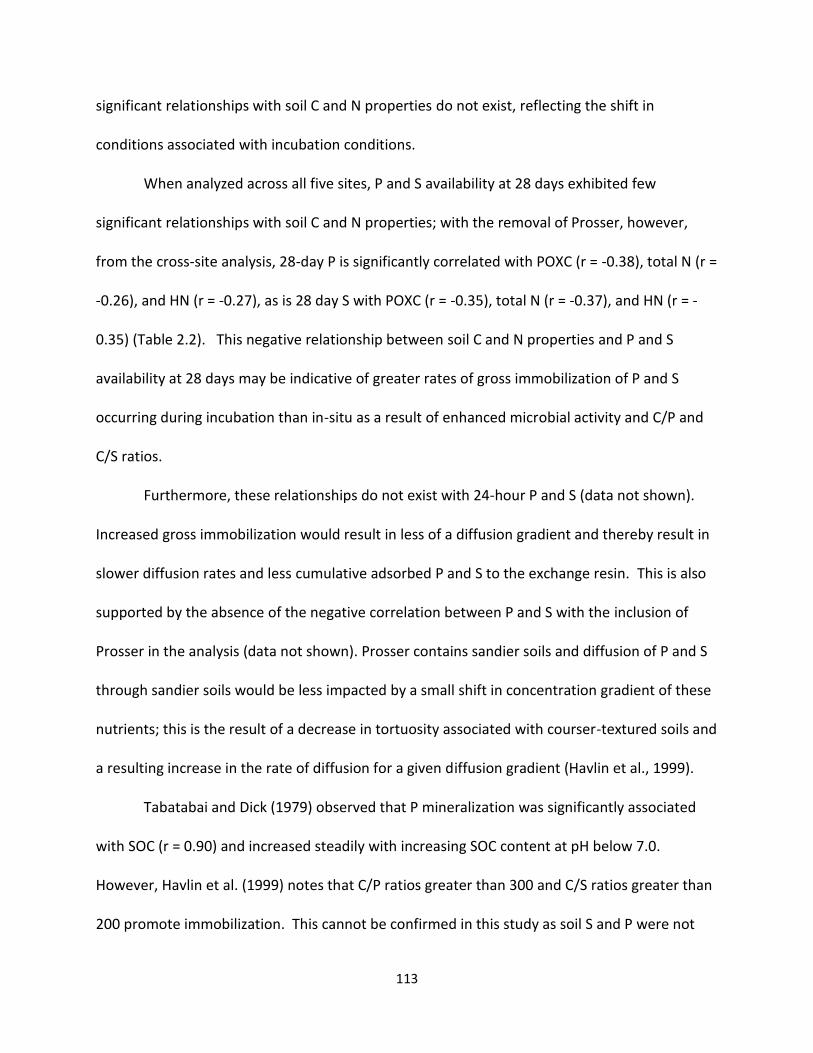
113
significant relationships with soil C and N properties do not exist, reflecting the shift in
conditions associated with incubation conditions.
When analyzed across all five sites, P and S availability at 28 days exhibited few
significant relationships with soil C and N properties; with the removal of Prosser, however,
from the cross-site analysis, 28-day P is significantly correlated with POXC (r = -0.38), total N (r =
-0.26), and HN (r = -0.27), as is 28 day S with POXC (r = -0.35), total N (r = -0.37), and HN (r = -
0.35) (Table 2.2). This negative relationship between soil C and N properties and P and S
availability at 28 days may be indicative of greater rates of gross immobilization of P and S
occurring during incubation than in-situ as a result of enhanced microbial activity and C/P and
C/S ratios.
Furthermore, these relationships do not exist with 24-hour P and S (data not shown).
Increased gross immobilization would result in less of a diffusion gradient and thereby result in
slower diffusion rates and less cumulative adsorbed P and S to the exchange resin. This is also
supported by the absence of the negative correlation between P and S with the inclusion of
Prosser in the analysis (data not shown). Prosser contains sandier soils and diffusion of P and S
through sandier soils would be less impacted by a small shift in concentration gradient of these
nutrients; this is the result of a decrease in tortuosity associated with courser-textured soils and
a resulting increase in the rate of diffusion for a given diffusion gradient (Havlin et al., 1999).
Tabatabai and Dick (1979) observed that P mineralization was significantly associated
with SOC (r = 0.90) and increased steadily with increasing SOC content at pH below 7.0.
However, Havlin et al. (1999) notes that C/P ratios greater than 300 and C/S ratios greater than
200 promote immobilization. This cannot be confirmed in this study as soil S and P were not
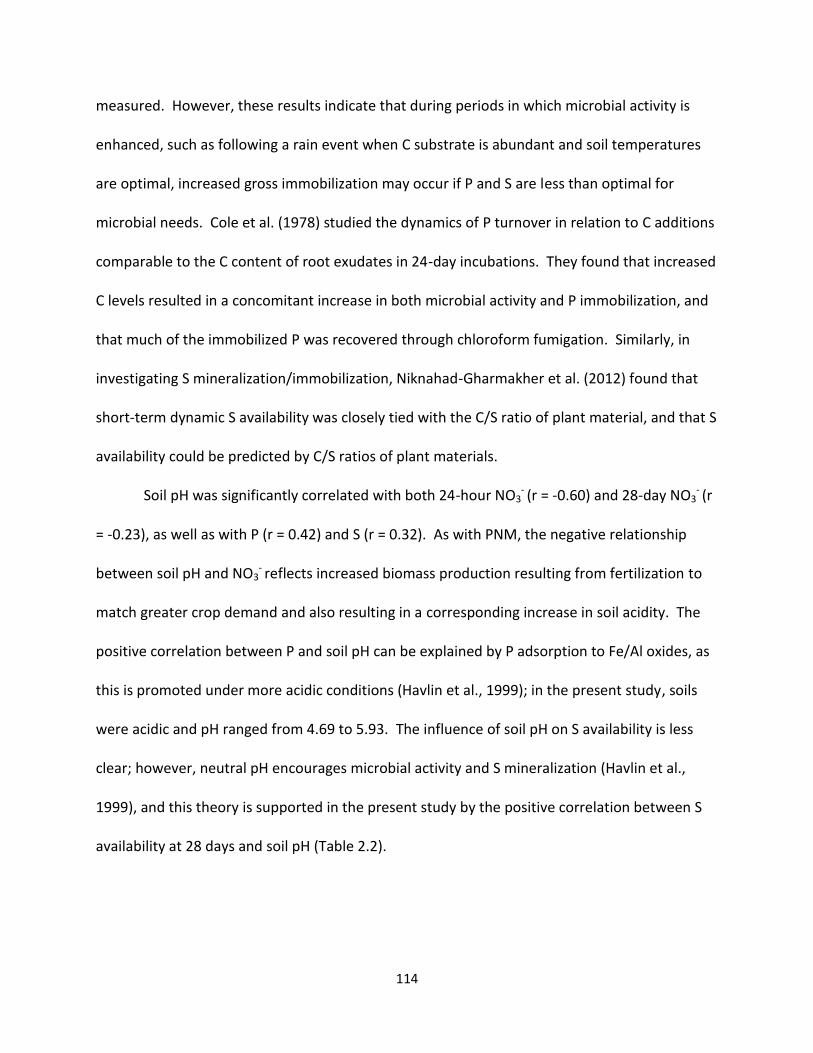
114
measured. However, these results indicate that during periods in which microbial activity is
enhanced, such as following a rain event when C substrate is abundant and soil temperatures
are optimal, increased gross immobilization may occur if P and S are less than optimal for
microbial needs. Cole et al. (1978) studied the dynamics of P turnover in relation to C additions
comparable to the C content of root exudates in 24-day incubations. They found that increased
C levels resulted in a concomitant increase in both microbial activity and P immobilization, and
that much of the immobilized P was recovered through chloroform fumigation. Similarly, in
investigating S mineralization/immobilization, Niknahad-Gharmakher et al. (2012) found that
short-term dynamic S availability was closely tied with the C/S ratio of plant material, and that S
availability could be predicted by C/S ratios of plant materials.
Soil pH was significantly correlated with both 24-hour NO3- (r = -0.60) and 28-day NO3
- (r
= -0.23), as well as with P (r = 0.42) and S (r = 0.32). As with PNM, the negative relationship
between soil pH and NO3- reflects increased biomass production resulting from fertilization to
match greater crop demand and also resulting in a corresponding increase in soil acidity. The
positive correlation between P and soil pH can be explained by P adsorption to Fe/Al oxides, as
this is promoted under more acidic conditions (Havlin et al., 1999); in the present study, soils
were acidic and pH ranged from 4.69 to 5.93. The influence of soil pH on S availability is less
clear; however, neutral pH encourages microbial activity and S mineralization (Havlin et al.,
1999), and this theory is supported in the present study by the positive correlation between S
availability at 28 days and soil pH (Table 2.2).
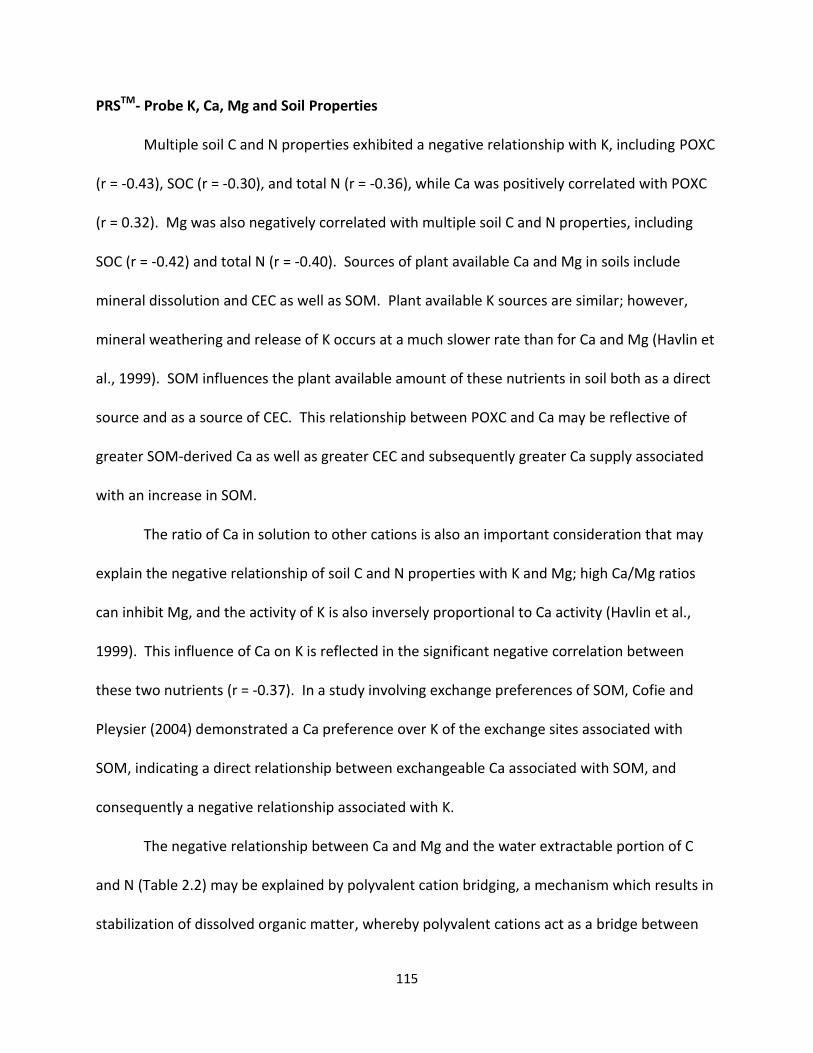
115
PRSTM- Probe K, Ca, Mg and Soil Properties
Multiple soil C and N properties exhibited a negative relationship with K, including POXC
(r = -0.43), SOC (r = -0.30), and total N (r = -0.36), while Ca was positively correlated with POXC
(r = 0.32). Mg was also negatively correlated with multiple soil C and N properties, including
SOC (r = -0.42) and total N (r = -0.40). Sources of plant available Ca and Mg in soils include
mineral dissolution and CEC as well as SOM. Plant available K sources are similar; however,
mineral weathering and release of K occurs at a much slower rate than for Ca and Mg (Havlin et
al., 1999). SOM influences the plant available amount of these nutrients in soil both as a direct
source and as a source of CEC. This relationship between POXC and Ca may be reflective of
greater SOM-derived Ca as well as greater CEC and subsequently greater Ca supply associated
with an increase in SOM.
The ratio of Ca in solution to other cations is also an important consideration that may
explain the negative relationship of soil C and N properties with K and Mg; high Ca/Mg ratios
can inhibit Mg, and the activity of K is also inversely proportional to Ca activity (Havlin et al.,
1999). This influence of Ca on K is reflected in the significant negative correlation between
these two nutrients (r = -0.37). In a study involving exchange preferences of SOM, Cofie and
Pleysier (2004) demonstrated a Ca preference over K of the exchange sites associated with
SOM, indicating a direct relationship between exchangeable Ca associated with SOM, and
consequently a negative relationship associated with K.
The negative relationship between Ca and Mg and the water extractable portion of C
and N (Table 2.2) may be explained by polyvalent cation bridging, a mechanism which results in
stabilization of dissolved organic matter, whereby polyvalent cations act as a bridge between
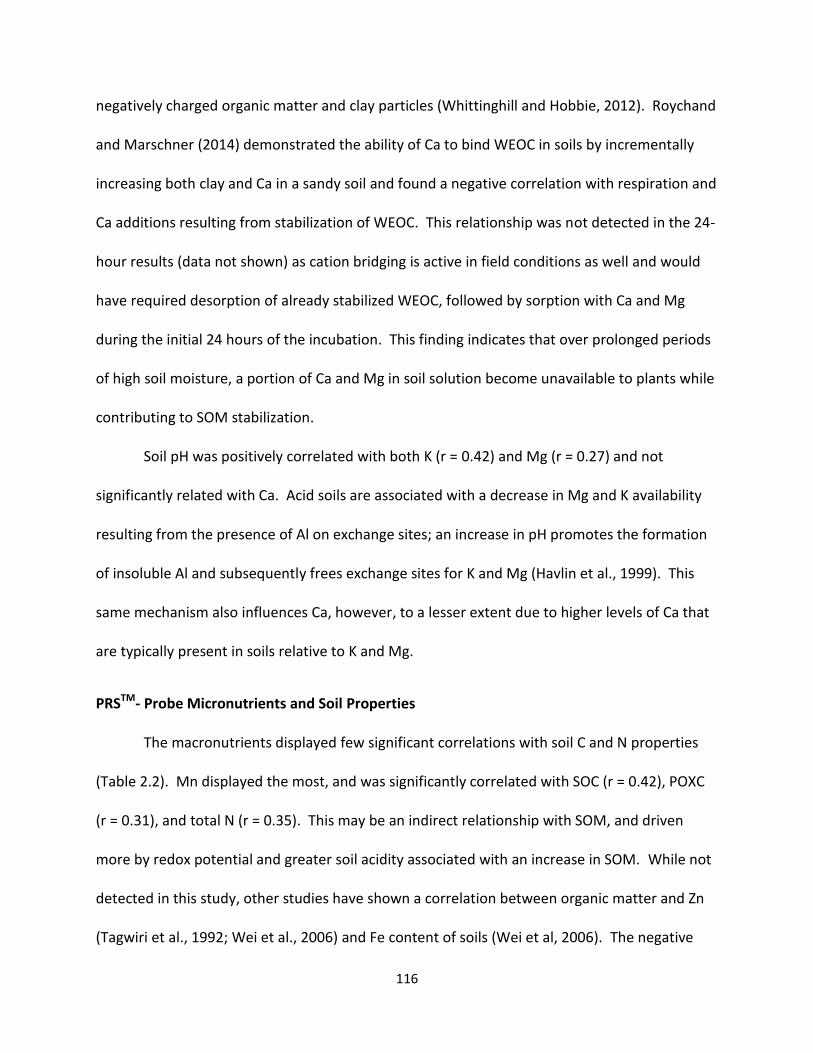
116
negatively charged organic matter and clay particles (Whittinghill and Hobbie, 2012). Roychand
and Marschner (2014) demonstrated the ability of Ca to bind WEOC in soils by incrementally
increasing both clay and Ca in a sandy soil and found a negative correlation with respiration and
Ca additions resulting from stabilization of WEOC. This relationship was not detected in the 24-
hour results (data not shown) as cation bridging is active in field conditions as well and would
have required desorption of already stabilized WEOC, followed by sorption with Ca and Mg
during the initial 24 hours of the incubation. This finding indicates that over prolonged periods
of high soil moisture, a portion of Ca and Mg in soil solution become unavailable to plants while
contributing to SOM stabilization.
Soil pH was positively correlated with both K (r = 0.42) and Mg (r = 0.27) and not
significantly related with Ca. Acid soils are associated with a decrease in Mg and K availability
resulting from the presence of Al on exchange sites; an increase in pH promotes the formation
of insoluble Al and subsequently frees exchange sites for K and Mg (Havlin et al., 1999). This
same mechanism also influences Ca, however, to a lesser extent due to higher levels of Ca that
are typically present in soils relative to K and Mg.
PRSTM- Probe Micronutrients and Soil Properties
The macronutrients displayed few significant correlations with soil C and N properties
(Table 2.2). Mn displayed the most, and was significantly correlated with SOC (r = 0.42), POXC
(r = 0.31), and total N (r = 0.35). This may be an indirect relationship with SOM, and driven
more by redox potential and greater soil acidity associated with an increase in SOM. While not
detected in this study, other studies have shown a correlation between organic matter and Zn
(Tagwiri et al., 1992; Wei et al., 2006) and Fe content of soils (Wei et al, 2006). The negative
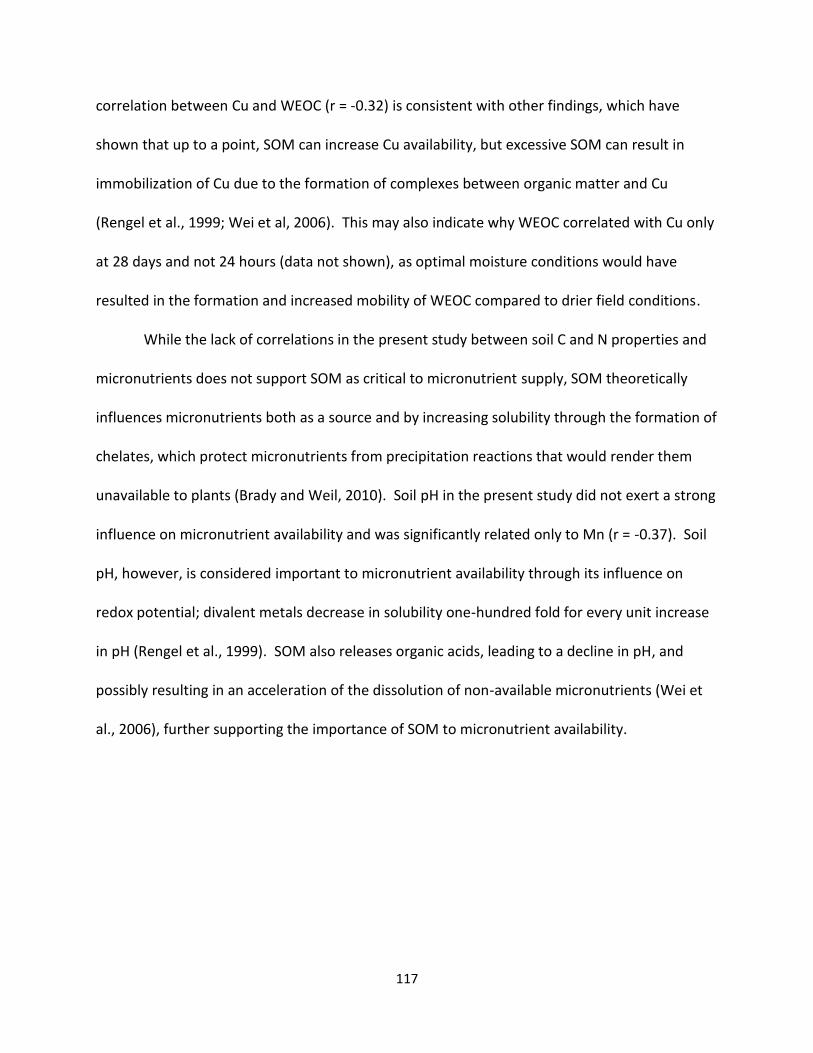
117
correlation between Cu and WEOC (r = -0.32) is consistent with other findings, which have
shown that up to a point, SOM can increase Cu availability, but excessive SOM can result in
immobilization of Cu due to the formation of complexes between organic matter and Cu
(Rengel et al., 1999; Wei et al, 2006). This may also indicate why WEOC correlated with Cu only
at 28 days and not 24 hours (data not shown), as optimal moisture conditions would have
resulted in the formation and increased mobility of WEOC compared to drier field conditions.
While the lack of correlations in the present study between soil C and N properties and
micronutrients does not support SOM as critical to micronutrient supply, SOM theoretically
influences micronutrients both as a source and by increasing solubility through the formation of
chelates, which protect micronutrients from precipitation reactions that would render them
unavailable to plants (Brady and Weil, 2010). Soil pH in the present study did not exert a strong
influence on micronutrient availability and was significantly related only to Mn (r = -0.37). Soil
pH, however, is considered important to micronutrient availability through its influence on
redox potential; divalent metals decrease in solubility one-hundred fold for every unit increase
in pH (Rengel et al., 1999). SOM also releases organic acids, leading to a decline in pH, and
possibly resulting in an acceleration of the dissolution of non-available micronutrients (Wei et
al., 2006), further supporting the importance of SOM to micronutrient availability.
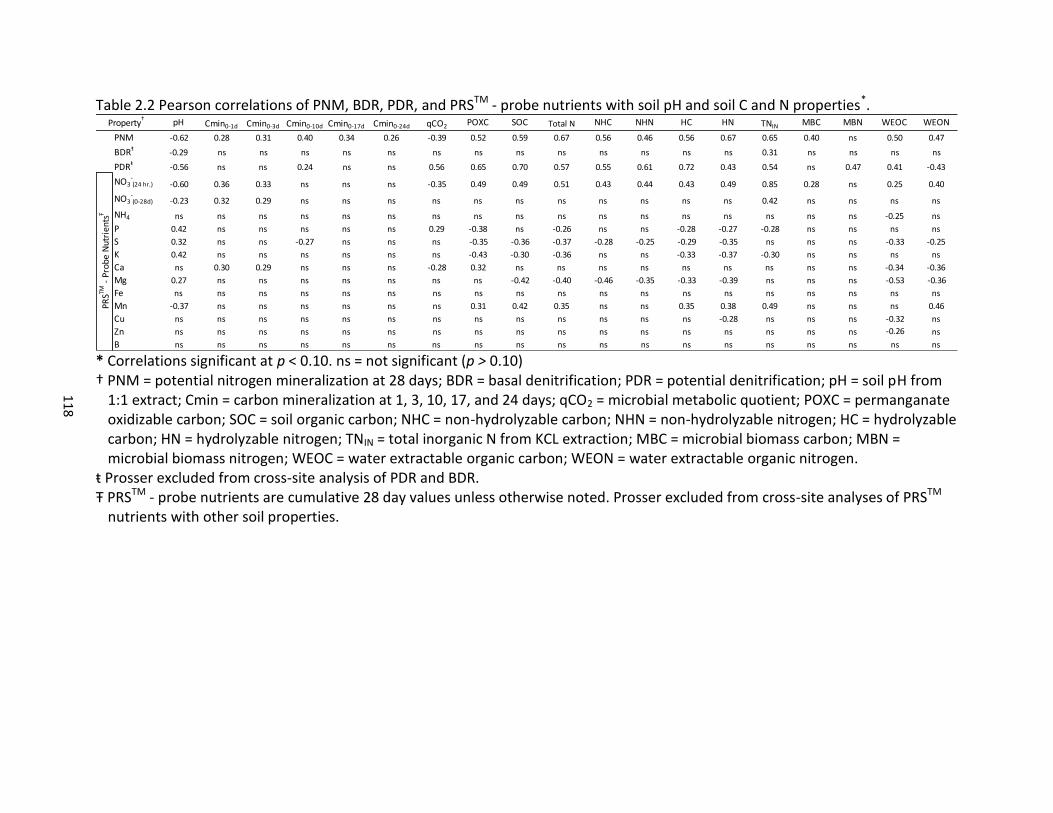
11
8
Table 2.2 Pearson correlations of PNM, BDR, PDR, and PRSTM - probe nutrients with soil pH and soil C and N properties*.
* Correlations significant at p < 0.10. ns = not significant (p > 0.10) † PNM = potential nitrogen mineralization at 28 days; BDR = basal denitrification; PDR = potential denitrification; pH = soil pH from
1:1 extract; Cmin = carbon mineralization at 1, 3, 10, 17, and 24 days; qCO2 = microbial metabolic quotient; POXC = permanganate oxidizable carbon; SOC = soil organic carbon; NHC = non-hydrolyzable carbon; NHN = non-hydrolyzable nitrogen; HC = hydrolyzable carbon; HN = hydrolyzable nitrogen; TNIN = total inorganic N from KCL extraction; MBC = microbial biomass carbon; MBN = microbial biomass nitrogen; WEOC = water extractable organic carbon; WEON = water extractable organic nitrogen.
ŧ Prosser excluded from cross-site analysis of PDR and BDR. Ŧ PRSTM - probe nutrients are cumulative 28 day values unless otherwise noted. Prosser excluded from cross-site analyses of PRSTM
nutrients with other soil properties.
pH Cmin0-1d Cmin0-3d Cmin0-10d Cmin0-17d Cmin0-24d qCO2 POXC SOC Total N NHC NHN HC HN TNIN MBC MBN WEOC WEON
PNM -0.62 0.28 0.31 0.40 0.34 0.26 -0.39 0.52 0.59 0.67 0.56 0.46 0.56 0.67 0.65 0.40 ns 0.50 0.47
BDRŧ-0.29 ns ns ns ns ns ns ns ns ns ns ns ns ns 0.31 ns ns ns ns
PDRŧ
-0.56 ns ns 0.24 ns ns 0.56 0.65 0.70 0.57 0.55 0.61 0.72 0.43 0.54 ns 0.47 0.41 -0.43
NO3-(24 hr.) -0.60 0.36 0.33 ns ns ns -0.35 0.49 0.49 0.51 0.43 0.44 0.43 0.49 0.85 0.28 ns 0.25 0.40
NO3-(0-28d) -0.23 0.32 0.29 ns ns ns ns ns ns ns ns ns ns ns 0.42 ns ns ns ns
NH4 ns ns ns ns ns ns ns ns ns ns ns ns ns ns ns ns ns -0.25 ns
P 0.42 ns ns ns ns ns 0.29 -0.38 ns -0.26 ns ns -0.28 -0.27 -0.28 ns ns ns ns
S 0.32 ns ns -0.27 ns ns ns -0.35 -0.36 -0.37 -0.28 -0.25 -0.29 -0.35 ns ns ns -0.33 -0.25
K 0.42 ns ns ns ns ns ns -0.43 -0.30 -0.36 ns ns -0.33 -0.37 -0.30 ns ns ns ns
Ca ns 0.30 0.29 ns ns ns -0.28 0.32 ns ns ns ns ns ns ns ns ns -0.34 -0.36
Mg 0.27 ns ns ns ns ns ns ns -0.42 -0.40 -0.46 -0.35 -0.33 -0.39 ns ns ns -0.53 -0.36
Fe ns ns ns ns ns ns ns ns ns ns ns ns ns ns ns ns ns ns ns
Mn -0.37 ns ns ns ns ns ns 0.31 0.42 0.35 ns ns 0.35 0.38 0.49 ns ns ns 0.46
Cu ns ns ns ns ns ns ns ns ns ns ns ns ns -0.28 ns ns ns -0.32 ns
Zn ns ns ns ns ns ns ns ns ns ns ns ns ns ns ns ns ns -0.26 ns
B ns ns ns ns ns ns ns ns ns ns ns ns ns ns ns ns ns ns ns
PRSTM
- P
robe
Nut
rien
tsŦ
Property†
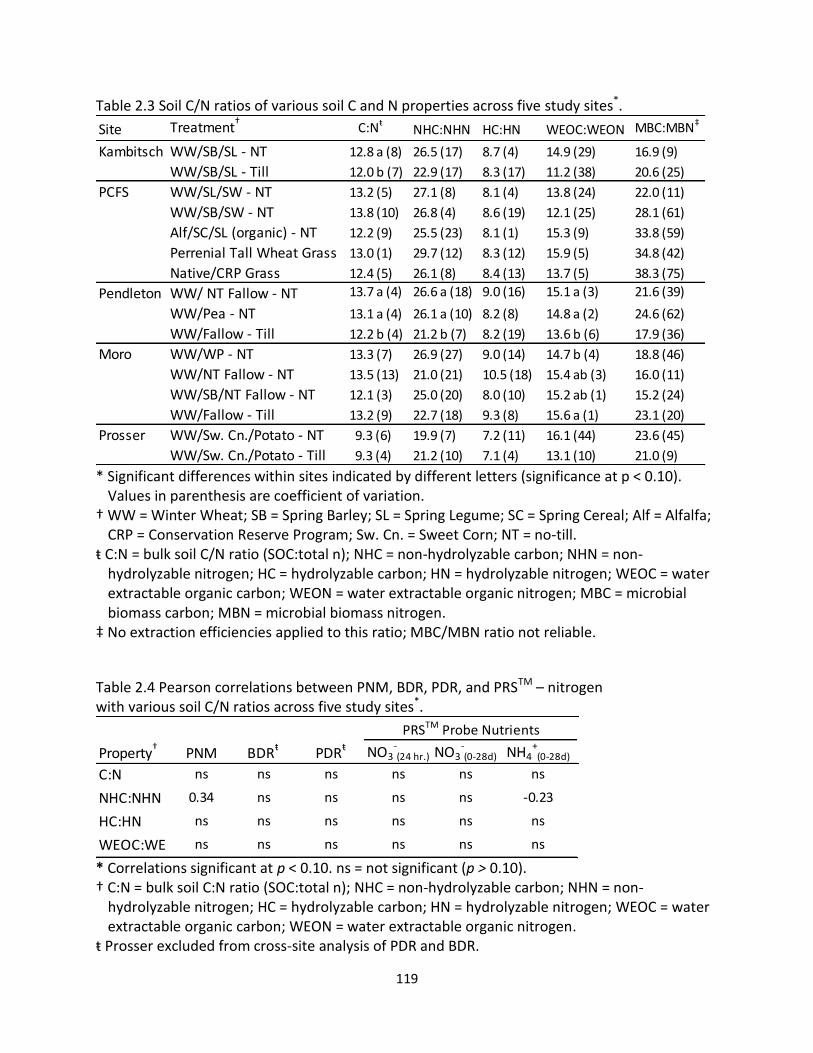
119
Table 2.3 Soil C/N ratios of various soil C and N properties across five study sites*.
* Significant differences within sites indicated by different letters (significance at p < 0.10).
Values in parenthesis are coefficient of variation. † WW = Winter Wheat; SB = Spring Barley; SL = Spring Legume; SC = Spring Cereal; Alf = Alfalfa;
CRP = Conservation Reserve Program; Sw. Cn. = Sweet Corn; NT = no-till. ŧ C:N = bulk soil C/N ratio (SOC:total n); NHC = non-hydrolyzable carbon; NHN = non-
hydrolyzable nitrogen; HC = hydrolyzable carbon; HN = hydrolyzable nitrogen; WEOC = water extractable organic carbon; WEON = water extractable organic nitrogen; MBC = microbial biomass carbon; MBN = microbial biomass nitrogen.
‡ No extraction efficiencies applied to this ratio; MBC/MBN ratio not reliable.
Table 2.4 Pearson correlations between PNM, BDR, PDR, and PRSTM – nitrogen with various soil C/N ratios across five study sites*.
* Correlations significant at p < 0.10. ns = not significant (p > 0.10). † C:N = bulk soil C:N ratio (SOC:total n); NHC = non-hydrolyzable carbon; NHN = non-
hydrolyzable nitrogen; HC = hydrolyzable carbon; HN = hydrolyzable nitrogen; WEOC = water extractable organic carbon; WEON = water extractable organic nitrogen.
ŧ Prosser excluded from cross-site analysis of PDR and BDR.
Site Treatment†C:Nŧ
NHC:NHN HC:HN WEOC:WEON MBC:MBN‡
Kambitsch WW/SB/SL - NT 12.8 a (8) 26.5 (17) 8.7 (4) 14.9 (29) 16.9 (9)
WW/SB/SL - Till 12.0 b (7) 22.9 (17) 8.3 (17) 11.2 (38) 20.6 (25)
PCFS WW/SL/SW - NT 13.2 (5) 27.1 (8) 8.1 (4) 13.8 (24) 22.0 (11)
WW/SB/SW - NT 13.8 (10) 26.8 (4) 8.6 (19) 12.1 (25) 28.1 (61)
Alf/SC/SL (organic) - NT 12.2 (9) 25.5 (23) 8.1 (1) 15.3 (9) 33.8 (59)
Perrenial Tall Wheat Grass 13.0 (1) 29.7 (12) 8.3 (12) 15.9 (5) 34.8 (42)
Native/CRP Grass 12.4 (5) 26.1 (8) 8.4 (13) 13.7 (5) 38.3 (75)
Pendleton WW/ NT Fallow - NT 13.7 a (4) 26.6 a (18) 9.0 (16) 15.1 a (3) 21.6 (39)
WW/Pea - NT 13.1 a (4) 26.1 a (10) 8.2 (8) 14.8 a (2) 24.6 (62)
WW/Fallow - Till 12.2 b (4) 21.2 b (7) 8.2 (19) 13.6 b (6) 17.9 (36)
Moro WW/WP - NT 13.3 (7) 26.9 (27) 9.0 (14) 14.7 b (4) 18.8 (46)
WW/NT Fallow - NT 13.5 (13) 21.0 (21) 10.5 (18) 15.4 ab (3) 16.0 (11)
WW/SB/NT Fallow - NT 12.1 (3) 25.0 (20) 8.0 (10) 15.2 ab (1) 15.2 (24)
WW/Fallow - Till 13.2 (9) 22.7 (18) 9.3 (8) 15.6 a (1) 23.1 (20)
Prosser WW/Sw. Cn./Potato - NT 9.3 (6) 19.9 (7) 7.2 (11) 16.1 (44) 23.6 (45)
WW/Sw. Cn./Potato - Till 9.3 (4) 21.2 (10) 7.1 (4) 13.1 (10) 21.0 (9)
NO3-(24 hr.) NO3
-(0-28d) NH4
+(0-28d)
C:N ns ns ns ns ns ns
NHC:NHN 0.34 ns ns ns ns -0.23
HC:HN ns ns ns ns ns ns
WEOC:WE
ON
ns ns ns ns ns ns
PDRŧ
Property†
PRSTM Probe Nutrients
PNM BDRŧ
12
0
Table 2.5 Pearson correlations between PNM, BDR, PDR, and PRSTM – probe nutrients across five study sites*.
* Correlations significant at p < 0.10. ns = not significant (p > 0.10). † PNM = potential nitrogen mineralization at 28 days; BDR = basal denitrification; PDR = potential denitrification. ŧ Prosser excluded from cross-site analysis of PDR and BDR. Ŧ PRSTM - probe nutrients are cumulative 28 day values unless otherwise noted.
NO3-(24 hr.) NO3
-(0-28d) NH4
+ P S K Ca Mg Fe Mn Cu Zn
BDRŧ ns
PDRŧ 0.69 0.37
NO3-(24 hr.) 0.45 ns ns
NO3-(0-28d) ns ns 0.27 0.62
NH4+ ns ns ns ns 0.24
P ns ns ns -0.34 ns ns
S -0.47 ns -0.42 ns ns ns ns
K ns -0.33 ns ns ns ns 0.70 0.25
Ca ns ns ns 0.33 0.45 0.33 -0.38 0.34 -0.37
Mg -0.47 0.30 -0.27 ns 0.40 ns -0.25 0.42 ns 0.67
Fe ns ns ns 0.36 0.80 ns ns 0.29 ns ns 0.40
Mn ns 0.34 ns 0.55 0.43 0.26 ns ns ns ns ns 0.35
Cu ns ns ns ns 0.61 0.29 ns 0.40 ns 0.39 0.49 0.72 ns
Zn ns ns ns ns ns 0.46 ns ns ns ns ns 0.30 ns 0.41
B ns -0.32 ns ns ns ns ns ns ns 0.30 ns ns ns ns ns
Property†
PRSTM
- P
robe
Nut
rien
tsŦ
PNM BDRŧ PDRŧ
PRSTM - Probe NutrientsŦ
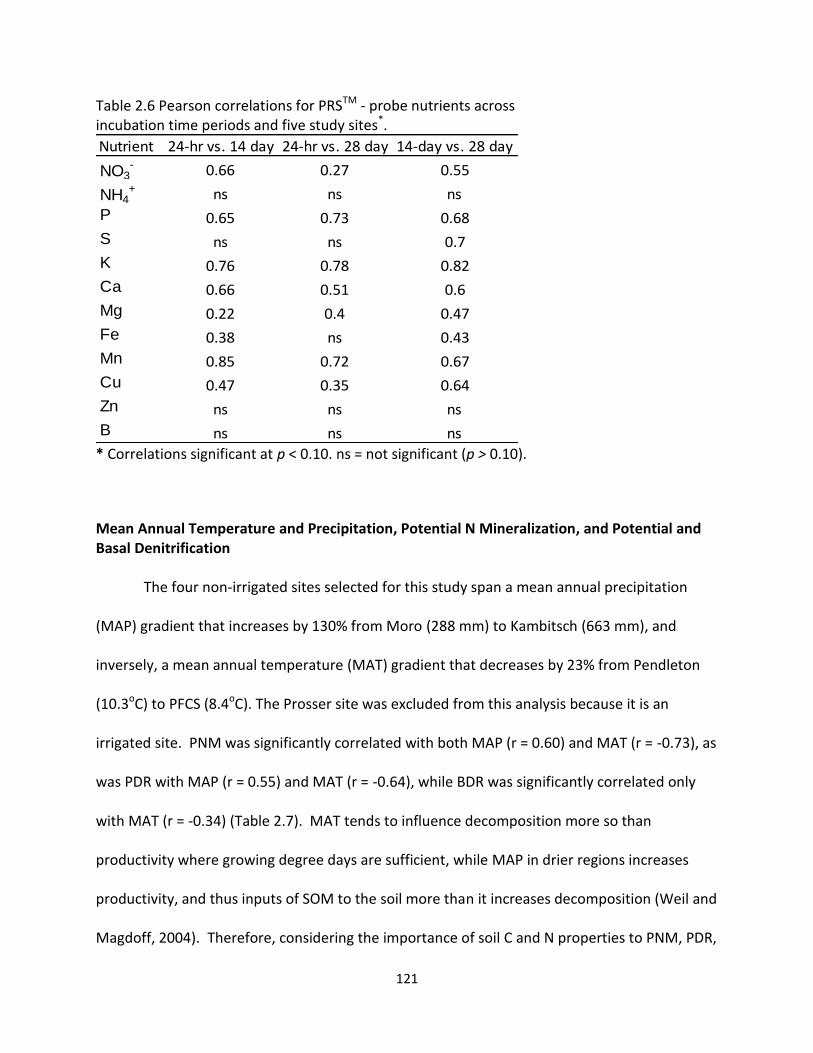
121
Table 2.6 Pearson correlations for PRSTM - probe nutrients across incubation time periods and five study sites*.
* Correlations significant at p < 0.10. ns = not significant (p > 0.10).
Mean Annual Temperature and Precipitation, Potential N Mineralization, and Potential and Basal Denitrification The four non-irrigated sites selected for this study span a mean annual precipitation
(MAP) gradient that increases by 130% from Moro (288 mm) to Kambitsch (663 mm), and
inversely, a mean annual temperature (MAT) gradient that decreases by 23% from Pendleton
(10.3oC) to PFCS (8.4oC). The Prosser site was excluded from this analysis because it is an
irrigated site. PNM was significantly correlated with both MAP (r = 0.60) and MAT (r = -0.73), as
was PDR with MAP (r = 0.55) and MAT (r = -0.64), while BDR was significantly correlated only
with MAT (r = -0.34) (Table 2.7). MAT tends to influence decomposition more so than
productivity where growing degree days are sufficient, while MAP in drier regions increases
productivity, and thus inputs of SOM to the soil more than it increases decomposition (Weil and
Magdoff, 2004). Therefore, considering the importance of soil C and N properties to PNM, PDR,
Nutrient 24-hr vs. 14 day 24-hr vs. 28 day 14-day vs. 28 day
NO3- 0.66 0.27 0.55
NH4+ ns ns ns
P 0.65 0.73 0.68
S ns ns 0.7
K 0.76 0.78 0.82
Ca 0.66 0.51 0.6
Mg 0.22 0.4 0.47
Fe 0.38 ns 0.43
Mn 0.85 0.72 0.67
Cu 0.47 0.35 0.64
Zn ns ns ns
B ns ns ns
122
and BDR already established, this relationship between these N transformations and MAP and
MAP is reflective of the influence of climate on soil C and N properties.
Similarly, in a study by Chapman et al. (2013), a high degree of the variability in N
mineralization observed across a range of natural ecosystems across the United States was
explained by MAT, MAP, as well as total N and N deposition. In a study of mineral soils across
the United States, Colman and Schimel (2013) concluded that the direct drivers of N
mineralization were soil C and N as well as clay content and that precipitation drives N
mineralization indirectly through its influence on soil C and N content. Regarding PDR, Niboyet
et al. (2011) examined the effects of climate on PDR and found that experimentally increasing
precipitation 50% for 8 years resulted in a 22% increase in PDR, and long-term additions of 7 g
N m2 annually increased PDR 34%. Niboyet and coworkers (2011) did not detect sensitivity of
PDR to warming of 1oC for 8 years. This study may not have included a significant enough
temperature gradient to induce changes in PDR through changes in soil C and N, nor have
implemented it for a long enough period of time. In contrast, the temperature gradient in the
present study spans 2.9oC and represents long-term climate conditions rather than shorter-
term increases that have been experimentally induced.
Mean Annual Temperature, Precipitation and Nutrient Supply
PRSTM - Probe N, P, and S
Similar to PNM, PRSTM-probe 24-hour NO3- availability is positively correlated with MAP
(r = 0.51) and negatively correlated with MAT (r = -0.30) (Table 2.8). This reflects increased
substrate availability for in-situ mineralization of N associated with increased precipitation and
lower temperatures. While higher temperatures are associated with greater rates of
123
decomposition, the decrease in substrate associated with an increase in MAT appears to result
in lower in-situ NO3- availability. This relationship between climate and 24-hour NO3
-
availability was not detected at 28 days (Table 2.8) and is indicative of optimal temperature and
moisture conditions along with soil mixing associated with incubations enhancing N availability.
Phosphorus availability at 28 days displayed a negative relationship with MAP (r = -0.53);
this may reflect the influence of soil pH on P availability. With increasing soil pH, adsorption of
P to Fe/Al oxides decreases (Havlin et al., 1999), rendering P more available as pH approaches
neutral. Additionally, the greater C substrate associated with an increase in MAP may result in
P immobilization. In a study on the influence of climate factors on nutrient transformations,
Meeteren et al. (2007) found a significant relationship between microbial immobilization of P
from plant litter and temperature and moisture (r2 = 0.69), with moisture being the dominant
factor driving immobilization.
S mineralization is sensitive to temperature (Havlin et al., 1999), and this is reflected in
the present study where S availability increases with an increase in MAT (r = 0.58). As with P, S
immobilization may also be behind this relationship between MAT and S availability at 28 days,
as greater C substrate is associated with lower MATs and high C/S ratios are associated with S
immobilization (Havlin et al., 1999).
PRSTM - Probe K, Ca, and Mg
An increase in MAP is associated with decreased 28-day K availability (r = -0.65). This is
contrary to observations that K leaching losses are small, except in cases of sandy soils or high
incidences of flooding, neither of which are factors in the present study. This relationship is
more likely reflective of increased 28-day Ca availability associated with an increase in MAP (r =
124
0.59); as cited previously, increased Ca activity is associated with a decrease in K activity (Havlin
et al., 1999). This positive correlation between Ca and MAP also indicates that leaching of non-
acidic cations such as Ca, which can occur as H displaces cations, is not measurably reducing Ca
availability.
This same observation is also true for 28-day Mg availability, which is not significantly
related to MAP (Table 2.8). The positive correlation between MAT and Mg (r = 0.45) may be
reflective of the role of soil pH in Mg availability; Mg availability increases as pH approaches
neutral and in the present study soil pH was acidic and increased with increasing MAT (r = 0.60).
PRSTM - Probe Micronutrients
Micronutrients availability displayed few significant correlations with MAP and MAT
(Table 2.8). Relationships that did exist between climate variables and micronutrients included
the following: Fe, significantly correlated with MAT (r = 0.26), Cu, significantly correlated with
MAT (r = 0.26), and B availability at 24 hours, significantly correlated with MAP (r = 0.30). While
SOM is considered an important factor and source of micronutrients, the lack of correlation
between micronutrients and MAT and MAP is consistent with the observed poor correlations
between micronutrients and soil C and N properties previously discussed (Table 2.2). These
poor correlations between MAP, MAT, and micronutrients also existed for 24-hour PRSTM-probe
values (data not shown).
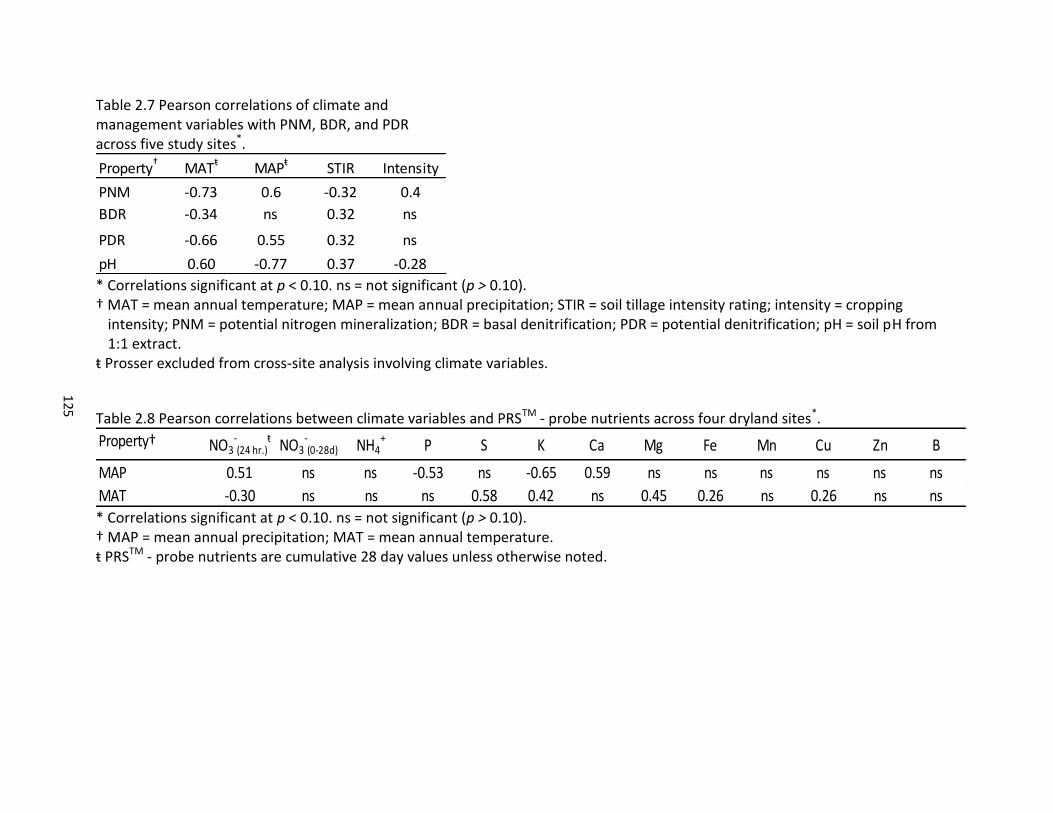
12
5
Table 2.7 Pearson correlations of climate and management variables with PNM, BDR, and PDR across five study sites*.
* Correlations significant at p < 0.10. ns = not significant (p > 0.10). † MAT = mean annual temperature; MAP = mean annual precipitation; STIR = soil tillage intensity rating; intensity = cropping
intensity; PNM = potential nitrogen mineralization; BDR = basal denitrification; PDR = potential denitrification; pH = soil pH from 1:1 extract.
ŧ Prosser excluded from cross-site analysis involving climate variables.
Table 2.8 Pearson correlations between climate variables and PRSTM - probe nutrients across four dryland sites*.
* Correlations significant at p < 0.10. ns = not significant (p > 0.10). † MAP = mean annual precipitation; MAT = mean annual temperature. ŧ PRSTM - probe nutrients are cumulative 28 day values unless otherwise noted.
Property† MATŧ MAPŧ STIR Intensity
PNM -0.73 0.6 -0.32 0.4
BDR -0.34 ns 0.32 ns
PDR -0.66 0.55 0.32 ns
pH 0.60 -0.77 0.37 -0.28
Property† NO3-(24 hr.)
ŧNO3
-(0-28d) NH4
+P S K Ca Mg Fe Mn Cu Zn B
MAP 0.51 ns ns -0.53 ns -0.65 0.59 ns ns ns ns ns ns
MAT -0.30 ns ns ns 0.58 0.42 ns 0.45 0.26 ns 0.26 ns ns
126
Management and Potential N Mineralization
PNM ranged from a high of 106.6 mg N kg-1 soil for the organic system at PCFS to 18.7
mg N kg-1 soil for the conventional WW-fallow rotation at Pendleton (Table 2.9). Significant
differences in PNM within sites occurred at Pendleton and Moro. At Pendleton, NT without
cropping intensification resulted in a 188% increase in PNM compared to CT, while at Moro
inclusion of a legume in rotation resulted in 80% greater PNM than WW-fallow NT and 70%
greater PNM than WW-SB-fallow NT. In contrast to Pendleton, Moro NT with fallow did not
result in significantly greater PNM compared to CT with fallow (Table 2.9). While no significant
differences were observed at the other sites, the impacts of STIR and cropping intensity on
PNM across the region are evident from the significant correlation of PNM with these
management variables (Table 2.7).
In a study by Soon et al. (2007) on management impacts on PNM, a 7-day anaerobic
incubation identified significantly greater PNM in the top 5 cm associated with NT (94.1 mg N
kg-1) than for CT (58.4 mg N kg-1) for a sandy loam with 8 years of management and a four-year
rotation including wheat and a legume. In contrast to results found at Moro, Soon and
coworkers (2007) did not identify any significant effect in the top 5 cm (or 15 cm) resulting from
inclusion of pea in rotation when it was the previous crop to wheat. Wood et al. (1990) found
that PNM associated with NT was significantly greater under more intensely cropped systems
after 3.5 years of management in a semi-arid environment receiving 400 mm of annual
precipitation. Similarly, in the present study, cropping intensification resulted in significantly
increased PNM with a legume in rotation at Moro (Table 2.9), and is positively correlated with
127
PNM across all sites (Table 2.7). In general, research has shown the sensitivity of PNM to tillage
practices and cropping intensity (Woods and Schuman, 1988; Wood and Edwards, 1992).
Management and Potential and Basal Denitrification
The CV for PDR was generally lower than for BDR; CVs for BDR ranged from 21% to
128%, and for PDR they ranged from 14% to 62% (Table 2.9). Accordingly, BDR did not
significantly differ within any of the sites, while PDR showed significant differences at 3 of the 5
sites (Table 2.9). Prosser and Moro were the only sites for which PDR did not reveal any
significant differences. However, it is notable that in most instances Prosser showed an order
of magnitude greater BDR and PDR than the other sites did. Prosser is unique compared to the
other sites in several regards: it is irrigated, has a sandier soil, and has a unique crop rotation,
which includes WW, sweet corn, and potato.
It is not possible to say which of these factors may have contributed to greater BDR and
BDR at Prosser compared to other sites. Drury et al. (1991) found that a sandy loam soil had
lower background denitrification than other clay loam soils; there did not, however, appear to
be any clear trend between soil type and background denitrification in their study.
Furthermore, Drury at al. (2008b) found monoculture corn had greater in-situ denitrification
compared to more diverse rotations and partially attributed this to greater fertilizer
requirements of monoculture corn. However, background inorganic N levels do not help to
explain the difference as Prosser NH4+ and NO3
- are on the same order of magnitude as other
sites (data not shown). Several have found that soil aggregate structure influences
denitrification by controlling microbial access to substrate (Christensen and Christensen, 1991;
Drury et al., 1998). Soils in this study were not subjected to structural analysis, so it is not
128
possible to say if this was a contributing factor; sandier soils at Prosser, however, may have
contributed to greater microbial access to substrate compared to the other sites, as sandier
soils are associated with reduced aggregate structure.
Across sites with significant differences, results were inconsistent with regard to the
influence of tillage on PDR, indicating more subtle factors were contributing to PDR rates. At
Kambitsch, CT resulted in a 120% increase in PDR relative to NT; conversely, at Pendleton, a
drier site than Kambitsch, NT resulted in a 97% increase in PDR compared to the same cropping
rotation under CT.
Some have found the most limiting factor to denitrification to be C substrate supply
across a range of soil physical and chemical properties (Drury et al., 1991). As NT is often
associated with restoring or increasing soil C levels relative to CT (Brown and Huggins, 2012), NT
represents a potential increase in denitrification. Consistent with this finding, some studies
have shown an increase in N20 production under NT management (Ball et al., 1999; Liu et al.,
2007). Others, however, have shown a decrease in N2O production associated with NT (Mosier
et al., 2006).
In the present study, differences in soil C may be behind the inconsistency in the
influence of tillage on PDR; at Kambitsch, WEOC, a labile and microbially available form of C,
was 19% greater under CT than NT, and MBC was also 35% greater under CT than NT. In
contrast to this, at Pendleton WEOC and MBC were 80% and 33% greater, respectively, under
NT than CT. These contrasting results at Kambitsch and Pendleton considered in lieu of these
important soil C pools are consistent with the role of C in denitrification and explain the
contrasting results regarding the impact of tillage on PDR.
129
Rather than management or soil C levels, time and climate have been shown by some to
be the broader drivers of denitrification. Six et al. (2004) concluded that following the adoption
of NT, N2O emissions are higher than in CT for the first 10 years, and after 20 years there is no
difference between the two systems in dry climates while in humid climates, NT has reduced
N2O emissions relative to CT. Similarly, a model simulation by Mummey et al. (1998) indicates
that relative N2O emissions associated with tillage systems is dependent on climate; NT systems
in warm and wet regions can expect comparable or reduced N2O emissions compared to CT,
while in drier regions, such as the inland Pacific Northwest, NT simulations of denitrification
indicate an increase in N2O emissions relative to CT, mainly due to increased soil moisture
associated with NT. Mummey and coworkers (1998) concluded that with the adoption of NT,
over time the active pool of SOM will increase and result in tighter N cycling and therefore
reduced N20 emissions.
Regarding cropping intensification, rotations in the present study in which legumes
comprised half or more of the rotation consistently increased PDR. At Pendleton, WW/WP NT
resulted in 81% greater PDR than WW/fallow NT and 256% greater PDR than WW/fallow CT
(Table 2.9). At PCFS, significantly greater PDR was measured in a NT organic setting with pea
present during time of sampling (Table 2.9), and was 94% greater than the next highest
measured PDR, represented by WW/SB/SW NT. While not significantly different, similar results
were found at PCFS for BDR (Table 2.9).
Due to differing methodologies, it is difficult to compare denitrification results across
studies; however, BDR results from this study were up to an order of magnitude lower than
results published in other studies (Drury et al., 1991; Guo et al.; 2011); this was also the case for
130
PDR compared to certain published studies(Staley et al., 1990; Luo et al., 1996), yet compared
to other published results, PDR and BDR results in the present study were comparable to
published results (Staley et al., 1990; D’Haene et al., 2003). Field measurements of
denitrification in semi-arid climates have been shown to be episodic, with major events
associated with fertilization (Burton et al., 2007), freeze-thaw cycles (Dusenbury et al., 2008),
and rainfall events after prolonged dry periods (Beauchamp et al., 1996) and following the
addition of fresh plant residue (Aulakh and Rennie, 1986; Chen et al., 2013). Due to this
episodic nature and the number of variables that influence in-field denitrification, laboratory
measured denitrification cannot be directly correlated with field denitrification, except in
unique circumstances favorable to denitrification, in which peak field values have been shown
to be of the same order of magnitude as PDR (D’Haene et al., 2003).
In general, studies of the impact of management indicate that NT results in greater PDR
than CT (Staley et al., 1990), and that cropping diversification has potential to increase PDR
(Guo et al., 2011). Aulakh et al. (1986) investigated both in-situ denitrification and laboratory
denitrification from incubations for soils from dryland cropping systems under WW-fallow and
continuous WW, both CT and NT. Aulakh and coworkers (1986) found both in-situ
denitrification and denitrification from laboratory incubations to be significantly higher for NT
systems in both cases. As was concluded by Mummey et al. (1998), Aulakh et al. (1986)
concluded that soil moisture was the main factor contributing to higher in-situ rates, and
laboratory incubations also revealed a significantly higher denitrifier population associated with
NT soils. In a review of both laboratory and field studies, Chen et al. (2013) found that when N
131
supplied by crop residues is equivalent to N supplied by synthetic fertilizers, N2O production in
crop amended plots is greater than for fertilized plots.
This phenomenon of greater N2O production in crop amended plots compared to
fertilized plots was explained by a greater O2 demand from the stimulatory effects of crop
amendments resulting in microsite anaerobicity (Chen et al., 2013). Li et al. (2013) applied
plant residues of varying C/N ratios to soils under both aerobic and anaerobic conditions, and
found that under aerobic conditions the addition of crop residues enhanced N2O production
regardless of C/N ratios, while under anaerobic conditions the addition of plant materials, even
with low C/N ratios, reduced N2O emissions. The mechanism behind this latter finding was
explained by Li and coworkers (2013) as the result of two occurrences: 1) a reduction in NO3-
availability resulting from a decrease in nitrification under anaerobic conditions, and 2) reduced
O2 availability caused by crop residue additions resulting in enhanced N2O reductase activity
and therefore greater reduction of N2O to N2.
The corollary of findings by Chen et al. (2013) and Li et al. (2013) is that denitrification
rates increase with the addition of crop residues under both anaerobic and aerobic conditions,
but that under anaerobic conditions crop amendments can further reduce O2 supply through
enhanced heterotrophic microbial activity, resulting in further reduction of N2O to N2 by
increased enzyme activity. This phenomenon was not detected in the present study as the
activity of N2O reductase was inhibited by the addition of acetylene. Nonetheless, under NT,
anaerobic conditions are greater than under CT (Mummey et al., 1998), and findings by Chen et
al. (2013) and Li et al. (2013) suggest that increased cropping intensity under NT will increase
denitrification rates but under field conditions mitigate N2O production.
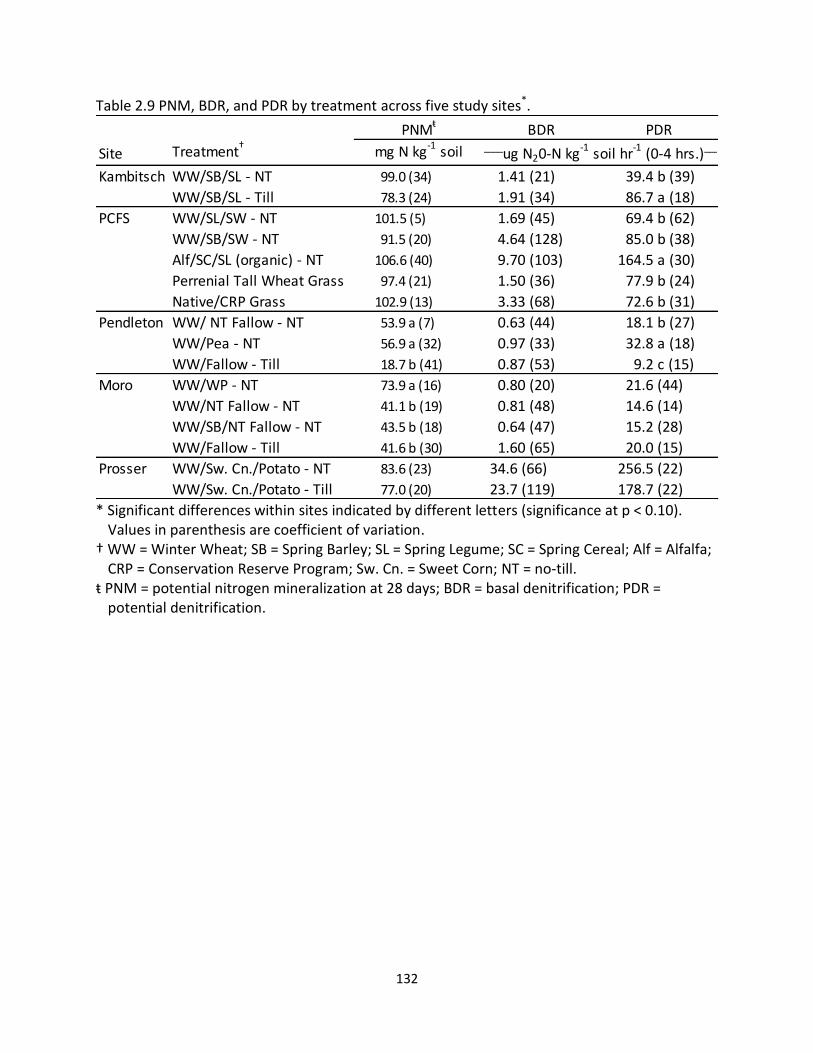
132
Table 2.9 PNM, BDR, and PDR by treatment across five study sites*.
* Significant differences within sites indicated by different letters (significance at p < 0.10).
Values in parenthesis are coefficient of variation. † WW = Winter Wheat; SB = Spring Barley; SL = Spring Legume; SC = Spring Cereal; Alf = Alfalfa;
CRP = Conservation Reserve Program; Sw. Cn. = Sweet Corn; NT = no-till. ŧ PNM = potential nitrogen mineralization at 28 days; BDR = basal denitrification; PDR =
potential denitrification.
PNMŧ
BDR PDR
Site Treatment† mg N kg-1 soil
Kambitsch WW/SB/SL - NT 99.0 (34) 1.41 (21) 39.4 b (39)
WW/SB/SL - Till 78.3 (24) 1.91 (34) 86.7 a (18)
PCFS WW/SL/SW - NT 101.5 (5) 1.69 (45) 69.4 b (62)
WW/SB/SW - NT 91.5 (20) 4.64 (128) 85.0 b (38)
Alf/SC/SL (organic) - NT 106.6 (40) 9.70 (103) 164.5 a (30)
Perrenial Tall Wheat Grass 97.4 (21) 1.50 (36) 77.9 b (24)
Native/CRP Grass 102.9 (13) 3.33 (68) 72.6 b (31)
Pendleton WW/ NT Fallow - NT 53.9 a (7) 0.63 (44) 18.1 b (27)
WW/Pea - NT 56.9 a (32) 0.97 (33) 32.8 a (18)
WW/Fallow - Till 18.7 b (41) 0.87 (53) 9.2 c (15)
Moro WW/WP - NT 73.9 a (16) 0.80 (20) 21.6 (44)
WW/NT Fallow - NT 41.1 b (19) 0.81 (48) 14.6 (14)
WW/SB/NT Fallow - NT 43.5 b (18) 0.64 (47) 15.2 (28)
WW/Fallow - Till 41.6 b (30) 1.60 (65) 20.0 (15)
Prosser WW/Sw. Cn./Potato - NT 83.6 (23) 34.6 (66) 256.5 (22)
WW/Sw. Cn./Potato - Till 77.0 (20) 23.7 (119) 178.7 (22)
__________ug N20-N kg-1 soil hr-1 (0-4 hrs.)_________
133
Management and Nutrient Supply
PRSTM - Probe NO3-, NH4
+, S, and P
PRSTM-probe 24-hour NO3- values ranged from 6.8 to 37.6 ug 10 cm-2 24 hrs-1 (Table
2.10). Significant differences in NO3- were observed at Pendleton and Moro after 24 hours and
at all but Prosser after 28 days (Tables 2.10 and 2.11). In comparison, Adewale (2013) notes
that for a WW yield goal of 5360 kg ha-1, Western Ag Innovations recommends fertilizer N
applications of 139 kg N ha-1 for 24-hour adsorbed PRSTM-probe N values of 10 ug N 10 cm-2 and
as 24-hour PRSTM-probe N values approach 70 kg N ha-1 N, fertilizer recommendations drop to
117 kg N ha-1.
Significant differences at 24 hours were positively associated with cropping
intensification at both Pendleton and Moro (Table 2.12). At Pendleton and Moro, cropping
intensification under NT with a legume has resulted in a 78% and 245% increase, respectively,
in available NO3- compared to WW/fallow NT (Table 2.10). This result may be reflective of
optimal temperature and moisture conditions during incubation and reflects greater
mineralization of SOM under incubation conditions associated with increased C and N inputs
from plant residues under more intensely cropped rotations. Cropping intensification was
consequently significantly correlated with 28-day NO3- at Pendleton and Moro (Table 2.12).
With the treatment comparisons in this study, it is not possible to deduce if this finding
is the result of intensification specifically with a legume, or merely the result of intensification.
However, results at PCFS are worth a closer look; the organic rotation with 2 legumes and
spring wheat had significantly greater NO3- than other rotations, and yet a single season of a
spring legume in rotation (WW/SL/SW) did not result in greater NO3- availability at 28 days
134
(Table 2.11). This set of data indicates that greater utilization of legumes in rotation infers
greater NO3- availability under optimal conditions, though utilizing a legume one in three years
either does not have a measurable impact or its influence is limited in time to the following
crop year. This observation is consistent with greater buildup of PNM with greater utilization of
legumes.
Similarly, Qian and Schoenau (1995) found that continuous alfalfa resulted in
significantly greater PRSTM-probe NO3- than a canola/lentil/barley rotation. It is also significant
that at Kambitsch and Moro, comparing strictly tillage treatments without a cropping
intensification gradient, CT is associated with 75% and 82% greater NO3- at 28 days,
respectively, than NT at both Kambitsch and Moro (Table 2.11). Consequently, STIR is
significantly correlated with 28-day NO3- at Kambitsch; however, at Moro, cropping intensity
rather than STIR is the significant management variable at 28 days (Table 2.12).
This increase in NO3- under higher disturbance systems may be the result of three
possible mechanisms. Tillage may have resulted in bringing up NO3- to surface soils that had
leached beyond the sampling depth during wetter field conditions, increasing its concentration
in samples collected under CT plots. This explanation is supported by the fact that total
inorganic N present in the soils prior to initiating the incubation as determined from KCl
extractions was also greater under CT than for NT at both Kambitsch and Moro (data not
shown). In this scenario, under NT this NO3- not detected by PRSTM probes would still be
available to plant roots. Second, greater plant uptake of NO3- under NT may have occurred
earlier in the season due to improved soil water conservation under NT compared to CT, and
resulted in less NO3- detected under NT at time of sampling when conditions were drier. Last,
135
surface placement of crop residues under NT may have resulted in N immobilization. This would
subsequently reduce net N mineralization and the availability of NO3- present in the soil during
sampling (Jowkin and Schoenau, 1998).
Jowkin and Schoenau (1998) conducted an in-field evaluation of NO3- supply using PRSTM
probes under CT and NT systems, and concluded that there were limited differences in NO3-
availability between the two systems, determining that landscape position had a greater
influence on NO3- than tillage, presumably resulting from moisture and SOM variability across
different landscape positions. Furthermore, Hangs et al. (2013) found that fertilizer application
was more important than time under NT in influencing PRSTM cumulative NO3- after a six-week
incubation. Walley et al. (2002) found NO3- adsorbed to PRSTM probes after two-week
incubations was significantly correlated with both wheat yield and plant N accumulation.
Ultimately, while the influence of tillage on NO3- availability may be minimal compared to other
considerations, this plant N accumulation represents SON available for mineralization the
following season with the return of biomass to the soil and embodies the value of cropping
intensification in increasing plant N availability.
Across the study area, available NH4+ is present in soils in much lower quantities than
NO3- (Tables 2.10 and 2.11), reflecting favorable conditions for nitrification. The relative
increases in NH4+
across the incubation period were also less than that observed for NO3-. No
significant differences were detected in NH4+ at 24 hours, while at 28 days only at PCFS (Table
2.11), where WW/SB/SW NT was not significantly different than the organic rotation but was
52% greater than WW/SL/SW NT; this difference at PCFS was not significantly correlated with
STIR or cropping intensity (Table 2.12).
136
S availability at 24 hours ranged from 2.51 µg S 10 cm-2 under WW/fallow CT at Moro to
9.66 µg S 10 cm-2 under WW/Sw. Corn/Potato at Prosser (Table 2.10). At 28 days, S availability
ranged from 13.5 µg S 10 cm-2 under CRP at PCFS to 40.1 µg S 10 cm-2 under WW/fallow CT at
Pendleton (Table 2.11). Western Ag Innovations provide fertilizer recommendations for 24-
hour S values below 66 ug 10 cm-2 24 hrs-1 (Adewale, 2013). Considering that 28-day S
availability is below this level, significant differences between treatments at the low values
observed in this study are likely to be trivial with regard to plant S requirements. Nonetheless,
the CVs for 24-hour S availability were generally less than CVs for 28-day S availability;
consequently, significant differences in S were more evident at 24 hours than with 28 days
(Tables 2.10 and 2.11).
The 24-hour S data are negatively correlated with cropping intensity at PCFS (r = -0.47)
and Pendleton (r = -0.65) and negatively correlated with STIR at Moro (r = -0.54) (Table 2.12).
At Moro, NT has 134% greater S availability than CT within WW/fallow (Table 2.10). At
Pendleton, 1 year of cropping intensification with winter pea under NT has resulted in 23% less
S than WW/fallow NT, while there was no difference in S availability associated with tillage
(Table 2.10). At PCFS, annual cropping under NT with a legume in rotation represented by
WW/SL/SB NT had greater 24-hour S availability than perennial systems but not the other
annual systems. Conversely, Hangs et al. (2013) found that S supplied by a perennial native
system was greater than for NT systems, even though the NT systems had significantly greater
extractable S, suggesting the importance of S mineralization from organic S sources. At PCFS,
this may be the result of fertilization of the annual plots resulting in greater biomass
137
production, and subsequently greater organic S available for mineralization in surface soils
under annual cropping systems.
Pendleton is the only site at 28 days with significant differences in S availability, with CT
resulting in greater S availability than NT (Table 2.11). Subsequently, as with NO3-, this trend in
S at Pendleton, where CT plots are moldboard plowed, may be the result of tillage bringing
inorganic S to surface soils that had previously leached and exists beyond the sample depth for
NT plots. Franzluebbers and Hons (1996) found SO4- to increase with depth as a result of
leaching and found little difference between S availability resulting from management
practices. Grant et al. (2003) found no significant influence of tillage on PRSTM-probe S for two-
week in-field incubations, but found that PRSTM-probe S values during this incubation were
sensitive to S fertilization type and season of application. This result supports that tillage has a
minimal impact on S availability, and that other management factors are more important in
dictating plant available S.
After 24 hours of incubation, P availability ranged from 0.50 µg P 10 cm-2 under WW/Sw.
Corn/Potato CT at Prosser to 2.04 µg P 10 cm-2 under WW/SB/fallow NT at Moro (Table 2.10).
At 28 days, P availability ranged from 1.60 µg P 10 cm-2 under WW/Sw. Corn/Potato CT at
Prosser to 9.73 µg P 10 cm-2 under WW/SB/fallow NT at Moro (Table 2.11). As with S
availability, Western Ag Innovations’ PRSTM-probe 24-hour P value below which fertilizer P is
recommended, approximately 21.0 µg 10 cm-2 (Adewale, 2013), far exceeds both 24-hour and
28-day available P in this study. Fewer significant differences were observed in P availability
than any of the other macronutrients, and significant differences were detected only at 24
hours for Prosser and no differences detected at 28 days (Tables 2.10 and 2.11). This lack of
138
significant differences is possibly reflective of the many factors influencing P availability, which
is ultimately dictated by the flux of labile P into both solution P and non-labile P, also referred
to as a soils P buffering capacity (Havlin et al., 1999). Many studies have found significant
differences in extractable P of surface soils associated with tillage (Robbins and Voss, 1991;
Unger 1991; Franzluebbers and Hons, 1996). However, considering the multiple factors
influencing P availability, P adsorbed to exchange resins is more reflective of plant available P
than extractions (Sharpley et al., 1994).
Neither STIR nor cropping intensity was significantly correlated with 24-hour and 28-day
P at any of the sites (Table 2.12); when analyzed across sites, however, 24-hour P demonstrates
a significant negative correlation with STIR (data not shown). This is indicative of the in-situ
cumulative effect of reduced turnover of organic P associated with increasing tillage intensity.
This result is supported by observations that phosphatase, associated with microbial utilization
of organic P, increases under NT (Wang et al., 2011; Wei et al., 2014). It may also be the result
of surface placement of residues and fertilizer associated with NT, resulting in redistribution of
P compared to tilled systems. Franzluebbers and Hons (1996) found similar results in surface
soils for extracted P when comparing NT and CT and cited several others who have found
similar results in silt loam soils. Arcand et al. (2010) examined P turnover and availability using
PRSTM probes as influenced by buckwheat and rock phosphate and found that P concentration
in residue was more important in determining P availability than total P supplied through
residues, indicative of microbial P immobilization resulting from poor residue quality with a
high C/P ratio. Therefore, NT along with cropping practices that decrease residue C/P ratios
appears to have the greatest potential for increasing plant available P.
139
Additionally, greater anion availability resulting from mineralization can also help to
increase P availability by competing with inorganic P for adsorption sites on clay or organic
matter (Berg and Joern, 2006). This possibility is reflected in results from the present study, in
which a significant negative correlation exists between P and NO3- availability (Table 2.5). Both
are released through mineralization, but the negative correlation indicates that P availability is
at the expense of NO3- availability, suggesting a similar competition for exchange sites between
anions in the present study as described, by Berg and Joern (2006).
PRSTM - Probe K, Ca, and Mg
At 24 hours, K availability ranged from 66.7 µg K 10 cm-2 under WW/Sw. Corn/Potato at
Prosser to 317.7 µg K 10 cm-2 under WW/fallow NT at Pendleton (Table 2.11). Western Ag
Innovations recommends fertilizer application of K for 24-hour PRSTM-probe K values below
approximately 171 ug cm-2 (Adewale, 2013). For all sites but Kambitsch, Prosser, and
Pendleton’s WW-fallow CT plot, K adsorbed at 24 hours exceeded this cutoff. At Prosser, the
lower values may be the result of greater sand content compared to the other sites, as K
leaching losses can be high in sandy soils (Noorbakhsh et al., 2008). At Kambitsch, lower 24-
hour K values may be the result of higher Ca availability compared to other sites (Table 2.10), as
Ca activity is known to have an inhibitory effect on K availability (Havlin et al., 1999). Significant
differences in K availability occurred only at Pendleton after 24 hours and at Pendleton and
Moro after 28 days (Tables 2.11 and 2.12). An increase in STIR at Pendleton is associated with a
105% and 77% decline in 24-hour and 28-day K availability, respectively. STIR is subsequently
negatively correlated with K availability at both time periods (Table 2.13). At Moro, NT without
cropping intensification did not result in significantly greater K at 28 days; annual cropping
140
represented by WW/WP NT did, however, result in 29% greater K availability than WW/fallow
CT (Table 2.12). In evaluating the nutrient supplying power of NT cropland compared to native
prairie, Hangs et al. (2013) found no difference in PRSTM-probe K availability at 24 hours and 6
weeks between 10 years of NT and 32 years of NT; however, 32 years of NT without fertilization
had the same K supplying power of native prairie, while 10 years of NT required fertilization to
match the native prairie in K supplying power. This suggests that K supplying power is improved
with longer duration under NT and is in agreement with results in this study, where significantly
greater K availability under NT compared to CT was observed at Pendleton, the site with the
longest history under NT (Table 2.1).
Calcium and Mg behaved similarly, exhibiting a significant correlation at 28 days (r =
0.67) (Table 2.5). In spite of this correlation, significant differences associated with treatments
varied between these nutrients at both time periods (Tables 2.11 and 2.12). At 24 hours,
significant differences in Ca associated with management occurred only at Moro, and for Mg at
Moro, Pendleton, and PCFS. Annual cropping at Moro under NT is associated with significantly
greater Ca and Mg than the other treatments at 24 hours (Table 2.10), and cropping intensity
was significantly correlated with these differences (Table 2.12). At Pendleton and PCFS, STIR
was significantly correlated with the variation in Mg; however, the relationship was positive at
PCFS and negative at Pendleton (Table 2.12). This difference may be the result of greater Mg
associated with the organic Alfalfa/cereal/SL rotation at PCFS, which also has a greater STIR.
Differences after 28 days were greater in Ca than after 24 hours, while they were fewer in Mg.
At Moro, cropping intensity remains significant in explaining the differences in Ca at 28 days,
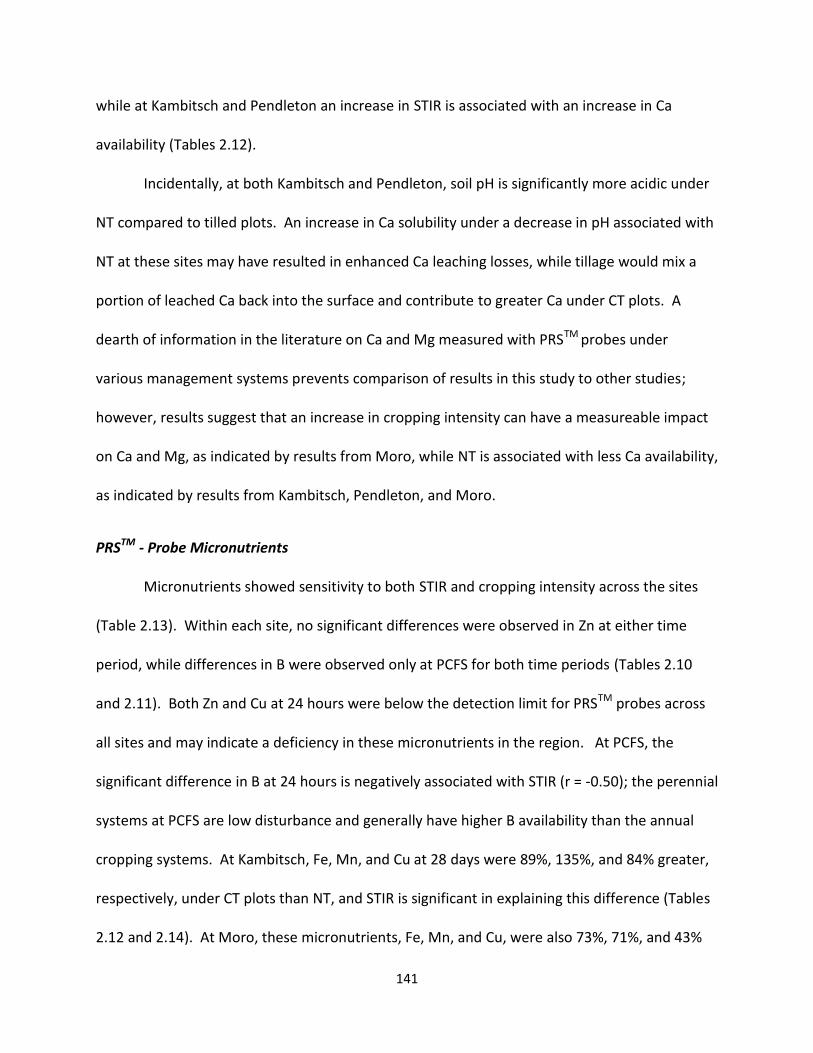
141
while at Kambitsch and Pendleton an increase in STIR is associated with an increase in Ca
availability (Tables 2.12).
Incidentally, at both Kambitsch and Pendleton, soil pH is significantly more acidic under
NT compared to tilled plots. An increase in Ca solubility under a decrease in pH associated with
NT at these sites may have resulted in enhanced Ca leaching losses, while tillage would mix a
portion of leached Ca back into the surface and contribute to greater Ca under CT plots. A
dearth of information in the literature on Ca and Mg measured with PRSTM probes under
various management systems prevents comparison of results in this study to other studies;
however, results suggest that an increase in cropping intensity can have a measureable impact
on Ca and Mg, as indicated by results from Moro, while NT is associated with less Ca availability,
as indicated by results from Kambitsch, Pendleton, and Moro.
PRSTM - Probe Micronutrients
Micronutrients showed sensitivity to both STIR and cropping intensity across the sites
(Table 2.13). Within each site, no significant differences were observed in Zn at either time
period, while differences in B were observed only at PCFS for both time periods (Tables 2.10
and 2.11). Both Zn and Cu at 24 hours were below the detection limit for PRSTM probes across
all sites and may indicate a deficiency in these micronutrients in the region. At PCFS, the
significant difference in B at 24 hours is negatively associated with STIR (r = -0.50); the perennial
systems at PCFS are low disturbance and generally have higher B availability than the annual
cropping systems. At Kambitsch, Fe, Mn, and Cu at 28 days were 89%, 135%, and 84% greater,
respectively, under CT plots than NT, and STIR is significant in explaining this difference (Tables
2.12 and 2.14). At Moro, these micronutrients, Fe, Mn, and Cu, were also 73%, 71%, and 43%
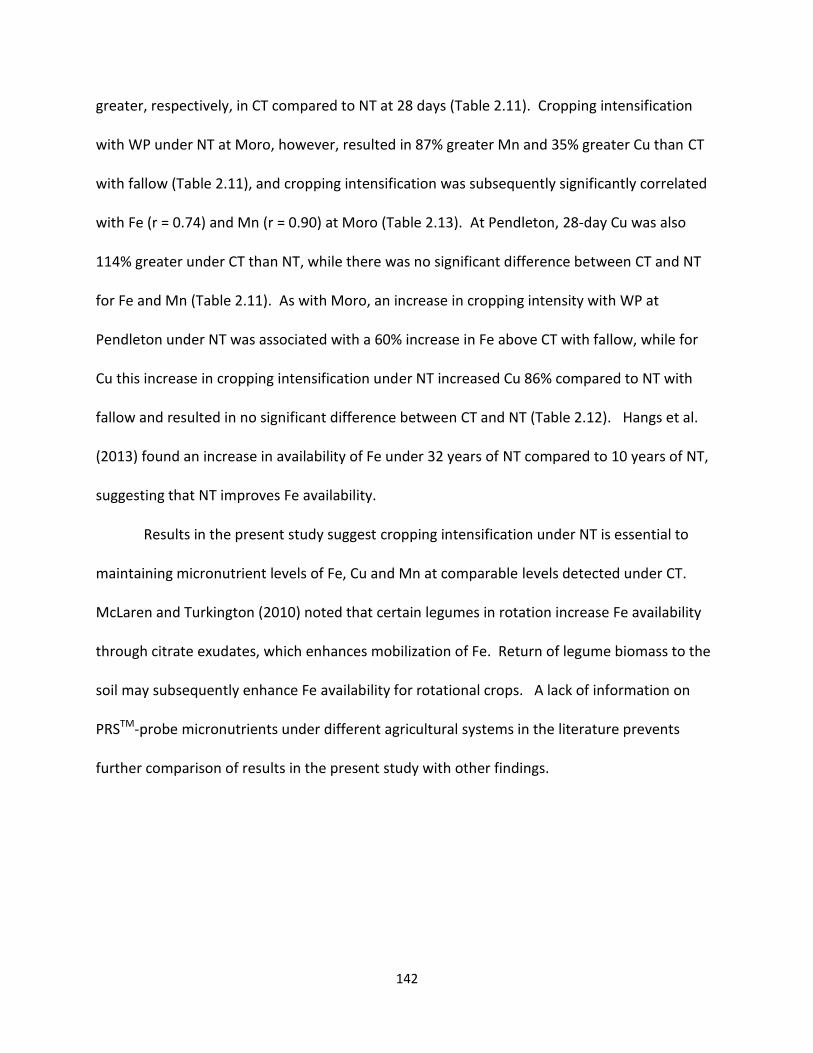
142
greater, respectively, in CT compared to NT at 28 days (Table 2.11). Cropping intensification
with WP under NT at Moro, however, resulted in 87% greater Mn and 35% greater Cu than CT
with fallow (Table 2.11), and cropping intensification was subsequently significantly correlated
with Fe (r = 0.74) and Mn (r = 0.90) at Moro (Table 2.13). At Pendleton, 28-day Cu was also
114% greater under CT than NT, while there was no significant difference between CT and NT
for Fe and Mn (Table 2.11). As with Moro, an increase in cropping intensity with WP at
Pendleton under NT was associated with a 60% increase in Fe above CT with fallow, while for
Cu this increase in cropping intensification under NT increased Cu 86% compared to NT with
fallow and resulted in no significant difference between CT and NT (Table 2.12). Hangs et al.
(2013) found an increase in availability of Fe under 32 years of NT compared to 10 years of NT,
suggesting that NT improves Fe availability.
Results in the present study suggest cropping intensification under NT is essential to
maintaining micronutrient levels of Fe, Cu and Mn at comparable levels detected under CT.
McLaren and Turkington (2010) noted that certain legumes in rotation increase Fe availability
through citrate exudates, which enhances mobilization of Fe. Return of legume biomass to the
soil may subsequently enhance Fe availability for rotational crops. A lack of information on
PRSTM-probe micronutrients under different agricultural systems in the literature prevents
further comparison of results in the present study with other findings.
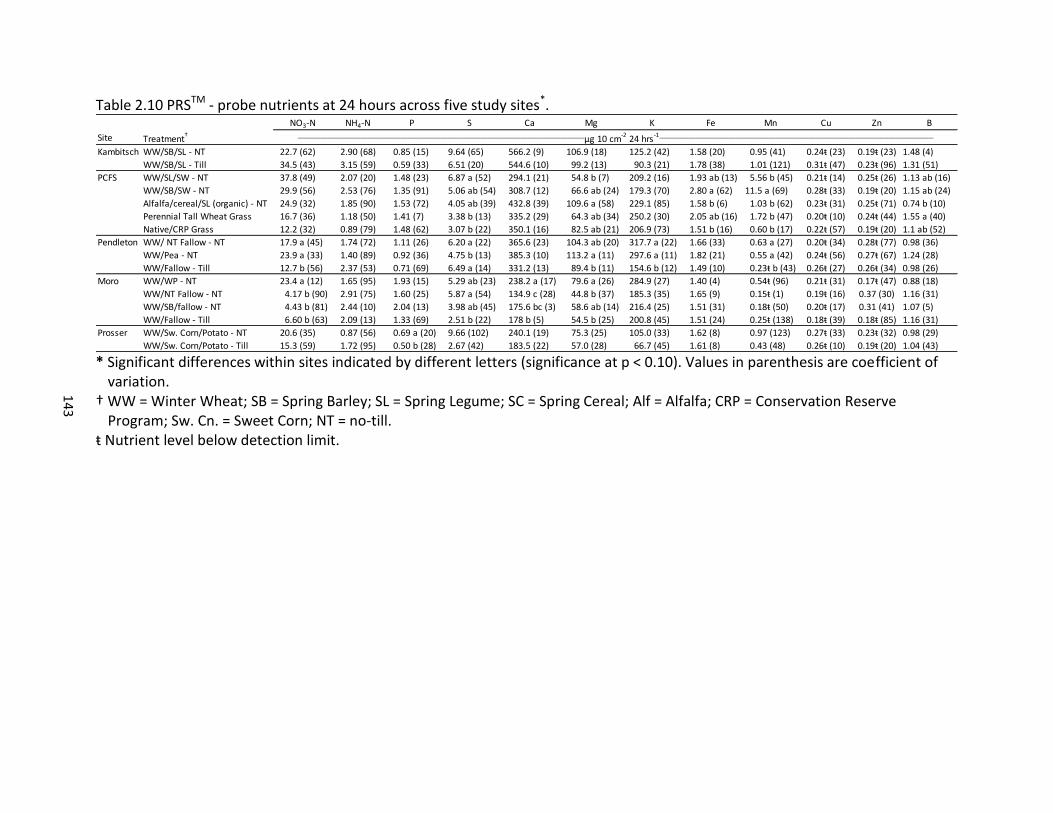
14
3
Table 2.10 PRSTM - probe nutrients at 24 hours across five study sites*.
* Significant differences within sites indicated by different letters (significance at p < 0.10). Values in parenthesis are coefficient of
variation. † WW = Winter Wheat; SB = Spring Barley; SL = Spring Legume; SC = Spring Cereal; Alf = Alfalfa; CRP = Conservation Reserve
Program; Sw. Cn. = Sweet Corn; NT = no-till. ŧ Nutrient level below detection limit.
NO3-N NH4-N P S Ca Mg K Fe Mn Cu Zn B
Site Treatment†
Kambitsch WW/SB/SL - NT 22.7 (62) 2.90 (68) 0.85 (15) 9.64 (65) 566.2 (9) 106.9 (18) 125.2 (42) 1.58 (20) 0.95 (41) 0.24ŧ (23) 0.19ŧ (23) 1.48 (4)
WW/SB/SL - Till 34.5 (43) 3.15 (59) 0.59 (33) 6.51 (20) 544.6 (10) 99.2 (13) 90.3 (21) 1.78 (38) 1.01 (121) 0.31ŧ (47) 0.23ŧ (96) 1.31 (51)
PCFS WW/SL/SW - NT 37.8 (49) 2.07 (20) 1.48 (23) 6.87 a (52) 294.1 (21) 54.8 b (7) 209.2 (16) 1.93 ab (13) 5.56 b (45) 0.21ŧ (14) 0.25ŧ (26) 1.13 ab (16)
WW/SB/SW - NT 29.9 (56) 2.53 (76) 1.35 (91) 5.06 ab (54) 308.7 (12) 66.6 ab (24) 179.3 (70) 2.80 a (62) 11.5 a (69) 0.28ŧ (33) 0.19ŧ (20) 1.15 ab (24)
Alfalfa/cereal/SL (organic) - NT 24.9 (32) 1.85 (90) 1.53 (72) 4.05 ab (39) 432.8 (39) 109.6 a (58) 229.1 (85) 1.58 b (6) 1.03 b (62) 0.23ŧ (31) 0.25ŧ (71) 0.74 b (10)
Perennial Tall Wheat Grass 16.7 (36) 1.18 (50) 1.41 (7) 3.38 b (13) 335.2 (29) 64.3 ab (34) 250.2 (30) 2.05 ab (16) 1.72 b (47) 0.20ŧ (10) 0.24ŧ (44) 1.55 a (40)
Native/CRP Grass 12.2 (32) 0.89 (79) 1.48 (62) 3.07 b (22) 350.1 (16) 82.5 ab (21) 206.9 (73) 1.51 b (16) 0.60 b (17) 0.22ŧ (57) 0.19ŧ (20) 1.1 ab (52)
Pendleton WW/ NT Fallow - NT 17.9 a (45) 1.74 (72) 1.11 (26) 6.20 a (22) 365.6 (23) 104.3 ab (20) 317.7 a (22) 1.66 (33) 0.63 a (27) 0.20ŧ (34) 0.28ŧ (77) 0.98 (36)
WW/Pea - NT 23.9 a (33) 1.40 (89) 0.92 (36) 4.75 b (13) 385.3 (10) 113.2 a (11) 297.6 a (11) 1.82 (21) 0.55 a (42) 0.24ŧ (56) 0.27ŧ (67) 1.24 (28)
WW/Fallow - Till 12.7 b (56) 2.37 (53) 0.71 (69) 6.49 a (14) 331.2 (13) 89.4 b (11) 154.6 b (12) 1.49 (10) 0.23ŧ b (43) 0.26ŧ (27) 0.26ŧ (34) 0.98 (26)
Moro WW/WP - NT 23.4 a (12) 1.65 (95) 1.93 (15) 5.29 ab (23) 238.2 a (17) 79.6 a (26) 284.9 (27) 1.40 (4) 0.54ŧ (96) 0.21ŧ (31) 0.17ŧ (47) 0.88 (18)
WW/NT Fallow - NT 4.17 b (90) 2.91 (75) 1.60 (25) 5.87 a (54) 134.9 c (28) 44.8 b (37) 185.3 (35) 1.65 (9) 0.15ŧ (1) 0.19ŧ (16) 0.37 (30) 1.16 (31)
WW/SB/fallow - NT 4.43 b (81) 2.44 (10) 2.04 (13) 3.98 ab (45) 175.6 bc (3) 58.6 ab (14) 216.4 (25) 1.51 (31) 0.18ŧ (50) 0.20ŧ (17) 0.31 (41) 1.07 (5)
WW/Fallow - Till 6.60 b (63) 2.09 (13) 1.33 (69) 2.51 b (22) 178 b (5) 54.5 b (25) 200.8 (45) 1.51 (24) 0.25ŧ (138) 0.18ŧ (39) 0.18ŧ (85) 1.16 (31)
Prosser WW/Sw. Corn/Potato - NT 20.6 (35) 0.87 (56) 0.69 a (20) 9.66 (102) 240.1 (19) 75.3 (25) 105.0 (33) 1.62 (8) 0.97 (123) 0.27ŧ (33) 0.23ŧ (32) 0.98 (29)
WW/Sw. Corn/Potato - Till 15.3 (59) 1.72 (95) 0.50 b (28) 2.67 (42) 183.5 (22) 57.0 (28) 66.7 (45) 1.61 (8) 0.43 (48) 0.26ŧ (10) 0.19ŧ (20) 1.04 (43)
_____________________________________________________________________________________________µg 10 cm
-2 24 hrs
-1_________________________________________________________________________________________
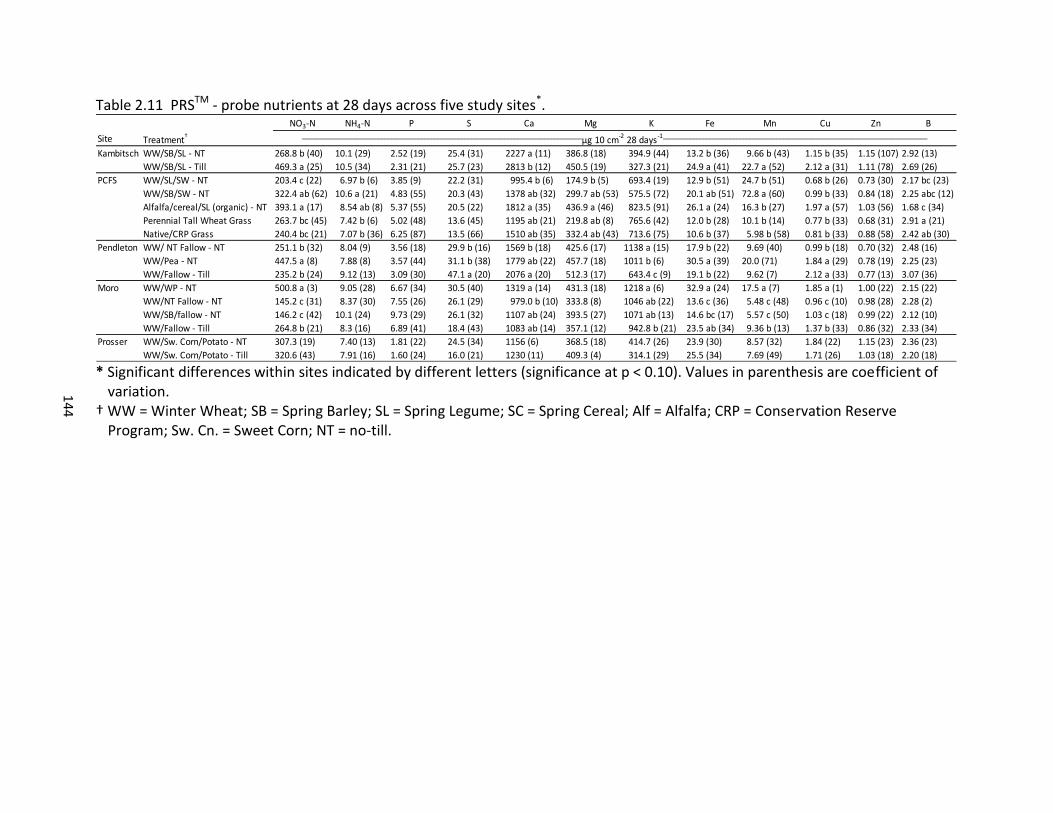
14
4
Table 2.11 PRSTM - probe nutrients at 28 days across five study sites*.
* Significant differences within sites indicated by different letters (significance at p < 0.10). Values in parenthesis are coefficient of
variation. † WW = Winter Wheat; SB = Spring Barley; SL = Spring Legume; SC = Spring Cereal; Alf = Alfalfa; CRP = Conservation Reserve
Program; Sw. Cn. = Sweet Corn; NT = no-till.
NO3-N NH4-N P S Ca Mg K Fe Mn Cu Zn B
Site Treatment†
Kambitsch WW/SB/SL - NT 268.8 b (40) 10.1 (29) 2.52 (19) 25.4 (31) 2227 a (11) 386.8 (18) 394.9 (44) 13.2 b (36) 9.66 b (43) 1.15 b (35) 1.15 (107) 2.92 (13)
WW/SB/SL - Till 469.3 a (25) 10.5 (34) 2.31 (21) 25.7 (23) 2813 b (12) 450.5 (19) 327.3 (21) 24.9 a (41) 22.7 a (52) 2.12 a (31) 1.11 (78) 2.69 (26)
PCFS WW/SL/SW - NT 203.4 c (22) 6.97 b (6) 3.85 (9) 22.2 (31) 995.4 b (6) 174.9 b (5) 693.4 (19) 12.9 b (51) 24.7 b (51) 0.68 b (26) 0.73 (30) 2.17 bc (23)
WW/SB/SW - NT 322.4 ab (62) 10.6 a (21) 4.83 (55) 20.3 (43) 1378 ab (32) 299.7 ab (53) 575.5 (72) 20.1 ab (51) 72.8 a (60) 0.99 b (33) 0.84 (18) 2.25 abc (12)
Alfalfa/cereal/SL (organic) - NT 393.1 a (17) 8.54 ab (8) 5.37 (55) 20.5 (22) 1812 a (35) 436.9 a (46) 823.5 (91) 26.1 a (24) 16.3 b (27) 1.97 a (57) 1.03 (56) 1.68 c (34)
Perennial Tall Wheat Grass 263.7 bc (45) 7.42 b (6) 5.02 (48) 13.6 (45) 1195 ab (21) 219.8 ab (8) 765.6 (42) 12.0 b (28) 10.1 b (14) 0.77 b (33) 0.68 (31) 2.91 a (21)
Native/CRP Grass 240.4 bc (21) 7.07 b (36) 6.25 (87) 13.5 (66) 1510 ab (35) 332.4 ab (43) 713.6 (75) 10.6 b (37) 5.98 b (58) 0.81 b (33) 0.88 (58) 2.42 ab (30)
Pendleton WW/ NT Fallow - NT 251.1 b (32) 8.04 (9) 3.56 (18) 29.9 b (16) 1569 b (18) 425.6 (17) 1138 a (15) 17.9 b (22) 9.69 (40) 0.99 b (18) 0.70 (32) 2.48 (16)
WW/Pea - NT 447.5 a (8) 7.88 (8) 3.57 (44) 31.1 b (38) 1779 ab (22) 457.7 (18) 1011 b (6) 30.5 a (39) 20.0 (71) 1.84 a (29) 0.78 (19) 2.25 (23)
WW/Fallow - Till 235.2 b (24) 9.12 (13) 3.09 (30) 47.1 a (20) 2076 a (20) 512.3 (17) 643.4 c (9) 19.1 b (22) 9.62 (7) 2.12 a (33) 0.77 (13) 3.07 (36)
Moro WW/WP - NT 500.8 a (3) 9.05 (28) 6.67 (34) 30.5 (40) 1319 a (14) 431.3 (18) 1218 a (6) 32.9 a (24) 17.5 a (7) 1.85 a (1) 1.00 (22) 2.15 (22)
WW/NT Fallow - NT 145.2 c (31) 8.37 (30) 7.55 (26) 26.1 (29) 979.0 b (10) 333.8 (8) 1046 ab (22) 13.6 c (36) 5.48 c (48) 0.96 c (10) 0.98 (28) 2.28 (2)
WW/SB/fallow - NT 146.2 c (42) 10.1 (24) 9.73 (29) 26.1 (32) 1107 ab (24) 393.5 (27) 1071 ab (13) 14.6 bc (17) 5.57 c (50) 1.03 c (18) 0.99 (22) 2.12 (10)
WW/Fallow - Till 264.8 b (21) 8.3 (16) 6.89 (41) 18.4 (43) 1083 ab (14) 357.1 (12) 942.8 b (21) 23.5 ab (34) 9.36 b (13) 1.37 b (33) 0.86 (32) 2.33 (34)
Prosser WW/Sw. Corn/Potato - NT 307.3 (19) 7.40 (13) 1.81 (22) 24.5 (34) 1156 (6) 368.5 (18) 414.7 (26) 23.9 (30) 8.57 (32) 1.84 (22) 1.15 (23) 2.36 (23)
WW/Sw. Corn/Potato - Till 320.6 (43) 7.91 (16) 1.60 (24) 16.0 (21) 1230 (11) 409.3 (4) 314.1 (29) 25.5 (34) 7.69 (49) 1.71 (26) 1.03 (18) 2.20 (18)
___________________________________________________________________________________________µg 10 cm
-2 28 days
-1______________________________________________________________________________________
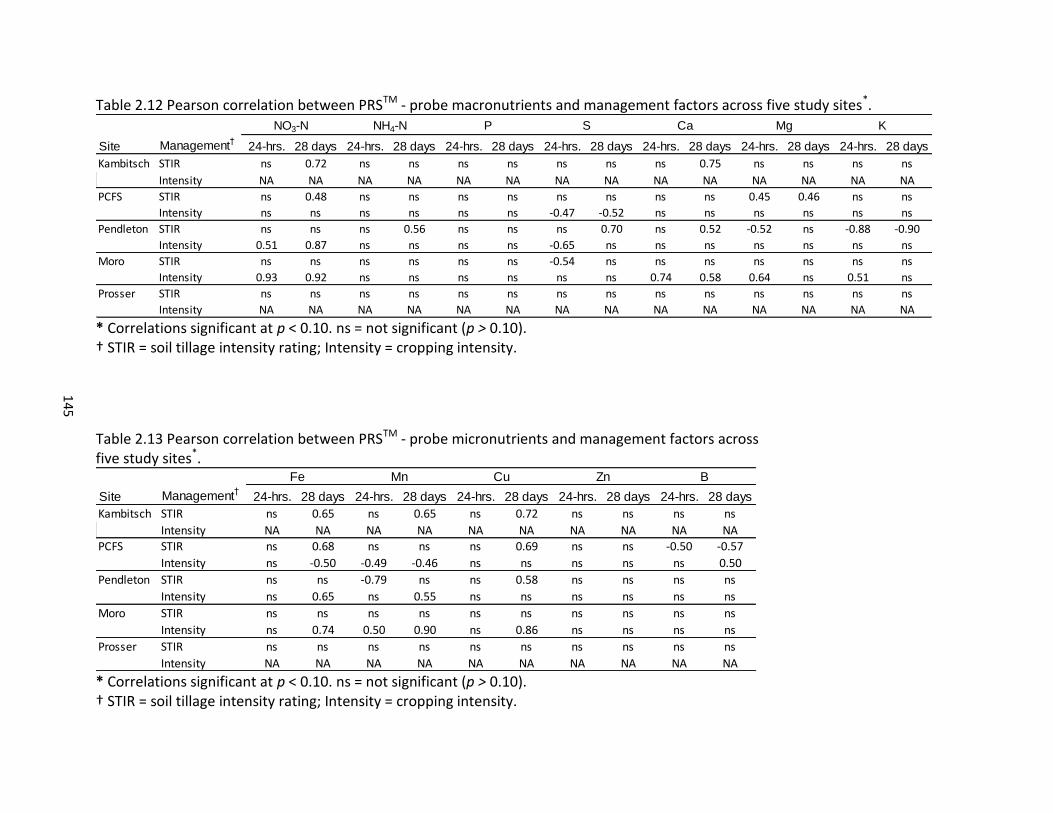
14
5
Table 2.12 Pearson correlation between PRSTM - probe macronutrients and management factors across five study sites*.
* Correlations significant at p < 0.10. ns = not significant (p > 0.10). † STIR = soil tillage intensity rating; Intensity = cropping intensity.
Table 2.13 Pearson correlation between PRSTM - probe micronutrients and management factors across five study sites*.
* Correlations significant at p < 0.10. ns = not significant (p > 0.10). † STIR = soil tillage intensity rating; Intensity = cropping intensity.
Site Management†
24-hrs. 28 days 24-hrs. 28 days 24-hrs. 28 days 24-hrs. 28 days 24-hrs. 28 days 24-hrs. 28 days 24-hrs. 28 days
Kambitsch STIR ns 0.72 ns ns ns ns ns ns ns 0.75 ns ns ns ns
Intensity NA NA NA NA NA NA NA NA NA NA NA NA NA NA
PCFS STIR ns 0.48 ns ns ns ns ns ns ns ns 0.45 0.46 ns ns
Intensity ns ns ns ns ns ns -0.47 -0.52 ns ns ns ns ns ns
Pendleton STIR ns ns ns 0.56 ns ns ns 0.70 ns 0.52 -0.52 ns -0.88 -0.90
Intensity 0.51 0.87 ns ns ns ns -0.65 ns ns ns ns ns ns ns
Moro STIR ns ns ns ns ns ns -0.54 ns ns ns ns ns ns ns
Intensity 0.93 0.92 ns ns ns ns ns ns 0.74 0.58 0.64 ns 0.51 ns
Prosser STIR ns ns ns ns ns ns ns ns ns ns ns ns ns ns
Intensity NA NA NA NA NA NA NA NA NA NA NA NA NA NA
KNO3-N NH4-N P S Ca Mg
Site Management†
24-hrs. 28 days 24-hrs. 28 days 24-hrs. 28 days 24-hrs. 28 days 24-hrs. 28 days
Kambitsch STIR ns 0.65 ns 0.65 ns 0.72 ns ns ns ns
Intensity NA NA NA NA NA NA NA NA NA NAPCFS STIR ns 0.68 ns ns ns 0.69 ns ns -0.50 -0.57
Intensity ns -0.50 -0.49 -0.46 ns ns ns ns ns 0.50
Pendleton STIR ns ns -0.79 ns ns 0.58 ns ns ns ns
Intensity ns 0.65 ns 0.55 ns ns ns ns ns ns
Moro STIR ns ns ns ns ns ns ns ns ns ns
Intensity ns 0.74 0.50 0.90 ns 0.86 ns ns ns ns
Prosser STIR ns ns ns ns ns ns ns ns ns ns
Intensity NA NA NA NA NA NA NA NA NA NA
Fe Mn Cu Zn B
146
Multivariate Analysis for Improved Prediction
Soil properties along with the climate and management factors included in this study
were combined in a multivariate stepwise regression to attempt to improve on single variable
correlations and identify the best set of variables across the inland PNW for predicting PNM,
BDR, PDR, and total N at 28 days adsorbed to a PRSTM probe (Tables 2.14, 2.15 and 2.16). These
models are purely empirical and are not necessarily representative across a broad range of
conditions but attempt to represent the value of multiple variables combined into indices in
predicting these soil processes.
Potential N Mineralization
The model with the highest predictability of PNM, explaining 81% of PNM variation,
included total N, WEOC, and MAT (Table 2.14). The value of a predictable index lies not only in
its predictive capabilities, but also in the accessibility of the parameters. In acknowledgement
of this, a model was run with a reduced soil property data set along with climate and
management factors. The reduced data set included POXC, one-day Cmin, and total N
adsorbed to a PRSTM probe at 24 hours, all soil properties that are easily measured with
commercialized field tests. However, the predictability of this model did not represent a
significant improvement on the use of only climate and management factors (Table 2.14). In
comparison, Schomberg et al. (2009) were able to predict 85% of the variability in a 41-week
PNM incubation with total N and Cmin at 3 days. Schomberg and coworkers (2009) also
reported that PNM from a 7-day anaerobic incubation was significantly correlated with PNM
from the 41-week incubation (r2 = 0.63).
147
Potential and Basal Denitrification
The model which best explained variability in PDR (r2 = 0.64) consisted of soil properties
with MAT, while a reduced dataset of soil properties along with climate and management
factors performed no better than just climate factors (r2 = 0.48) (Table 2.15). MAT was
consistently the best significant variable in explaining variation in BDR, and when MAT was
removed from the model, total inorganic N was the best explanatory variable (Table 2.15). The
greater predictability of PDR over BDR is in keeping with the higher correlation of soil
properties, management variables, and climate factors with PDR compared to BDR.
PRSTM - Probe Total N at 28 Days
A combination of management factors and soil properties, including STIR, cropping
intensity, 24-hour PRSTM total N, and total inorganic N, explained 62% of the observed variation
in 28-day total PRSTM total N (Table 2.16). A model with easily measured soil properties
performed similarly, with 24-hour PRSTM total N, soil pH, STIR, and cropping intensity explaining
60% of the variation in 28-day total PRSTM total N. Considering that several studies have
conveyed that total N adsorbed to PRSTM probes is indicative of plant N uptake (Walley et al.,
2002; Nyiraneza et al., 2009), results from this study indicate that a significant portion of plant
N uptake can be explained by management factors and easily measured soil properties.
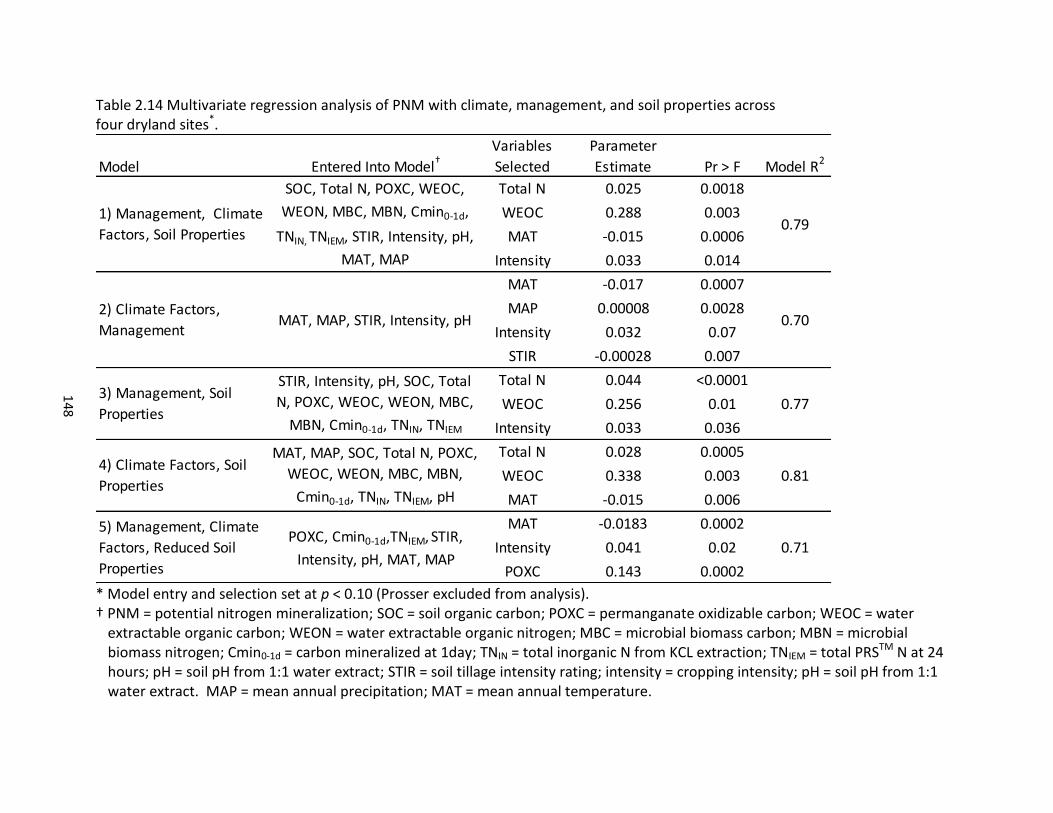
14
8
Table 2.14 Multivariate regression analysis of PNM with climate, management, and soil properties across four dryland sites*.
* Model entry and selection set at p < 0.10 (Prosser excluded from analysis). † PNM = potential nitrogen mineralization; SOC = soil organic carbon; POXC = permanganate oxidizable carbon; WEOC = water
extractable organic carbon; WEON = water extractable organic nitrogen; MBC = microbial biomass carbon; MBN = microbial biomass nitrogen; Cmin0-1d = carbon mineralized at 1day; TNIN = total inorganic N from KCL extraction; TNIEM = total PRSTM N at 24 hours; pH = soil pH from 1:1 water extract; STIR = soil tillage intensity rating; intensity = cropping intensity; pH = soil pH from 1:1 water extract. MAP = mean annual precipitation; MAT = mean annual temperature.
Model Entered Into Model†
Variables
Selected
Parameter
Estimate Pr > F Model R2
Total N 0.025 0.0018
WEOC 0.288 0.003
MAT -0.015 0.0006
Intensity 0.033 0.014
MAT -0.017 0.0007
MAP 0.00008 0.0028
Intensity 0.032 0.07
STIR -0.00028 0.007
Total N 0.044 <0.0001
WEOC 0.256 0.01
Intensity 0.033 0.036
Total N 0.028 0.0005
WEOC 0.338 0.003
MAT -0.015 0.006
MAT -0.0183 0.0002
Intensity 0.041 0.02
POXC 0.143 0.0002
2) Climate Factors,
ManagementMAT, MAP, STIR, Intensity, pH 0.70
4) Climate Factors, Soil
Properties
MAT, MAP, SOC, Total N, POXC,
WEOC, WEON, MBC, MBN,
Cmin0-1d, TNIN, TNIEM, pH
0.81
3) Management, Soil
Properties
STIR, Intensity, pH, SOC, Total
N, POXC, WEOC, WEON, MBC,
MBN, Cmin0-1d, TNIN, TNIEM
0.77
5) Management, Climate
Factors, Reduced Soil
Properties
POXC, Cmin0-1d,TNIEM, STIR,
Intensity, pH, MAT, MAP0.71
SOC, Total N, POXC, WEOC,
WEON, MBC, MBN, Cmin0-1d,
TNIN, TNIEM, STIR, Intensity, pH,
MAT, MAP
0.791) Management, Climate
Factors, Soil Properties
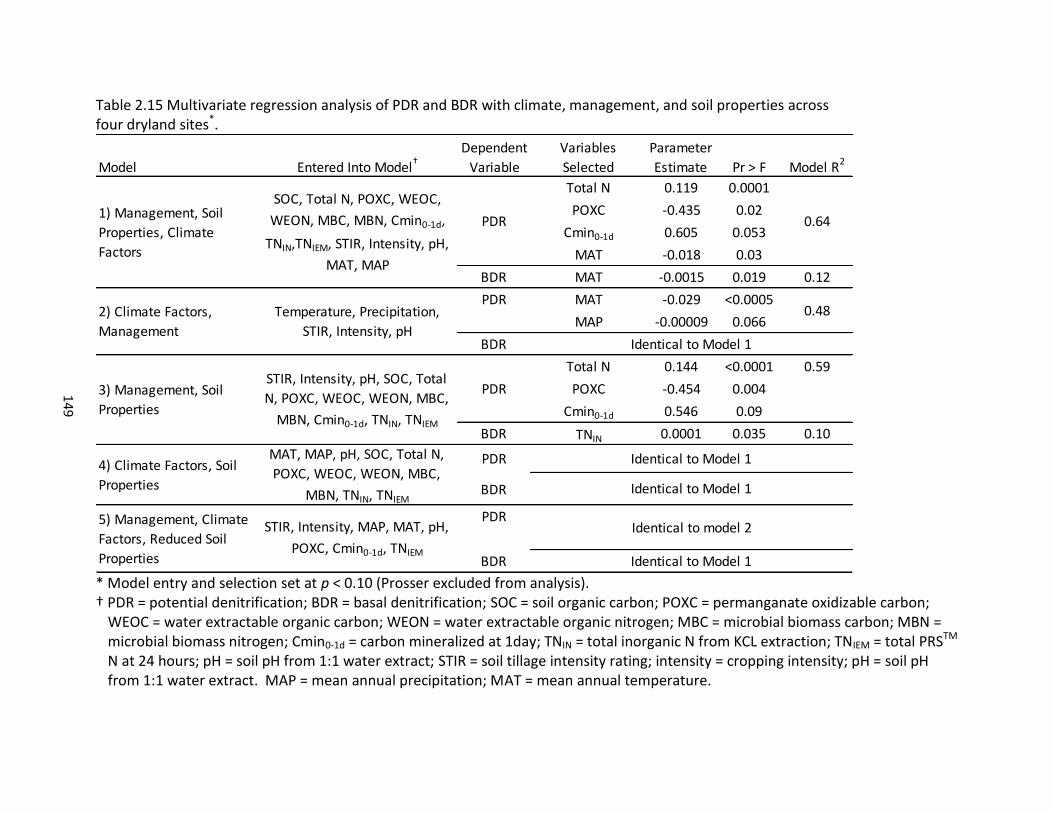
14
9
Table 2.15 Multivariate regression analysis of PDR and BDR with climate, management, and soil properties across four dryland sites*.
* Model entry and selection set at p < 0.10 (Prosser excluded from analysis). † PDR = potential denitrification; BDR = basal denitrification; SOC = soil organic carbon; POXC = permanganate oxidizable carbon;
WEOC = water extractable organic carbon; WEON = water extractable organic nitrogen; MBC = microbial biomass carbon; MBN = microbial biomass nitrogen; Cmin0-1d = carbon mineralized at 1day; TNIN = total inorganic N from KCL extraction; TNIEM = total PRSTM N at 24 hours; pH = soil pH from 1:1 water extract; STIR = soil tillage intensity rating; intensity = cropping intensity; pH = soil pH from 1:1 water extract. MAP = mean annual precipitation; MAT = mean annual temperature.
Model Entered Into Model†
Dependent
Variable
Variables
Selected
Parameter
Estimate Pr > F Model R2
Total N 0.119 0.0001
POXC -0.435 0.02
Cmin0-1d 0.605 0.053
MAT -0.018 0.03
BDR MAT -0.0015 0.019 0.12
PDR MAT -0.029 <0.0005
MAP -0.00009 0.066
BDR
Total N 0.144 <0.0001 0.59
POXC -0.454 0.004
Cmin0-1d 0.546 0.09
BDR TNIN 0.0001 0.035 0.10
PDR
BDR
PDR
BDR
0.64
SOC, Total N, POXC, WEOC,
WEON, MBC, MBN, Cmin0-1d,
TNIN,TNIEM, STIR, Intensity, pH,
MAT, MAP
PDR
STIR, Intensity, MAP, MAT, pH,
POXC, Cmin0-1d, TNIEM
Temperature, Precipitation,
STIR, Intensity, pH
MAT, MAP, pH, SOC, Total N,
POXC, WEOC, WEON, MBC,
MBN, TNIN, TNIEM
STIR, Intensity, pH, SOC, Total
N, POXC, WEOC, WEON, MBC,
MBN, Cmin0-1d, TNIN, TNIEM
Identical to Model 1
0.48
PDR
Identical to model 2
Identical to Model 1
2) Climate Factors,
Management
1) Management, Soil
Properties, Climate
Factors
4) Climate Factors, Soil
Properties
3) Management, Soil
Properties
Identical to Model 1
Identical to Model 1
5) Management, Climate
Factors, Reduced Soil
Properties
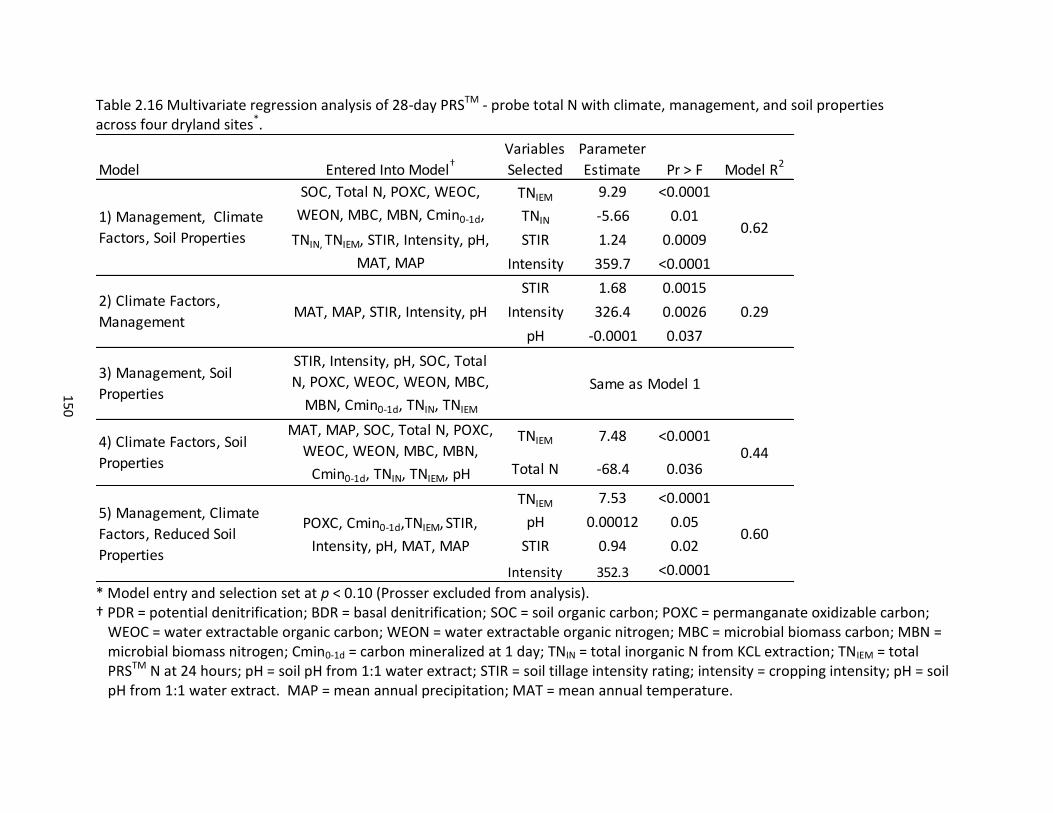
15
0
Table 2.16 Multivariate regression analysis of 28-day PRSTM - probe total N with climate, management, and soil properties across four dryland sites*.
* Model entry and selection set at p < 0.10 (Prosser excluded from analysis). † PDR = potential denitrification; BDR = basal denitrification; SOC = soil organic carbon; POXC = permanganate oxidizable carbon;
WEOC = water extractable organic carbon; WEON = water extractable organic nitrogen; MBC = microbial biomass carbon; MBN = microbial biomass nitrogen; Cmin0-1d = carbon mineralized at 1 day; TNIN = total inorganic N from KCL extraction; TNIEM = total PRSTM N at 24 hours; pH = soil pH from 1:1 water extract; STIR = soil tillage intensity rating; intensity = cropping intensity; pH = soil pH from 1:1 water extract. MAP = mean annual precipitation; MAT = mean annual temperature.
Model Entered Into Model†
Variables
Selected
Parameter
Estimate Pr > F Model R2
TNIEM 9.29 <0.0001
TNIN -5.66 0.01
STIR 1.24 0.0009
Intensity 359.7 <0.0001
STIR 1.68 0.0015
Intensity 326.4 0.0026
pH -0.0001 0.037
TNIEM 7.48 <0.0001
Total N -68.4 0.036
TNIEM 7.53 <0.0001
pH 0.00012 0.05
STIR 0.94 0.02
Intensity 352.3 <0.0001
2) Climate Factors,
ManagementMAT, MAP, STIR, Intensity, pH 0.29
Same as Model 1
4) Climate Factors, Soil
Properties
MAT, MAP, SOC, Total N, POXC,
WEOC, WEON, MBC, MBN,
Cmin0-1d, TNIN, TNIEM, pH
0.44
5) Management, Climate
Factors, Reduced Soil
Properties
POXC, Cmin0-1d,TNIEM, STIR,
Intensity, pH, MAT, MAP0.60
3) Management, Soil
Properties
STIR, Intensity, pH, SOC, Total
N, POXC, WEOC, WEON, MBC,
MBN, Cmin0-1d, TNIN, TNIEM
1) Management, Climate
Factors, Soil Properties
SOC, Total N, POXC, WEOC,
WEON, MBC, MBN, Cmin0-1d,
TNIN, TNIEM, STIR, Intensity, pH,
MAT, MAP
0.62
151
SUMMARY AND CONCLUSIONS
An increase in soil C and N properties is associated with an increase in PNM across the
study area. The soil NHC/NHN ratio was the only soil C/N ratios of the various fractions
measured in the study that was correlated with PNM. Cmin values were significantly correlated
with PNM, and the correlation coefficients observed in this study were less than reported in
some studies, while more in line with others. The anaerobic nature of the PNM incubation and
the various rates of gross immobilization resulting from varying C/N ratios of crop residues
were thought to explain the lower correlations between PNM and Cmin observed in this study.
Across the four dryland sites, MAP is associated with an increase in PNM, while an increase in
MAT is associated with a decrease in PNM. Both tillage and cropping intensification also have
significantly impacted PNM. At Pendleton, the influence of tillage was most notable, where NT
plots had significantly greater PNM than till pots. At Moro, cropping intensity significantly
influenced PNM, where annual cropping with a legume in rotation resulted in greater PNM than
other NT rotations at Moro with a fallow year.
A multivariate analysis of PNM with soil properties, climate variables, and management
factors indicated that easily measured POXC along with cropping intensity and MAT explain 71%
of observed PNM variation. A combination of total N, WEOC, and MAT, however, explained 81%
of the overall variation in PNM across the four dryland sites in the study area and represents an
improvement in single factor prediction of PNM.
An increase in PNM is associated with an increase in PDR (r = 0.69), while PNM and BDR
were not significantly related. BDR had greater CVs than PDR and multiple soil C and N
properties exhibited a higher degree of correlation with PDR than with BDR. Across the four
152
dryland sites, MAT was significantly related to both BDR (r = -0.34) and PDR (r = -0.66), while
only MAP was significantly related to PDR (r = 0.55). BDR did not differ significantly between
treatments, while PDR was significantly greater for crop rotations with a legume comprising at
least half of the rotation. The influence of STIR on PDR was not consistent across sites, and this
was tied to variable soil C and N properties across sites with regard to STIR, particularly WEOC
and MBC.
Considered in combination with the literature, results in the present study support that
an increase in cropping intensity is associated with an increase in denitrification; as indicated in
the literature, however, cropping intensification under NT can also enhance the activity of N2O
reductase by reducing O2 availability and mitigate N2O emissions resulting from denitrification.
Therefore, while increasing cropping intensity increases both PNM and PDR, it also has the
potential to reduce N2O emissions within NT. In a multivariate analysis, the factors which best
explain variation in PDR across the region include total N, POXC, one-day Cmin, and MAT (r2 =
0.64), while a combination of factors did not improve the prediction of BDR beyond only MAT
(r2 = 0.12).
Initial extractable inorganic N was an important source of plant available N, indicated by
its significant correlation with 24-hour (r = 0.83) and 28-day PRSTM-probe NO3- (r = 0.42).
Cropping intensification, however, also had a measurable positive impact on NO3- availability at
both 24 hours and 28 days, and is representative of mineralization of SOM as an important
source of plant available N. Greater NO3- availability was also associated with an increase in
STIR, and this was attributed to either greater denitrification under NT earlier in the season
under wetter conditions, greater plant N uptake under NT earlier in the season under improved
153
moisture conditions associated with NT, or mixing of leached NO3- back into surface soils
associated with tillage. A multivariate analysis of 28-day PRSTM-probe total N revealed a
combination of 24-hour PRSTM-probe total N, initial inorganic N, STIR, and cropping intensity
explained 62% of the variation in 28-day total N across the four dryland sites in the study.
As with NO3-, leaching of S may also have contributed to greater S associated with an
increase in STIR, where CT plots at Pendleton had greater 28-day S availability than NT plots.
There were few observed differences in P availability and P variation was not significantly
correlated with STIR or cropping intensity. Available P, however, and S displayed sensitivity to
multiple soil C and N properties. After 28 days of incubation, P and S had a negative
relationship with several soil C and N properties, indicating that under ideal conditions of
enhanced microbial activity, gross immobilization of these macronutrients increases, and is
possibly related to microbially mediated C/S and C/P ratios. Additionally, increased soil acidity
associated with increased SOM would also limit P and S availability.
POXC was positively associated with Ca (r = 0.32), while multiple soil C and N properties
exhibited a negative relationship with K and Mg. This was attributed to greater Ca activity
inhibiting these other cations. Additionally, Ca and Mg were negatively associated with the
water extractable portions of C and N, and considered indicative of the role of these nutrients
in stabilization of SOM through cation bridging. At Kambitsch and Pendleton, an increase in
STIR was associated with an increase in 28-day Ca availability. This greater Ca availability
associated with CT was attributed to lower soil pH under NT, where increased Ca solubility
under a decrease in pH may have resulted in enhanced Ca leaching, while tillage would result in
mixing Ca back into the surface. Potassium exhibited a negative relationship with STIR and a
154
positive relationship with cropping intensity. An increase in MAP was associated with an
increase in NO3- and Ca, while P and K were negatively associated with MAP. Sulfur, K, and Mg
all increased across the study area as MAT increased.
Aside from Mn, micronutrients were poorly correlated with soil C and N properties and
soil pH. The micronutrients Fe, Cu, and Mn increased with an increase in tillage intensity, as
evidenced by 28-day results from Kambitsch, Pendleton, and Moro. Cropping intensification
under NT, however, contributed to enhanced availability of these nutrients. Micronutrients
displayed less sensitivity to MAP and MAT than macronutrients; however an increase in MAT is
associated with an increase in Cu and Fe. Across the five sites, B and Zn at 24 hours adsorbed
to PRSTM probes was below the detection limit, indicating the plant available levels of these
micronutrients may be deficient within the study area.
155
REFERENCES
Adewale, C.A. 2013. Carbon footprint and nutrient bio-availability assessment of organic systems. MSc Thesis, Soil Science, Washington State University.
Alotaibi, K.D., and J.J. Schoenau. 2013. Greenhouse gas emissions and nutrient supply rates in
soil amended with biofuel production by-products. Biology and Fertility of Soils. 49(2): 129-141.
Arcand, M.M., D.H. Lynch, R.P. Varoney, and P. van Straaten. 2010. Residues from buckwheat
(Fagopyrum esculentum) green manure crop grown with phosphate rock influences bioavailability of soil phosphorus. 90(2): 257-266.
Aulakh, M.S., D.A. Rennie. 1986. Nitrogen transformations with special reference to gaseous N
losses from zero-tilled soils of Saskatchewan, Canada. Soil & Tillage Research. 7(1-2): 157-171.
Ball, B.C., A. Scott, J.P. Parker, and M.A. Arshad. 1999. Field N20, CO2, and CH4 fluxes in relation
to tillage, compaction and soil quality in Scotland. Soil & Tillage Research. 53(1): 29-39. Beauchamp, E.G., D.W. Bergstrom, and D.L. Burton. 1996. Denitrification and nitrous oxide
production in soil fallowed or under alfalfa or grass. Communications in Soil Science and Plant Analysis. 27(1-2): 87-99.
Bengtsson, G., P. Bengston, and K.F. Mansson. 2003. Gross nitrogen mineralization-,
immobilization-, and nitrification rates as a function of soil C/N ratio and microbial activity. Soil Biology & Biochemistry. 35(1): 143-154.
Berg, A.S., and B.C. Joern. 2006. Sorption dynamics of organic and inorganic phosphorus
compounds in soil. Journal of Environmental Quality. 35(5): 1855-1862. Blair, G. J., R.D.B. Lefroy, and L. Lisle. 1995. Soil carbon fractions based on their degree of
oxidation, and the development of a carbon management index for agricultural systems. Australian Journal of Agricultural Research. 46(7): 1459-1466.
Booth, M.S., J.M. Stark, and E. Rastetter. 2005. Controls on nitrogen cycling in terrestrial
ecosystems: A synthetic analysis of literature data. Ecological Monographs. 75(2); 139-157.
Brady N.C., and R.R. Weil. 2010. The Nature and Properties of Soils, 13th ed. Prentice-Hall,
Upper Saddle River, NJ.
156
Brown, T.T., and D.R. Huggins. 2012. Soil carbon sequestration in the dryland cropping region of the Pacific Northwest. Journal of Soil and Water Conservation. 67(5): 406-415.
Burton, D.L., X. Li, and C.A. Grant. 2007. Influence of fertilizer nitrogen source and management
practice on N2O emissions from two black chernozemic soils. Canadian Journal of Soil Science. 88(2): 219-227.
Cabrera, M.L., D.E. Kissel, and M.F. Vigil. 1994. Potential nitrogen mineralization: Laboratory
and field evaluation. In Soil Testing: Prospects for Improving Nutrient
Recommendations. Edited by J.L. Havlin and J.S. Jacobsen. SSSA Publication Number 40,
Madison, WI. pp 15-30.
Chapman, L.Y., S. G. McNulty, G. Sun., and Y. Zhang. 2013. Net nitrogen mineralization in natural ecosystems across the conterminous US. International Journal of Geosciences. 4(9): 1300-1312.
Chen, H., X. Li, F. Hu, and W. Shi. 2013. Soil nitrous oxide emissions following crop residue
addition: a meta-analysis. Global Change Biology. 19(10): 2956-2964. Christensen, S., and B.T. Christensen. 1991. Organic matter available for denitrification in
different soil size fractions: Effects of freeze/cycles and straw disposal. Journal of Soil Science. 42(4): 637-647.
Cofie, O.O., and J. Pleysier. 2004. Ion exchange involving potassium-calcium and magnesium-
calcium in soil and organic matter fractions. Communications in Soil Science and Plant Analysis. 35(17-18): 2417-2431.
Cole, C.V., E.T. Elliot, H.W. Hunt, and D.C. Coleman. 1978. Trophic interactions in soils as they
affect energy and nutrient dynamics. V. phosphorus transformations. Microbial Ecology. 4(4): 381-387.
Colman, B.P., and J.P. Schimel. 2013. Drivers of microbial respiration and net N mineralization
at the continental scale. Soil Biology & Biogeochemistry. 60(1): 65-76. Curtin, D., and C.A. Campbell. 2008. Mineralizable Nitrogen. Chapter 46 In: Soil Sampling and
Methods of Analysis. M.R. Carter and E.G. Gregorich (eds.). Canadian Society of Soil Science. CRC Press, Boca Raton FL.
Curtin, D., and F.M. McCallum. 2004. Biological and chemical assays to estimate nitrogen
supplying power of soils with contrasting management histories. Australian Journal of
Soil Research. 42(7): 737-746.
157
D’Haene, K., E. Moreels, S.D. Neve, B.C. Daguilar, P. Boeckx, G. Hofman, and O.V. Cleemput. 2003. Soil properties influencing the denitrification potential of Flemish agricultural soils. Biology and Fertility of Soils. 38(6): 358-366.
Deen, W., and P.K. Kataki. 2003. Carbon sequestration in a long-term conventional versus
conservation tillage experiment. Soil & Tillage Research. 74(2): 143-150. Doran J.W. and T.B. Parkin. 1994. Defining and assessing soil quality. In Defining Soil Quality for
a Sustainable Environment. Edited by J.W. Doran, J.A.E. Molina, and R.F. Harris. SSSA Publication Number 35, Madison, WI. pp 3-21.
Drury, C.F., D.D. Myrold, E.G. Beauchamp, and W.D. Reynolds. 2008a. Denitrification
Techniques for Soils. Chapter 37 In: Soil Sampling and Methods of Analysis. M.R. Carter and E.G. Gregorich (eds.). Canadian Society of Soil Science. CRC Press, Boca Raton FL.
Drury, C.F., D.J. McKenney, and W.I. Findlay. 1991. Relationship between denitrification,
microbial biomass, and indigenous soil properties. Soil Biology & Biochemistry. 23(8): 751-755.
Drury, C.F., T.O. Oloya, D.J. McKenney, E.G. Gregorich, C.S. Tan, and C.L. vanLuyk. 1998. Long-
term effects of fertilization and rotation on denitrification and soil carbon. Soil Science Society of America Journal. 62(6): 1572-1579.
Drury, C.F., X.M. Yang, W.D. Reynolds, and N.B. McLaughlin. 2008b. Nitrous oxide and carbon
dioxide emissions from monoculture and rotational cropping of corn, soybean, and winter wheat. Canadian Journal of Soil Science. 88(2): 163-174.
Dusenbury, M.P., R.E. Engel, P.R. Miller, R.L. Lemke, and R. Wallander. 2008. Nitrous oxide
emissions from a northern Great Plains soils as influenced by nitrogen management and cropping systems. Journal of Environmental Quality. 37(2): 542-550.
Eckert, D.J. 1991. Chemical attributes of soils subjected to no-till cropping with rye cover crops.
Soil Science Society of America Journal. 55(2): 405-409. Franzluebbers, A.J. 2002. Soil organic matter stratification ratio as an indicator of soil quality.
Soil & Tillage Research. 66(1): 95-106. Franzluebbers, A.J., F.M. Hons, and D.A. Zuberer. 1994. Long-term changes in soil carbon and
nitrogen pools in wheat management systems. Soil Science Society of America Journal.
58(6): 1639-1645.
Franzluebbers, A.J., and F.M. Hons. 1996. Soil-profile distribution of primary and secondary plant-available nutrients under conventional and no tillage. 39(3-4) 229-239.
158
Franzluebbers, A.J., H.H. Schomberg, and D.M. Endale. 2007. Surface-soil responses to paraplowing of long-term no-tillage cropland in the Southern Piedmont USA. Soil & Tillage Research. 96(1): 303-315.
Franzluebbers, A.J., R.L. Haney, F.M. Hons, and D.A. Zuberer. 1996. Determination of microbial
biomass and nitrogen mineralization following rewetting of a dried soil. Soil Science Society of America Journal. 60(4): 1133-1139.
Grant, C.A., A.M. Johnston, and G.W. Clayton. 2003. Sulphur fertilizer and tillage effects on
early season sulphur availability and N:S ratio in canola in western Canada. Canadian
Journal of Soil Science. 83(4): 451-463.
Guo, X., C.F. Drury, X. Yang, WD. Reynolds, and R. Zhang. 2011. Influence of current and previous crops on soil basal and potential denitrification rates. Biology and Fertility of Soils. 47(8): 937-942.
Haney, R. L., W.H. Brinton, and E. Evans. 2008. Estimating soil carbon, nitrogen, and phosphorus
mineralization from short-term carbon dioxide respiration. Communications in Soil Science and Plant Analysis. 39(17-18): 2706-2720.
Hangs, R.D., J.J. Schoenau, and G. P. Lafond. 2013. The effect of nitrogen fertilization and no-till
duration on soil nitrogen supply power and post-spring thaw greenhouse-gas emissions. Journal of Plant Nutrition and Soil Science. 176(2): 227-237.
Havlin, J. L., J.D. Beaton, S.L. Tisdale, and W.L. Nelson. 1999. Soil fertility and fertilizers: An
introduction to nutrient management.6th ed. Prentice Hall, Upper Saddle River, NJ. Haynes, R.J. 2005. Labile organic matter fractions as central components of the quality of
agricultural soils: An overview. Advances in Agronomy. 85(1): 221-268. Herrmann, A.M., and E. Witter. 2008. PRedicotrs of gross N mineralization and immobilization
during decomposition of stabilized organic matter in agricultural soil. 2008. European Journal of Soil Science. 59(4): 653-664.
Huggins, D.R., R. Rupp, P. Gessler, W. Pan, D. Brown, S. Machado, J. Abatzoglou, V. Walden and S.
Eigenbrode. 2011. Dynamic agroecological zones for the inland pacific northwest, USA. American Geophysical Union, Fall Meeting 2011.
IPCC (2007) Climate Change 2007: the physical science basis. Contribution of working group 1.
In: Solomon S et al (eds) Fourth assessment report of the intergovernmental panel on
climate change. Cambridge University Press, New York. pp1-18.
159
Johnson-Maynard, J. L., K. J. Umiker, K. J, and S.O. Guy. 2007. Earthworm dynamics and soil physical properties in the first three years of no-till management. Soil & Tillage Research. 94(2): 338-345.
Jowkin, V., and J.J. Schoenau. 1998. Impact of tillage and landscape position on nitrogen
availability and yiled of spring wheat in the brown soil zone of southwestern Saskatchewan. Canadian Journal of Soil Science. 78(3): 563-572.
Keeney, D.R., and J.M. Bremner. 1966. Comparison and evaluation of laboratory methods of
obtaining and index of soil nitrogen availability. Agronomy Journal. 58(1): 498-503.
Kroeze, C. 1999. Closing the global N2O budget: A retrospective analysis 1500-1994. Global
Biogeochemical Cycles. 13(1): 1-8.
Liebig, M.A., D.L. Tanaka, and B.J. Wienhold. 2004. Tillage and cropping effects on soil quality indicators in the northern Great Plains. Soil & Tillage Research. 78(1): 131-141.
Liu, X.J., A.R. Mosier, A.D. Halvorson, C.A. Reule, F.S. Zhang. 2007. Dinitrogen and N2O
emissions in arable soils: Effect of tillage, N source and soil moisture. Soil Biology & Biochemistry. 39(9): 2362-2370.
Li, X., F. Hu, and W. Shi. 2013. Plant material addition affects soil nitrous oxide production
differently between aerobic and oxygen-limited conditions. Applied Soil Ecology. 64(1): 91-98.
Luo, J., R.E. White, P.R. Ball, and R.W. Tillman. 1996. Measuring denitrification activity in soils
under pasture: Optimizing conditions for the short-term denitrification enzyme assay and effects of soil storage on denitrification activity. Soil Biology & Biochemistry. 28(3): 409-417.
Luxhoi, J., S. Bruun, B. Stenberg, T.A. Breland, and L.S. Jensen. 2006. Prediction of gross and net
nitrogen mineralization-immobilization turnover from respiration. Soil Science Society of America Journal. 70(4): 1121-1128.
McLaren, J.R., and R. Turkington. 2010. Ecosystem properties determined by plant functional
group identity. Journal of Ecology. 98(2): 459-469. McLauchlan, K.K., and S.E. Hobbie. 2004. Comparison of labile soil organic matter fractionation
techniques. Soil Science Society of America Journal. 68(1): 1616-1625. Meeteren, M.J.M. van., A. Tietema, and J.W. Westerveld. 2007. Regulation of microbial carbon,
nitrogen, and phosphorus transformations by temperature and moisture during decomposition of Calluna vulgaris litter. Biology and Fertility of Soils. 44(1): 103-112.
160
Mosier, A.R., A.D. Halvorson, C.A. Reule, and X.J. Liu. 2006. Net global warming potential and greenhouse gas intensity in irrigated cropping systems in Northeastern Colorado. Journal of Environmental Quality. 35(4): 1584-1598.
Mummey, D.L., J.L. Smith, and G. Bluhm. 1998. Assessment of alternative soil management
practices on N2O emissions from US agriculture. Agriculture Ecosystems & Environment. 70(1): 79-87.
Niboyet, A., X. Le Roux, P. Dijkstra, B.A. Hungate, L. Barthes, J.C. Blankinship, J.R. Brown, C.B.
Field, and P.W. Leadly. 2011. Testing interactive effects of global environmental changes on soil nitrogen cycling. Ecosphere. 2(5): 1-24.
Noorbakhsh, S., J. Schoenau, B. Si, T. Zeleke, and P. Qian. 2008. Soil properties, yield, and
landscape relationships in south-central Saskatchewan Canada. Journal of Plant Nutrition. 31(3): 539-556.
Niknahad-Gharmakher, H., S. Piutti, J.M. Machet, E. Benizri, and S. Recous. 2012.
Mineralization-immobilization of sulphur in a soil during decomposition of plant residues of varied chemical composition and S content. Plant and Soil. 360(1-2): 391-404.
Nyiraneza, J., A. N’Dayegamiye, M.H. Chantigny, and M.R. Laverdiere. 2009. Variation in corn
yied and nitrogen uptake in relation to soil attributes and nitrogen availability indices. Soil Science Society of America Journal. 73(1): 317-327.
Pampolino, M.F., and R. Hatano. 2000. Comparison between conventional soil tests and the use
of resin capsules for measuring P, K, and N in two soils under two moisture conditions. Soil Science and Plant Nutrition. 46(2): 461-471.
Paul, E.A., R.F. Follett, S.W. Leavitt, A. Halvorson, G.A. Peterson, and D.J. Lyon. 1997.
Radiocarbon dating for determination of soil organic matter pool sizes and dynamics. Soil Science Society of America Journal. 61(1): 1058-1067.
Paul, E. A., S.J. Morris, R.T. Conant, and A.F. Plante. 2006. Does the acid hydrolysis-incubation
method measure meaningful soil organic matter pools?. Soil Science Society of America Journal. 70(3): 1023-1035.
Pittlekow, C.M., M.A. Adviento-Borbe, J.E. Hill, J. Six, C. van Kessel, and B.A. Linquist. 2013.
Yield-scaled global warming potential of annual nitrous oxide and methane emissions from continuously flooded rice in response to nitrogen input. Agriculture, Ecosystems & Environment. 177(1): 10-20.
Poirier, N., S. Derenne, J. Balesdent, C. Chenu, G. Bardoux, A. Mariotti, and C. Largeau.
Dynamics and origin of the non-hydrolyzable organic fraction in a forest and a cultivated
161
temperate soil, as determined by isotopic and microscopic studies. European Journal of Soil Science. 57(5): 719-730.
Qian, P., and J.J. Schoenau. 1995. Assessing nitrogen mineralization from organic matter using
anion exchange membranes. Fertilizer Research. 40(2): 143-148. Qian, P., and J.J. Schoenau. 2001. Practical applications of ion exchange resins in agricultural
and environmental soil research. Canadian Journal of Soil Science. 82(1): 9-21. Qian, P., and J.J. Schoenau. 2005. Use of ion-exchange membrane to assess nitrogen-supply
power of soils. Journal of Plant Nutrition. 28(12): 2193-2200. Rengel, Z., G.D. Batten, and D.E. Crowley. 1999. Agronomic approaches for improving the
micronutrient density in edible portions of field crops. Field Crop Research. 60(1-2): 27-40.
Robbins, S.G., and R.D. Voss. 1991. Phosphorus and potassium stratification in conservation
tillage systems. Journal of Soil and Water Conservation. 46(4): 298-300. Roychand, P., and P. Marschner. 2014. Respiration and sorption of water-extractable organic
carbon as affected by addition of Ca2+, isolated clay or clay-rich subsoil to sand. Pedosphere. 24(1): 98-106.
Schlenker, F.S. 1942. Availability of absorbed ions to plant growing in quartz and substrate. Soil
Science. 54(1): 247-251. Schomberg, H.H., and O.R. Jones. 1999. Carbon and nitrogen conservation in dryland tillage and
cropping systems. Soil Science Society of America Journal. 63(1): 1359-1366. Schomberg, H.H., S. Wietholter, T.S. Griffin, D.W. Reeves, M.L. Cabrera, D.S. Fisher, D.M.
Endale, J.M. Novak, K.S. Balkcom, R.L. Raper, N.R. Kitchen, M.A. Locke, K.N. Potter, R.C.
Schwartz, C.C. Truman, and D.D. Tyler. 2009. Assessing indices for predicting potential
nitrogen mineralization in soils under different management systems. Soil Science
Society of America Journal. 73(5): 1575-1586.
Sharpley, A.N., J.T. Sims, and G.M. Pierzynski. 1994. Innovative soil phosphorus availability Indices: Assessing inorganic phosphorus. In Soil Testing: Prospects for Improving Nutrient Recommendations. Edited by J.L. Havlin and J.S. Jacobsen. SSSA Publication Number 40, Madison, WI. pp 115-142.
Six, J.W., S.M. Ogle, F.J. Breidt, R.T. Conant, A.R. Mosier, and K. Paustian. 2004. The potential to
mitigate global warming with no-tillage management is only realized when practiced in the long term. Global Change Biology. 10(2): 155-160.
162
Six. J., R.T. Conant, E.A. Paul, and K. Paustian. 2002. Stabilization mechanisms of soil organic
matter: Implications for C-saturation of soils. Plant and Soil. 241(1): 155-176. Soon, Y.K., A. Haq, and M.A. Arshad. 2007. Sensitivity of nitrogen mineralization indicators to
crop and soil management. Communications in Soil Science. 38(15-16): 2029-2043. Staley, T.E., W.H. Caskey, and D.G. Boyer. 1990. Soil denitrification and nitrification potentials
during the growing season relative to tillage. Soil Microbiology & Biochemistry. 54(6): 1602-1608.
Sylvia, D.M., J.J. Fuhrmann, P.G. Hartzel, and D.A. Zuberer. 2005. Principles and applications of
soil microbiology, 2nd ed. Prentice-Hall, Upper Saddle River, NJ. Tabatabai, M.A., and W.A. Dick. 1979. Distribution and stability of pyrophosphatase in soils. Soil
Biology & Biochemistry. 11(6): 655-659. Tabatabai, M.A., and J.M. Bremner. 1970. Use of the Leco automatic 70-second carbon analyzer
for total carbon analysis of soils. Soil Science Society of America Proceedings. 34(1): 608-610.
Tagwira, F., M. Piha, and L. Mugwira. 1992. Effect of pH, and phosphorus and organic matter
content on zinc availability and distribution in two Zimbabwean soils. Communication in Soil Science and Plant Analysis. 23(13-14): 1485-1500.
Thicke, F.E. 1993. Soil nitrogen mineralization indexes and corn response in crop rotations. Soil
Science. 156(5): 322-335.
Thiessen, S., G. Gleixner, T. Wutzler, and M. Reichstein. 2013. Both priming and temperature sensitivity of soil organic matter decomposition depend on microbial biomass – An incubation study. Soil Biology & Biochemistry. 57(1): 739-748.
Tiemann, L.K., and S.A. Billings. 2008. Carbon controls on nitrous oxide production with changes
in substrate availability in North American grasslands. Soil Science. 173(5): 332-341.
Unger, P.W. 1991. Organic matter, nutrient, and pH distribution in no- and conventional tillage semiarid soils. Agronomy Journal. 83(1): 186-189.
USDA-NRCS. 2006. The soil tillage intensity rating (STIR). TN Agronomy No. 50. Boise Idaho. USDA-NRCS. 2011. Natural Resources Conservation Service Conservation Practice Standard:
Residue and tillage management no till/strip till/direct seed. Code 329.
163
Veihmeyer, F.J., and A.H. Hendrickson. 1948. Soil density and root penetration. Soil Science. 65(1): 487-493.
Voroney, R.P., P.C. Brookes, and R.P. Beyaert. 2008. Soil microbial biomass C, N, P, and S.
Chapter 49 In: Soil Sampling and Methods of Analysis. M.R. Carter and E.G. Gregorich (eds.). Canadian Society of Soil Science. CRC Press, Boca Raton FL.
Walley, F., T. Yates, J. van Groenigen, and C. van Kessel. 2002. Relationsips between soil
nitrogen availability indices, yield, and nitrogen accumulation of wheat. Soil Science Society of America Journal. 66(5): 1549-1561.
Wang, J.B., Z.H. Chen, L.J. Chen, A.N. Zhu, and Z.J. Wu. 2011. Surface soil phosphorus and
phosphatase activities affected by tillage and crop residue input amounts. Plant, Soil and Environment. 57(6): 251-257.
Wei, K., Z.H. Chen, X.P. Zhang, W.J. Liang, and L.J. Chen. 2014. Tillage effects on phosphorus
composition and phosphatase activities in soil aggregates. Geoderma. 217/218: 37-44. Wei, X., M. Hao, M. Shao, and W.J. Gale. 2006. Changes in soil properties and the availability of
soil micronutrients after 18 years of cropping and fertilization. Soil & Tillage Research. 91(1-2): 120-130.
Weil, R.R., K.R. Islam, M.A. Stine, J.B. Gruver, and S.E. Samson-Liebig. 2003. Estimating active carbon for soil quality assessment: A simplified method for laboratory and field use. American Journal of Alternative Agriculture. 18(1): 3-17.
Weil, R.R., and F. Magdoff. 2004. Significance of soil organic matter to soil quality and health. In
Soil Organic Matter in Sustainable Agriculture. Edited by F. Magdoff, and R. W. Ray. CRC Press Inc. Boca Raton, pp 45-65.
West, T.O., and W.M. Post. 2002. Soil organic carbon sequestration rates by tillage and crop
rotation: A global data analysis. Soil Science Society of America Journal. 66(1): 1930-1946.
Whittinghill, K.A., and S.E. Hobbie. 2012. Effects of pH and calcium on soil organic matter
dynamics in Alaskan tundra. Biogeochemistry. 111(1-3): 569-581. Wood, C.W., and I.H. Edwards. 1992. Agroecosystem management effects on soil carbon and
nitrogen. Agriculture, Ecosystems and Environment. 39(3-4): 123-138. Wood, C.W., D.G. Westfall, G.A. Peterson, and I.C. Burke. 1990. Impacts of cropping intensity on
carbon and nitrogen mineralization under no-till dryland agroecosystems. Agronomy Journal. 82(6): 1115-1120.

164
Woods, L.E., and G.E. Schuman. 1988. Cultivation and slope position effects on soil organic matter. Soil Science Society of America Journal. 52(5): 1371-1376.
165
CHAPTER 4
SUMMARY AND CONCLUSIONS
Surface soils comprise a critical interface and have great potential to influence soil
health through their influence on multiple soil processes and potential to mitigate soil erosion
through proper management. The SOM status of these surface soils is of critical importance as
SOM provides the energy source for microbes that in-turn drive soil processes such as nutrient
mineralization and denitrification. SOM, however, is heterogeneous in nature and comprised of
a continuum of C and N pools that necessitate multiple methodologies to capture and define
various fractions of SOM which in-turn aid in a meaningful assessment of soil health.
In this study, the soil C and N properties of surface soils (0-10 cm) measured included
SOC, total N, POXC, WEOC and WEON, and MBC and MBN, and provided the opportunity to
assess the status of soil health within the inland PNW. Additionally, these soil C and N
properties along with four soil processes - 1) C mineralization, 2) potential N mineralization, 3)
potential and basal denitrification, and 4) nutrient supply rate – provided several important
insights regarding soil health and the role of climate variables and management factors in
influencing soil health.
Climate is the main driver of soil C and N properties within the inland PNW. An increase
in MAP was associated with an increase in SOC and total N, while an increase in MAT was
associated with a decrease in total N. Additionally, MAP explained 57% of SOC variability and
69% of total N variability across the four dryland sites comprising the study. When MAP was
excluded from the analysis, MAT became the significant variable and explained 42% and 49%,
166
respectively, of SOC and total N variability. This result indicates that both MAP and MAT are
critical variables driving soil C and N dynamics in the inland PNW. Furthermore, an assessment
of the sensitivity of the hydrolyzable and non-hydrolyzable fractions of SOC indicated that both
were equally sensitive to climate, revealing that pools with a longer turnover were as equally
sensitive to a changing climate as pools with a shorter turnover time.
The influence of climate on N mineralization indices and denitrification was also evident.
An increase in MAP is associated with an increase in PNM and 24-hour PRSTM-probe NO3-, while
an increase in MAT is associated with a decrease in both PNM and 24-hour PRSTM-probe NO3-.
The influence of MAP and MAT on denitrification was similar to the effect of these climate
variables on N mineralization indices; an increase in MAP was associated with an increase in
PDR, while an increase in MAT was associated with a decrease in both PDR and BDR. Moreover,
these soil processes exhibited significant relationships with multiple soil C and N properties.
This observation, along with the relationship between these soil processes and MAT and MAP
suggests that N mineralization and denitrification may also be sensitive to a changing climate.
While MAP and MAT represent critical drivers of soil health within the inland PNW, the
importance of tillage and cropping intensity to soil health were also evident in this study. POXC
showed sensitivity to tillage and cropping intensity, and was also considered representative of
stabilized SOM, a conclusion supported by its significant correlation with the hydrolyzable and
non-hydrolyzable fractions of SOC and total N. Conversely, Cmin provided unique information
about soil health not captured by POXC, particularly microbial activity, decomposition, and
nutrient cycling.
167
An analysis of the influence of tillage and cropping intensity on POXC and Cmin, along
with a comparative analysis of average values found in this study to reported values in the
literature revealed important information regarding the influence of management on soil
health within the region. The range of values reported in the literature for POXC indicates that
soils within the inland PNW are below average in stabilized SOM. Results from other studies
coupled with present findings suggest that cropping diversification along with NT is essential to
building POXC. Cmin values, conversely, were within the range of values reported in the
literature but nonetheless showed sensitivity to both tillage and cropping intensity. Likewise,
results from the present study along with literature findings suggest that cropping
intensification/diversification along with NT is also critical to enhancing Cmin.
Along with POXC and Cmin, the influence of management on N mineralization and
denitrification was also evident. Both tillage and cropping intensification have significantly
impacted PNM. At Pendleton, the influence of tillage was most notable, where NT plots had
significantly greater PNM than CT pots. At Moro, cropping intensity has significantly influenced
PNM, where annual cropping with a legume in rotation has resulted in significantly greater
PNM than other NT rotations at Moro with a fallow year. Contrary to PNM, greater PRSTM -
probe NO3- availability was associated with an increase in tillage; this was attributed to either
greater denitrification under NT earlier in the season under wetter conditions, greater plant N
uptake under NT earlier in the season under improved moisture conditions associated with NT,
or tillage resulting in mixing of leached NO3- back into surface soils.
BDR did not differ significantly between treatments while PDR was significantly greater
for crop rotations with a legume comprising at least half of the rotation. The influence of tillage
168
on PDR was not consistent across sites, and this was tied to variable soil C and N properties
across sites with regard to tillage, particularly WEOC and MBC. While results suggest that
increased cropping intensity is associated with an increase in PDR, this does not necessarily
translate to an increase in N2O emissions, as recent findings in the literature suggest cropping
intensification under NT can enhance the activity of N2O reductase by reducing O2 availability
and mitigate N2O emissions resulting from denitrification. Therefore, while increasing cropping
intensity may increase the potential for denitrification, it also has the potential to reduce N2O
emissions within NT.
Multivariate analyses were performed in an attempt to improve on the ability of single
variable climate and management factors and soil C and N properties in explaining the
observed variation in N mineralization and denitrification. A multivariate analysis of PNM with
soil properties, climate and management factors indicated that easily measured POXC along
with cropping intensity and MAT explain 71% of observed PNM variation across the four
dryland sites in the study. A combination of total N, WEOC, and MAT, however, explain 81% of
overall variation in PNM across the four dryland and represents an improvement in single factor
prediction of PNM. Similarly, a combination of 24-hour PRSTM total N, initial inorganic N, STIR
and cropping intensity explained 62% of the observed variation in 28-day PRSTM total N. And
last, a multivariate analysis of denitrification revealed the factors which best explain variation in
PDR across the region include total N, POXC, one-day Cmin, and MAT (r2 = 0.64), while a
combination of factors did not improve the prediction of BDR beyond only MAT (r2 = 0.12).
Multiple studies have found that NO3- adsorbed to PRSTM probes is related to plant N
uptake. Regarding PNM, however, results within the literature vary regarding the relationship
169
of PNM to plant N uptake. In the present study, PNM was significantly correlated with 24-hour
PRSTM-probe NO3- but was not correlated with 28-day cumulative PRSTM-probe NO3
- . The fact
that PNM from a longer incubation is not correlated with NO3- from an equally long PRSTM-
probe incubation suggests that PNM as measured in this study (28-day anaerobic incubation) is
not related to plant N uptake. To be sure, however, PNM remains an important indicator of soil
health as it represents the ability of microbes to decompose SOM and supply plant available
nutrients.
Several PRSTM nutrients also exhibited notable relationships with soil C and N properties
and management variables. After 28 days of incubation, P and S had a negative relationship
with several soil C and N properties, indicating that under ideal conditions of enhanced
microbial activity, gross immobilization of these macronutrients increases, and is possibly
related to microbially mediated C/S and C/P ratios. The ability of Ca activity to inhibit the
activity of other cations was a possible explanation for the negative correlation of K and Mg
with multiple soil C and N properties. Additionally, cation bridging and subsequent
stabilization of SOM was attributed to the negative relationship between Ca and Mg and the
water extractable portions of C and N. Aside from Mn, micronutrients were poorly correlated
with soil C and N properties as well as with soil pH.
Leaching of S may have contributed to greater S associated with an increase in tillage
intensity, where CT plots at Pendleton had greater 28-day S availability than NT plots. There
were few observed differences in P availability and P variation was not significantly correlated
with tillage or cropping intensity. At Kambitsch and Pendleton, an increase in tillage was
associated with an increase in 28-day Ca availability. This greater Ca availability associated with
170
CT was attributed to lower soil pH under NT, where increased Ca solubility under a decrease in
pH may have resulted in enhanced Ca leaching, while tillage would result in mixing Ca back into
the surface. Potassium exhibited a negative relationship with tillage intensity and a positive
relationship with cropping intensity. The micronutrients Fe, Cu, and Mn increased with an
increase in tillage intensity, as evidenced by 28-day results from Kambitsch, Pendleton, and
Moro. Cropping intensification under NT, however, contributed to enhanced availability of
these nutrients. Across the five sites, 24-hour B and Zn adsorbed to PRSTM probes was below
the detection limit, indicating the plant available levels of these micronutrients may be
deficient within the study area.
Last, evaluation of a soil health index which utilizes one-day Cmin, WEOC, and WEON
revealed sensitivity of this index to both climate and management. Index’ values for soils in the
inland PNW range from 3.6 to 8.8, whereas 0 to 50 is the reported range of potential values; a
range of 0-14, however, is more realistic for soils within the inland PNW.
The inland PNW is an important and unique ecoregions within the United States; it is a
region dominated by WW-based agriculture, which not only forms the basis of the agrarian
culture but also provides an important source of export grain for the commodity market and is
subsequently a vital component of the region’s economy. This study reveals that the region’s
soils are subject to the influence of climate but that conscientious management practices are
integral to maintaining and improving soil health. Continued adoption of NT, along with crop
diversification and intensification are necessary steps on the road to improved soil health and
bolstering the region’s important role in US agriculture.
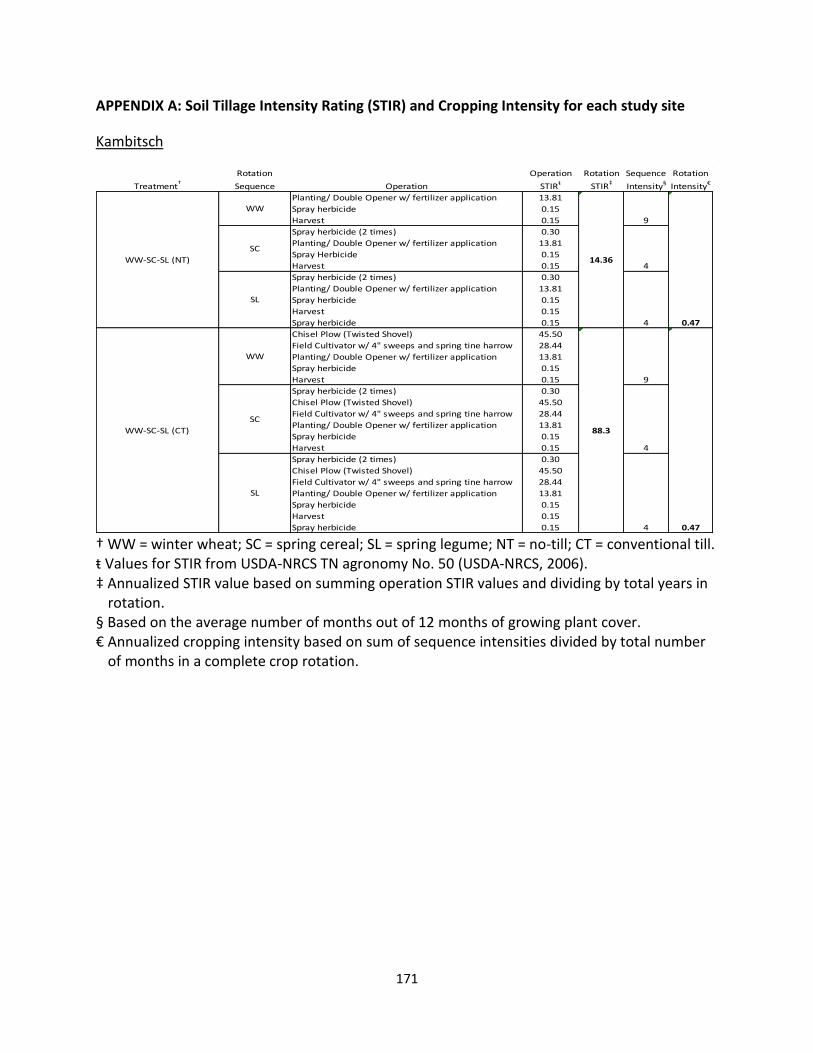
171
APPENDIX A: Soil Tillage Intensity Rating (STIR) and Cropping Intensity for each study site
Kambitsch
† WW = winter wheat; SC = spring cereal; SL = spring legume; NT = no-till; CT = conventional till. ŧ Values for STIR from USDA-NRCS TN agronomy No. 50 (USDA-NRCS, 2006). ‡ Annualized STIR value based on summing operation STIR values and dividing by total years in
rotation. § Based on the average number of months out of 12 months of growing plant cover. € Annualized cropping intensity based on sum of sequence intensities divided by total number
of months in a complete crop rotation.
Rotation Operation Rotation Sequence Rotation
Treatment†
Sequence Operation STIRŧ
STIR‡
Intensity§
Intensity€
Planting/ Double Opener w/ fertilizer application 13.81
Spray herbicide 0.15
Harvest 0.15
Spray herbicide (2 times) 0.30
Planting/ Double Opener w/ fertilizer application 13.81
Spray Herbicide 0.15
Harvest 0.15
Spray herbicide (2 times) 0.30
Planting/ Double Opener w/ fertilizer application 13.81
Spray herbicide 0.15
Harvest 0.15
Spray herbicide 0.15
Chisel Plow (Twisted Shovel) 45.50
Field Cultivator w/ 4" sweeps and spring tine harrow 28.44
Planting/ Double Opener w/ fertilizer application 13.81
Spray herbicide 0.15
Harvest 0.15
Spray herbicide (2 times) 0.30
Chisel Plow (Twisted Shovel) 45.50
Field Cultivator w/ 4" sweeps and spring tine harrow 28.44
Planting/ Double Opener w/ fertilizer application 13.81
Spray herbicide 0.15
Harvest 0.15
Spray herbicide (2 times) 0.30
Chisel Plow (Twisted Shovel) 45.50
Field Cultivator w/ 4" sweeps and spring tine harrow 28.44
Planting/ Double Opener w/ fertilizer application 13.81
Spray herbicide 0.15
Harvest 0.15
Spray herbicide 0.15
WW-SC-SL (CT)
WW
88.3
9
0.47
SC
4
SL
4
WW-SC-SL (NT)
WW
14.36
9
0.47
SC
4
SL
4
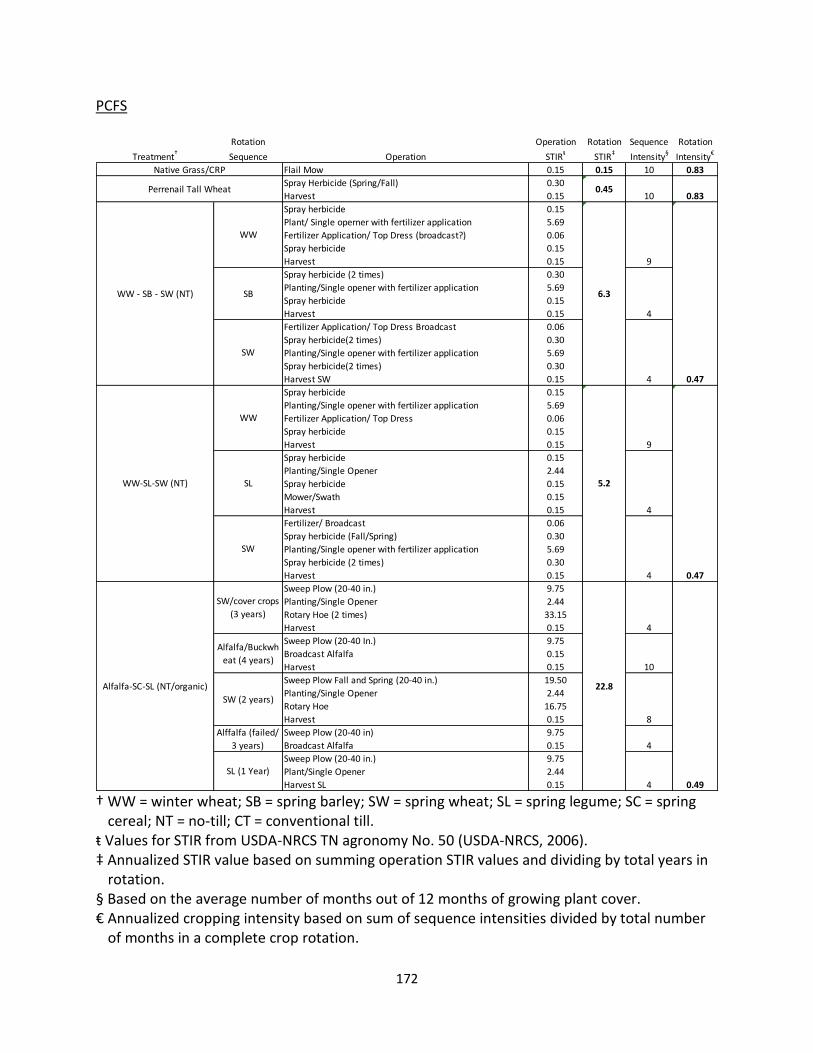
172
PCFS
† WW = winter wheat; SB = spring barley; SW = spring wheat; SL = spring legume; SC = spring
cereal; NT = no-till; CT = conventional till. ŧ Values for STIR from USDA-NRCS TN agronomy No. 50 (USDA-NRCS, 2006). ‡ Annualized STIR value based on summing operation STIR values and dividing by total years in
rotation. § Based on the average number of months out of 12 months of growing plant cover. € Annualized cropping intensity based on sum of sequence intensities divided by total number
of months in a complete crop rotation.
Rotation Operation Rotation Sequence Rotation
Treatment† Sequence Operation STIRŧ STIR‡ Intensity§ Intensity€
Flail Mow 0.15 0.15 10 0.83
Spray Herbicide (Spring/Fall) 0.30
Harvest 0.15
Spray herbicide 0.15
Plant/ Single operner with fertilizer application 5.69
Fertilizer Application/ Top Dress (broadcast?) 0.06
Spray herbicide 0.15
Harvest 0.15
Spray herbicide (2 times) 0.30
Planting/Single opener with fertilizer application 5.69
Spray herbicide 0.15
Harvest 0.15
Fertilizer Application/ Top Dress Broadcast 0.06
Spray herbicide(2 times) 0.30
Planting/Single opener with fertilizer application 5.69
Spray herbicide(2 times) 0.30
Harvest SW 0.15
Spray herbicide 0.15
Planting/Single opener with fertilizer application 5.69
Fertilizer Application/ Top Dress 0.06
Spray herbicide 0.15
Harvest 0.15
Spray herbicide 0.15
Planting/Single Opener 2.44
Spray herbicide 0.15
Mower/Swath 0.15
Harvest 0.15
Fertilizer/ Broadcast 0.06
Spray herbicide (Fall/Spring) 0.30
Planting/Single opener with fertilizer application 5.69
Spray herbicide (2 times) 0.30
Harvest 0.15
Sweep Plow (20-40 in.) 9.75
Planting/Single Opener 2.44
Rotary Hoe (2 times) 33.15
Harvest 0.15
Sweep Plow (20-40 In.) 9.75
Broadcast Alfalfa 0.15
Harvest 0.15
Sweep Plow Fall and Spring (20-40 in.) 19.50
Planting/Single Opener 2.44
Rotary Hoe 16.75
Harvest 0.15
Sweep Plow (20-40 in) 9.75
Broadcast Alfalfa 0.15
Sweep Plow (20-40 in.) 9.75
Plant/Single Opener 2.44
Harvest SL 0.15 0.49
Alfalfa/Buckwh
eat (4 years)10
SW (2 years)
8
Alffalfa (failed/
3 years) 4
SL (1 Year)
4
SL
4
SW
4
Alfalfa-SC-SL (NT/organic)
SW/cover crops
(3 years)
22.8
4
0.47
SB
4
SW
4
WW-SL-SW (NT)
WW
5.2
9
0.47
Native Grass/CRP
Perrenail Tall Wheat 0.4510 0.83
WW - SB - SW (NT)
WW
6.3
9
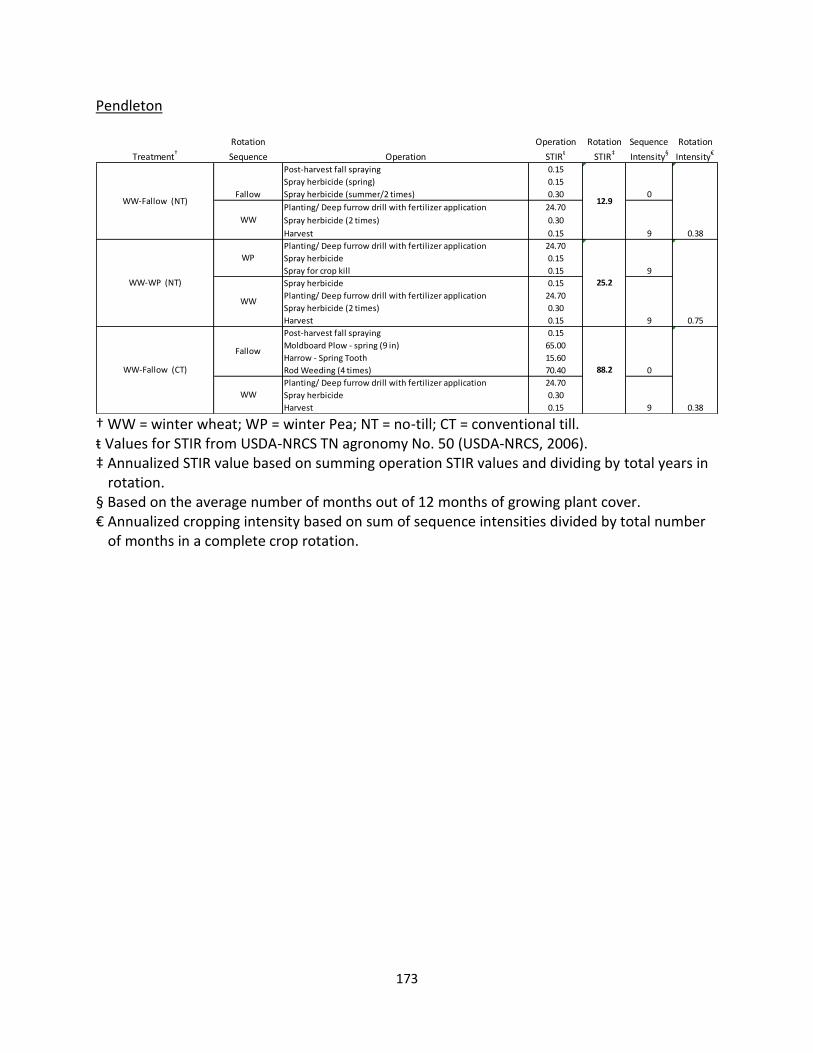
173
Pendleton
† WW = winter wheat; WP = winter Pea; NT = no-till; CT = conventional till. ŧ Values for STIR from USDA-NRCS TN agronomy No. 50 (USDA-NRCS, 2006). ‡ Annualized STIR value based on summing operation STIR values and dividing by total years in
rotation. § Based on the average number of months out of 12 months of growing plant cover. € Annualized cropping intensity based on sum of sequence intensities divided by total number
of months in a complete crop rotation.
Rotation Operation Rotation Sequence Rotation
Treatment†
Sequence Operation STIRŧ
STIR‡
Intensity§
Intensity€
Post-harvest fall spraying 0.15
Spray herbicide (spring) 0.15
Spray herbicide (summer/2 times) 0.30
Planting/ Deep furrow drill with fertilizer application 24.70
Spray herbicide (2 times) 0.30
Harvest 0.15
Planting/ Deep furrow drill with fertilizer application 24.70
Spray herbicide 0.15
Spray for crop kill 0.15
Spray herbicide 0.15
Planting/ Deep furrow drill with fertilizer application 24.70
Spray herbicide (2 times) 0.30
Harvest 0.15
Post-harvest fall spraying 0.15
Moldboard Plow - spring (9 in) 65.00
Harrow - Spring Tooth 15.60
Rod Weeding (4 times) 70.40
Planting/ Deep furrow drill with fertilizer application 24.70
Spray herbicide 0.30
Harvest 0.15
WW
9
25.2
9
0.75
WW
9
WW-Fallow (CT)
Fallow
88.2 0
0.38
WW-Fallow (NT)Fallow
12.90
0.38
WW
9
WW-WP (NT)
WP
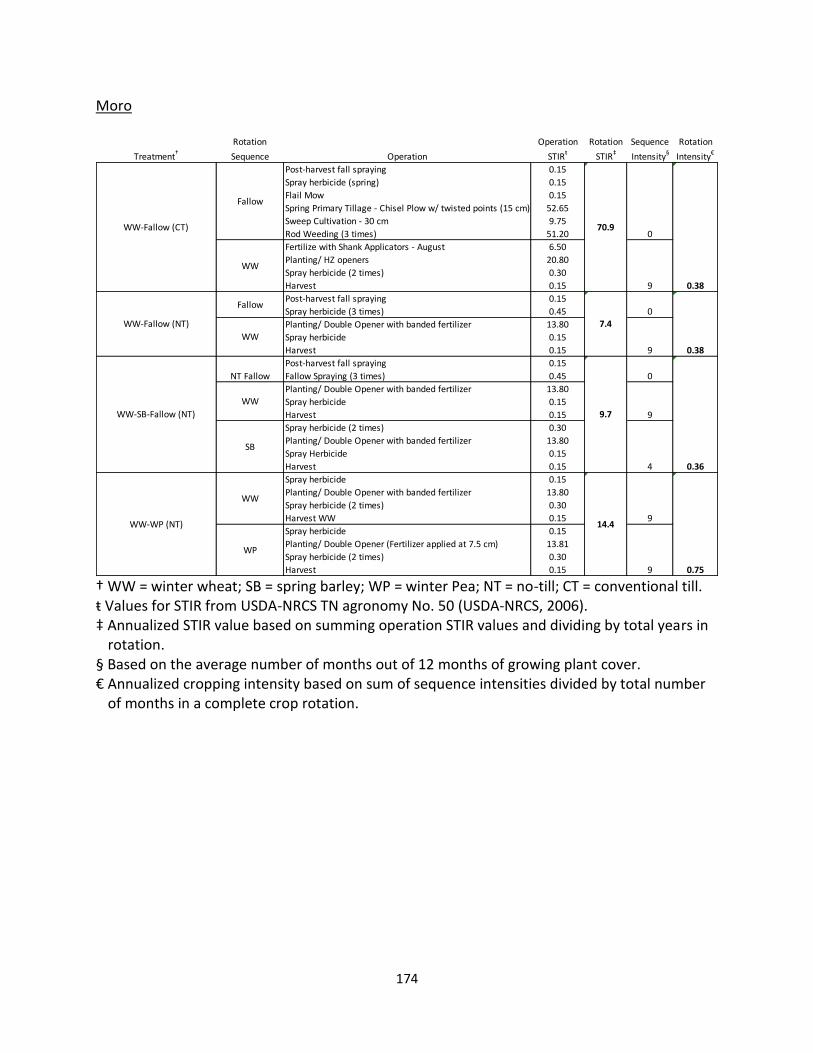
174
Moro
† WW = winter wheat; SB = spring barley; WP = winter Pea; NT = no-till; CT = conventional till. ŧ Values for STIR from USDA-NRCS TN agronomy No. 50 (USDA-NRCS, 2006). ‡ Annualized STIR value based on summing operation STIR values and dividing by total years in
rotation. § Based on the average number of months out of 12 months of growing plant cover. € Annualized cropping intensity based on sum of sequence intensities divided by total number
of months in a complete crop rotation.
Rotation Operation Rotation Sequence Rotation
Treatment†
Sequence Operation STIRŧ
STIR‡
Intensity§
Intensity€
Post-harvest fall spraying 0.15
Spray herbicide (spring) 0.15
Flail Mow 0.15
Spring Primary Tillage - Chisel Plow w/ twisted points (15 cm) 52.65
Sweep Cultivation - 30 cm 9.75
Rod Weeding (3 times) 51.20
Fertilize with Shank Applicators - August 6.50
Planting/ HZ openers 20.80
Spray herbicide (2 times) 0.30
Harvest 0.15
Post-harvest fall spraying 0.15
Spray herbicide (3 times) 0.45
Planting/ Double Opener with banded fertilizer 13.80
Spray herbicide 0.15
Harvest 0.15
Post-harvest fall spraying 0.15
Fallow Spraying (3 times) 0.45
Planting/ Double Opener with banded fertilizer 13.80
Spray herbicide 0.15
Harvest 0.15
Spray herbicide (2 times) 0.30
Planting/ Double Opener with banded fertilizer 13.80
Spray Herbicide 0.15
Harvest 0.15
Spray herbicide 0.15
Planting/ Double Opener with banded fertilizer 13.80
Spray herbicide (2 times) 0.30
Harvest WW 0.15
Spray herbicide 0.15
Planting/ Double Opener (Fertilizer applied at 7.5 cm) 13.81
Spray herbicide (2 times) 0.30
Harvest 0.15
WW-Fallow (CT)
Fallow
70.90
WW-SB-Fallow (NT)
NT Fallow
9.7
0.38
WW
9
WW-Fallow (NT)
Fallow
7.40
0.38
WW
9
WW-WP (NT)
WW
14.49
0.75
WP
9
0
0.36
WW
9
SB
4
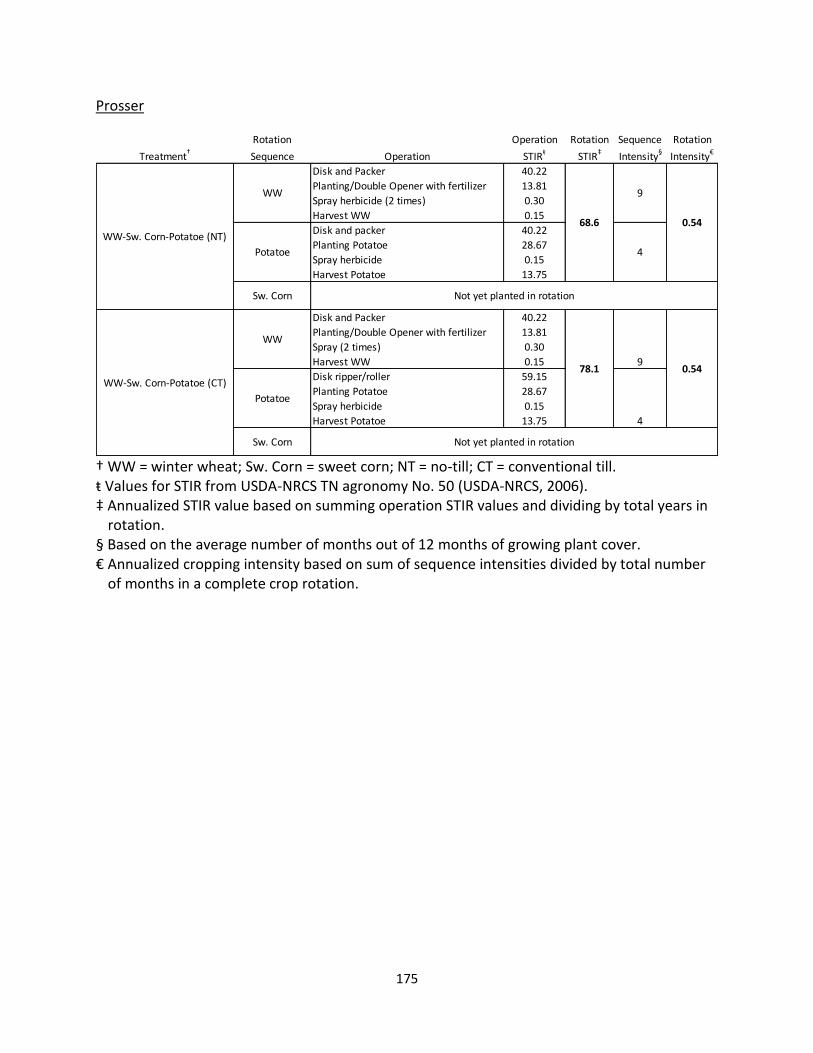
175
Prosser
† WW = winter wheat; Sw. Corn = sweet corn; NT = no-till; CT = conventional till. ŧ Values for STIR from USDA-NRCS TN agronomy No. 50 (USDA-NRCS, 2006). ‡ Annualized STIR value based on summing operation STIR values and dividing by total years in
rotation. § Based on the average number of months out of 12 months of growing plant cover. € Annualized cropping intensity based on sum of sequence intensities divided by total number
of months in a complete crop rotation.
Rotation Operation Rotation Sequence Rotation
Treatment†
Sequence Operation STIRŧ
STIR‡
Intensity§
Intensity€
Disk and Packer 40.22
Planting/Double Opener with fertilizer 13.81
Spray herbicide (2 times) 0.30
Harvest WW 0.15
Disk and packer 40.22
Planting Potatoe 28.67
Spray herbicide 0.15
Harvest Potatoe 13.75
Disk and Packer 40.22
Planting/Double Opener with fertilizer 13.81
Spray (2 times) 0.30
Harvest WW 0.15
Disk ripper/roller 59.15
Planting Potatoe 28.67
Spray herbicide 0.15
Harvest Potatoe 13.75
WW-Sw. Corn-Potatoe (NT)
WW
68.6
9
0.54
Potatoe 4
Sw. Corn Not yet planted in rotation
WW-Sw. Corn-Potatoe (CT)
WW
78.19
0.54
Potatoe
4
Sw. Corn Not yet planted in rotation
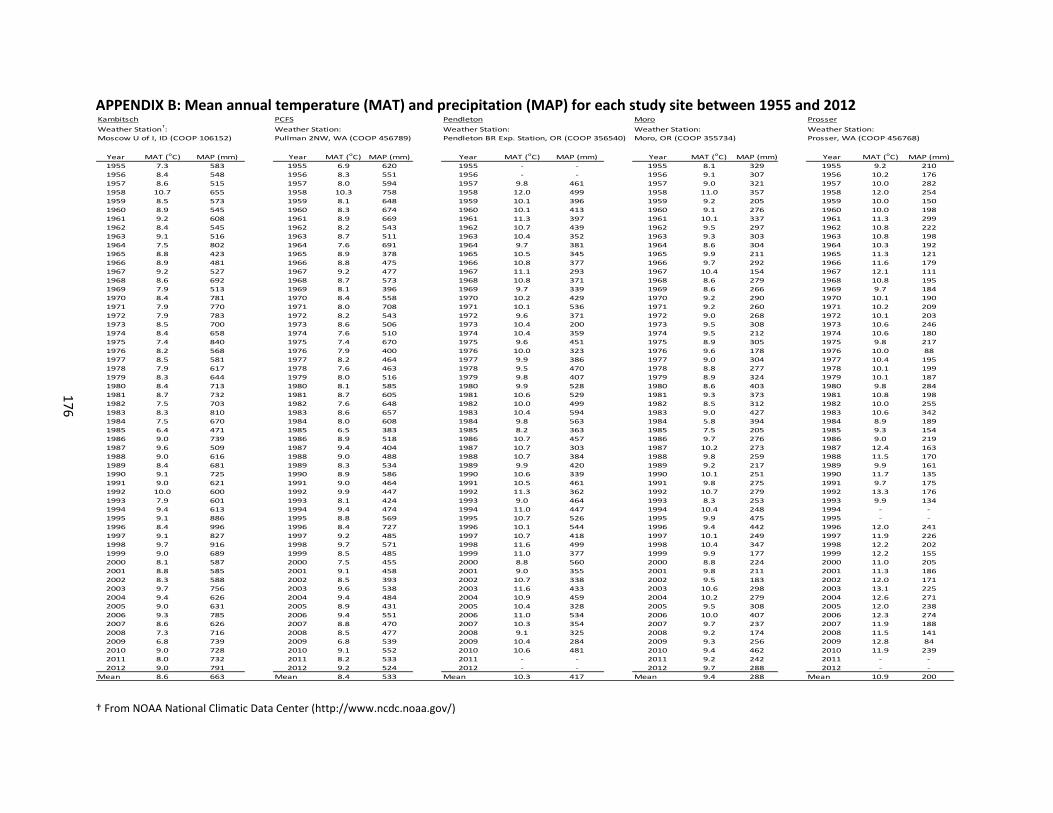
17
6
APPENDIX B: Mean annual temperature (MAT) and precipitation (MAP) for each study site between 1955 and 2012
† From NOAA National Climatic Data Center (http://www.ncdc.noaa.gov/)
Kambitsch PCFS Pendleton Moro Prosser
Weather Station†: Weather Station: Weather Station: Weather Station: Weather Station:
Moscow U of I, ID (COOP 106152) Pullman 2NW, WA (COOP 456789) Pendleton BR Exp. Station, OR (COOP 356540) Moro, OR (COOP 355734) Prosser, WA (COOP 456768)
Year MAT (oC) MAP (mm) Year MAT (oC) MAP (mm) Year MAT (oC) MAP (mm) Year MAT (oC) MAP (mm) Year MAT (oC) MAP (mm)
1955 7.3 583 1955 6.9 620 1955 - - 1955 8.1 329 1955 9.2 210
1956 8.4 548 1956 8.3 551 1956 - - 1956 9.1 307 1956 10.2 176
1957 8.6 515 1957 8.0 594 1957 9.8 461 1957 9.0 321 1957 10.0 282
1958 10.7 655 1958 10.3 758 1958 12.0 499 1958 11.0 357 1958 12.0 254
1959 8.5 573 1959 8.1 648 1959 10.1 396 1959 9.2 205 1959 10.0 150
1960 8.9 545 1960 8.3 674 1960 10.1 413 1960 9.1 276 1960 10.0 198
1961 9.2 608 1961 8.9 669 1961 11.3 397 1961 10.1 337 1961 11.3 299
1962 8.4 545 1962 8.2 543 1962 10.7 439 1962 9.5 297 1962 10.8 222
1963 9.1 516 1963 8.7 511 1963 10.4 352 1963 9.3 303 1963 10.8 198
1964 7.5 802 1964 7.6 691 1964 9.7 381 1964 8.6 304 1964 10.3 192
1965 8.8 423 1965 8.9 378 1965 10.5 345 1965 9.9 211 1965 11.3 121
1966 8.9 481 1966 8.8 475 1966 10.8 377 1966 9.7 292 1966 11.6 179
1967 9.2 527 1967 9.2 477 1967 11.1 293 1967 10.4 154 1967 12.1 111
1968 8.6 692 1968 8.7 573 1968 10.8 371 1968 8.6 279 1968 10.8 195
1969 7.9 513 1969 8.1 396 1969 9.7 339 1969 8.6 266 1969 9.7 184
1970 8.4 781 1970 8.4 558 1970 10.2 429 1970 9.2 290 1970 10.1 190
1971 7.9 770 1971 8.0 708 1971 10.1 536 1971 9.2 260 1971 10.2 209
1972 7.9 783 1972 8.2 543 1972 9.6 371 1972 9.0 268 1972 10.1 203
1973 8.5 700 1973 8.6 506 1973 10.4 200 1973 9.5 308 1973 10.6 246
1974 8.4 658 1974 7.6 510 1974 10.4 359 1974 9.5 212 1974 10.6 180
1975 7.4 840 1975 7.4 670 1975 9.6 451 1975 8.9 305 1975 9.8 217
1976 8.2 568 1976 7.9 400 1976 10.0 323 1976 9.6 178 1976 10.0 88
1977 8.5 581 1977 8.2 464 1977 9.9 386 1977 9.0 304 1977 10.4 195
1978 7.9 617 1978 7.6 463 1978 9.5 470 1978 8.8 277 1978 10.1 199
1979 8.3 644 1979 8.0 516 1979 9.8 407 1979 8.9 324 1979 10.1 187
1980 8.4 713 1980 8.1 585 1980 9.9 528 1980 8.6 403 1980 9.8 284
1981 8.7 732 1981 8.7 605 1981 10.6 529 1981 9.3 373 1981 10.8 198
1982 7.5 703 1982 7.6 648 1982 10.0 499 1982 8.5 312 1982 10.0 255
1983 8.3 810 1983 8.6 657 1983 10.4 594 1983 9.0 427 1983 10.6 342
1984 7.5 670 1984 8.0 608 1984 9.8 563 1984 5.8 394 1984 8.9 189
1985 6.4 471 1985 6.5 383 1985 8.2 363 1985 7.5 205 1985 9.3 154
1986 9.0 739 1986 8.9 518 1986 10.7 457 1986 9.7 276 1986 9.0 219
1987 9.6 509 1987 9.4 404 1987 10.7 303 1987 10.2 273 1987 12.4 163
1988 9.0 616 1988 9.0 488 1988 10.7 384 1988 9.8 259 1988 11.5 170
1989 8.4 681 1989 8.3 534 1989 9.9 420 1989 9.2 217 1989 9.9 161
1990 9.1 725 1990 8.9 586 1990 10.6 339 1990 10.1 251 1990 11.7 135
1991 9.0 621 1991 9.0 464 1991 10.5 461 1991 9.8 275 1991 9.7 175
1992 10.0 600 1992 9.9 447 1992 11.3 362 1992 10.7 279 1992 13.3 176
1993 7.9 601 1993 8.1 424 1993 9.0 464 1993 8.3 253 1993 9.9 134
1994 9.4 613 1994 9.4 474 1994 11.0 447 1994 10.4 248 1994 - -
1995 9.1 886 1995 8.8 569 1995 10.7 526 1995 9.9 475 1995 - -
1996 8.4 996 1996 8.4 727 1996 10.1 544 1996 9.4 442 1996 12.0 241
1997 9.1 827 1997 9.2 485 1997 10.7 418 1997 10.1 249 1997 11.9 226
1998 9.7 916 1998 9.7 571 1998 11.6 499 1998 10.4 347 1998 12.2 202
1999 9.0 689 1999 8.5 485 1999 11.0 377 1999 9.9 177 1999 12.2 155
2000 8.1 587 2000 7.5 455 2000 8.8 560 2000 8.8 224 2000 11.0 205
2001 8.8 585 2001 9.1 458 2001 9.0 355 2001 9.8 211 2001 11.3 186
2002 8.3 588 2002 8.5 393 2002 10.7 338 2002 9.5 183 2002 12.0 171
2003 9.7 756 2003 9.6 538 2003 11.6 433 2003 10.6 298 2003 13.1 225
2004 9.4 626 2004 9.4 484 2004 10.9 459 2004 10.2 279 2004 12.6 271
2005 9.0 631 2005 8.9 431 2005 10.4 328 2005 9.5 308 2005 12.0 238
2006 9.3 785 2006 9.4 551 2006 11.0 534 2006 10.0 407 2006 12.3 274
2007 8.6 626 2007 8.8 470 2007 10.3 354 2007 9.7 237 2007 11.9 188
2008 7.3 716 2008 8.5 477 2008 9.1 325 2008 9.2 174 2008 11.5 141
2009 6.8 739 2009 6.8 539 2009 10.4 284 2009 9.3 256 2009 12.8 84
2010 9.0 728 2010 9.1 552 2010 10.6 481 2010 9.4 462 2010 11.9 239
2011 8.0 732 2011 8.2 533 2011 - - 2011 9.2 242 2011 - -
2012 9.0 791 2012 9.2 524 2012 - - 2012 9.7 288 2012 - -
Mean 8.6 663 Mean 8.4 533 Mean 10.3 417 Mean 9.4 288 Mean 10.9 200