the indonesian construction: now and future · the indonesian construction: now and future ......
TRANSCRIPT
THE INDONESIAN CONSTRUCTION: NOW AND FUTURE
Akhmad Suraji, Dadan Krisnandar, Sulistijo Sidharto Mulyo National Board of Construction Services Development
Indonesia
I. EXECUTIVE SUMMARY Macro economy of Indonesia is improving progressively after severe economic crisis 1997. Currently economic growth is under stable condition and to achieve 6.5%. As with developing nation, Indonesia has a large scale of construction market for the next 20 years onward. Until the next five years, Indonesia needs to invest for infrastructure development which will required more than 1,200 trillion rupiahs. In the next coming year(2008) the government will spend about 35 trillion rupiahs for only public work projects in particular for road networks, water resources and human settlement. Thi big challenge in construction sector has led the Indonesian construction to develop its competitiveness through capacity building programme for improved competency. It was proposed by prominent stakeholders, the Indonesian construction should be an enabling factor for socio-economic development of the nation. In this case, the Indonesian construction is conceptualised as people, process (business) and product that exiss in the context of globalisation & liberalisation, democratisation & decentralisation, poverty and disparity, and environment degradation & disaster. It was agreed by the stakeholder that vision of the Indonesian construction is the finest built environment achieved by creating added value through sustainability, synergy, professionalism and competitiveness. This vision is achieved through strategic paths of building professionalism of human resources, integrating value chain network among construction players, reciprocity among stakeholders and networking internasionally.
II. MACRO ECONOMY REVIEW & OUTLOOK
a. Overview of National Economy The Indonesian economy is growing significantly since it was hit by Asia economic crisis in 1997. Now it is considered to be in stable state and to growth at 6.5%. It shows that GDP at constant price 2006 achieved US$ 1.663,0 higher than 2005 (US$ 1.320,6). The growht of GDP without oil and gas in 2006 achieves 6.1 %. Most of GDP is used to household comsumption (62.7%), government expenditure (8.6%), gross fix capital formation (24.0%) and export netto (4.8%). The main sources of th economic growth are export (4.1%) followed by household consumption (1.9%), gross fixed capital formation (0.7%) and import (2.8%) respectively.
The business trend index in fourth quarter of 2006 was 107.3 showing that business condition in general is better than third quarter of 2006. This business condition is growing better since increased revenue due to increasing production capacity and number of working time. Higher business revenue occurs in the finance sector, property and services. The higher increased workforce occurs in the construction sector. The highest business index is 115.35 occuring in the construction sector. It shows that this sector is the most increased sector compared to other sectors. However, the agriculture sector has decreased its index (95.12%). The business trend index during first quarter of 2007 was expected
about 108.79. During 2007, business condition is expecting higher than 2006 and in this year, construction sector will have higher index.
Consumer trend index across greater Jakarta during last quarter of 2006 was 106.96 showing economic condition of consumers are in better condition. Increased value of consumer trend index is due to increasing household income and consumption of main commodities. Higher consumption occurs in the housing expenses (energy and water), transportation, and education, while recreation expenditure decreased. It was expected that economic condition of consumers during 2007 is much better than 2006.
b. Main Economic Indicators The Indonesian economy is in a stable shape towards increased growth. The Indonesian gross domestic product for 2004 in constant 2000 real prices was RP. 1511 Trillion which represents a 1.03% increase on the previous year. To January 2005 the gross domestic product grew at an annual rate of 5.13% in Central Bureau of Statistics data (CBS, Economic Indicators, January 2005). During the same period the consumer price index standing at 118.53 in January 2005 grew by only 1.43 points against 0.57 the previous year (2002=100). The interest on 90-day bank deposit bills was 6.65% in October and the 10-year Treasury Bonds returned 8.31%. Rising cost of materials including that for crude oil leading to an increase in inflation from 5.06% in 2003 to 6.4% in 2004 and the cyclical Rupiah devaluation of 20% against the US$ has forced the government to instigate minimization of energy consumption, spending and subsidy provisions nationwide. The unemployment rate however, increased from 15% in 2003 to 16% in 2004. Despite current uncertainties about the international economy and the downturn in balance of payments from US$28.6 Billion in 2003 to 23.5 Billion in 2004, the rate of economic growth is forecast to continue to the end of 2006 at 6.5%, with the domestic economy proving to be relatively resistant to adverse global economic conditions.
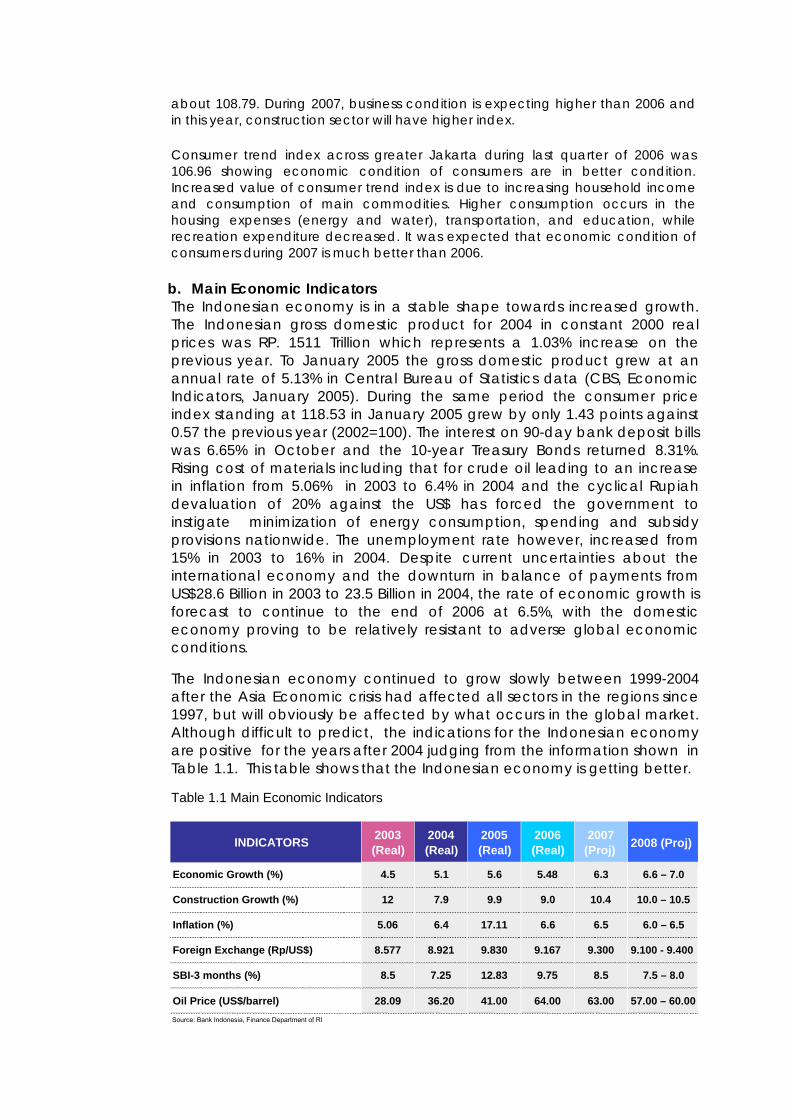
The Indonesian economy continued to grow slowly between 1999-2004 after the Asia Economic crisis had affected all sectors in the regions since 1997, but will obviously be affected by what occurs in the global market. Although difficult to predict, the indications for the Indonesian economy are positive for the years after 2004 judging from the information shown in Table 1.1. This table shows that the Indonesian economy is getting better.
Table 1.1 Main Economic Indicators
Economic Growth (%) 4.5 5.1 5.6 5.48 6.3 6.6 – 7.0
Construction Growth (%) 12 7.9 9.9 9.0 10.4 10.0 – 10.5
Inflation (%) 5.06 6.4 17.11 6.6 6.5 6.0 – 6.5
Foreign Exchange (Rp/US$) 8.577 8.921 9.830 9.167 9.300 9.100 - 9.400
SBI-3 months (%) 8.5 7.25 12.83 9.75 8.5 7.5 – 8.0
INDICATORS 2003 (Real)
2004 (Real)
2005 (Real)
2006 (Real)
2007 (Proj) 2008 (Proj)
Oil Price (US$/barrel) 28.09 36.20 41.00 64.00 63.00 57.00 – 60.00
Source: Bank Indonesia, Finance Department of RI
According to the latest CBS the real gross domestic product (GDP) expanded by 6.17%, indicating that the economy is picking up, as the corresponding value for the previous year was 5.8%. In the past the Indonesian economy was relatively resilient against minor adverse international economic conditions. The control exercised over the relatively long recovery period since the economic crisis of 1997-2000, through fundamental economic remedies, has provided a good basis for managing the present uncertainties thereby indicating opportunity for gradual expansion and continuing sustained growth in the key sectors of the economy. These include in particular the construction, agriculture, manufacturing and services sectors. In terms of consumption and investment ( not in the table ), for the first half of 2005 compared to the first half of 2004, retail sales at current prices increased by 16%, new capital expenditures by 27% and new government expenditures were up 10%.
III. OVERVIEW OF THE INDONESIAN CONSTRUCTION
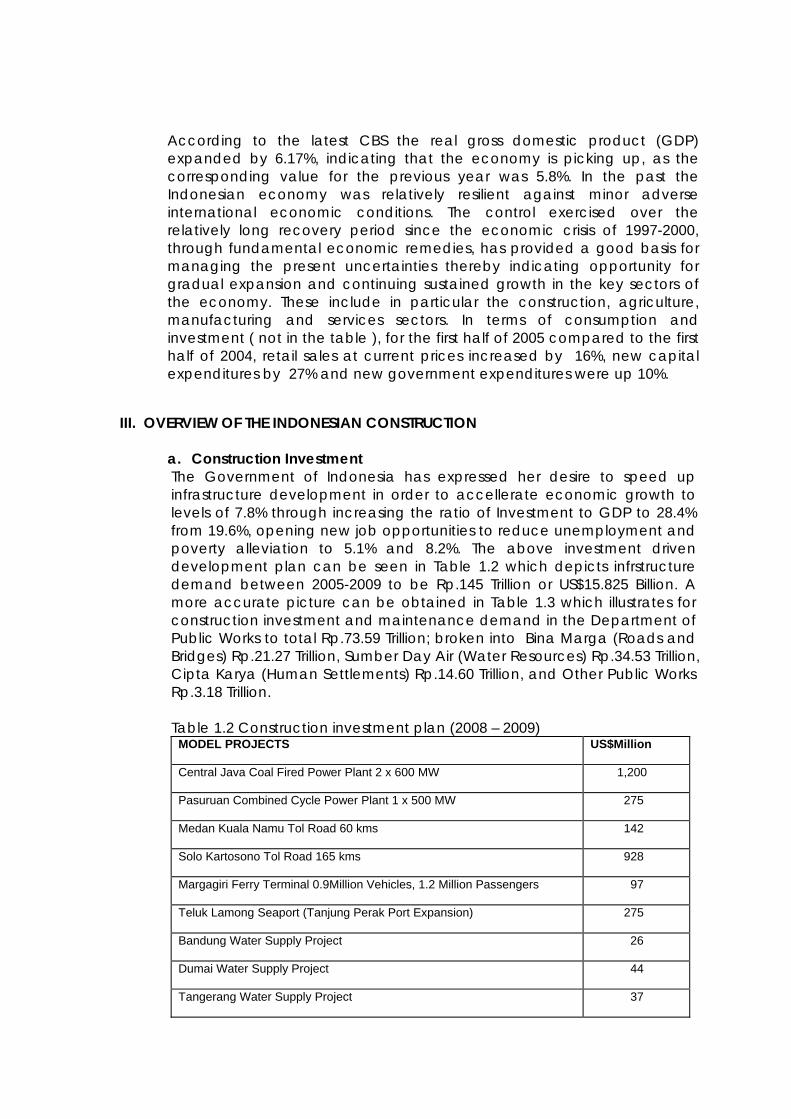
a. Construction Investment The Government of Indonesia has expressed her desire to speed up infrastructure development in order to accellerate economic growth to levels of 7.8% through increasing the ratio of Investment to GDP to 28.4% from 19.6%, opening new job opportunities to reduce unemployment and poverty alleviation to 5.1% and 8.2%. The above investment driven development plan can be seen in Table 1.2 which depicts infrstructure demand between 2005-2009 to be Rp.145 Trillion or US$15.825 Billion. A more accurate picture can be obtained in Table 1.3 which illustrates for construction investment and maintenance demand in the Department of Public Works to total Rp.73.59 Trillion; broken into Bina Marga (Roads and Bridges) Rp.21.27 Trillion, Sumber Day Air (Water Resources) Rp.34.53 Trillion, Cipta Karya (Human Settlements) Rp.14.60 Trillion, and Other Public Works Rp.3.18 Trillion.
Table 1.2 Construction investment plan (2008 – 2009)
MODEL PROJECTS US$Million
Central Java Coal Fired Power Plant 2 x 600 MW 1,200
Pasuruan Combined Cycle Power Plant 1 x 500 MW 275
Medan Kuala Namu Tol Road 60 kms 142
Solo Kartosono Tol Road 165 kms 928
Margagiri Ferry Terminal 0.9Million Vehicles, 1.2 Million Passengers 97
Teluk Lamong Seaport (Tanjung Perak Port Expansion) 275
Bandung Water Supply Project 26
Dumai Water Supply Project 44
Tangerang Water Supply Project 37
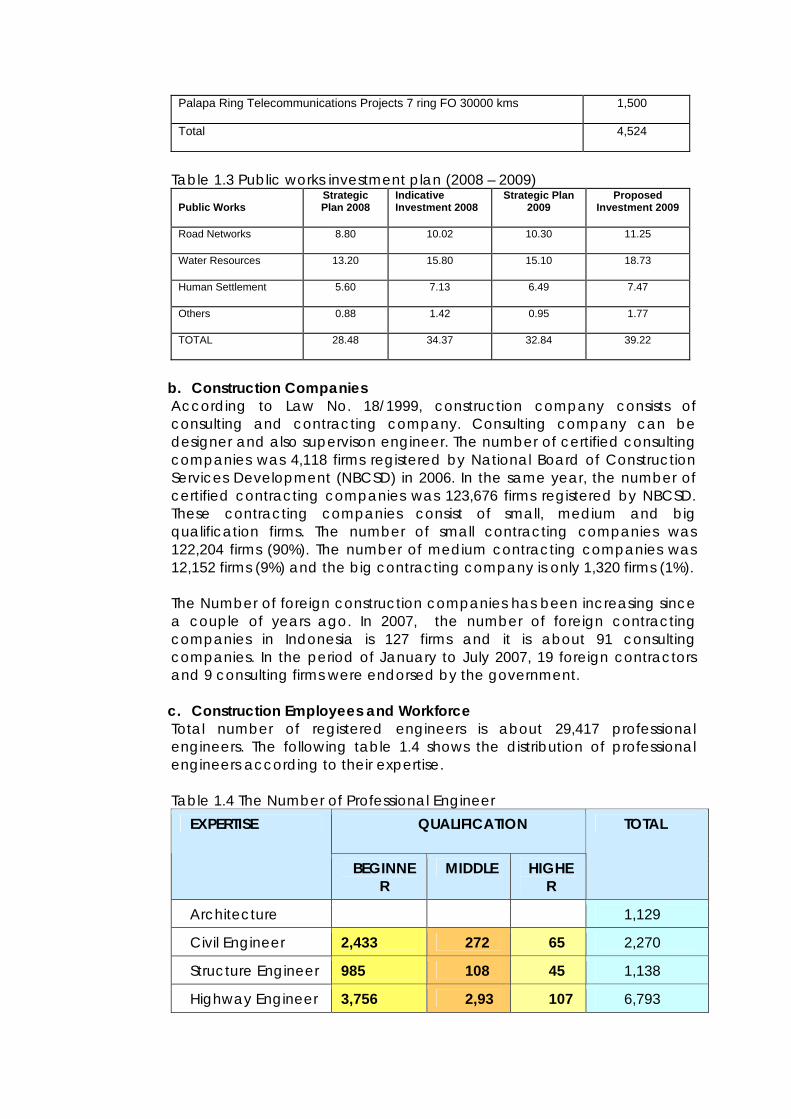
Palapa Ring Telecommunications Projects 7 ring FO 30000 kms 1,500
Total 4,524
Table 1.3 Public works investment plan (2008 – 2009)
Public Works Strategic Plan 2008
Indicative Investment 2008
Strategic Plan 2009
Proposed Investment 2009
Road Networks 8.80 10.02 10.30 11.25
Water Resources 13.20 15.80 15.10 18.73
Human Settlement 5.60 7.13 6.49 7.47
Others 0.88 1.42 0.95 1.77
TOTAL 28.48 34.37 32.84 39.22
b. Construction Companies According to Law No. 18/1999, construction company consists of consulting and contracting company. Consulting company can be designer and also supervison engineer. The number of certified consulting companies was 4,118 firms registered by National Board of Construction Services Development (NBCSD) in 2006. In the same year, the number of certified contracting companies was 123,676 firms registered by NBCSD. These contracting companies consist of small, medium and big qualification firms. The number of small contracting companies was 122,204 firms (90%). The number of medium contracting companies was 12,152 firms (9%) and the big contracting company is only 1,320 firms (1%). The Number of foreign construction companies has been increasing since a couple of years ago. In 2007, the number of foreign contracting companies in Indonesia is 127 firms and it is about 91 consulting companies. In the period of January to July 2007, 19 foreign contractors and 9 consulting firms were endorsed by the government.
c. Construction Employees and Workforce Total number of registered engineers is about 29,417 professional engineers. The following table 1.4 shows the distribution of professional engineers according to their expertise. Table 1.4 The Number of Professional Engineer
QUALIFICATION EXPERTISE
BEGINNER
MIDDLE HIGHER
TOTAL
Architecture 1,129
Civil Engineer 2,433 272 65 2,270
Structure Engineer 985 108 45 1,138
Highway Engineer 3,756 2,93 107 6,793
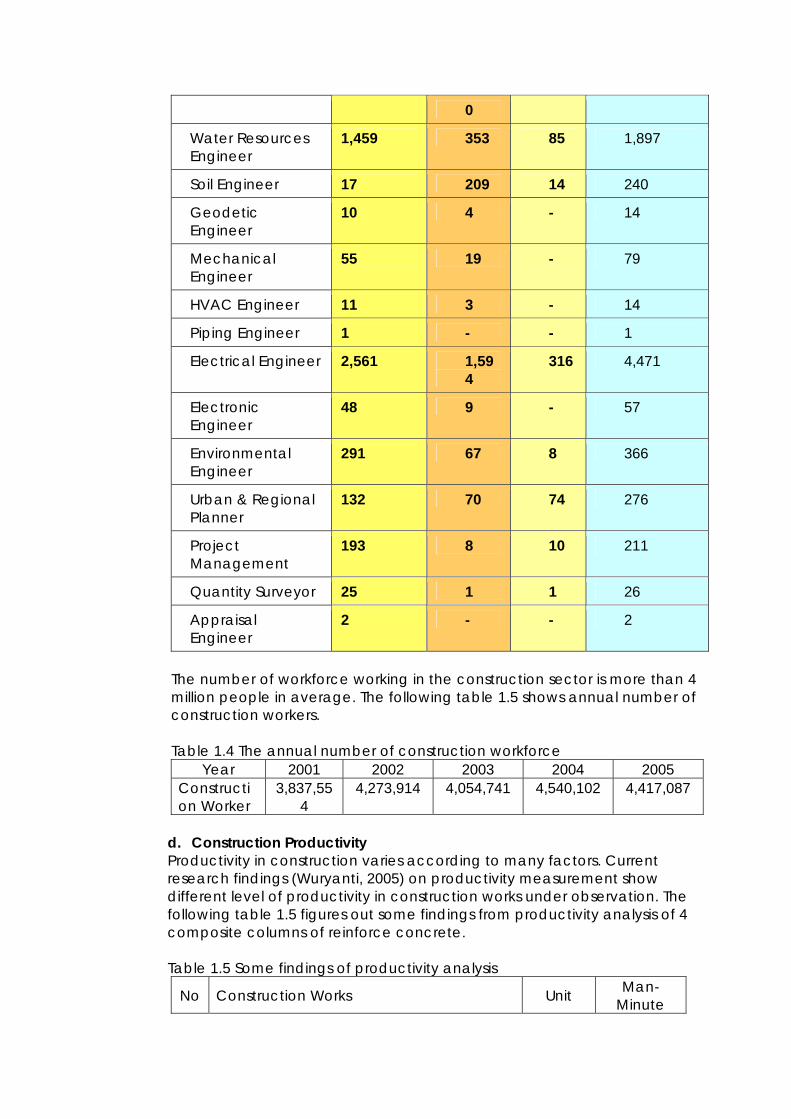
0
Water Resources Engineer
1,459 353 85 1,897
Soil Engineer 17 209 14 240
Geodetic Engineer
10 4 - 14
Mechanical Engineer
55 19 - 79
HVAC Engineer 11 3 - 14
Piping Engineer 1 - - 1
Electrical Engineer 2,561 1,594
316 4,471
Electronic Engineer
48 9 - 57
Environmental Engineer
291 67 8 366
Urban & Regional Planner
132 70 74 276
Project Management
193 8 10 211
Quantity Surveyor 25 1 1 26
Appraisal Engineer
2 - - 2
The number of workforce working in the construction sector is more than 4 million people in average. The following table 1.5 shows annual number of construction workers. Table 1.4 The annual number of construction workforce
Year 2001 2002 2003 2004 2005 Construction Worker
3,837,554
4,273,914 4,054,741 4,540,102 4,417,087
d. Construction Productivity Productivity in construction varies according to many factors. Current research findings (Wuryanti, 2005) on productivity measurement show different level of productivity in construction works under observation. The following table 1.5 figures out some findings from productivity analysis of 4 composite columns of reinforce concrete. Table 1.5 Some findings of productivity analysis
No Construction Works Unit Man-Minute
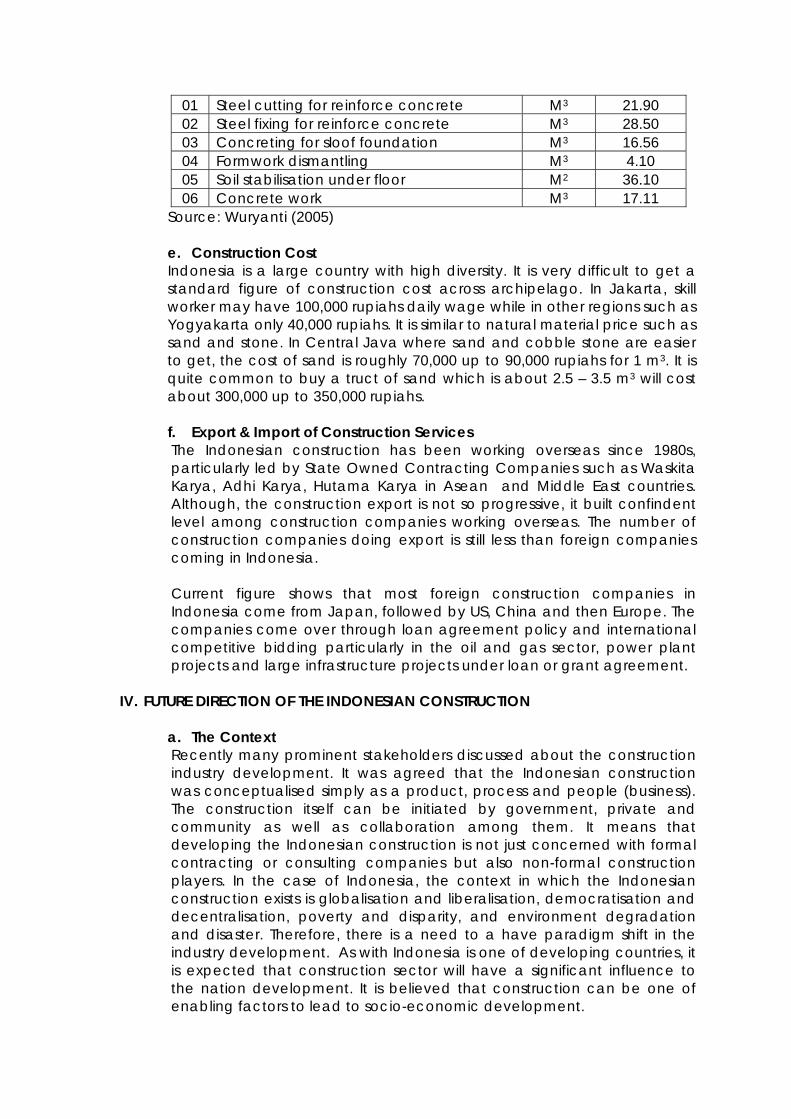
01 Steel cutting for reinforce concrete M3 21.90 02 Steel fixing for reinforce concrete M3 28.50 03 Concreting for sloof foundation M3 16.56 04 Formwork dismantling M3 4.10 05 Soil stabilisation under floor M2 36.10 06 Concrete work M3 17.11
Source: Wuryanti (2005) e. Construction Cost Indonesia is a large country with high diversity. It is very difficult to get a standard figure of construction cost across archipelago. In Jakarta, skill worker may have 100,000 rupiahs daily wage while in other regions such as Yogyakarta only 40,000 rupiahs. It is similar to natural material price such as sand and stone. In Central Java where sand and cobble stone are easier to get, the cost of sand is roughly 70,000 up to 90,000 rupiahs for 1 m3. It is quite common to buy a truct of sand which is about 2.5 – 3.5 m3 will cost about 300,000 up to 350,000 rupiahs. f. Export & Import of Construction Services The Indonesian construction has been working overseas since 1980s, particularly led by State Owned Contracting Companies such as Waskita Karya, Adhi Karya, Hutama Karya in Asean and Middle East countries. Although, the construction export is not so progressive, it built confindent level among construction companies working overseas. The number of construction companies doing export is still less than foreign companies coming in Indonesia. Current figure shows that most foreign construction companies in Indonesia come from Japan, followed by US, China and then Europe. The companies come over through loan agreement policy and international competitive bidding particularly in the oil and gas sector, power plant projects and large infrastructure projects under loan or grant agreement.
IV. FUTURE DIRECTION OF THE INDONESIAN CONSTRUCTION
a. The Context Recently many prominent stakeholders discussed about the construction industry development. It was agreed that the Indonesian construction was conceptualised simply as a product, process and people (business). The construction itself can be initiated by government, private and community as well as collaboration among them. It means that developing the Indonesian construction is not just concerned with formal contracting or consulting companies but also non-formal construction players. In the case of Indonesia, the context in which the Indonesian construction exists is globalisation and liberalisation, democratisation and decentralisation, poverty and disparity, and environment degradation and disaster. Therefore, there is a need to a have paradigm shift in the industry development. As with Indonesia is one of developing countries, it is expected that construction sector will have a significant influence to the nation development. It is believed that construction can be one of enabling factors to lead to socio-economic development.
b. The Vision & Mission As with the context above, many stakeholders of the Indonesian construction agreed to propose the vision and mission of the Indonesian construction. It is realised that construction is someting closed to built environment by which construction can be conceptualised as artefacts, process and then exists in a ecosystem. It has also been critised that construction in developing countries is as “white elephant” with no impact to local economic development, community empowernment, improved public services and sustainable environment. This leads to understanding that the Indonesian construction in future should provide better quality of life and improve prosperity of the nation. The vision of the Indonesian construction is “ the finest built environment” and its mission is to create added value for society through sustainability, profesionalism, synergy and competitiveness. This may help stakeholders to promote better business, efficient process and proven quality of construction product whilst maintaining or conserving ecosystem or evironment. In principle, the objectives of the Indonesian construction are to improve productivity, profitability, growth, and sustainability as well as competitiveness while pursuing justice of business transaction in order to get qualified, usable and sustainable construction products. c. The Development Path The Indonesian construction is suggested to have four strategic development strategy. The first strategy is to build competency of professional human resources in the invidual domain. The second strategy is to have synergy in the internal domain of construction players (sponsors, project managers, contractors, and consultants) while integrating value of supply network. The third strategy is to promote reciprocity in the external domain through working well stakeholders. The four strategy is to build strong networking in the international domain in order to winning global competition. Proposed development stages of the Indonesian construction consist of four big steps till 2030. The first stage (2007-2012) is to strengthen leadership, legal framework and institutional setting. The second stage (2013-2018) is to build institution capacity, to improve coordination and synergy as well as to increase profesionalism. The third stage is to establish strong, reliable, and competent Indonesian construction in providing quality of product, usable and sustainable construction product. The fourth stage is to enable Indonesian construction to create added value through sustainability, profesionalism, synergy and competitiveness for the finest built environment. d. The Recommended Agenda In order to achieve such dream mentioned above, the development agenda is required. The following strategic agenda is recommended to construction stakeholders, particularly government. 1. Revitalisation of construction sector, 2. Strengthening and growth of construction sector,
3. Establishment of regulatory framework for construction, 4. Establishment of fair construction trade, 5. Empowerment of institutions for construction development, 6. Improvement of synergy among sectors related construction, 7. Development of construction technology, 8. Improvement of competency of human resources, 9. Monitoring of construction business, 10. Protection of user and beneficeries of construction product, 11. Improvement of construction investment, 12. Capacity building of local government for local construction, 13. Development of traditional construction and non-engineered buildings.
REFERENCES 1. Central Berau of Statistic (2005), Economic Indicators 2005, Jakarta, Indonesia,
June, 2005 2. Mulyo, SS & Abidin, IS (2007), Construction Market in Indonesia, Japan Indonesia
Seminar II, Department of Public Works of Republic of Indonesia, Jakarta. 3. Public Works Department (2007) Program and Target Development, Jakarta 4. Suraji, A (2007), The Indonesian Construction 2030, National Board of
Construction Services Development, Jakarta 5. Wuryanti, W (2005) Cost Index of Reinforce Concrete Construction (in
Indonesian), Seminar, Center for Research & Development, Public Work Department, Jakarta.
Innovation to Indonesian Earthquake Resistant Structures
Sarwidi Islamic University of Indonesia, Yogyakarta, Indonesia
CEEDEDS International E-mail: [email protected], [email protected]
Executive Summary Most of the territory of Indonesia is prone to earthquake shaking. Structures may be classified in two extreme groups, engineered and non-engineered ones. The Islamic University of Indonesia (UII) in collaboration with CEEDEDS International have set up field investigation teams to the earthquake damaged areas in Indonesia for the last 10 years. Close looking in the recent damaging earthquakes in Indonesia, non-engineered house using masonry walls (NEHMW) were popular but always suffered most and caused most loss of life and loss of properties. If such structures are not constructed properly, in the future they are still potential to become terrible killers. This leads to focus this paper on this kind of structure. During the field investigations, the teams not only investigated the damaged structures but also interacted with local people and institutions. Those experiences are very beneficial in (1) understanding the dynamic performance of non-engineered structures that apply local technology, (2) portraying the society condition and their real needs in short and long terms after the jolts, including their needs in affording earthquake-resistant houses, and consequently, (3) inspiring the demand in innovation of earthquake resistant NEHMW. This paper briefly reviews the lessons learnt from those field investigations, and consequently, the need for response actions in the innovation of NEHMW to reduce the effects of future earthquake disasters in Indonesia. 1. CASE STUDIES
1. 1. Backgrounds Based on the seismic history and analysing the geologic condition, most of the Indonesian territory is earthquake shaking prone areas (Erickson, 1988; Fauzi, 2001; Kertapati, 2000; Naryanto and Tejakusuma, 1999; Irsyam et. al., 2007; Natawidjaja, 2007). This condition should need special attention, since most of those areas are densely populated. In the islands of Java and Sumatera, even, such areas are extremely populated. Structures may be classified in two extreme groups, engineered and non-engineered ones. The engineered structures are the structures designed, built, and supervised using engineering approach by participation of professional engineers. Vise-a-versa, the non-engineered structures are structures that are built by local builders and/or structure owners using traditional approach. In the range of the two extreme groups, apparent in Indonesia, there are structures that can be classified as semi-engineered ones. However, people usually include semi-engineered structures in the class of non-engineered ones. Therefore, non-engineered structures mentioned in this paper are the structures beyond engineered ones, which are the combination of non-engineered and semi-engineered structures. Most of such structures apply local technology.
11
The Islamic University of Indonesia (UII) Yogyakarta in collaboration with other parties, such as CEEDEDS, formed field investigation teams to visit several areas damaged by strong earthquakes shortly after the jolts. Those investigated areas were strongly shaken by the 1998 Blitar, 2000 Banggai, 2000 Bengkulu, 2000 Sukabumi, 2000 Banjarnegara, 2000 Pandeglang, 2001 Yogyakarta, 2001 Majalengka, 2003 Pacitan, 2004 Bali-Lombok, 2004 Aceh, 2005 Garut, 2006 Yogyakarta, and 2007 Bengkulu - Padang earthquakes (Adenan and Sarwidi, 2007; CEEDEDS, 2007). Close looking to those investigation results, non-engineered houses using masonry walls (NEHMW) were popular but always suffered most, although there were different portion in each damaged areas. In general, NEHMW has caused most loss of life and loss of properties due to those earthquakes. For many reasons, the popularity of NEHWM is going to rise. If they are not constructed properly, they are potential to become terrible killers whenever a strong earthquake occurs. This leads to focus this paper on this kind of structure. According to interviewed local people in the damaged areas, low-engineering-knowledge local builders, called mandors, lead the building of most of the failure structures. During the building process, the builders were usually strongly influenced by the owner ideas due to limited budget of the owners. Therefore, reducing casualties due to collapse non-engineered structures should involve both builders and owners. This paper summarizes the lessons learnt from those field investigations, and consequently, the need for response actions in the innovation of NEHMW to reduce the effects of future earthquake disasters in Indonesia.
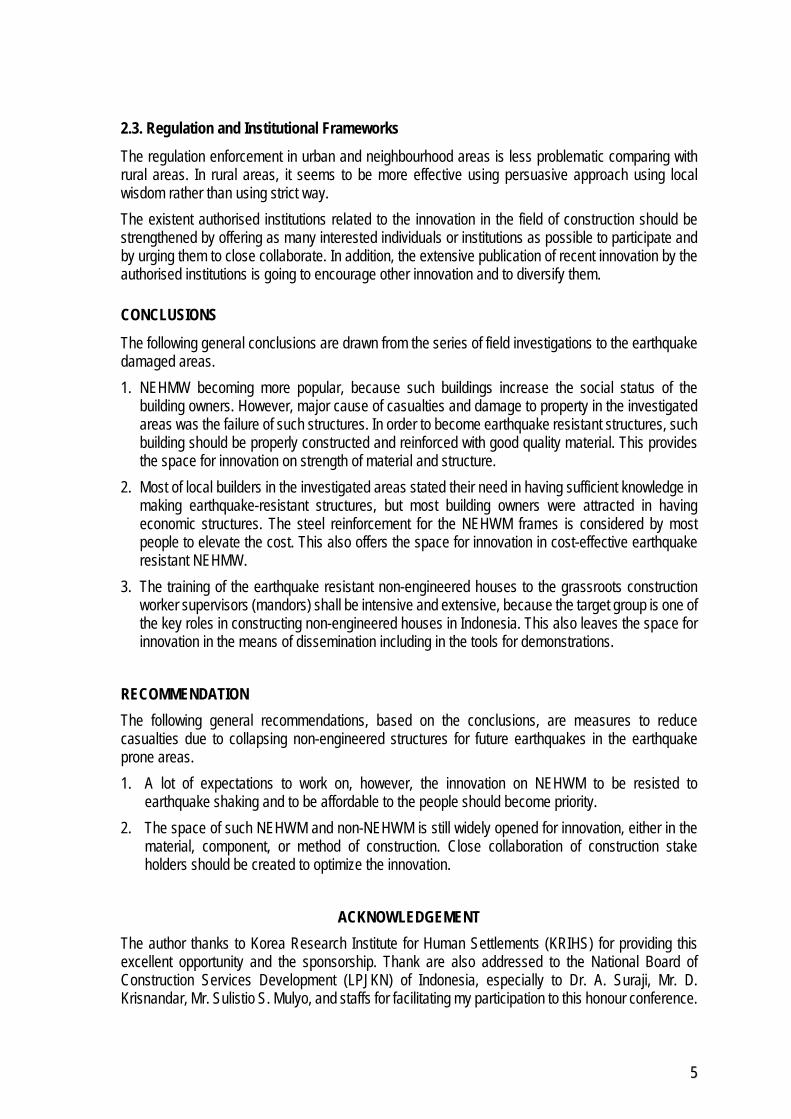
1.2. Matters and Issues to Innovate It is not easy to evaluate the dynamic performance of non-engineered structures, including NEHWM, using mathematical approach because of the wide range in the real structural element properties and in the real structural shape variations. However, field investigations to the performance of structures (failure and withstand structures) in damaged areas due to earthquakes are possible and give beneficial experiences. One of the reasons of the importance of such work is that there is always new lesson in every damaging earthquake, especially in line with the dynamic of socio-economic condition. Any structure will better withstand to earthquake shaking if the structure is as light, ductile, simple, and strong as possible (CEEDEDS, 2004; CEEDEDS, 2007; Chopra, 1995; Sarwidi, 2006; Wiegel, 1970). But, the structural characteristics will be brought to the practice by the people with many considerations, such as engineering capability, as well as social and economic condition (Bappenas, 2006; Carter, 1991; CEEDEDS, 2007; Musyafa, 2000; Sarwidi, 2007). There have been innovations in the field of earthquake resistant structures, especially for houses since many years ago (e.g. Boen, 1978). The structural materials of the houses are wood, bamboo, masonry, concrete, and their combination. Most of the design is based on the state of the art. IAEE (1986) enrich the innovation by introducing wide broad of similar innovation in other countries. Innovation has also applied by many parties in Indonesia in the area of introducing new materials, new component forms, and new construction methods, but relatively sluggish to be applied by the society due to many reasons (CEEDEDS, 2007; Musyafa, 2000). Based on the study of various references and lessons that have been obtained from earthquake damaged areas in Indonesia, the author formulate an innovation on a NEHMW model, called BARRATAGA, which is especially appropriate to earthquake prone areas. Therefore, BARRATAGA is an earthquake resistant NEHMW. The innovation is in the completeness of simple anchored concrete frames and specific reinforcement joint connectors as well as setting up sufficient sand
22
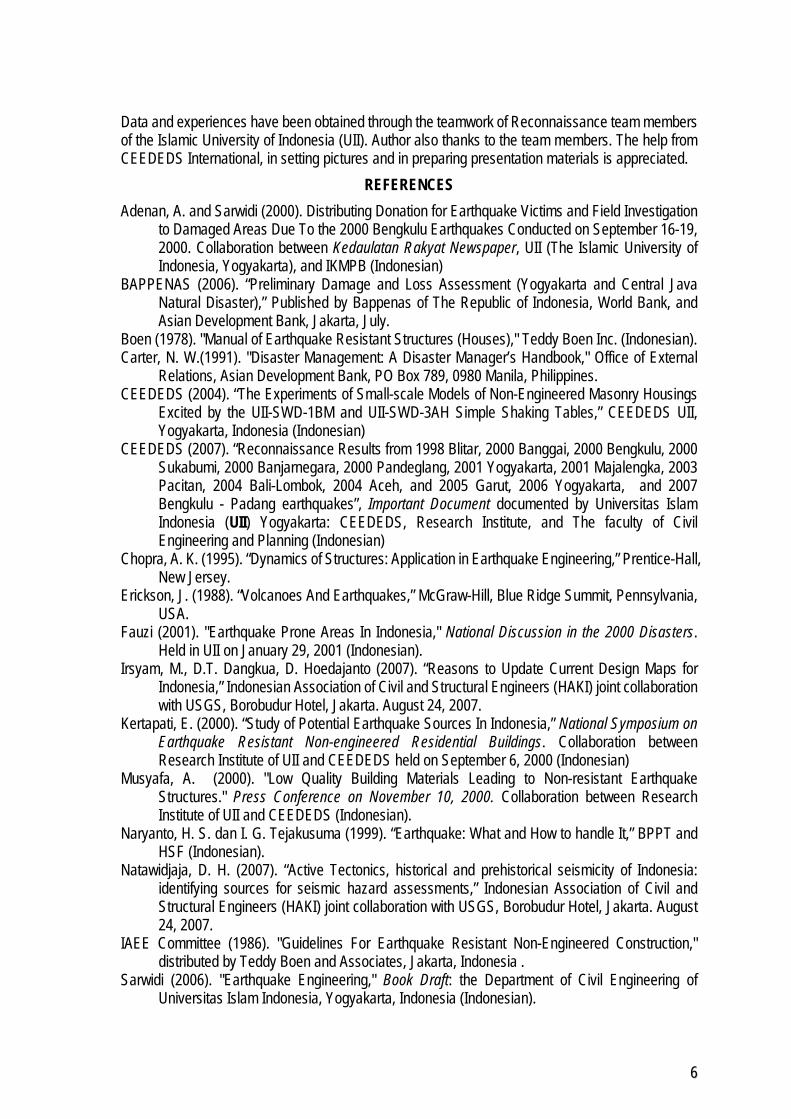
layers beneath foundations to reduce horizontal vibration from the base soil. The basic model of BARRATAGA can be seen in Figure 1. The innovation is also in the dissemination method of the BARRATAGA concept to the specific target that is foremen or mandors. In the construction of an NEHWM (non-engineered houses using masonry walls), a mandor usually play important role, since a mandor has loyal construction workers under his coordination, and a mandor usually has full authorisation from the house owner in manage the design and construction. In the dissemination, a target group of mandors are trained with brief theory and much practice. The trainings use various demonstration tools that make them easier to grasp the training content, such as seen in Figure 2. To accelerate in spreading the concept, many parties from society and government have collaborated in the dissemination, such as Islamic University of Indonesia, Peace Winds Japan, CEEDEDS International, the Government of Japan, GTZ-Germany, and Gap Inc. USA. From the first training in 2004, trained mandors have applied the BARRATAGA concept to the field for the Indonesian society. Two examples of their good practices in the application of the concept in the field prior to the 2006 Yogyakarta-Central Java earthquake can be apparently observed in Figure 3. However, in the consideration of structure price, most people still give up to the higher cost of earthquake resistant structures comparing with regular structures. Although standing on earthquake prone areas, the people tend to build regular structures with the priority in building nice-looking. Therefore, this condition leads to increasing number of failure structure due to earthquake shaking. In the consideration of construction time, people naturally rush to have permanent structures in order to recover the condition as faster as possible immediately during post earthquake disaster. This situation steers to uncontrollable construction cost. In the issue of job opportunity, however, construction growth allows unemployment people find jobs. In the issue of security, people need to protect their life and properties from the crime in their home. All of those facts and issues guide to innovation necessity.
1.3. Efficiencies and Results by Innovation The following brief description is efficiency and results by recent innovation in the field of earthquake resistant non-engineered structures. In the long term, applying BARRATAGA and other similar recent innovations to increase structural resistance to damaging earthquake is much more efficient than applying only regular structures in the earthquake risk areas. However, most people still reluctant to apply, especially in the regions that do not experience strong earthquake jolts for long time. One of the causes is the cost of steel reinforcement for the frames beyond people afford. The use of bamboo or timber reinforcement in replace of steel can answer part of the problem, since most people feel that bamboo or timber strength can not surpass the steel one. Therefore, innovation in the reinforcement materials to reduce the cost is required. Innovation to lighter and more ductile construction materials and components, such as tile, roof structures, and partition walls, escort to decrease the loads that are beared by the structure during earthquake shaking. This can reduce the size of the structural components, and consequently, shrink the price of houses that can make such structures more affordable to the people. In the short term after experiencing damaging earthquake, innovation by fabricating structural components can guide to shorten construction time.
33
1.4. Limitations and constraints of innovation Whenever having unclear direction and becoming uncontrollable, innovation could create problems, such as in the case of fabrication of components of houses. The fabrication helps to make reconstruction phase faster, but it could create more number of unemployment in normal condition, especially in the developing countries. This fact should become limitation in order innovation yields benefits to the society. The following paragraphs briefly mention the constraint of recent innovation. The collaboration among construction stake holders seems loose. In addition, the similar condition applies to the relationship between construction society and common society as construction users. Those gaps as well as the quantitative and qualitative shortage of construction experts leave away to optimum innovation. Many people tend to be difficult to change their detriment custom, for example there are very slowly to change the people for using concrete block masonry instead of clay brick masonry. Continuously using clay bricks can lead to environmental destruction. Another example, many people prefer to use very heavy tiles for their house prestige, although lighter roofs are available. In addition to be potential to create unemployment, the fabrication of structure components could not run freely, since most Indonesian people prefer variation than uniform for their house components.
1. 5. Lessons learnt
There is different characteristic of society in each region. People live close kingdoms, such as in Central and East Java usually have high spirit in working voluntarily together (gotong royong), while in other regions, people generally tend to be individualistic. Innovation is commonly faster to be created and adapted in the socialistic society rather than in the individualistic society. Therefore, selection or introduction of innovation should be appropriate for different groups of society. The steel reinforcement for the NEHWM frames is considered by most people to elevate the cost. 2. FUTURE DEVELOPMENTS
2.1. Socio-Economic and Political Constraints There are socio-economic constraints in conducting innovation, such as follows. Most people live in rural areas. The education level of most construction agents and economic level of most people lead to insufficient participation in innovation. Creation and application of innovations should be selective in order not to increase the number of unemployment. Examples of political constraints can be mentioned as follows. Since bureaucrats commonly have to face many social problems to solve in priority, their remains energy is not sufficient to withstand their political will in boosting up innovation. Some parties in the society and in governmental entity prefer to dominate rather than to share their roles or authorization. This can reduce the beneficial environment for innovation.
2. 2. Suggestions from Industry Close communication and sharing the roles or authorization among bureaucrats, construction agents, research and education institutions, as well as construction users and construction industries are necessary to create. This condition encourages innovation, since creating and applying innovation is going to be effortless.
44
2.3. Regulation and Institutional Frameworks The regulation enforcement in urban and neighbourhood areas is less problematic comparing with rural areas. In rural areas, it seems to be more effective using persuasive approach using local wisdom rather than using strict way. The existent authorised institutions related to the innovation in the field of construction should be strengthened by offering as many interested individuals or institutions as possible to participate and by urging them to close collaborate. In addition, the extensive publication of recent innovation by the authorised institutions is going to encourage other innovation and to diversify them.
CONCLUSIONS The following general conclusions are drawn from the series of field investigations to the earthquake damaged areas. 1. NEHMW becoming more popular, because such buildings increase the social status of the
building owners. However, major cause of casualties and damage to property in the investigated areas was the failure of such structures. In order to become earthquake resistant structures, such building should be properly constructed and reinforced with good quality material. This provides the space for innovation on strength of material and structure.
2. Most of local builders in the investigated areas stated their need in having sufficient knowledge in making earthquake-resistant structures, but most building owners were attracted in having economic structures. The steel reinforcement for the NEHWM frames is considered by most people to elevate the cost. This also offers the space for innovation in cost-effective earthquake resistant NEHMW.
3. The training of the earthquake resistant non-engineered houses to the grassroots construction worker supervisors (mandors) shall be intensive and extensive, because the target group is one of the key roles in constructing non-engineered houses in Indonesia. This also leaves the space for innovation in the means of dissemination including in the tools for demonstrations.
RECOMMENDATION The following general recommendations, based on the conclusions, are measures to reduce casualties due to collapsing non-engineered structures for future earthquakes in the earthquake prone areas. 1. A lot of expectations to work on, however, the innovation on NEHWM to be resisted to
earthquake shaking and to be affordable to the people should become priority. 2. The space of such NEHWM and non-NEHWM is still widely opened for innovation, either in the
material, component, or method of construction. Close collaboration of construction stake holders should be created to optimize the innovation.
ACKNOWLEDGEMENT
The author thanks to Korea Research Institute for Human Settlements (KRIHS) for providing this excellent opportunity and the sponsorship. Thank are also addressed to the National Board of Construction Services Development (LPJKN) of Indonesia, especially to Dr. A. Suraji, Mr. D. Krisnandar, Mr. Sulistio S. Mulyo, and staffs for facilitating my participation to this honour conference.
55
Data and experiences have been obtained through the teamwork of Reconnaissance team members of the Islamic University of Indonesia (UII). Author also thanks to the team members. The help from CEEDEDS International, in setting pictures and in preparing presentation materials is appreciated.
REFERENCES Adenan, A. and Sarwidi (2000). Distributing Donation for Earthquake Victims and Field Investigation
to Damaged Areas Due To the 2000 Bengkulu Earthquakes Conducted on September 16-19, 2000. Collaboration between Kedaulatan Rakyat Newspaper, UII (The Islamic University of Indonesia, Yogyakarta), and IKMPB (Indonesian)
BAPPENAS (2006). “Preliminary Damage and Loss Assessment (Yogyakarta and Central Java Natural Disaster),” Published by Bappenas of The Republic of Indonesia, World Bank, and Asian Development Bank, Jakarta, July.
Boen (1978). "Manual of Earthquake Resistant Structures (Houses)," Teddy Boen Inc. (Indonesian). Carter, N. W.(1991). "Disaster Management: A Disaster Manager’s Handbook," Office of External
Relations, Asian Development Bank, PO Box 789, 0980 Manila, Philippines. CEEDEDS (2004). “The Experiments of Small-scale Models of Non-Engineered Masonry Housings
Excited by the UII-SWD-1BM and UII-SWD-3AH Simple Shaking Tables,” CEEDEDS UII, Yogyakarta, Indonesia (Indonesian)
CEEDEDS (2007). “Reconnaissance Results from 1998 Blitar, 2000 Banggai, 2000 Bengkulu, 2000 Sukabumi, 2000 Banjarnegara, 2000 Pandeglang, 2001 Yogyakarta, 2001 Majalengka, 2003 Pacitan, 2004 Bali-Lombok, 2004 Aceh, and 2005 Garut, 2006 Yogyakarta, and 2007 Bengkulu - Padang earthquakes”, Important Document documented by Universitas Islam Indonesia (UII) Yogyakarta: CEEDEDS, Research Institute, and The faculty of Civil Engineering and Planning (Indonesian)
Chopra, A. K. (1995). “Dynamics of Structures: Application in Earthquake Engineering,” Prentice-Hall, New Jersey.
Erickson, J. (1988). “Volcanoes And Earthquakes,” McGraw-Hill, Blue Ridge Summit, Pennsylvania, USA.
Fauzi (2001). "Earthquake Prone Areas In Indonesia," National Discussion in the 2000 Disasters. Held in UII on January 29, 2001 (Indonesian).
Irsyam, M., D.T. Dangkua, D. Hoedajanto (2007). “Reasons to Update Current Design Maps for Indonesia,” Indonesian Association of Civil and Structural Engineers (HAKI) joint collaboration with USGS, Borobudur Hotel, Jakarta. August 24, 2007.
Kertapati, E. (2000). “Study of Potential Earthquake Sources In Indonesia,” National Symposium on Earthquake Resistant Non-engineered Residential Buildings. Collaboration between Research Institute of UII and CEEDEDS held on September 6, 2000 (Indonesian)
Musyafa, A. (2000). "Low Quality Building Materials Leading to Non-resistant Earthquake Structures." Press Conference on November 10, 2000. Collaboration between Research Institute of UII and CEEDEDS (Indonesian).
Naryanto, H. S. dan I. G. Tejakusuma (1999). “Earthquake: What and How to handle It,” BPPT and HSF (Indonesian).
Natawidjaja, D. H. (2007). “Active Tectonics, historical and prehistorical seismicity of Indonesia: identifying sources for seismic hazard assessments,” Indonesian Association of Civil and Structural Engineers (HAKI) joint collaboration with USGS, Borobudur Hotel, Jakarta. August 24, 2007.
IAEE Committee (1986). "Guidelines For Earthquake Resistant Non-Engineered Construction," distributed by Teddy Boen and Associates, Jakarta, Indonesia .
Sarwidi (2006). "Earthquake Engineering," Book Draft: the Department of Civil Engineering of Universitas Islam Indonesia, Yogyakarta, Indonesia (Indonesian).
66

Sarwidi (2007). "Manual of BARRATAGA using Masonry Walls," CEEDEDS International & CEMS International [email protected] (Indonesian).
Tular, R.B. (1981). "Earthquake Resistant Design," Department of Public Work, Bandung. (Indonesian).
Wiegel, R.L. (1970). “Earthquake Engineering,” Prentice-Hall, Inc., Englewood Cliffs, New Jersey, USA.
-swd-
77
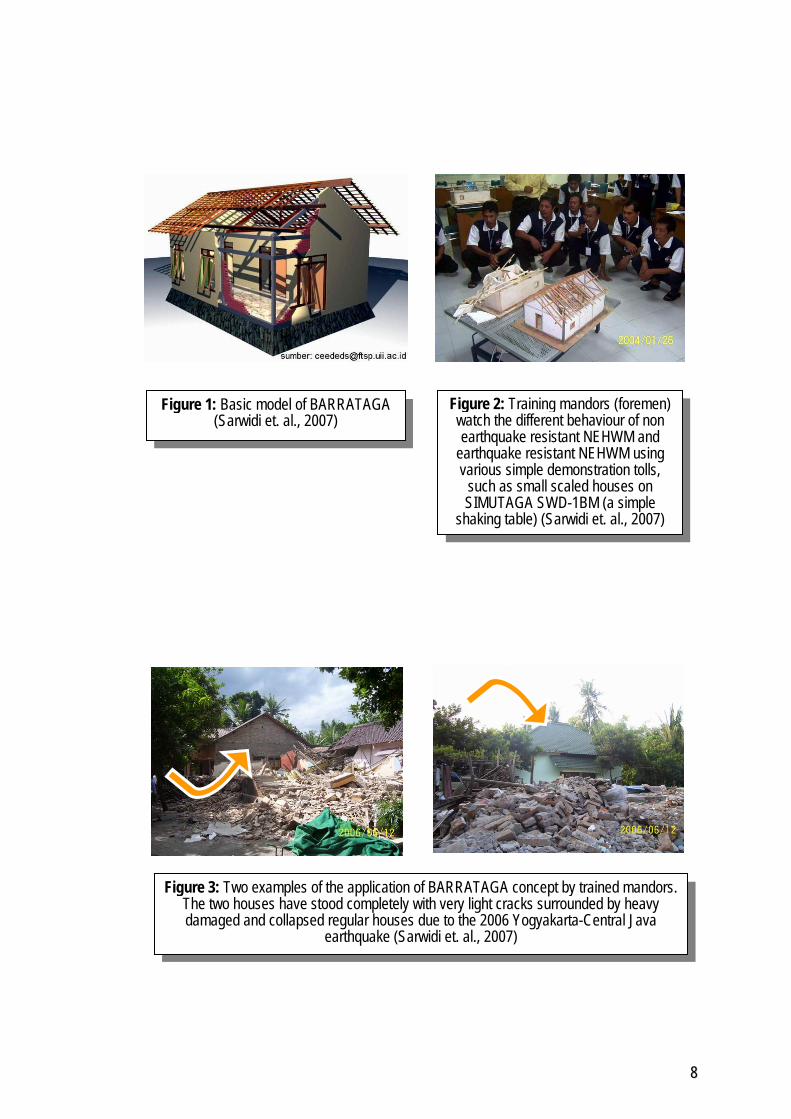
Figure 1: Basic model of BARRATAGA (Sarwidi et. al., 2007)
Figure 2: Training mandors (foremen) watch the different behaviour of non earthquake resistant NEHWM and
earthquake resistant NEHWM using various simple demonstration tolls,
such as small scaled houses on SIMUTAGA SWD-1BM (a simple
shaking table) (Sarwidi et. al., 2007)
Figure 3: Two examples of the application of BARRATAGA concept by trained mandors. The two houses have stood completely with very light cracks surrounded by heavy damaged and collapsed regular houses due to the 2006 Yogyakarta-Central Java
earthquake (Sarwidi et. al., 2007)
88