the importance statistics educationjutts/chilekeynote.pdf · life – why statistics education...
TRANSCRIPT
The Importance of
Statistics Education
Professor Jessica UttsDepartment of Statistics
University of California, Irvinehttp://www.ics.uci.edu/~jutts
Outline of Talk
What is Statistics? Four examples of statistical decisions in daily
life – why statistics education matters Introducing Statistics into grades K-12 in US
Previous attempts Common Core State Standards; revisit examples
More examples of statistics in daily life (as time permits)
What is Statistics?
“Decisions or predictions are often based on data—numbers in context. These decisions or predictions would be easy if the data always sent a clear message, but the message is often obscured by variability.”
“Statistics provides tools for describing variability in data and for making informed decisions that take it into account.”
Source: The Common Core, http://www.corestandards.org/
Decisions: Example 1
You are offered jobs as a manager at two companies. One reports that the averagesalary for managerial positions is $95,000 and the other reports that the median salary for managerial positions is $70,000. What do these numbers mean and can
they help you choose which job to take? What more do you need to know?Students should be able to answer these questions by Grade 6.
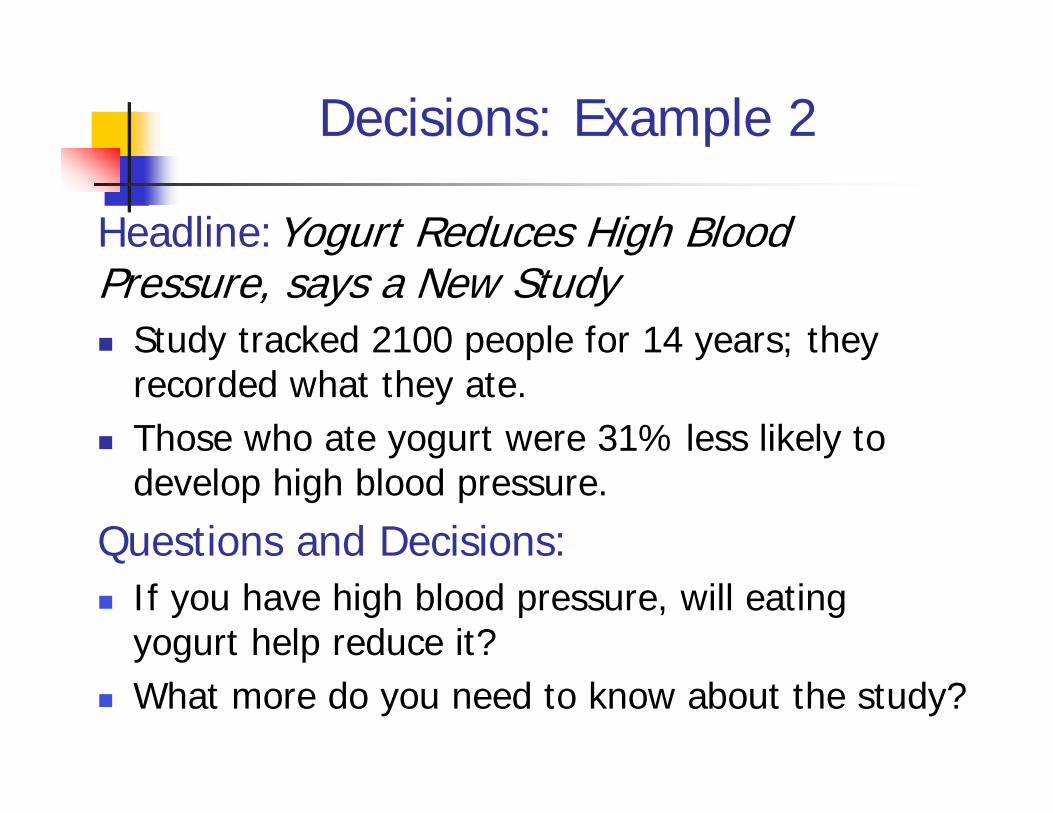
Decisions: Example 2
Headline:Yogurt Reduces High Blood Pressure, says a New Study Study tracked 2100 people for 14 years; they
recorded what they ate. Those who ate yogurt were 31% less likely to
develop high blood pressure.
Questions and Decisions: If you have high blood pressure, will eating
yogurt help reduce it? What more do you need to know about the study?
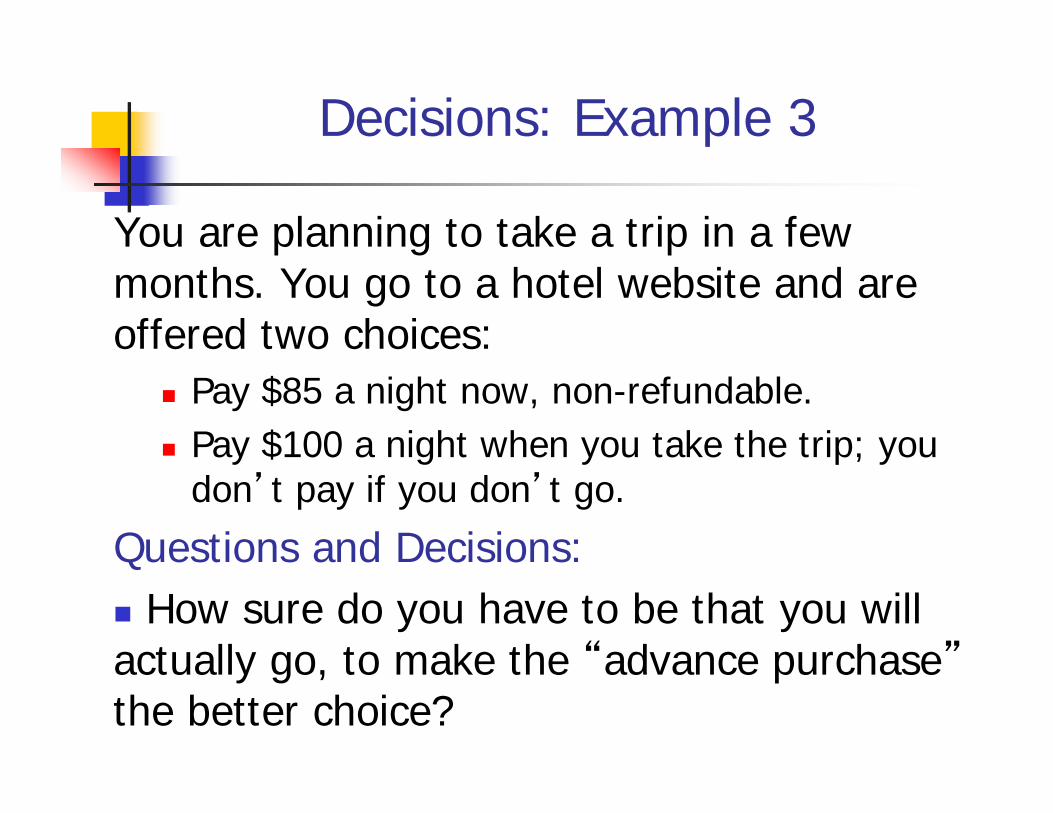
Decisions: Example 3
You are planning to take a trip in a few months. You go to a hotel website and are offered two choices:
Pay $85 a night now, non-refundable. Pay $100 a night when you take the trip; you
don’t pay if you don’t go.
Questions and Decisions: How sure do you have to be that you will actually go, to make the “advance purchase”the better choice?
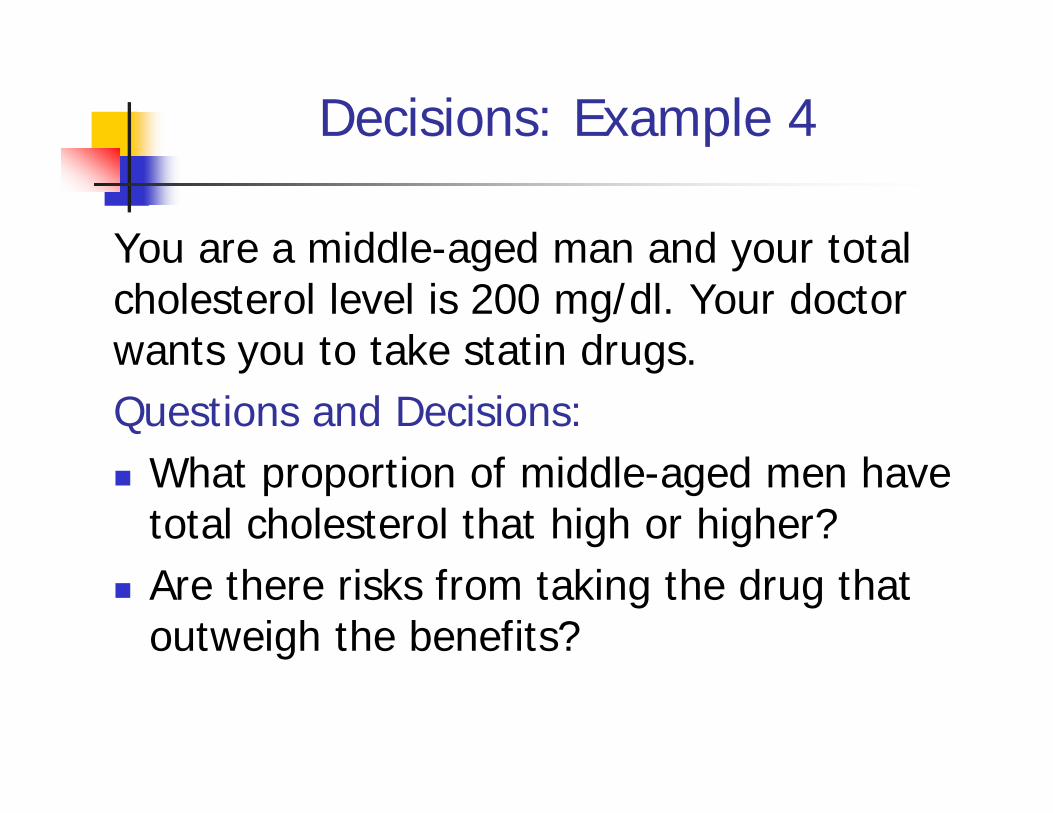
Decisions: Example 4
You are a middle-aged man and your total cholesterol level is 200 mg/dl. Your doctor wants you to take statin drugs.Questions and Decisions: What proportion of middle-aged men have
total cholesterol that high or higher? Are there risks from taking the drug that
outweigh the benefits?
The Importance of Statistics
My ideal world: All educated citizens should be able to answer those and similar questions by the time they graduate from secondary school.
Basic literacy in statistics and probability does not require advanced mathematics.
How do we get there?

New Curriculum in the US
Common Core Will be discussed in the round table Guidelines for each grade from K-12
2005: American Statistical Association (ASA) report “Guidelines for Assessment and Instruction in Statistics Education” (GAISE) Report in 2 parts – K to 12 and College
K-12 report has 108 pages of detailed guidelines on teaching statistics in K-12, with examples, teaching strategies, and so on
GAISE Report
Common Core for grades K to 5
Use data displays to ask and answer questions about data.
Understand measures used to summarize data, including the mean, median, interquartile range, and mean absolute deviation, and
Use these measures to compare datasets.
Remember Decision Example 1
You are offered jobs as a manager at two companies. One reports that the average salary for managerial positions is $95,000 and the other reports that the median salary for managerial positions is $70,000.
After Grade 5, students should understand: “Average” salary = mean = amount everyone would
get if they divided the salary money equally, but it is greatly affected by one or more very high salaries.
Median salary is the value that half of the salaries are at or above and half of the salaries are at or below.
Teaching Mean and Median to Young Children (Example from GAISE)
Data = Number of letters in children’s names. To find Median name length:
Line up all of the children in order, from shortest name to longest name.
Have one child at each end sit down. Continue until one child is left standing.
To find Mean name length: Give each child a block for each letter in their
name. Put all of the blocks together; divide equally.
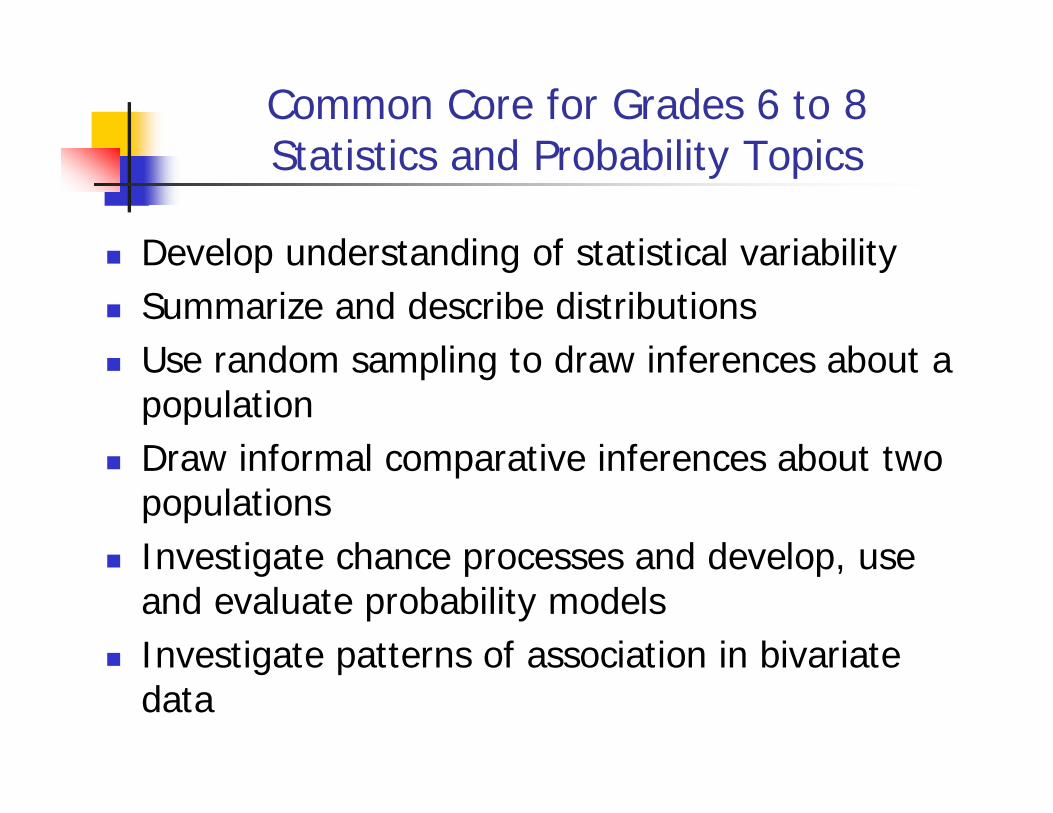
Common Core for Grades 6 to 8Statistics and Probability Topics
Develop understanding of statistical variability Summarize and describe distributions Use random sampling to draw inferences about a
population Draw informal comparative inferences about two
populations Investigate chance processes and develop, use
and evaluate probability models Investigate patterns of association in bivariate
data
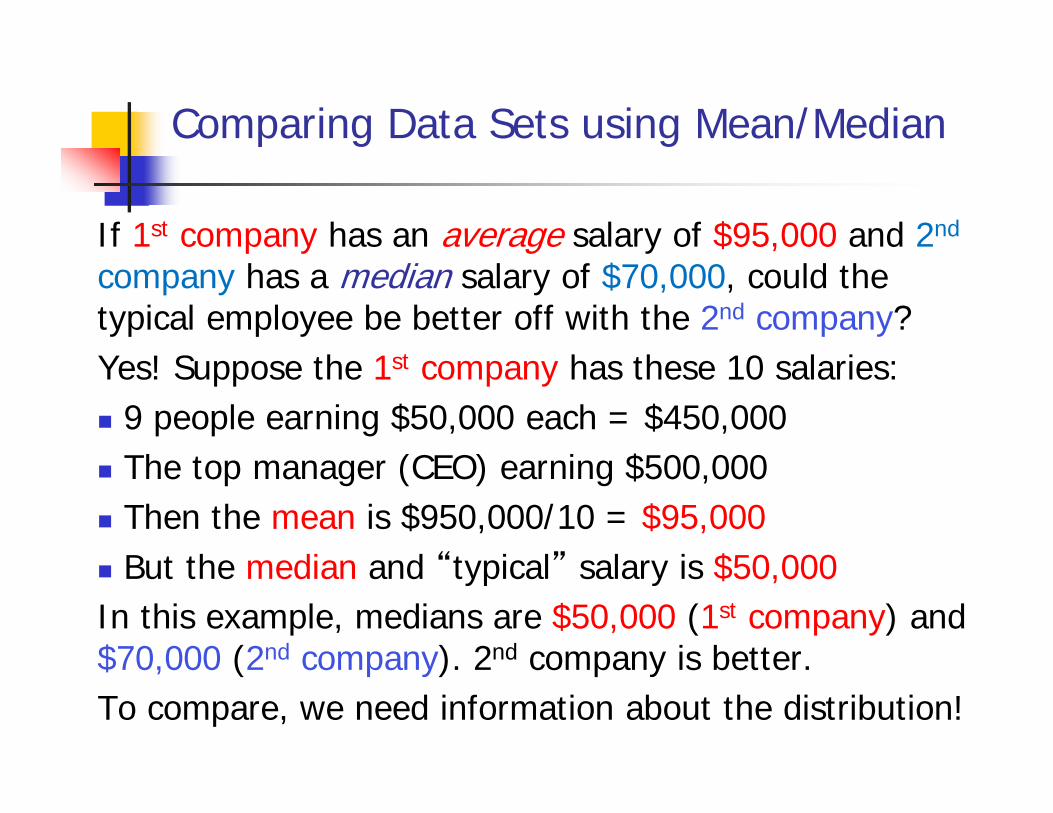
Comparing Data Sets using Mean/Median
If 1st company has an average salary of $95,000 and 2nd
company has a median salary of $70,000, could the typical employee be better off with the 2nd company? Yes! Suppose the 1st company has these 10 salaries: 9 people earning $50,000 each = $450,000 The top manager (CEO) earning $500,000 Then the mean is $950,000/10 = $95,000 But the median and “typical” salary is $50,000In this example, medians are $50,000 (1st company) and $70,000 (2nd company). 2nd company is better.To compare, we need information about the distribution!
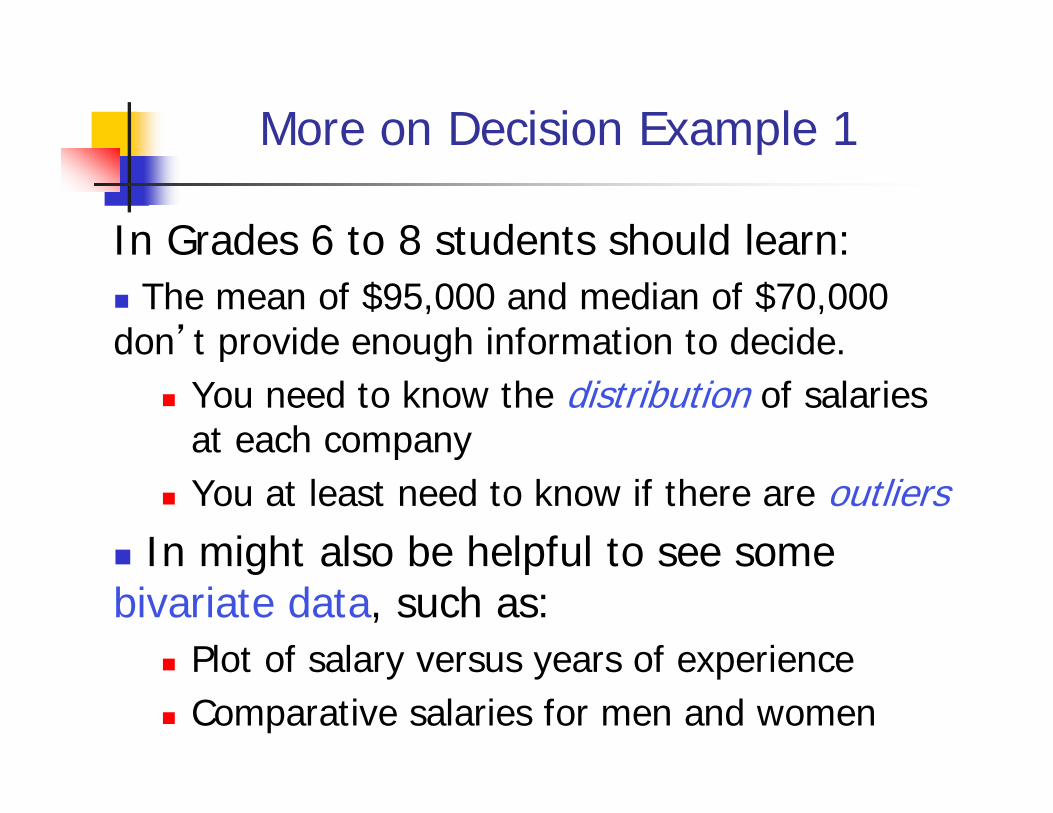
More on Decision Example 1
In Grades 6 to 8 students should learn: The mean of $95,000 and median of $70,000 don’t provide enough information to decide.
You need to know the distribution of salaries at each company
You at least need to know if there are outliers In might also be helpful to see some bivariate data, such as:
Plot of salary versus years of experience Comparative salaries for men and women
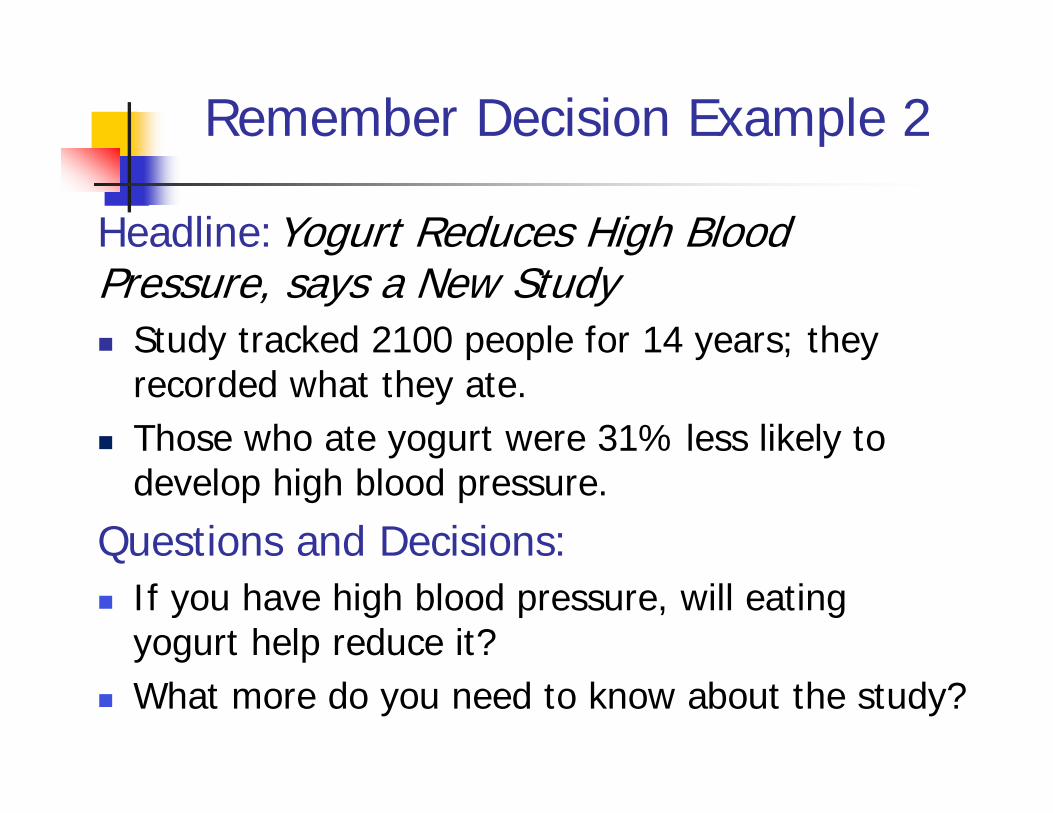
Remember Decision Example 2
Headline:Yogurt Reduces High Blood Pressure, says a New Study Study tracked 2100 people for 14 years; they
recorded what they ate. Those who ate yogurt were 31% less likely to
develop high blood pressure.
Questions and Decisions: If you have high blood pressure, will eating
yogurt help reduce it? What more do you need to know about the study?
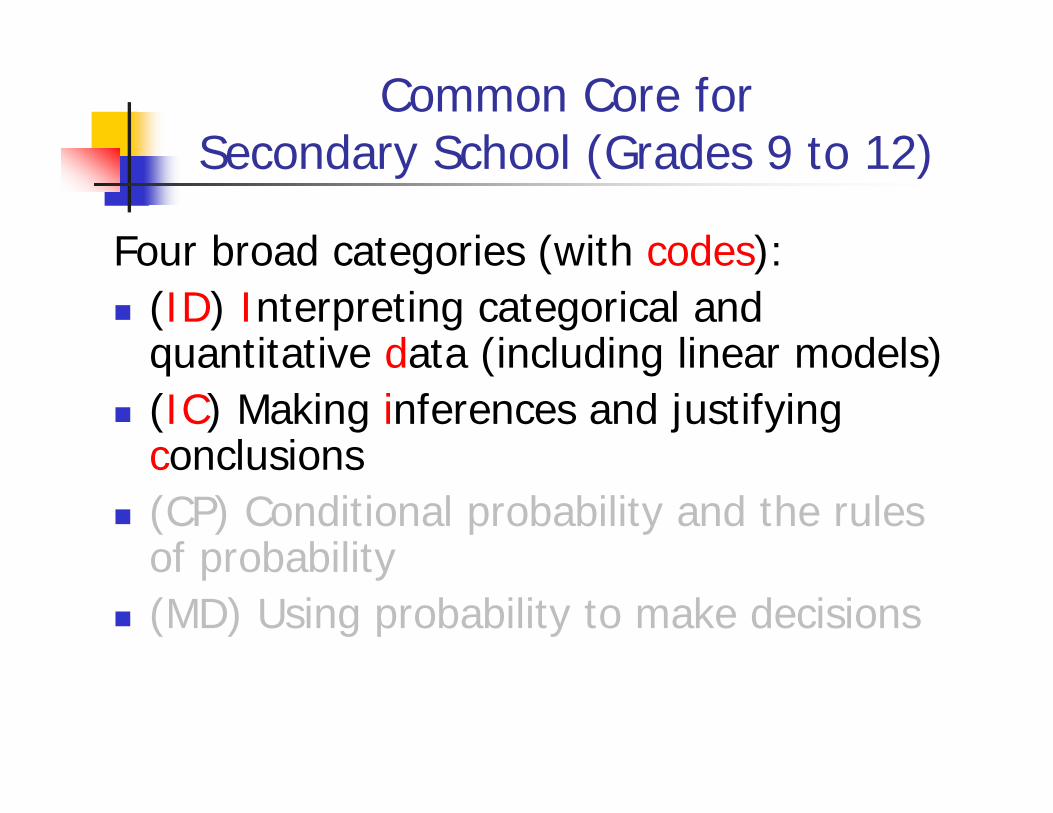
Common Core for Secondary School (Grades 9 to 12)
Four broad categories (with codes): (ID) Interpreting categorical and
quantitative data (including linear models) (IC) Making inferences and justifying
conclusions (CP) Conditional probability and the rules
of probability (MD) Using probability to make decisions
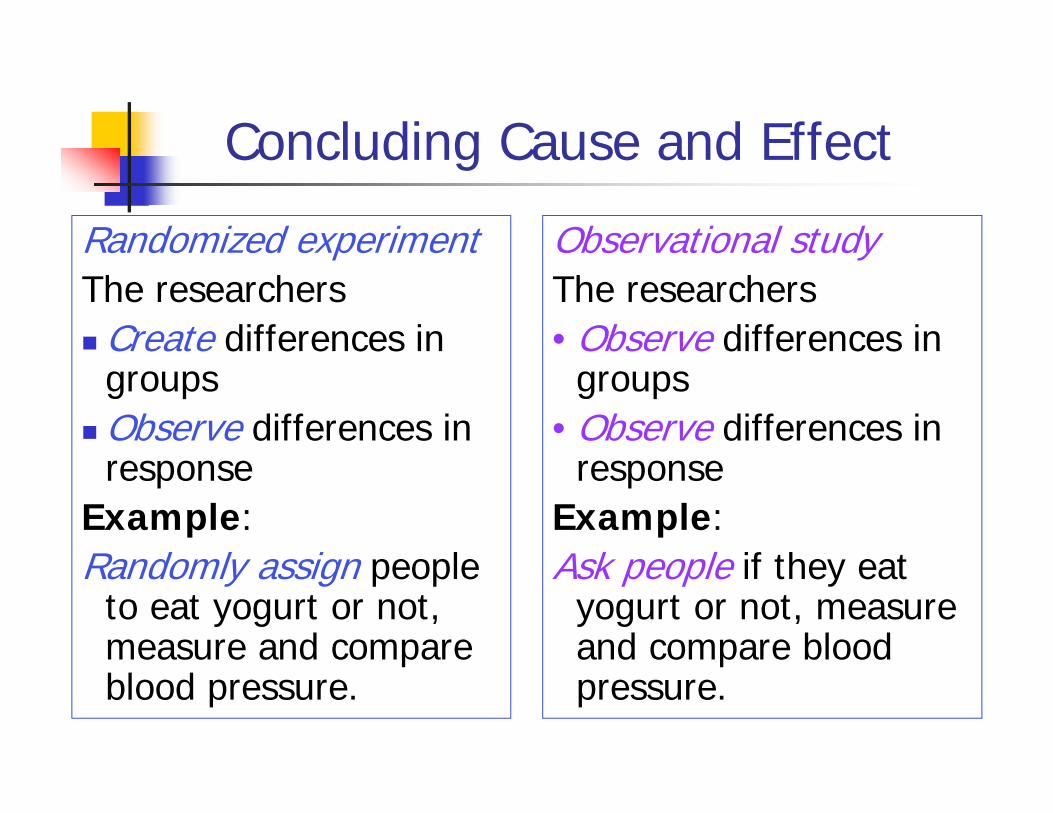
Randomized experiment The researchers Create differences in
groups Observe differences in
responseExample:Randomly assign people
to eat yogurt or not, measure and compare blood pressure.
Observational studyThe researchers • Observe differences in
groups • Observe differences in
responseExample:Ask people if they eat
yogurt or not, measure and compare blood pressure.
Concluding Cause and Effect
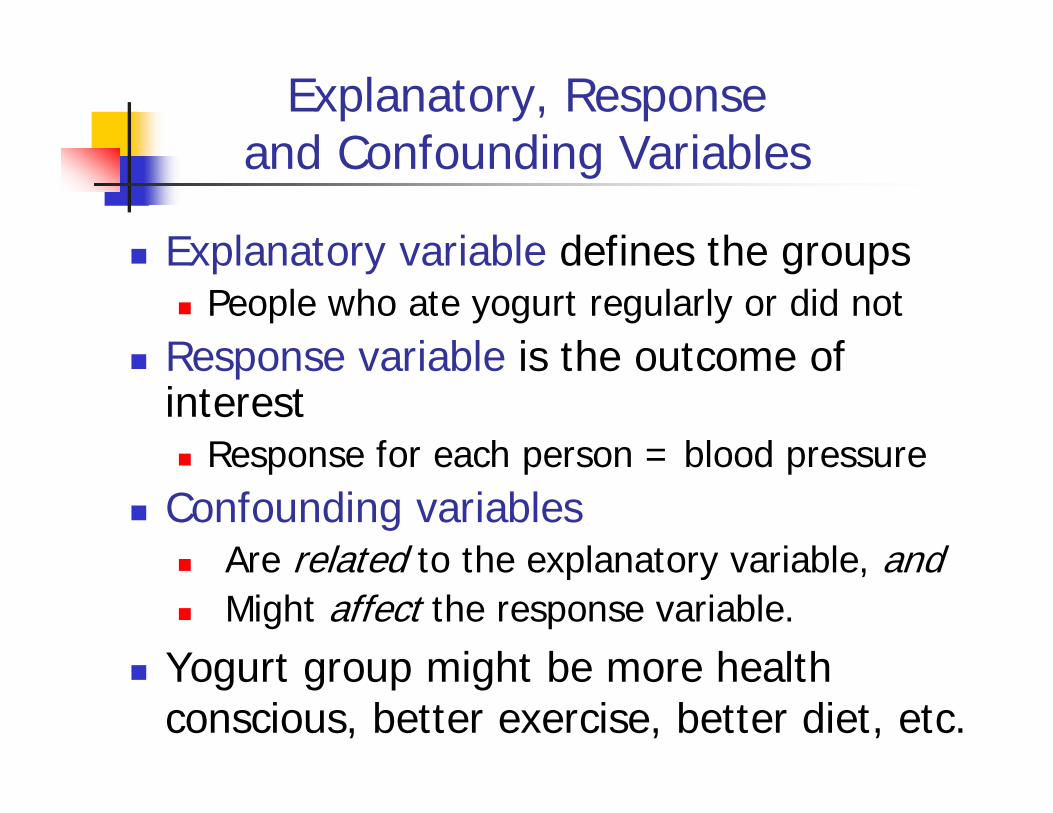
Explanatory, Response and Confounding Variables
Explanatory variable defines the groups People who ate yogurt regularly or did not
Response variable is the outcome of interest Response for each person = blood pressure
Confounding variables Are related to the explanatory variable, and Might affect the response variable.
Yogurt group might be more health conscious, better exercise, better diet, etc.
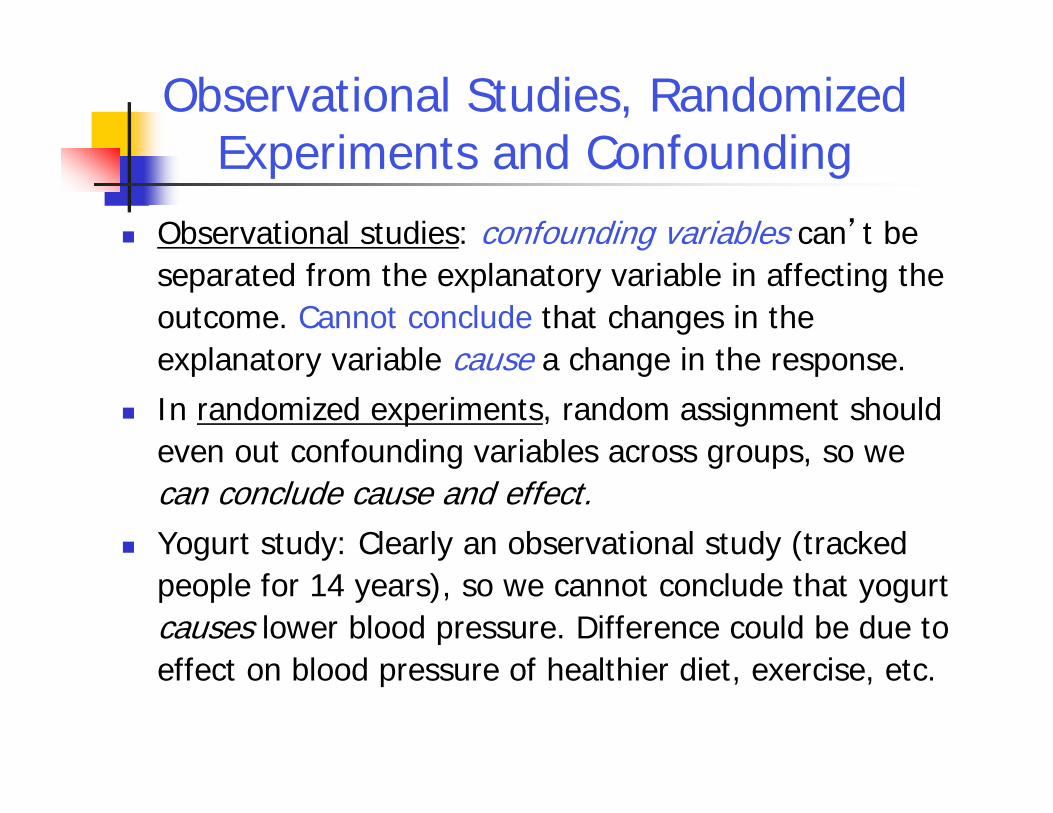
Observational Studies, Randomized Experiments and Confounding
Observational studies: confounding variables can’t be separated from the explanatory variable in affecting the outcome. Cannot conclude that changes in the explanatory variable cause a change in the response.
In randomized experiments, random assignment should even out confounding variables across groups, so we can conclude cause and effect.
Yogurt study: Clearly an observational study (tracked people for 14 years), so we cannot conclude that yogurt causes lower blood pressure. Difference could be due to effect on blood pressure of healthier diet, exercise, etc.
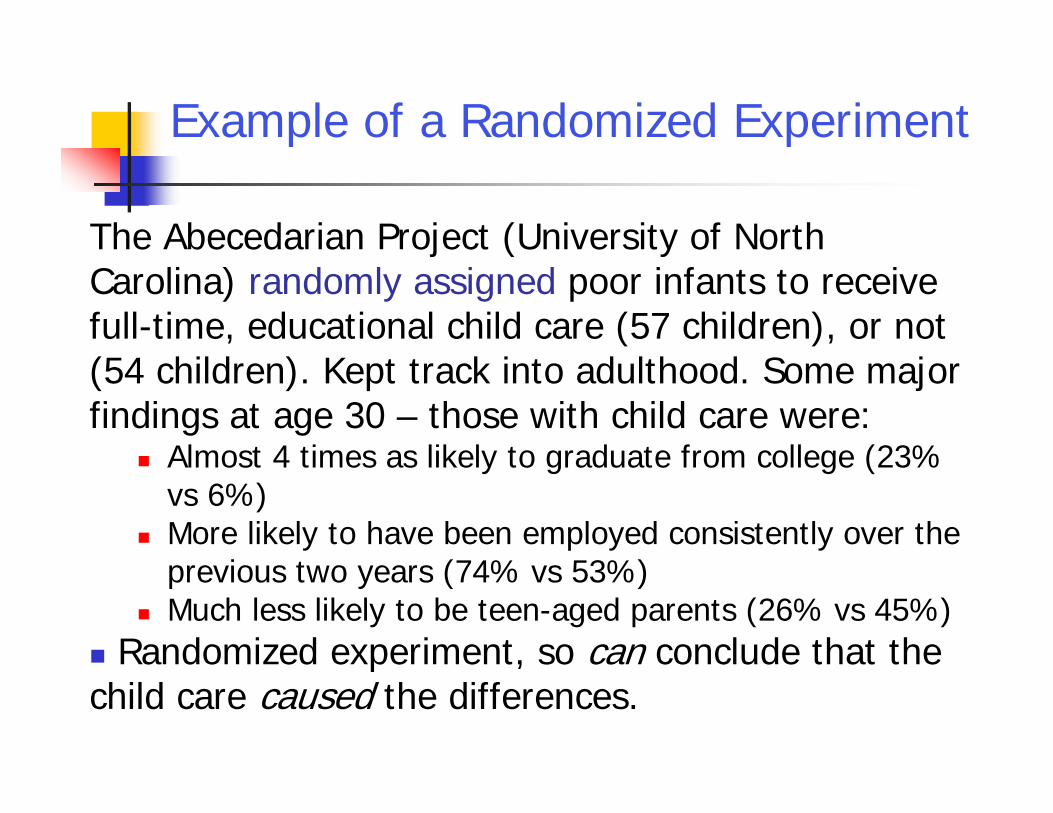
Example of a Randomized Experiment
The Abecedarian Project (University of North Carolina) randomly assigned poor infants to receive full-time, educational child care (57 children), or not (54 children). Kept track into adulthood. Some major findings at age 30 – those with child care were:
Almost 4 times as likely to graduate from college (23% vs 6%)
More likely to have been employed consistently over the previous two years (74% vs 53%)
Much less likely to be teen-aged parents (26% vs 45%) Randomized experiment, so can conclude that the child care caused the differences.
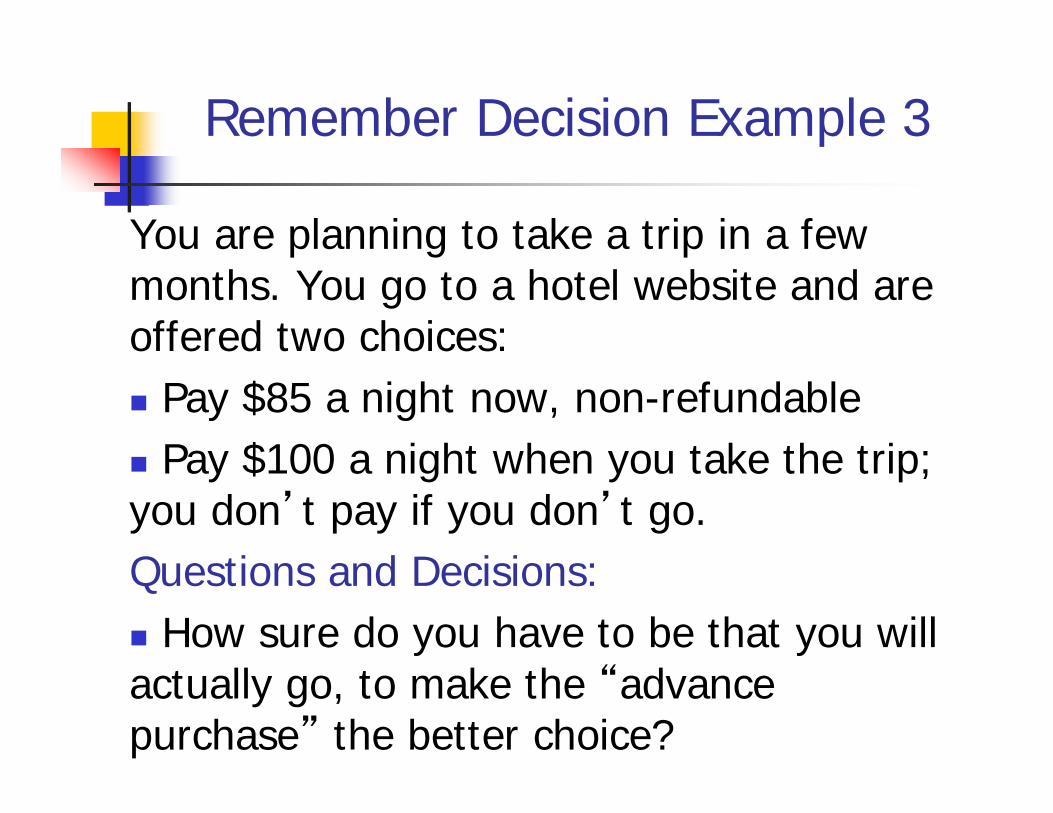
Remember Decision Example 3
You are planning to take a trip in a few months. You go to a hotel website and are offered two choices: Pay $85 a night now, non-refundable Pay $100 a night when you take the trip; you don’t pay if you don’t go.Questions and Decisions: How sure do you have to be that you will actually go, to make the “advance purchase” the better choice?
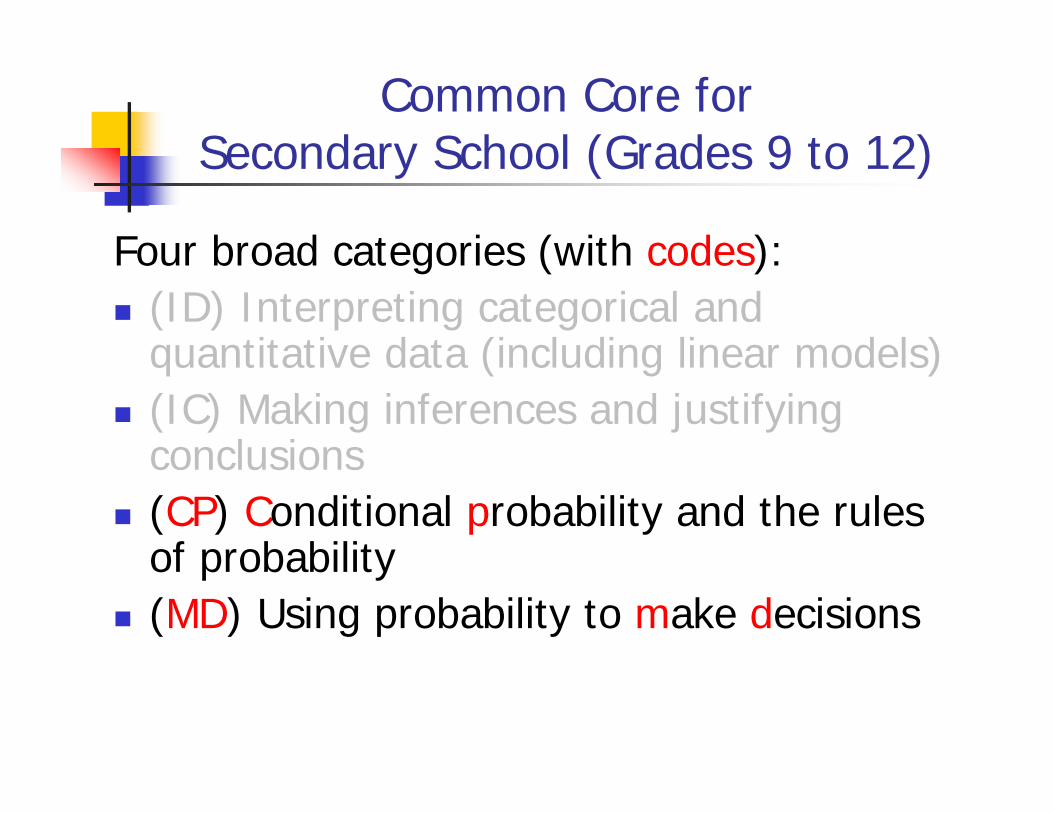
Common Core for Secondary School (Grades 9 to 12)
Four broad categories (with codes): (ID) Interpreting categorical and
quantitative data (including linear models) (IC) Making inferences and justifying
conclusions (CP) Conditional probability and the rules
of probability (MD) Using probability to make decisions
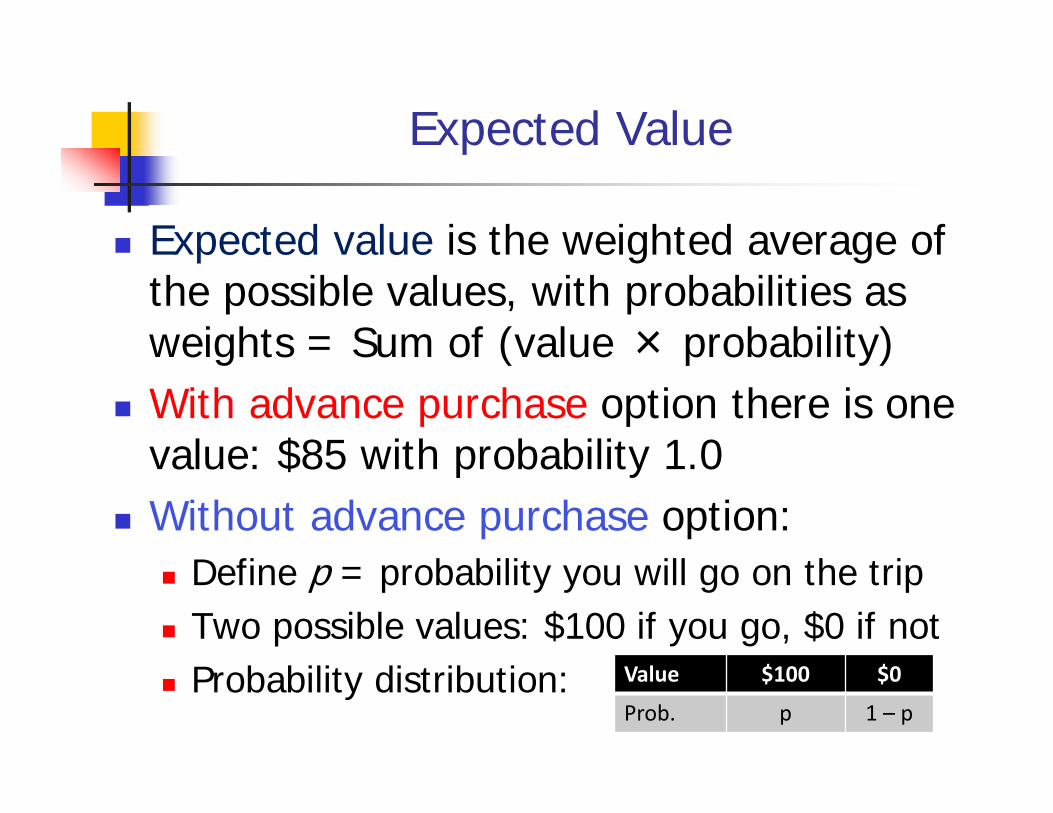
Expected Value
Expected value is the weighted average of the possible values, with probabilities as weights = Sum of (value × probability)
With advance purchase option there is one value: $85 with probability 1.0
Without advance purchase option: Define p = probability you will go on the trip Two possible values: $100 if you go, $0 if not Probability distribution: Value $100 $0
Prob. p 1 – p
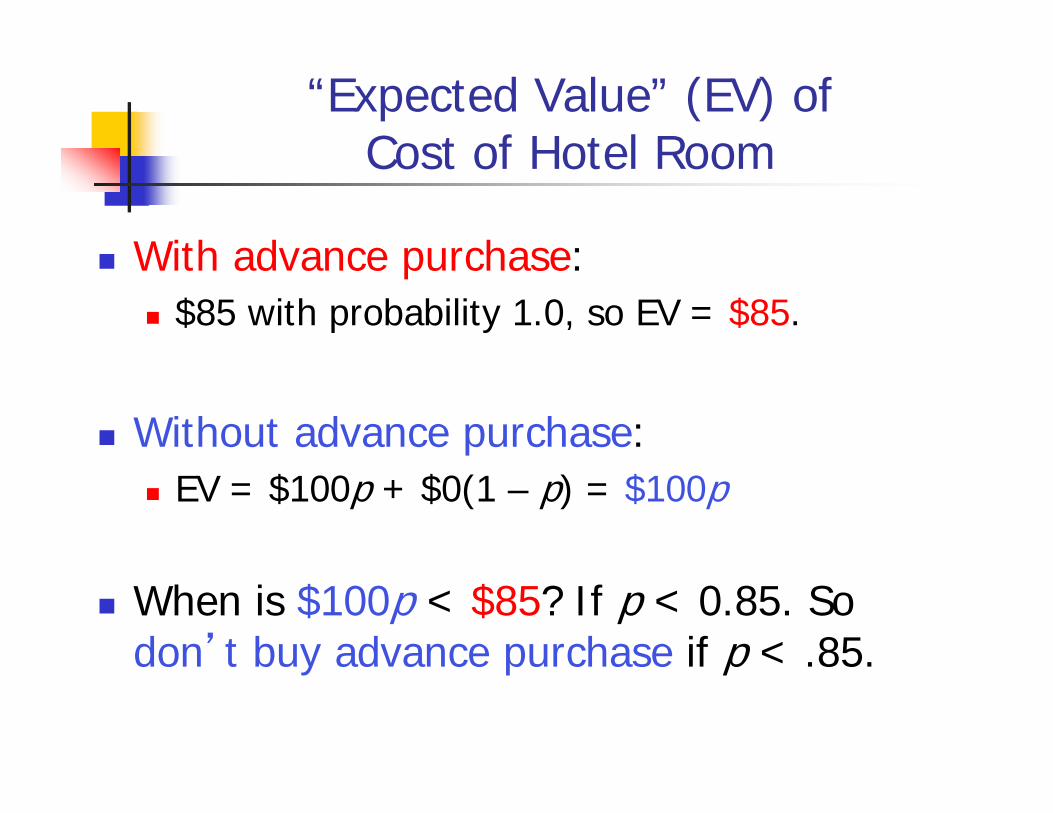
“Expected Value” (EV) of Cost of Hotel Room
With advance purchase: $85 with probability 1.0, so EV = $85.
Without advance purchase: EV = $100p + $0(1 – p) = $100p
When is $100p < $85? If p < 0.85. So don’t buy advance purchase if p < .85.
Remember Decision Example 4
You are a middle-aged man and your total cholesterol level is 200 mg/dl. Your doctor wants you to take statin drugs.Questions and Decisions: What proportion of middle-aged men have
total cholesterol that high or higher? Are there risks from taking the drug that
outweigh the benefits?
The Relevant Specific Standard
Standard ID4: Use the mean and standard deviation of a data set to fit it to a normal distribution and to estimate population percentages. Recognize that there are data sets for which such a procedure is not appropriate. Use calculators, spreadsheets, and tables to estimate areas under the normal curve.
Cholesterol Example
What proportion of middle-aged men have “borderline” high cholesterol = 200 or more?
“High” cholesterol is 240 or more. What proportion have high cholesterol?
From previous data, middle-aged men’s cholesterol levels are approximately normally distributed with mean of 222 mg and standard deviation of 37 mg.
Excel, free software and websites can find probabilities for normal distributions.
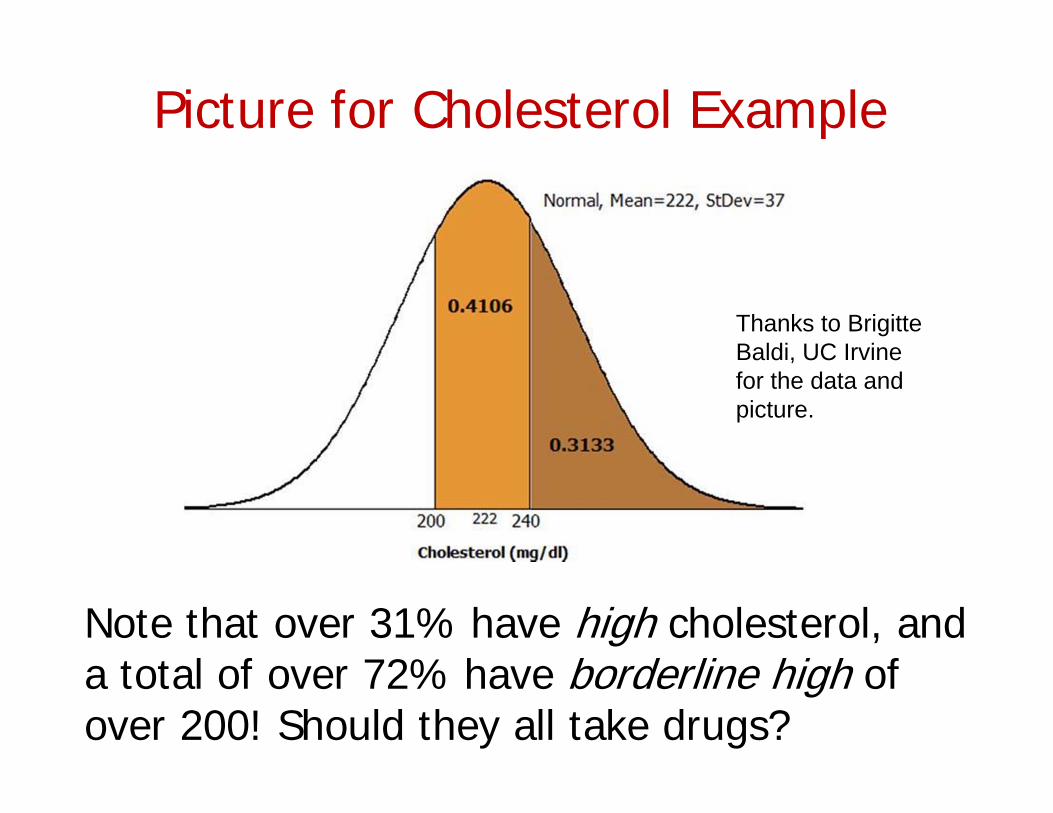
Picture for Cholesterol Example
Note that over 31% have high cholesterol, and a total of over 72% have borderline high of over 200! Should they all take drugs?
Thanks to Brigitte Baldi, UC Irvine for the data and picture.
More Examples of Importance of Understanding Statistics in Daily Life
The problem of “multiple testing” Weighing competing risks: Risk, relative
risk, absolute risk Poor intuition about probability
Real Relationships or ChanceDoes eating cereal produce boys?
Headline in New Scientist: “Breakfast cereal boosts chances of conceiving boys”Numerous other media stories of this study.
Study in Proc. of Royal Soc. B showed of women who ate cereal, 59% had boys, of women who didn’t, 43% had boys.
Problem #1: Headline implies eating cereal causes change in probability, but this was an observational study. Confounding likely!
The Problem of Multiple Testing
The study investigated 132 foods the women ate, at 2 time periods for each food = 264 possible tests!
By chance alone, some food would show a difference in birth rates for boys and girls.
Main issue: Selective reporting of results when many relationships are examined, not adjusted for multiple testing. Quite likely that there are “false positive” results.

Competing Risks:Avoiding Risk May Put You in Danger
In 1995, UK Committee on Safety of Medicines issued warning that new oral contraceptive pills “increased the risk of potentially life‐threatening blood clots in the legs or lungs by twofold – that is, by 100%”over the old pills
Letters to 190,000 medical practitioners; emergency announcement to the media
Many women stopped taking pills.
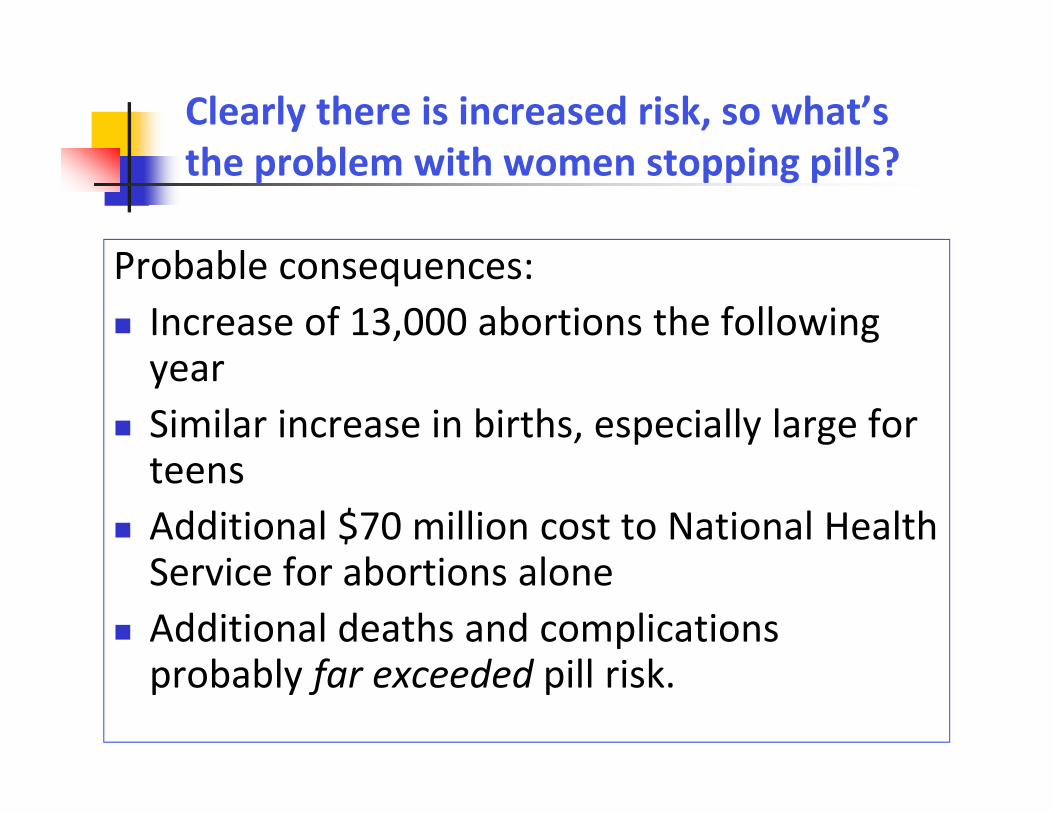
Clearly there is increased risk, so what’s the problem with women stopping pills?
Probable consequences: Increase of 13,000 abortions the following year
Similar increase in births, especially large for teens
Additional $70 million cost to National Health Service for abortions alone
Additional deaths and complications probably far exceeded pill risk.
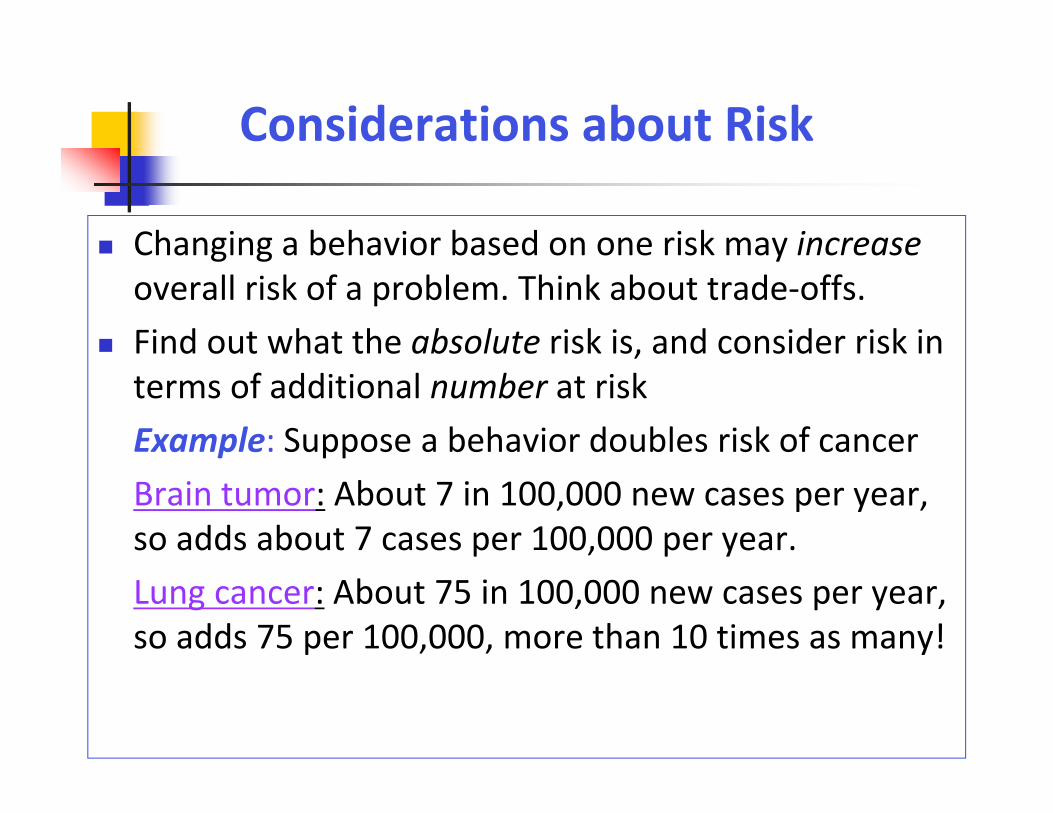
Considerations about Risk
Changing a behavior based on one risk may increaseoverall risk of a problem. Think about trade‐offs.
Find out what the absolute risk is, and consider risk in terms of additional number at riskExample: Suppose a behavior doubles risk of cancerBrain tumor: About 7 in 100,000 new cases per year, so adds about 7 cases per 100,000 per year. Lung cancer: About 75 in 100,000 new cases per year, so adds 75 per 100,000, more than 10 times as many!
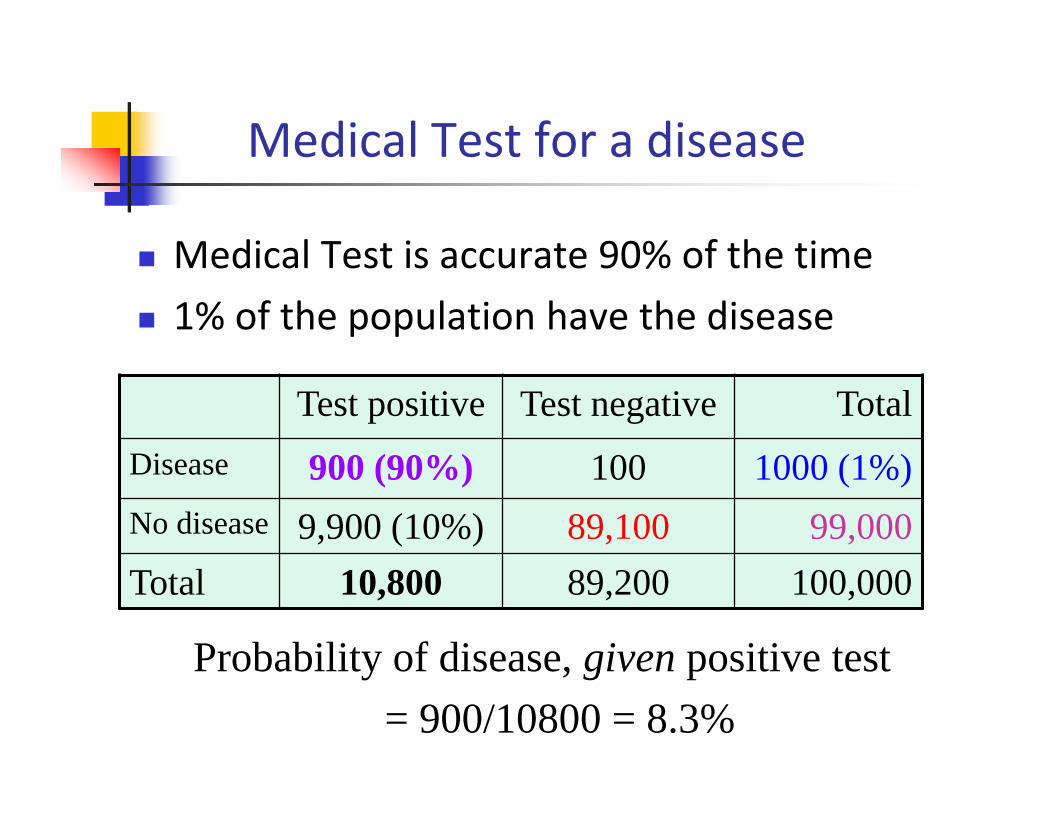
Medical Test for a disease
Medical Test is accurate 90% of the time 1% of the population have the disease
Test positive Test negative TotalDisease 900 (90%) 100 1000 (1%)No disease 9,900 (10%) 89,100 99,000Total 10,800 89,200 100,000
Probability of disease, given positive test = 900/10800 = 8.3%
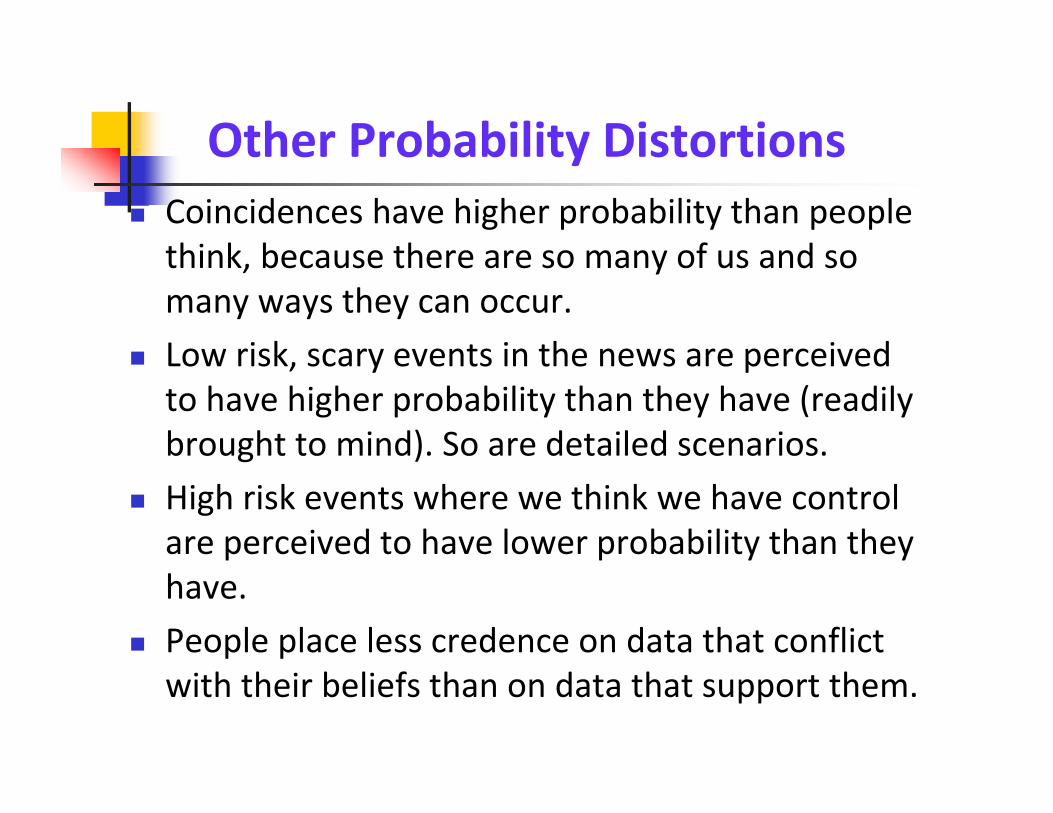
Other Probability Distortions Coincidences have higher probability than people think, because there are so many of us and so many ways they can occur.
Low risk, scary events in the news are perceived to have higher probability than they have (readily brought to mind). So are detailed scenarios.
High risk events where we think we have control are perceived to have lower probability than they have.
People place less credence on data that conflict with their beliefs than on data that support them.
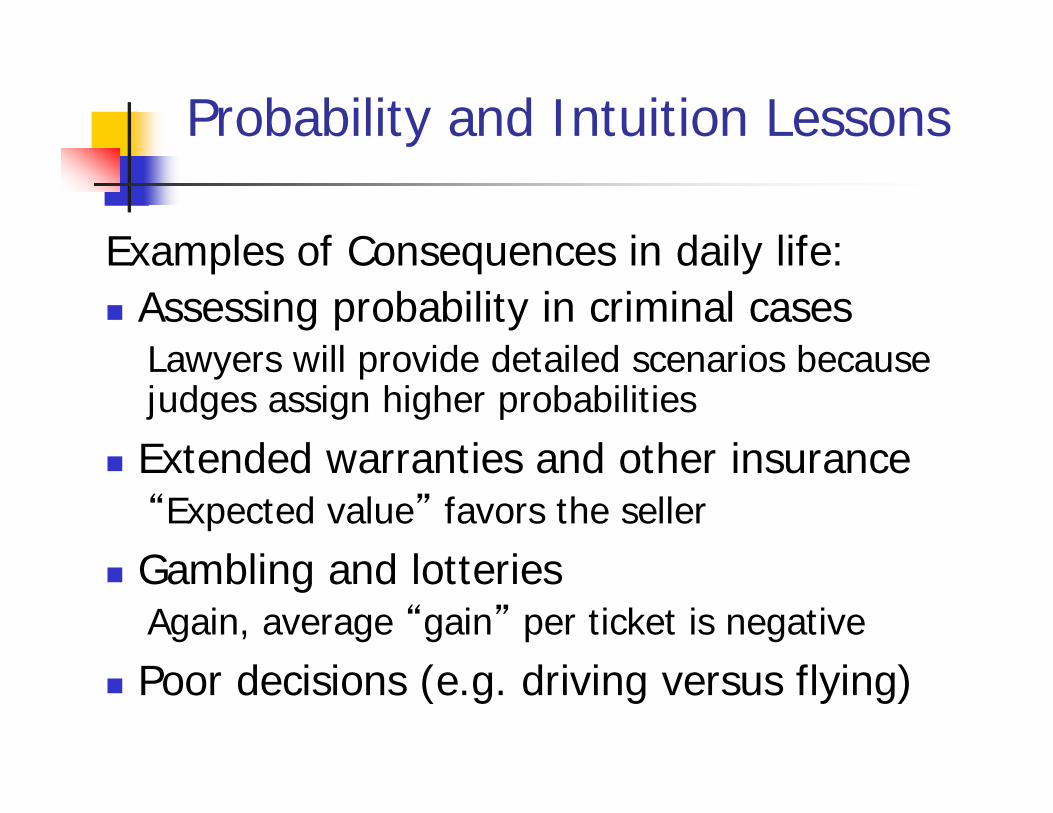
Probability and Intuition Lessons
Examples of Consequences in daily life: Assessing probability in criminal cases
Lawyers will provide detailed scenarios because judges assign higher probabilities
Extended warranties and other insurance“Expected value” favors the seller
Gambling and lotteriesAgain, average “gain” per ticket is negative
Poor decisions (e.g. driving versus flying)
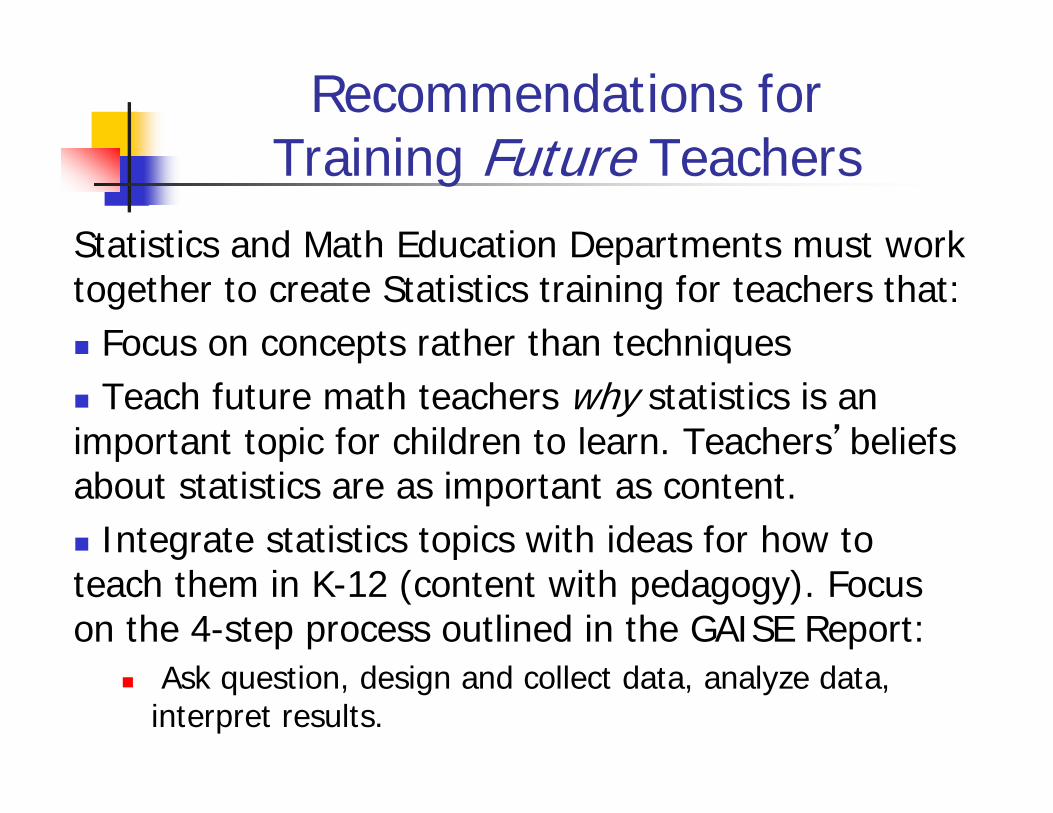
Recommendations for Training Future Teachers
Statistics and Math Education Departments must work together to create Statistics training for teachers that: Focus on concepts rather than techniques Teach future math teachers why statistics is an important topic for children to learn. Teachers’beliefs about statistics are as important as content. Integrate statistics topics with ideas for how to teach them in K-12 (content with pedagogy). Focus on the 4-step process outlined in the GAISE Report:
Ask question, design and collect data, analyze data, interpret results.

Recommendations for Current Teachers
Already there are many resources available. Administrators need to provide information and opportunities for teachers to utilize them.
Professional organizations (ASA, MAA, NCTM) must work together to offer and publicize the existence of training materials, workshops, etc.
As with new teachers, attitude toward statistics is crucial!
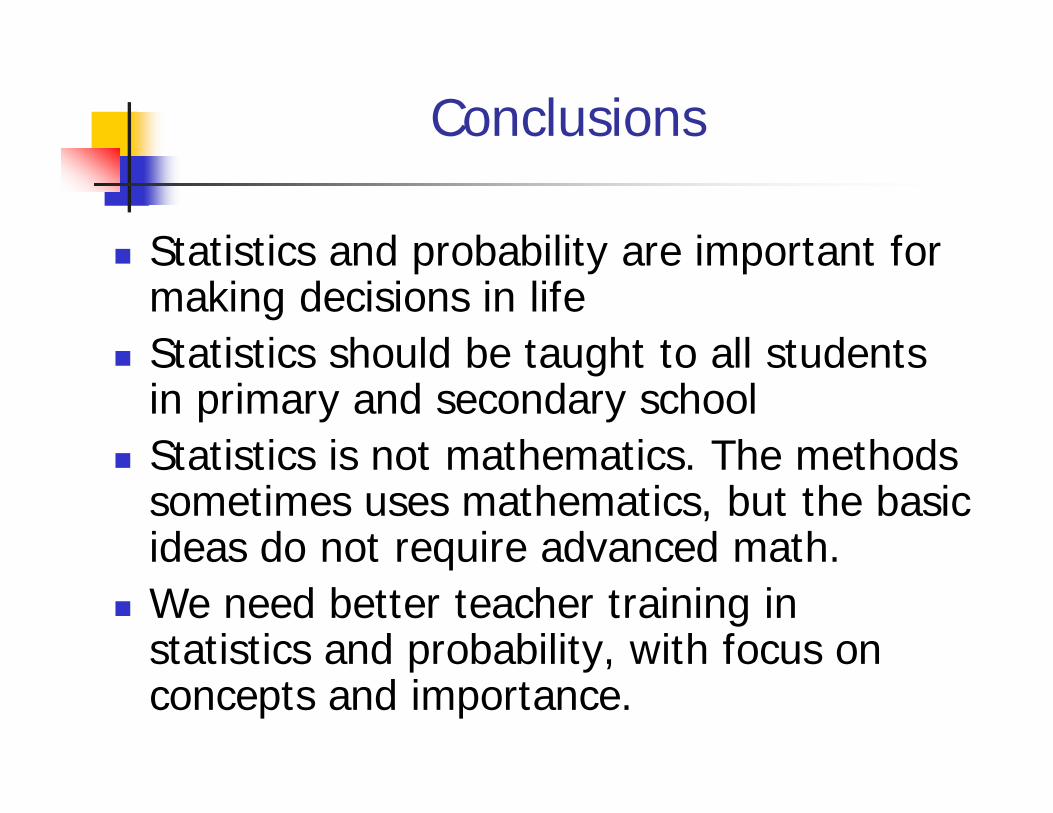
Conclusions
Statistics and probability are important for making decisions in life
Statistics should be taught to all students in primary and secondary school
Statistics is not mathematics. The methods sometimes uses mathematics, but the basic ideas do not require advanced math.
We need better teacher training in statistics and probability, with focus on concepts and importance.
Acknowledgements
Thanks for these people for help with some content: Christine Franklin, University of Georgia Roxy Peck, California State Polytechnic
University Brigitte Baldi, University of California,
Irvine