the importance of environmental factors in soil fertility assessments. i. dry matter production
TRANSCRIPT
Aust. J. Agric. Res., 1974, 25, 299-308
The Importance of Environmental Factors in Soil Fertility Assessments. I Dry Matter Production
R. C. StefansonA and N. Collis-GeorgeB
A Waite Agricultural Research Institute, University of Adelaide, Glen Osmond, S.A. 5064. Department of Soil Science, University of Sydney, N.S.W. 2006.
Abstract The importance of environmental factors on assessments of soil fertility was examined by means of pot experiments in the glasshouse.
A preliminary experiment showed, over the course of 12 months of testing, that the fertility ratio varied with the season.
In the main experiment each of two soils received nine chemical treatments in an omission-type experimental design. All chemical treatments were subjected to three different light regimes obtained by shading and to three soil temperatures. They were repeated at three different seasons of the year.
Plants growing under acute mineral deficiency responded to changes in the environmental con- ditions and the deficiency became less acute the more the physical conditions favoured plant growth. Changes in environmental conditions were able to eliminate a marginal deficiency of plant nutrient.
Because the results show many first and second order interactions between root temperature, light intensity and season, and because of the different yield responses to these factors for different soils and for different nutrients, an assessment of fertility by means of fertility ratios under one set of pot culture conditions cannot easily be applied to other situations.
Introduction Ideally, assessments of soil fertility should provide an evaluation of the potential
of the soil to satisfy the requirements of a plant, and give an indication of fertilizer requirements for optimal productivity. Measurements are still being made by methods that differ widely in their underlying assumptions and techniques, yet all need to be correlated with field performance. However, because of variation in the physical environment, field experiments require expensive repetition in order to obtain mean- ingful results.
Dissatisfaction is often expressed with each of the present methods of assessing fertility, but Webb (1959) concluded that the omission type of design permits a reason- able estimation of plant nutrient requirements with an economical number of pots. However, it provides no estimate of plant response to different rates of application of nutrients. It is commonly assumed that pot trial results are more closely related to field results than are laboratory assessments. The significance of the correlation will be determined by the biological responses of the plant to the physical environment of the soil and to the micrometeorological conditions in the field (Collis-George and Davey 1960) compared with those in the glasshouse.
The fertility ratio is defined as the ratio of the yield of the complete fertilizer treatment minus one nutrient to that of the complete fertilizer treatment. This ratio has been used in circumstances where the variation of the environment was uncon- trolled and unknown, e.g. by Jenny et al. (1950) and Anderson (1952). A preliminary
R. C. Stefanson and N. Collis-George
experiment described in this paper shows that the fertility ratio for the minus nitrogen treatment indicated a deficiency of nitrogen under some environmental conditions, but an excess under others.
Most of the published work on environmental factors concerns specific physio- logical processes and single factors in the environment, e.g. the effect of light or soil temperature alone on the nitrogen nutrition and dry weight distribution of plants is well documented (Deinum 1971; Luxmoore and Millington 1971); but very few workers have examined multi-variable systems.
The program had two aims: (i) to increase the evidence concerning the influence of climatic environment on plant yield and nutrient uptake, and (ii) to examine the interpretation of pot trial data. Briefly, the program was planned as a succession of similar nutritional experiments spanning several seasons of the year, with control of soil temperature and with variation of the seasonal light intensity.
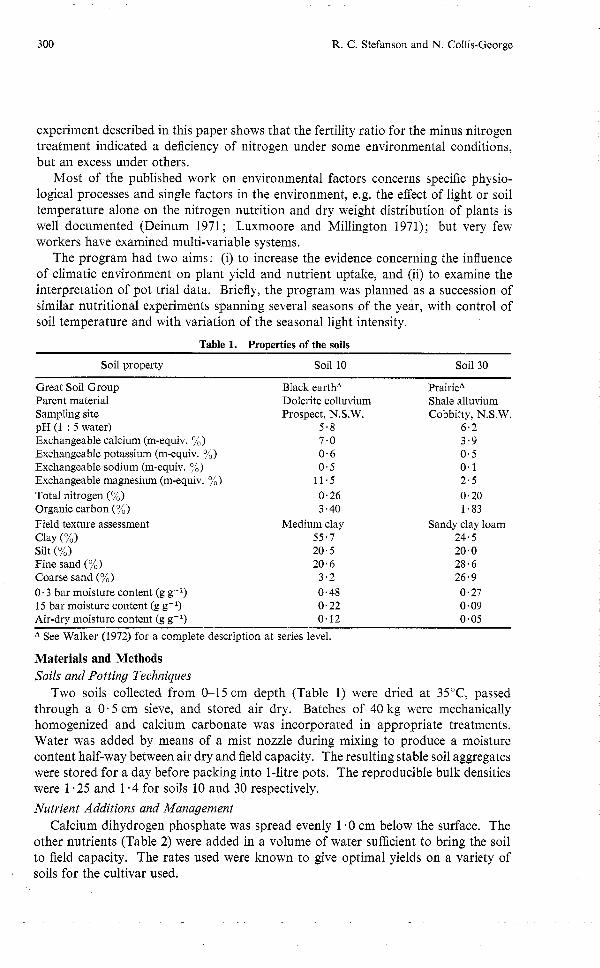
Table 1. Properties of the soils
Soil property Soil 10 Soil 30
Great Soil Group Black earthA PrairieA Parent material Dolerite colluvium Shale alluvium Sampling site Prospect, N.S.W. Cobbitty, N.S.W. pH (1 : 5 water) 5.8 6.2 Exchangeable calcium (m-equiv. %) 7.0 3.9 Exchangeable potassium (m-equiv. %) 0.6 0.5 Exchangeable sodium (m-equiv. %) 0.5 0.1 Exchangeable magnesium (m-equiv. %) 11.5 2.5 Total nitrogen (%) 0.26 0.20 Organic carbon (%) 3.40 1.83 Field texture assessment Medium clay Sandy clay loam Clay (%I 55.7 24.5 Silt (%) 20.5 20.0 Fine sand (%) 20.6 28.6 Coarse sand (%) 3.2 26.9 0.3 bar moisture content (g g-l) 0.48 0.27 15 bar moisture content (g g-l) 0.22 0.09 Air-dry moisture content (g g-l) 0.12 0.05
A See Walker (1972) for a complete description at series level.
Materials and Methods Soils and Potting Techniques
Two soils collected from 0-15 cm depth (Table 1) were dried at 35"C, passed through a 0 . 5 cm sieve, and stored air dry. Batches of 40 kg were mechanically homogenized and calcium carbonate was incorporated in appropriate treatments. Water was added by means of a mist nozzle during mixing to produce a moisture content half-way between air dry and field capacity. The resulting stable soil aggregates were stored for a day before packing into 1-litre pots. The reproducible bulk densities were 1 .25 and 1 . 4 for soils 10 and 30 respectively.
Nutrient Additions and Management Calcium dihydrogen phosphate was spread evenly 1 . 0 cm below the surface. The
other nutrients (Table 2) were added in a volume of water sufficient to bring the soil to field capacity. The rates used were known to give optimal yields on a variety of soils for the cultivar used.
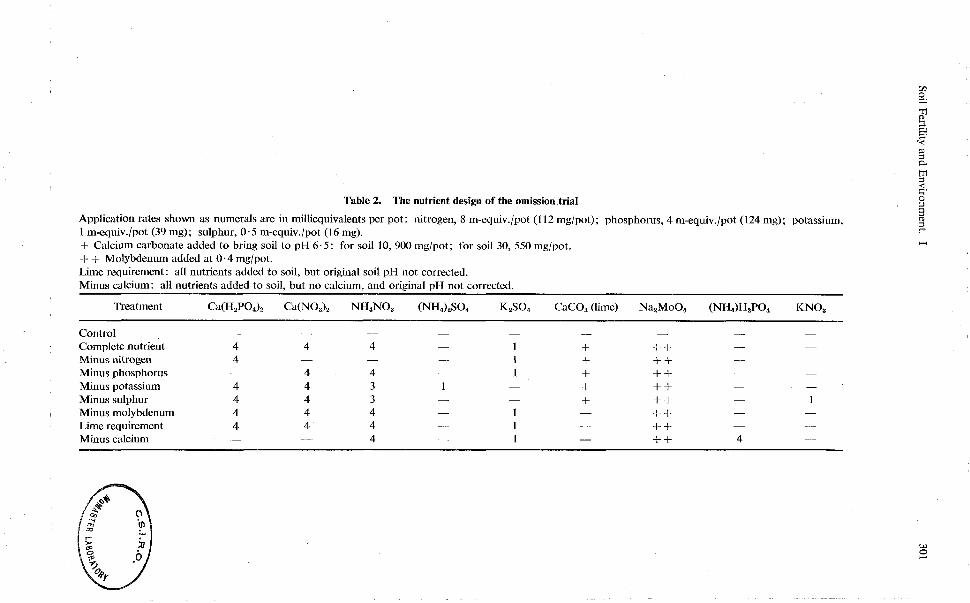
Table 2. The nutrient design of the omission trial
Application rates shown as numerals are in milliequivalents per pot: nitrogen, 8 m-equiv./pot (1 12 mglpot); phosphorus, 4 m-equiv./pot (124 mg); potassium, 1 m-equiv./pot (39 mg); sulphur, 0.5 m-equiv./pot (1 6 mg). + Calcium carbonate added to bring soil to pH 6 . 5 : for soil 10, 900 mg/pot; for soil 30, 550 mglpot. + + Molybdenum added at 0.4 mglpot. Lime requirement: all nutrients added to soil, but original soil pH not corrected. Minus calcium: all nutrients added to soil, but no calcium, and original pH not corrected.
Treatment Ca(HzP0.J2 Ca(NO,), NH,NO, (NH,),SO, K,SO, CaCO, (lime) Na,MoO, (NH,)H,PO, KNO,
Control - - - -
Complete nutrient 4 4 4 -
Minus nitrogen 4 - - - Minus phosphorus - 4 4 -
Minus potassium 4 4 3 1 - + ++ - -
Minus sulphur 4 4 3 - - f ++ - 1 Minus molybdenum 4 4 4 - 1 - ++ - -
Lime requirement 4 4 4 - 1 - ++ - -
Minus calcium - - 4 - 1 - ++ 4 -
R. C. Stefanson and N. Collis-George
Six seeds of Lactuca sativa L. cv. Mignonette, a high temperature tolerant cultivar of lettuce, were sown in each pot and the surface covered with gravel. At 14 days the seedlings were reduced to two per pot.
During periods of high evapotranspiration each pot was brought to field capacity and rotated through 180" daily. Dry weights (60°C) of the plants were determined on the 56th day.
Experimental Design
In the preliminary experiment the nine chemical treatments shown in Table 2 were replicated three times with soil 30. A complete subexperiment was started in each of 10 consecutive months. The pots were in a conventional glasshouse environment, unmodified except that the glasshouse was shaded during the first two subexperiments.
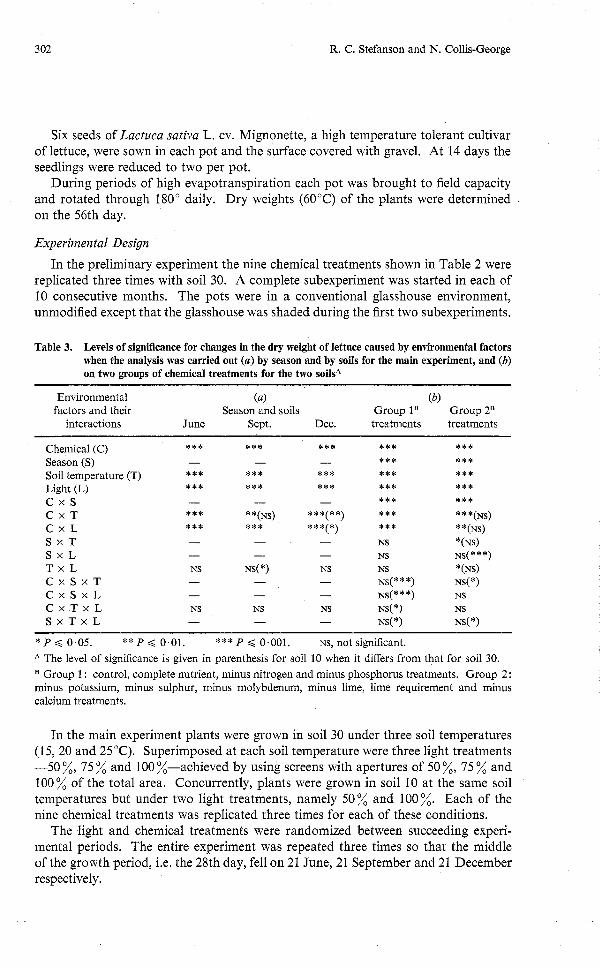
Table 3. Levels of significance for changes in the dry weight of lettuce caused by environmental factors when the analysis was carried out (a) by season and by soils for the main experiment, and (b) on two groups of chemical treatments for the two soilsA
Environmental (a) (b) factors and their Season and soils Group lB Group 2B
interactions June Sept. Dec. treatments treatments
Chemical (C) Season (S) Soil temperature (T) Light (L) c x s C x T C x L S x T S x L T x L C x S x T C x S x L C x T x L S x T x L
* P < 0.05. ** P < 0.01. *** P < 0.001. NS, not significant. A The level of significance is given in parenthesis for soil 10 when it differs from that for soil 30.
Group 1 : control, complete nutrient, minus nitrogen and minus phosphorus treatments. Group 2: minus potassium, minus sulphur, minus molybdenum, minus lime, lime requirement and minus calcium treatments.
In the main experiment plants were grown in soil 30 under three soil temperatures (15,20 and 25°C). Superimposed at each soil temperature were three light treatments -50 %, 75 % and 100 %-achieved by using screens with apertures of 50 %, 75 % and 100% of the total area. Concurrently, plants were grown in soil 10 at the same soil temperatures but under two light treatments, namely 50% and 100%. Each of the nine chemical treatments was replicated three times for each of these conditions.
The light and chemical treatments were randomized between succeeding experi- mental periods. The entire experiment was repeated three times so that the middle of the growth period, i.e. the 28th day, fell on 21 June, 21 September and 21 December respectively.
Soil Fertility and Environment. I
Soil temperatures of 15, 20 and 25°C approximate to the average air temperature in winter, spring and summer in Sydney, N.S.W. Because the total solar energy received in Sydney on midwinter day is approximately half of that received on mid- summer day, the 100% light treatment in June should equal, in light energy terms, both the 75 % treatment in September and the 50 % treatment in December.
Statistical Analyses
The data were tested for homogeneity of variance by two methods: (i) conventional analysis of variance for the whole of the experimental data; (ii) Bartlett's method of estimating homogeneity for the data from each experimental period. Both techniques suggest that the individual populations were uniform with respect to homogeneity of error.
Glass- I house LSD: P = 5%
1 1 1 1 I
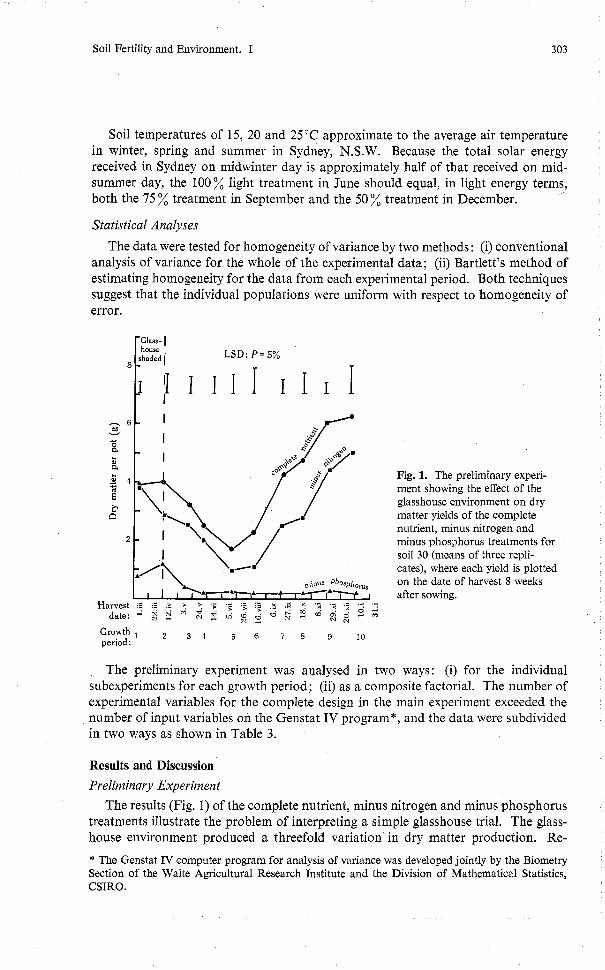
Fig. 1. The preliminary experi- ment showing the effect of the glasshouse environment on dry matter yields of the complete nutrient, minus nitrogen and minus phosphorus treatments for soil 30 (means of three repli- cates), where each yield is plotted on the date of harvest 8 weeks after sowing.
The preliminary experiment was analysed in two ways: (i) for the individual subexperiments for each growth period; (ii) as a composite factorial. The number of experimental variables for the complete design in the main experiment exceeded the number of input variables on the Genstat IV program*, and the data were subdivided in two ways as shown in Table 3.
Results and Discussion Preliminary Experiment
The results (Fig. 1) of the complete nutrient, minus nitrogen and minus phosphorus treatments illustrate the problem of interpreting a simple glasshouse trial. The glass- house environment produced a threefold variation in dry matter production. Re-
* The Genstat IV computer program for analysis of variance was developed jointly by the Biometry Section of the Waite Agricultural Research Institute and the Division of Mathematical Statistics, CSIRO.
. .
R. C. Stefanson and N. Collis-George
duction in plant growth for the complete nutrient and minus nitrogen treatments coincided with the decrease in radiant energy caused by shielding during the first growth period. Statistically, the nitrogen supply was adequate for growth in soil 30 for the periods 1, 3, 4 and 5, but was deficient during the spring (periods 6, 7, 8, 9 and 10). Dry matter production under the control and minus phosphorus treatments was similar: neither responded to the uncontrolled environment in the glasshouse except during the first two growth periods, but as periods 1 and 2 were both shaded they may not be strictly comparable with later periods. (This ambiguous result led to the inclusion of the differential shading component of the main experiment.) The yield ratio of minus nitrogen to complete nutrient for the growth periods 1 to 10 was 1.00, 0.69, 0.80, 0.64, 0.61, 0.52, 0.65, 0.62, 0.67 and 0.87 respectively. This pattern shows that the effect of the nitrogen in soil 30 on the growth of lettuce depended on the glasshouse conditions. This preliminary experiment showed the necessity for better definition of micrometeorological conditions in pot trial studies.
Main Experiment Representative results in Figs. 2 to 4 suggest that dry weight responses to soil
temperature, incident light and season were variable. It is more useful to consider the pattern of the response surfaces rather than the results of any individual sub- experiment since the interpretation of soil fertility for a particular nutrient depends upon a comparison of these surfaces.
Complete Nutrient Treatment On soil 30 in all seasons the dry weight increased significantly as both the prime
factors of soil temperature and light increased (Table 3). Aerial temperature and light energy increased between June and September, while relative humidity was almost constant. Therefore any or all of the variables-total light energy, day length and air temperature-might have contributed to the more favourable glasshouse environ- ment for plants in September. Only small relative increases in dry weight occurred with increases in either soil temperature or incident light in December. Comparison of the seasons in Fig. 2 suggests that the growth of lettuce was favoured by the environment prevailing during September. From September to December the air temperature and day length increased, while the total energy remained constant because of unseasonal cloudiness. This suggests that one or other of the first two factors became limiting in December. Except in December, dry weight responses for soil 10 were comparable with those for soil 30. These also indicate that conditions were optimal in September.
Of the various possible interactions of the components of the physical environment only the season x light interaction was highly significant, and that only for soil 10 (Table 3). Some second order interactions were significant at the 0 . 1 % level, but again only for soil 10. Thus dry weight yields from the complete nutrient treatment could make a useful basis for the assessment of soil fertility, particularly in soil 30.
Other Chemical Treatments In the following discussion the complete nutrient, minus nitrogen and minus
phosphorus treatment responses can be used to represent the various types of responses, because the minus potassium, minus sulphur, lime requirement and minus calcium responses were similar to that of the complete nutrient treatment, and the control and minus phosphorus responses were similar to one another.
Soil Fertility and Environment. I
In the June subexperiment for soil 30 there were significant increases in dry weight in response to increases in soil temperature and in incident light for the complete nutrient treatment, while the yields in the minus nitrogen and minus phosphorus treatments increased, but in different ways. Thus Table 4 shows that: (i) added nitrogen depressed yield at 15°C and 50% light, but with increasing light energy and
June
(3) Complete nutrient
December December
Minus phosphorus
Yield Yield 25 100 00
%,;,
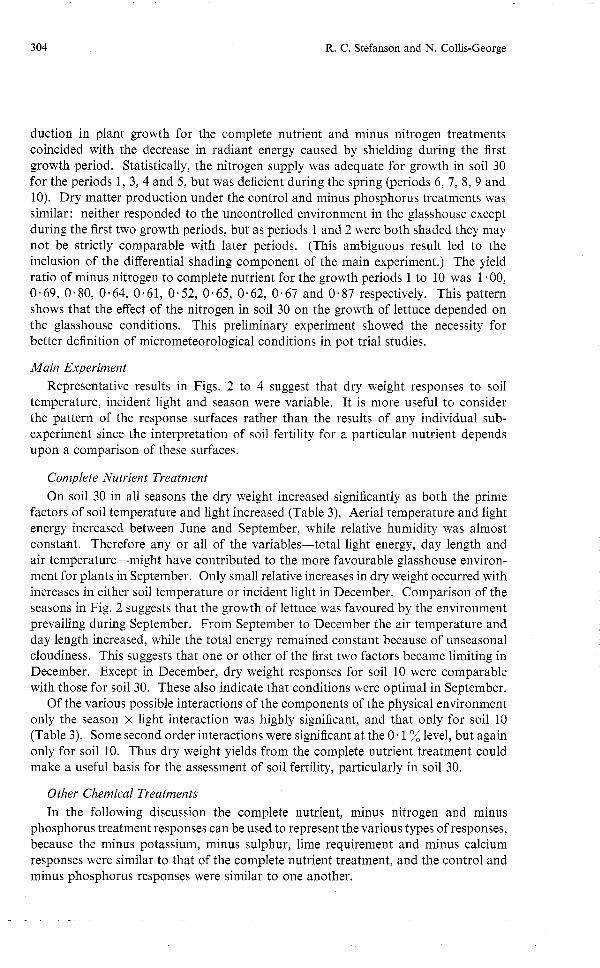
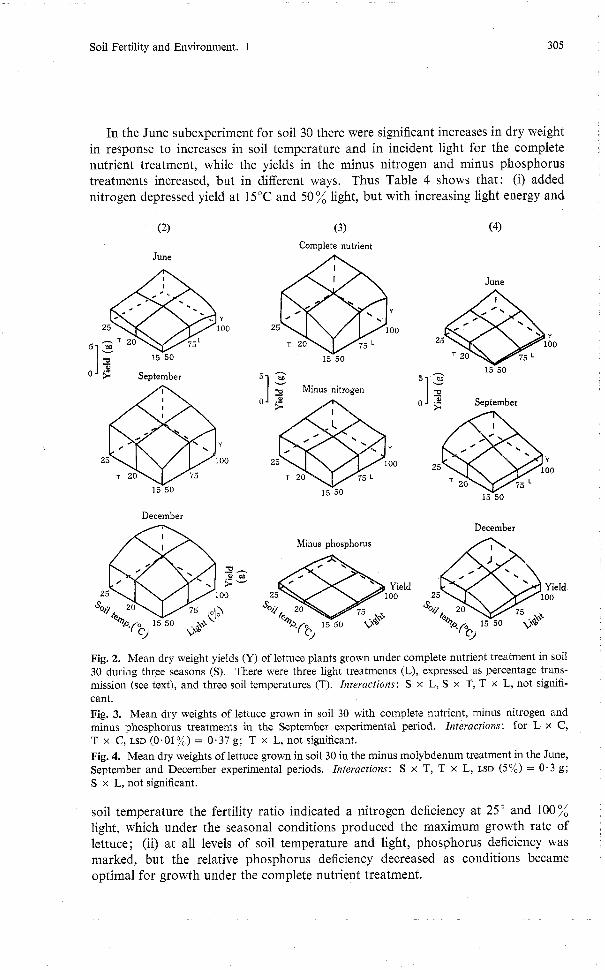
Fig. 2. Mean dry weight yields (Y) of lettuce plants grown under complete nutrient treatment in soil 30 during three seasons (S). There were three light treatments (L), expressed as percentage trans- mission (see text), and three soil temperatures (T). Interactions: S x L, S x T, T x L, not signifi- cant. Fig. 3. Mean dry weights of lettuce grown in soil 30 with complete nutrient, minus nitrogen and minus phosphorus treatments in the September experimental period. Interactions: for L x C , T x C, LSD (0.01 %) = 0.37 g; T x L, not significant. Fig. 4. Mean dry weights of lettuce grown in soil 30 in the minus molybdenum treatment in the June, September and December experimental periods. Interactions: S x T , T x L, LSD (5%) = 0.3 g; S x L, not significant.
soil temperature the fertility ratio indicated a nitrogen deficiency at 25" and 100% light, which under the seasonal conditions produced the maximum growth rate of lettuce; (ii) at all levels of soil temperature and light, phosphorus deficiency was marked, but the relative phosphorus deficiency decreased as conditions became optimal for growth under the complete nutrient treatment.
R. C. Stefanson and N. Collis-George
The minus nitrogen treatments for September (Fig. 3) and December on soil 30 produced similar dry weights under all physical circumstances. This suggests that yield was limited by the amount of available nitrogen rather than by the glasshouse environment. On the other hand, the glasshouse environment limited growth in the complete nutrient treatment in June. Seasonal conditions also reduced the dry weight yields for both the complete nutrient and minus phosphorus treatments in December relative to those in September, but the fertility ratios did not remain constant as would be required by simple application of the fertility ratio concept.
Although yields were lower for soil 10, similar responses to changes in soil tempera- ture and light were found for the two soils in September.
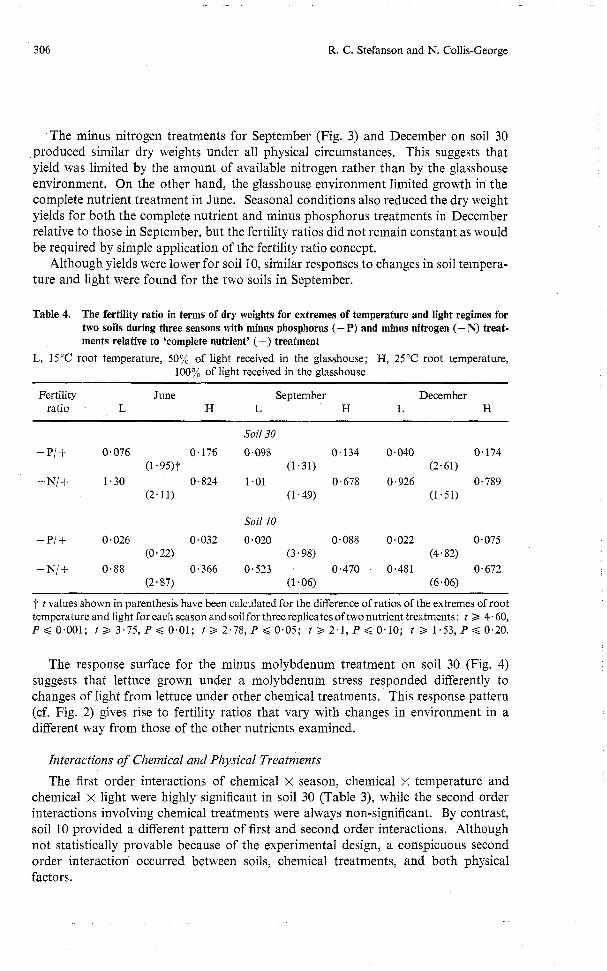
Table 4. The fertility ratio in terms of dry weights for extremes of temperature and light regimes for two soils during three seasons with minus phosphorus (- P) and minus nitrogen (- N) treat- ments relative to 'complete nutrient' (+) treatment
L, 15°C root temperature, 50% of light received in the glasshouse; H, 25°C root temperature, 100% of light received in the glasshouse
Fertility June September December ratio L H L H L H
Soil 30
Soil 10
-Pi+ 0.026 0.032 0.020 0.088 0.022 0.075 (0.22) (3.98) (4.82)
- N / S 0.88 0.366 0.523 0.470 0.481 0.672 (2.87) (1 -06) (6.06)
t t values shown in parenthesis have been calculated for the difference of ratios of the extremes of root temperature and light for each season and soil for three replicates of two nutrient treatments: t 2 4.60, P < 0.001; t 2 3.75, P < 0.01; t 2 2.78, P < 0.05; t > 2.1, P < 0.10; t > 1.53, P < 0.20.
The response surface for the minus molybdenum treatment on soil 30 (Fig. 4) suggests that lettuce grown under a molybdenum stress responded differently to changes of light from lettuce under other chemical treatments. This response pattern (cf. Fig. 2) gives rise to fertility ratios that vary with changes in environment in a different way from those of the other nutrients examined.
Interactions of Chemical and Physical Treatments
The first order interactions of chemical x season, chemical x temperature and chemical x light were highly significant in soil 30 (Table 3), while the second order interactions involving chemical treatments were always non-significant. By contrast, soil 10 provided a different pattern of first and second order interactions. Although not statistically provable because of the experimental design, a conspicuous second order interaction occurred between soils, chemical treatments, and both physical factors.
Soil Fertility and Environment. I
We must conclude that the interaction between chemical treatments and physical environmental conditions makes a simple interpretation of pot experiments impossible.
General Conclusions The dry matter production results show that the relative importance of each
chemical and physical factor must be determined if soil fertility is to be assessed by means of plant growth. With respect to soil 30, this should be feasible for some chemical treatments because of the absence of interactions between the physical factors. By contrast, the strong interaction between season and light and the second order interaction confounds the interpretation for soil 10.
Comparisons between chemical treatments became suspect, because the interaction between chemical and physical factors was partly determined by the soil used.
t-test comparisons of the fertility ratios for the extremes of light and temperature regimes show a non-random distribution (Table 4). This strongly supports our theme that changes in the physical environment render the interpretation of fertility trials very dubious unless a deficiency is very marked.
The interaction between plant growth and micrometeorological factors is reflected largely by the net rate of assimilation of carbohydrates within the plants (Brouwer 1962). In these experiments neither aeration nor soil water were limiting. The initial mineral supply was controlled, and it was presumed that growth rate was related to carbohydrate production which reflected the imposed physical conditions.
The results in Figs. 2 to 4 agree with Deinum's (1966) observation that in terms of yield there is a significant interaction between level of fertilizer and light intensity, provided that the latter is less than 260 cal ~ m - ~ day-l. (The average daily light energies recorded in the glasshouse were 120, 210 and 190 cal ~ m - ~ day-l in June, September and December respectively.)
Soil temperature is known to affect the mineral nutrition of plants by influencing, among other things, the solubility of soil compounds and the metabolic processes in the root, e.g. Nielsen and Humphries (1966). In this paper, soil temperature, both as a prime causal factor and through its interactions with chemical and with other physical factors, has been shown to affect dry matter production.
Experimentally, the major components of the glasshouse environment were air temperature, relative humidity, photoperiod, solar radiation and carbon dioxide concentration. The mean relative humidity as well as its range were similar in all the growth periods, and carbon dioxide concentration could be assumed to have remained constant in the well-ventilated glasshouse. Air temperature and photoperiod, which were not independently variable, caused significant changes in the growth pattern in September compared with December, although the total light energy was similar. Both air temperature and photoperiod are known to change the distribution of dry matter in plants, e.g. van Dobben (1962). Therefore the experiment cannot be analysed in the sense of attributing various responses to particular aspects of the uncontrolled factors of the experimental design.
Collectively, the seasonal variables have been shown to affect yield responses for the various chemical treatments, and each soil behaved differently. Within a single experimental period, both soil temperature and incident light interacted with chemical treatments to influence yield response. Thus even within a season, plant nutritional responses are often confounded with climatic factors. It would seem unlikely that pot trials, even when completely instrumented, will allow an entirely unambiguous
-
R. C. Stefanson and N. Collis-George
assessment of soil fertility. In particular, the concept of fertility ratio or relative yield would not appear to be universally tenable as an indicator of the inherent fertility of soils.
Acknowledgments
This program was supported by a grant from the Rural Credits Development Fund of Australia, which provided a post-graduate studentship for the senior author. The authors acknowledge the advice and technical assistance of Dr B. G. Davey, and the statistical advice of Mrs G. Bishop.
References Anderson, A. J. (1952). Testing pastures for mineral deficiencies. Rur. Res. CSIRO No. 2. Brouwer, R. (1962). Nutrition influences on the distribution of dry matter in the plant. Neth. J.
Agric. Sci. 10, 399. Collis-George, N., and Davey, B. G. (1960). The doubtful utility of present-day field experimentation
and other determinations involving soil-plant interactions. Soils Fertil., Harpenden 23, 307. Deinum, B. (1966). Climate, nitrogen and grass. Meded. Landbouwhogesch. Wageningen 66, 1. Deinum, B. (1971). Climate, nitrogen and grass. 3. Some effects of light intensity on nitrogen
metabolism. Neth. J. Agric. Sci. 19, 184. van Dobben, W. H. (1962). Influence of temperature and light conditions on dry-matter distribution,
development rate and yield in arable crops. Neth. J. Agric. Sci. 10, 377. Jenny, H., Vlamis, J., and Martin, W. E. (1950). Greenhouse assay of fertility of California soils.
Hilgavdia 19,201. Luxmoore, R. J., and Millington, R. J. (1971). Growth of perennial ryegrass (Lolium perenne L.)
in relation to water, nitrogen and light intensity. 11. Effects on dry weight production, transpir- ation and nitrogen uptake. Plant Soil 34, 561.
Nielsen, K. F., and Humphries, E. C. (1966). Effects of root temperature on plant growth. Soils Fevtil., Harpenden 29, 1.
Walker, P. H. (1972). A soil survey of the county of Cumberland. N.S.W. Dep. Agric. Soil Survey Bull. No. 2.
Webb, R. A. (1959). Problems of fertilizer use in tropical agriculture. Outlook Agvic. 11, 103.
Manuscript received 26 April 1973