the impact of root traits, nutrient uptake,age of ...orgprints.org/7424/6/paper_5.pdfthe impact of...
TRANSCRIPT
VThe impact of root traits, nutrient uptake,age of accession, growth period and resistance to fungal disease for cereal production with limited nutrient supply and pesticide use
Anne-Kristin Løes1, Ellen Mosleth Færgestad2, Tara S. Gahoonia3, Hugh Riley4 and Mauritz Åssveen5
1Norwegian Centre for Ecological Agriculture (NORSØK), N-6630 Tingvoll.2Norwegian Food Research Institute, Box 5028, N-1432 Ås.
3The Royal Veterinary and Agricultural University, Department of Agricultural Sciences, Plant Nutrition and Soil Fertility Laboratory, Thorvaldsensvej 40, DK-1871 Frederiksberg.
4Norwegian Crop Research Institute, N-2350 Nes på Hedmark.5Norwegian Crop Research Institute, N-2849 Kapp.
Manuscript submitted to Crop Science
a b
c
f g h
d e
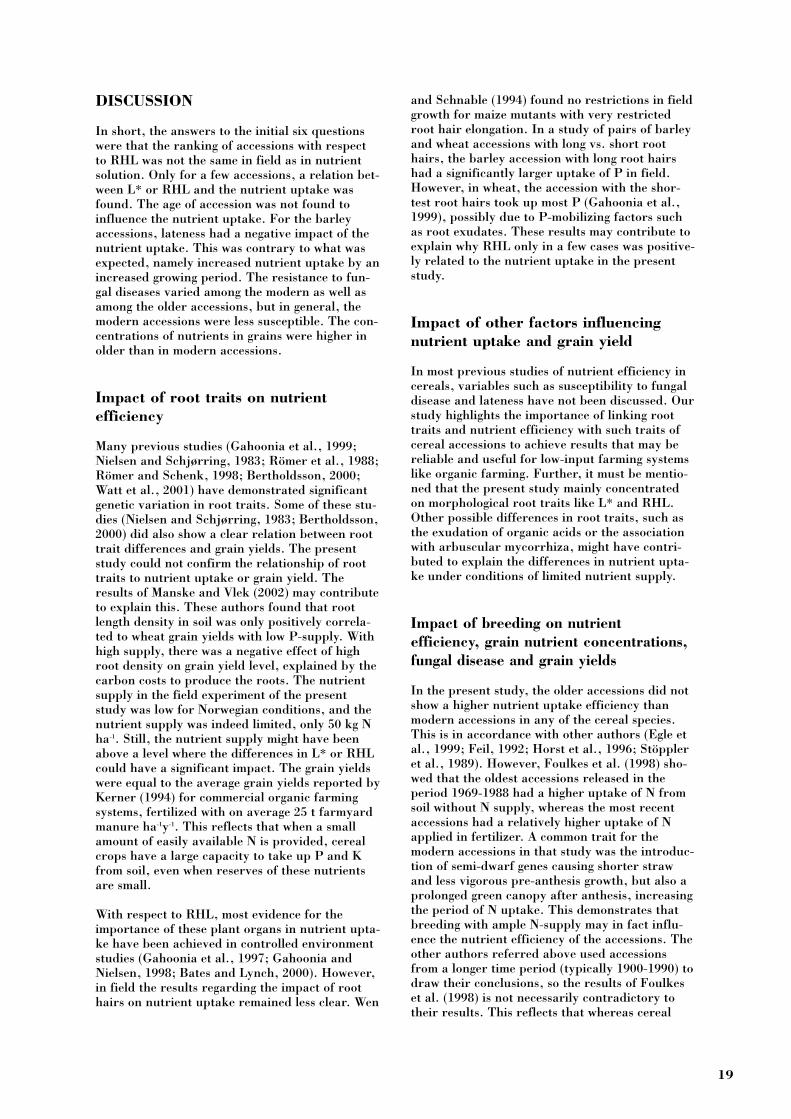
Legend to pictures, opposite page
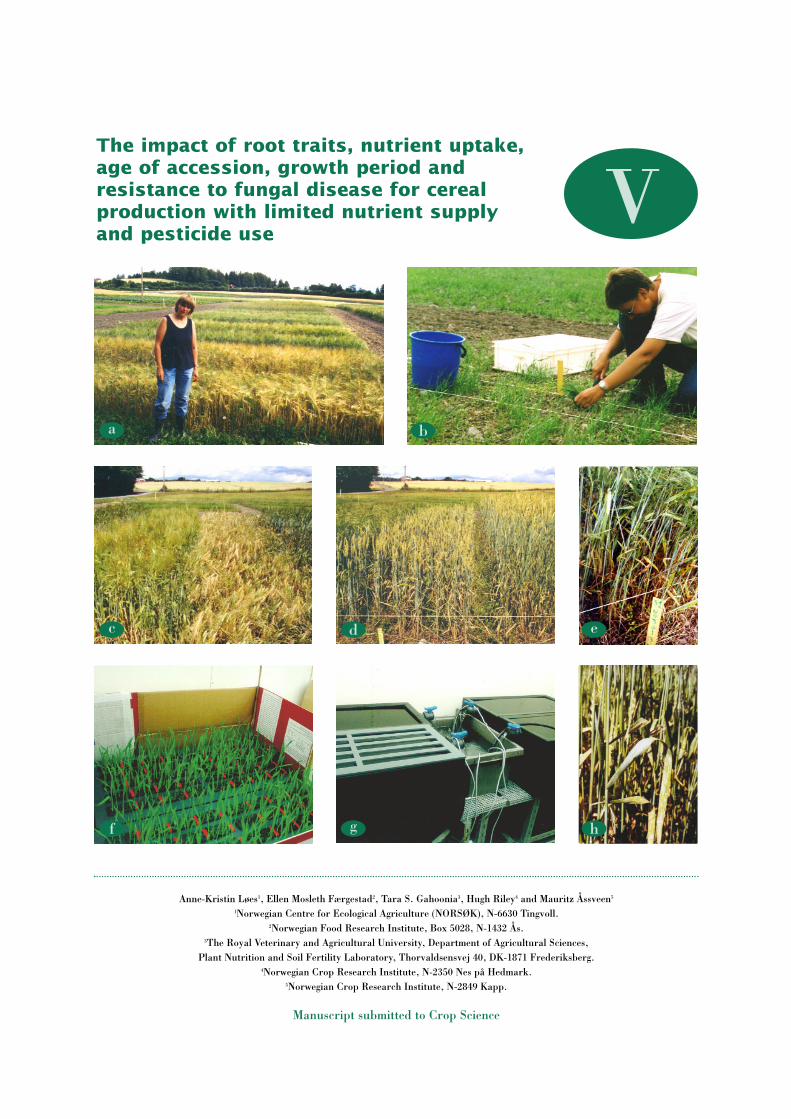
a Field experiment with 20 accessions of spring wheat and barley released 1900-2000, grown with limited supply of nutrients and use of pesticides, 10 August 2001.
b Above ground dry matter was recorded at 2 weeks interval during the growing season, the first time 18 days after germination, 18 June 2001.
c One replicate of the barley accessions NK94682 (to the left) and Dønnes (to the right) on 10 August. NK94682 (not released) produced the highest, and Dønnes (old land race)
the lowest recorded grain yields by limited nutrient supply, 4.8 and 3.0 t ha-1, respectively.d One replicate of the spring wheat accessions Brakar (to the left, released 1995)
and Diamant (to the right, released 1928) demonstrating the reduction in straw length achieved by breeding. Both accessions produced the lowest grain yields among the 9 wheat accessions tested, approx. 2.8 t ha-1.
e Scald infected most barley accessions; the susceptibility to scald varied considerably.h Mildew infected most wheat accesssions; the susceptibility to mildew varied considerably.
g Before the field experiment with limited nutrient supply, 52 accessions were grown in field with optimal nutrient supply and in circulating low-P nutrient solution. From records of root traits in nutrient solution,
20 accessions were selected for the field experiment with limited nutrient supply. This picture shows the trays with nutrient solution.
f To ensure even light conditions, paper walls were put around the trays .
Picture a taken by Martha Ebbesvik, b-h by Anne-Kristin Løes.
ABBREVIATIONS USED IN THE PAPER:
Above ground dry matter = ADM
Dry matter = DM
Harvest index, grain proportion of total above ground yield = HI
Root length relative to the total plant DM, m g–1 plant DM = L*
Root hair length = RHL
Root hair density = RHD
INTRODUCTION
Genetic gain in grain yields
During the last century, breeding of new cerealcultivars has been performed in parallel to a pro-nounced intensification of agriculture. It is diffi-cult to separate the improvement in grain yieldcaused by breeding from those caused by increa-sed nutrient supply and improved plant protecti-on, soil cultivation, planting and harvesting tech-niques, but in general a significant genetic gainhas been reported (Feil, 1992). The estimatedgenetic gain in spring wheat yields of Nordic culti-vars (Denmark, Sweden, Finland and Norway)was 18.5 kg ha-1 y-1 in the period 1901-1993 (Ortiz et al., 1998). For 2-row barley, it was 13 kgha-1 y-1 (period 1942-1988), and for 6-row, 22 kg(period 1930-1991; Ortiz et al., 2002). A recentAustrian study reported even higher yield increa-se, 60 kg ha-1y-1 in barley, especially during theperiod 1950-1960 and onwards (Grausgruber etal., 2002). High increase in cereal yields due torecent breeding, 96 kg ha-1 y-1, was also found byFoulkes et al. (1998) for winter wheat in GreatBritain (period 1969-1988). Much of the yieldincrease in small grains has been obtained by anincreased HI, whereas the total biomass producti-on has not increased (Feil, 1992; Ortiz et al.,1998). However, in a recent study, the biomasshad increased whereas the HI was not changed inbarley genotypes from Argentina released 1944-1998 (Abeledo et al., 2003). This reflects thatgenetic gains in grain yields may have variousphysiological explanations.
Nutrient efficiency and genetic variability
The term nutrient efficiency is often used to descri-be the ability of plants to achieve a satisfactorygrowth and development with restricted availabilityof one or more nutrients. With limited nutrientsupply, a nutrient efficient cereal genotype willproduce a relatively higher grain yield than a lessefficient cultivar. A high nutrient efficiency may beobtained by high utilization efficiency, which is theability to produce much plant DM, and thereaftermuch grains, from each unit of nutrient taken up.A disadvantage of high utilization efficiency is thatthe nutritive value of the grain seeds may be redu-ced, as well as the early growth rate after seeding.Under conditions of limited nutrient supply, thismay hamper the competition with weeds and ishence not desirable. A better alternative is highuptake efficiency, which is the total amount ofnutrients taken up in plant material per unit area.Spring cereals have a rapid growth rate during avery limited period and the ability to take up largeamounts of nutrients between germination andmaturing is essential.
The availability of mineral nutrients such as P andvarious micronutrients restricts grain yields inlarge areas of the world, and hence nutrient effici-ency in cereals has been intensively studied.However, as no simple and standardized measure-ment of the complex nutrient efficiency trait hasyet been generally accepted, nutrient efficiency isseldom targeted in the commercial cereal breeding.In a scientific study, some barley genotypes werebetter adapted to limited phosphorus (P) availabili-ty because of relatively longer roots and/or a moreefficient nutrient uptake at the cell level (Nielsen
1
ABSTRACT
From a representative selection of 52 accessions of spring wheat and barley grown in Norway during 1900-2000, 20 accessions were chosen for comparing nutrient uptake and grain yields in field by limited nutrientsupply and pesticide use. The accessions were precedingly grown in low-P nutrient solution for records ofroot traits (L*, RHL), and in field with optimal nutrient supply. Grain yield ranking was comparable underboth field conditions. However, some accessions, especially those selected for organic farming, performedrelatively better with limited supply. The older accessions were not superior to modern when grown withlimited supply. The highest grain yields were achieved with modern accessions that were fairly resistant tothe major diseases, powdery mildew (Blumeria graminis (Oudem.) J.J. Davis) in wheat and scald(Rhynchosporium secalis (Oudem.) J.J. Davis) in barley. A higher HI contributed significantly to the higheryields of modern accessions. No relationship was found between root traits recorded in nutrient solution orRHL in field, and the nutrient uptake in field. However, the uptake of N, P and K during the growing sea-son varied significantly between accessions. The amount of P taken up in ADM at the ripening stage had asignificant impact on grain yields in barley, and correspondingly, the amount of N effected grain yields inwheat significantly. Susceptibility to fungal disease and growing period also influenced grain yields. Someolder accessions possessed interesting traits e.g. resistance to mildew and high nutrient uptake that may beuseful in future breeding programs.
The impact of root traits, nutrient uptake, age of accession,growth period and resistance to fungal disease for cerealproduction with limited nutrient supply and pesticide use
and Schjørring, 1983). For barley genotypes withvarying RHL, the RHL were positively related to Puptake (Gahoonia et al., 1999). Some authors (e.g.Nielsen, 1983; Sattelmacher et al., 1994) suggestthat genetic variability in cereals provides a signifi-cant potential to breed especially nutrient efficientcereal varieties. However, it must be kept in mindthat information on the genetic background of aplant trait is essential for breeding, and this know-ledge is often limited with respect to root traits(Manske and Vlek, 2002).
Grain production with limited nutrientsupply and use of pesticides
For farming systems refraining from the use of pesti-cides and mineral fertilizers, such as organic farming(International Federation of Organic AgriculturalMovements (IFOAM), 2003), an ideal cereal cultivaris nutrient efficient, resistant to fungal disease andcompetes efficiently with weeds (Lammerts vanBueren et al., 2003). In humid regions, resistance tofungal diseases has been essential in conventionalbreeding, but nutrient efficiency and competitive abi-lity have not been given priority. Significantly loweruse of fertilizers and animal manure in conventionalas compared to organic farming systems caused 21-37% lower grain yields on the organic farms (Halbergand Kristensen, 1997). There is no doubt thatmodern cultivars produce higher yield when grownwith conventional applications of fertilizer and pesti-cides, and it seems as if the genetic gain has beenespecially large since approximately 1960 onwards.However, it is less clear whether the modern cultivarsperform superior with limited nutrient supply anduse of pesticides. Foulkes et al. (1998) found that themost recent accessions were adapted to high levels ofN in soil and took up relatively more N from fertili-zer, whereas the older accessions in their selectionhad a relatively larger uptake of N mineralized fromsoil. The N uptake from fertilizer was calculated asthe apparent recovery of fertilizer N, which is N inyield with N fertilizer minus N in yield with no Napplied. There is also a possibility that the nutrientefficiency of modern accessions has decreased becau-se genotypes producing large amounts of biomassseem to have a more efficient nutrient uptake (Feil,1992). In maize, genetic gains in grain yield havebeen achieved by increasing the above ground bio-mass. For this cereal species, there is no negative cor-relation between yield level and grain N concentrati-on, whereas in small grains, the grain N concentrati-on decreases with increasing yield levels. This mightbe seen as an indication of lower nutrient efficiencyin modern cultivars (Feil, 1992). In Nordic countries,cereal accessions with large differences in growthperiod are available because of the large variation inlongitude of the area in which cereals, especially bar-ley, are grown. Early genotypes have fewer days avai-lable for nutrient uptake, and it is possible that thismay contribute to a less efficient nutrient uptake insuch genotypes.
Aim of the paper
The aim of the present paper is to discuss if diffe-rences in root traits can be related to differencesin nutrient uptake among cereal accessions, andassess the agronomic value of cereal accessionsreleased during the period 1900-2000 when grownwith limited nutrient supply and pesticide use.The following topics will be studied:
1. Will the genotypic differences in RHL be simi-lar when measured in nutrient solution and underfield conditions?2. Will L* and RHL influence the nutrient uptakein field?3. Is the nutrient uptake different in older ascompared to modern accessions? 4. Is the nutrient uptake affected by the latenessof the accession?5. Is the susceptibility to fungal diseases differentin older as compared to modern accessions?6. Is the grain nutrient utilization efficiency diffe-rent in older as compared to modern accessions?
This will provide a basis on which to concludewhether the breeding efforts designed for conven-tional, high-input farming systems also have beensuitable for organic farming systems. Finally, wediscuss whether some accessions have attributesthat may be useful in future selection of cultivarsfor farming systems with limited nutrient supplyand pesticide use.
In the field experiments presented here, optimalnutrient supply was combined with use of fungici-de in one season and limited nutrient supply withno use of fungicide in the next season. This designprovides information of a total effect of a high-input conventional farming system as comparedto a low-input farming system resembling organicfarming practice.
MATERIAL AND METHODS
Selection of cereal accessions
Seventeen accessions of spring wheat and 35 ofbarley were selected to represent the populationof the accessions used in Norway in the period1900-2000. Some not yet released accessions ofwheat, NK98602 and NK97537 had been selectedfor organic farming because of resistance to mil-dew. Some not yet released barley accessions,NOB013, NOB018, NOB019, NOB9306 andNOB9319 had been selected for organic farmingby screening with oxygen stress in hydroponics,which has been shown to correlate with a highnutrient efficiency in field (Bertholdsson, 2000).
2
Overview of experiments
All accessions were grown to maturity in a fieldwith optimal nutrient supply. Thereafter, allaccessions were grown in circulating low-P nutri-ent solution in a climate chamber, and screenedfor L*, RHL and P use efficiency. Accessions withcontrasting root traits (9 of wheat, 11 of barley)were selected for a field experiment with limitednutrient supply. The pedigree of all accessions isshown in Løes and Gahoonia (submitted).
Field experiment with optimal nutrientsupply and use of fungicides
On a morainic soil with medium high nutrientconcentrations, most accessions were grown intwo replicates with medium high N, P and potas-sium (K) fertilization (Table 1) in year 2000.
These growing conditions will be referred to asoptimal nutrient supply. Ten out of the 52 accessi-ons were received from Nordic Gene Bank, andwere grown without replicates due to lack ofseeds. The experiment was located at TheNorwegian Crop Research Institute, ApelsvollResearch Centre (60O42'N, 10O51'E). The plot sizewas 1.5 x 8 m, harvest plot 1.5 x 5.6 m. Fungaldisease was recorded as the fraction of leavesinfected by mildew, leaf spot septoria(Mycosphaerella graminicola (Fuckel) Schröt.),or scald. Yield levels of grain and straw wererecorded on 6 September for barley, and 20September for wheat, by means of a plot combineharvester. No plant analyses were performed inthis experiment. In addition to the comparison ofthe cereal accessions under optimal nutrient sup-ply, the experiment was used to multiply seedsunder equal growing conditions.
3
Characteristic Optimal supply, 2000 Limited supply, 2001
SoilP-AL, mg kg-1 soil 70 (high 65-155) 21 (low 0-24)K-AL, “ 80 (medium, 65-155) 57 (low 0-64)K-HNO3, “ 320 (medium 300-800) 173 (low 0-300)pH 5.5 6.2
FertilizationN 70, combined mineral fert. 50, CaNH4(NO3) 3P 13 “ noneK 33 “ none
Pesticide useCoating of seeds Panoctine Plus noneHerbicide (applications) Actril (1) Actril (1)Fungicide Tilt top (1) noneStraw shortener Moddus (1, wheat) none
Cerone (1, barley)
Agronomic traitsRoot hair length Not recorded xPlant DM during season Not recorded xN, P, K in plant DM Not recorded x
Lateness-Days to ear emergence x x-Days to maturity x Not recorded
Lodging plants, % Early, 13 July Not recordedLate, 16 August Late, 16 augustNot recorded At final harvest, flat and inclined
Record of fungal disease 27 July 10 July, 16 August
Grain yield x xStraw yield x xHarvest index x x
Table 1. Growing conditions in the field experiment with optimal and limited nutrient supply and overview of recorded agronomic traits. The letter «x» means that the trait was recorded
Screening for root traits in low-P nutrient solution
Seeds were disinfected with 10% sodium hypochlo-rite, rinsed and germinated on moist filter paper.After 1 week, vigorous seedlings of all accessionswere selected and grown for 3 weeks in well-aeratedcirculating nutrient solution in a climate chamberwith light intensity 130 mE s-1, light/dark period16/8 h, temperature 18/15 OC and 75% relativehumidity. There were three replicates per accessi-on. Each experimental unit consisted of five singleplants grown in a strip of foamed plastic. An initialcomplete basic nutrient solution (Gahoonia et al.1999) with 25 mM P was later supplemented with amaintenance solution equal to Gahoonia et al.(1999), or ammonium nitrate solution to adjust pHand to keep the electric conductivity approximatelyconstant at 0.67 mS m-1. After 3 weeks, all plantswere harvested. Leaf and root DM were recordedafter drying at 70OC until constant weight. N, Pand K concentrations were measured, and L* andaverage RHL were recorded as described.
Field experiment with limited nutrientsupply
Eleven barley and 9 wheat accessions with contras-ting root traits (Table 2) were selected for a fieldexperiment on morainic soil with low nutrient con-centrations, and a low N-fertilization (Table 1).These growing conditions will be referred to aslimited nutrient supply. On the experimental field,no fertilizers had been applied since 1995 and thepreceding crops were a grass-clover ley in 1998 and1999, and barley in 2000. The grain yield level(Table 4) was considerably lower in this experi-ment, which supports that the use of the terms“optimal” and “limited” are reasonable. The N-fer-tilizer was applied to increase the demand for othermineral nutrients. In this way, we hoped to revealgenotypic variability more readily, caused mainlyby limiting P and K availability. The experimentwas located at Apelsvoll Research Centre divisionKise (60O46'N, 10O49'E). Seed stock from the multi-plication field in 2000 was used. Herbicide wasapplied once to ensure comparable conditions; noother pesticides were used (Table 1).
Each accession was randomly sown within fourreplicate blocks. However, to reduce the effect ofsoil variation, all accessions within each cereal spe-cies were located next to each other within eachblock. Each experimental plot measured 1.5 x 12 m(12 rows of plants), of which the inner 1 m widthwas used for ADM sampling. ADM was recorded at2-week intervals after germination, which occurredon 1 June. The sampling dates, 18-19 June, 2-3July, 16-17 July, 1 August and 14-15 August will bereferred to as sampling 1, 2, 3, 4 and 5, respective-ly. At each sampling, 1 x 0.50 m of the canopy was
cut off from the end of the plot inwards and remo-ved. Then another 1 x 0.50 m was cut and sampled.DM of plant samples was recorded after drying toconstant weight at 80OC. A considerable disease ofscald occurred on the barley, and mildew on thewheat accessions. For mildew, the infected fraction(%) of the upper 3 or 4 leaves was recorded onboth dates (Table 1). For scald, the fraction of thebottom leaves was recorded on the first and thefraction of the upper leaves on the last date. Forthe two dates of fungal record, the fungal diseasefractions have been abbreviated FD1 and FD2,respectively. The phenological development ratevaried considerably between accessions, especiallyfor barley, and hence the developmental stage wasnot recorded at each sampling. The number of daysuntil ear emergence was recorded and used to cha-racterize the lateness of each accession.
The final harvest occurred on 12 September for 6-row barley and on 18 September for wheat and 2-row barley. A plot combine harvester was used,and the harvest plot was 1.35 x 6 m. Again, 0.50 mof the canopy was removed before the sample har-vest started. HI was recorded by weighing thestraw and grain yield from each plot. N, P and Kconcentrations were analyzed in ADM at each sam-pling and in grain and straw at the final harvest. Atsampling 1, average RHL was measured as descri-bed below.
Plant and soil analysis
For plant samples from the nutrient solution expe-riment, dried root and leaf material was mixed foreach experimental unit and ground, assuming thatthe concentrations of N, P and K in roots and lea-ves did not vary much as these nutrients are highlymobile within the plant. For determination of Pand K, approximately 1 g of dry sample was dige-sted in a mixture of H2SO4, H2O2 and HNO3. P wasdetermined colorimetrically (Murphy and Riley,1962) and K by inductive coupled plasma analysis(ICP). The N concentration was determined by aLeco autoanalyser.
Plant samples from the field experiment with limi-ted nutrient supply were ground, then 150-200 mgof dry sample was digested with Na2SO4 and con-centrated H2SO4. N concentrations were thendetermined by a colorimetric method using FIA(Flow Injection Analyser), whereas P and K weredetermined by ICP.
Soil P and K were measured by extraction withammonium-acetate lactate (AL) solution (pH 3.75,Egnér et al., 1960). Soil pH was measured in a soil-water suspension (1:2.5 v/v). Soil reserves of Kwere analyzed by boiling the soil sample for 10minutes in 1 M nitric acid (Pratt, 1965).
4
Root traits
Root length (L) was measured by scanning 10-30cm long samples of two or three continuous rootstaken randomly from each experimental unitgrown in nutrient solution. These roots were care-fully spread by forceps in a film of distilled waterin a glass tray, and the resulting root picture wasscanned by a flatbed scanner (ScanJet IIx HP)and stored as a picture data file. The root samplewas then dried at 70 OC and carefully weighed.The digital picture data files were analyzed by Dt-Scan Software (Delta-T Devices, Cambridge,England; procedure “Object perimeter/2”), todetermine L. The trait L*, which is a measure ofphotosynthate invested in roots to nourish theleaves, was then calculated. L was not determinedin the field experiments.
Average RHL was determined on separate rootsamples taken from the nutrient solution experi-ment and also from the field experiment with limi-ted nutrient supply. The root samples were placedin distilled water and studied under a microscopeinterfaced with a video camera and a computer.For the root samples from nutrient solution, 20representative RHL (some short, some long, somemedium; all measured root hairs were easilyvisible on the picture) were measured for eachexperimental unit. In the field experiment, a clus-ter of five plants including roots from each acces-sion was sampled at sampling 1. The roots weregently rinsed to remove soil particles, and 40representative RHL were measured on each ofthree sub-samples from each accession.
RHD was assessed for root samples from the fieldexperiment in a simple way. One representativeroot picture of each accession, without knowingwhich accession the picture belonged to, was ran-ked 1, 2..9 for wheat accessions and 1, 2..11 forbarley accessions. The picture given the character1 had the least dense root hairs, and 9 or 11 hadthe densest root hairs. No notice was taken of theRHL during this procedure. A meaningful ran-king was confirmed when an unprejudiced collea-gue observed the series of pictures without anyother information and concluded that RHD hadto be the trait that caused a meaning.
Statistical analysis
Statistically significant differences between acces-sions were assessed by one-way balanced analysisof variance for the results from the field experi-ment in 2000; and for the results from the nutri-ent solution experiment where no effect of locali-zation within the growth boxes was found (Anova,SAS Institute, 1989). For the results from thefield experiment with limited nutrient supply, theeffects were assessed by two-way analysis (effectof accession and block). Interesting relations were
analyzed by linear regression or correlation ana-lysis using Minitab software. Levels of significanceare abbreviated as * = 0.05 >P > 0.01, ** = 0.01>P > 0.001 and *** = P < 0.001. In some cases,tendencies have been assigned by (*) for 0.1 > P >0.05. To assess whether certain characteristicswere related to changes that might have occurredduring breeding, the age of each accession wascalculated as 2000 minus its year of release. Theage of not yet released accessions was set to 1year. When age of accession was used in linearregression or correlation analysis, the means ofthe other characteristics were used.
To study how various factors affected the grainyields, stepwise regression (Minitab software) anda multivariate regression technique, partial leastsquare (PLS) regressions (Unscrambler software)were used. PLS regression analysis is a data com-pression technique where the information in theoriginal set of variables is projected down on asmaller number of new variables, called principalcomponents. These latent new variables are linearcombinations of the original variables. As theyare orthogonal to each other, they can be used ina regression model without problems caused bycollinearity. In the PLS regression analysis, thefollowing characteristics were used as x-variables:
– The P and K balance in soil (spring valuesminus harvest values of P-AL and K-AL for eachexperimental plot)– Nutrient uptake (Nu2 etc where 2 refers to thesampling number)– Nutrient concentrations (N2 etc )– Root traits (RHL measured in field, L* fromnutrient solution)– Fungal disease (FD1, FD2)– Age of accession (Age)– Lateness, measured as number of days to earemergence (Ear) – Lodging inclination (L2f)– Replicate (rep1,..rep4)– The yields of grain and straw by optimal nutri-ent supply, as a measure of the yield potential(DMgO, DMstrO)
Grain yields (DMg), straw yields (DMstr) andtotal DM yields (DMtot) as well as ADM at vari-ous sampling dates (DM1, DM2..) were used as y-variables. Mathematically, the regression modeldescribes, by decreasing order of the principalcomponents, the covariance between a set of x-and y-variables. The principal components areplotted to visualize the variables in a “loading“plot, as well as the initial samples in a “score”plot. These graphical presentations give informa-tion about the patterns of variation in the
5
results. Interpretation of the principal compo-nents shows the effect of the x-variables on the y-variables. The number of statistically significantprincipal components in the regression model isdetermined by cross validation, where the signifi-cance of the model is repeatedly tested on a sub-set of samples that is temporarily excluded fromthe calibration set. All replicates of each accessi-on were simultaneously excluded from the model.The significance of the various x-variables wereevaluated by a Jack Knifing procedure (Martensand Martens, 2001). In the loading and scoreplots presented here, only characteristics signifi-cant after cross validation are shown. Furtherdetails of PLS regression analysis are given inMartens and Næs (1989) and Martens andMartens (2001).
RESULTS
RHL in nutrient solution and field, and otherroot traits as related to P use efficiency in solution
A significant variation was found among the bar-ley accessions grown in low-P nutrient solutionwith respect to RHL, L* and P use efficiency(PUE, g plant DM mg-1 P taken up), as shown inTable 2. For wheat, the difference in L* was notsignificant, but significant differences in PUE andRHL were found. Accessions with contrastingvalues of L*, PUE and RHL were chosen for thefield experiment with low nutrient supply, and forthese accessions the exact values for L*, PUE andRHL are shown in Table 2.
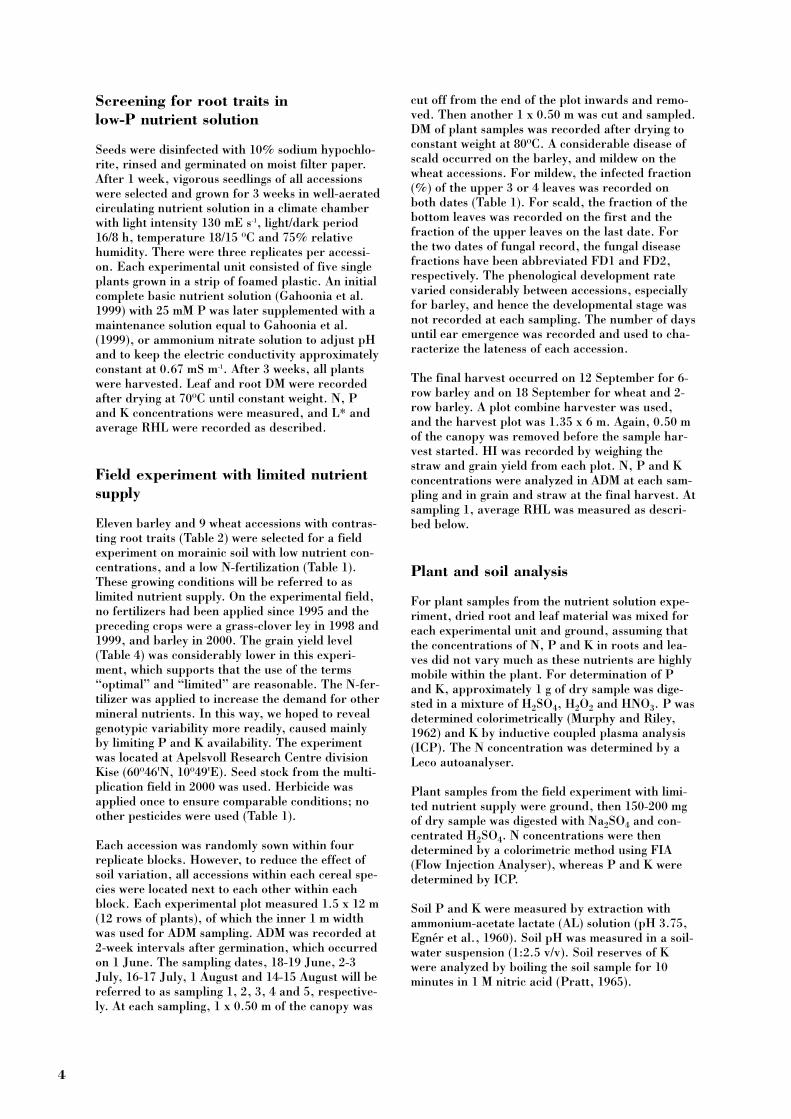
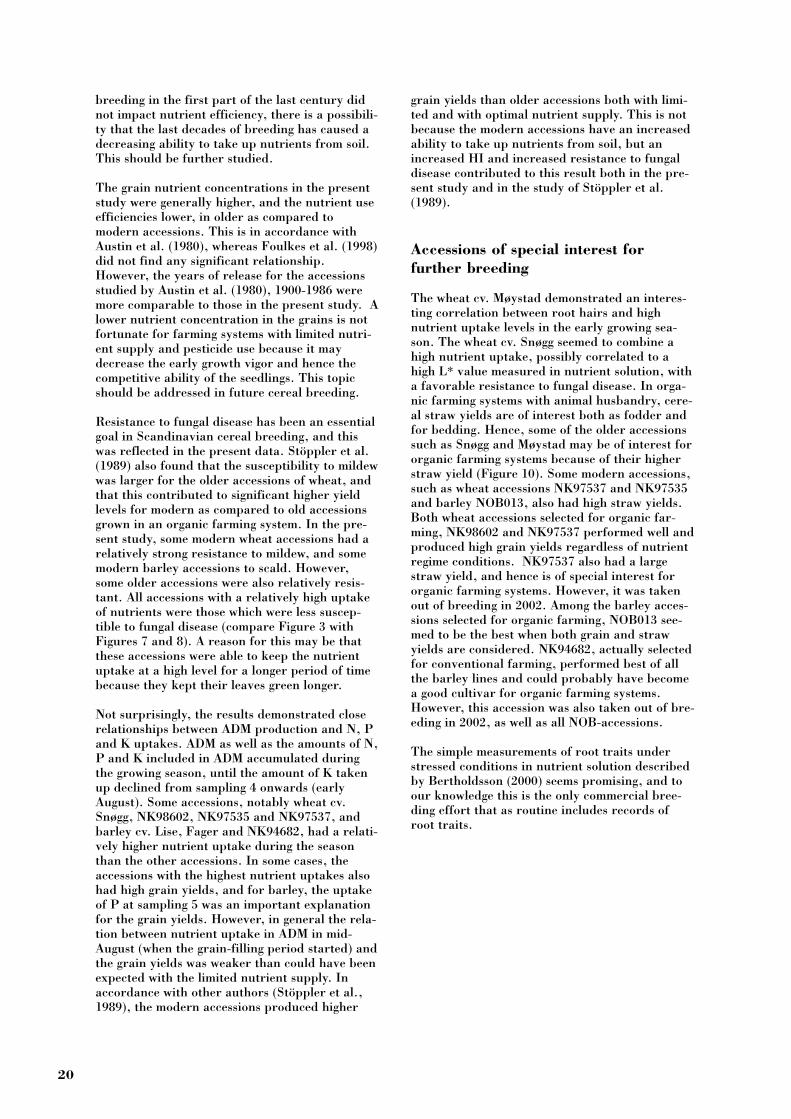
There was also a significant variation in root-shoot ratio among barley accessions (P < 0.001) aswell as wheat accessions (P < 0.01) (Figure 1).However, the variations in PUE were not relatedto variations in L* or to variations in root-shootratio (Figure 1), except for a slight negativeimpact of L* on PUE in wheat (P = 0.09). Theroot-shoot ratio and L* values were correlated, r= 0.42*** for wheat and 0.50*** for barley. Theaverage RHL value for each experimental unitand PUE were weakly correlated, r = 0.20* forbarley and 0.27(*) for wheat.
Significant differences in RHL were also found infield (Table 2). In general, the average RHL valu-es measured in field did not deviate much fromthose measured in nutrient solution (Table 2).However, the ranking of accession with respect toRHL was not the same when grown in solution asin the field. No significant relation was found bet-ween RHL in field and nutrient solution for anyof the cereal species. Hence, the answer to questi-on 1 (see Aim of the paper) was negative. Thegenotypic differences in RHL were not similar innutrient solution and field.
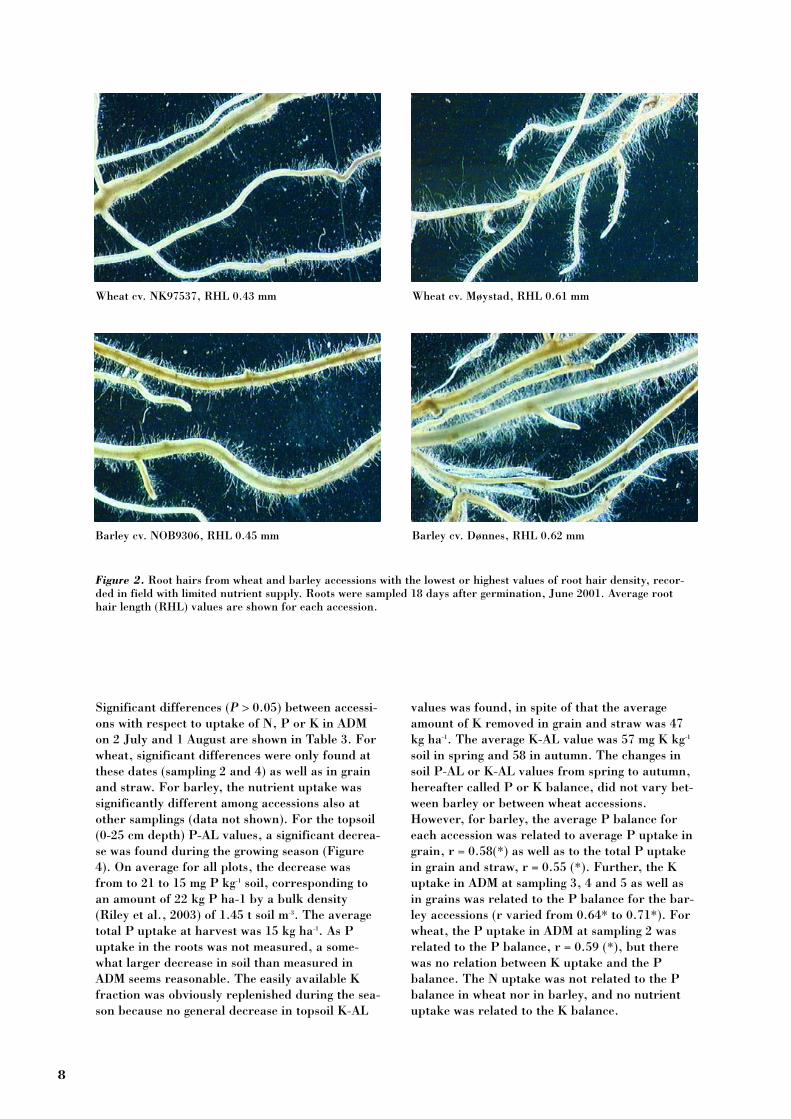
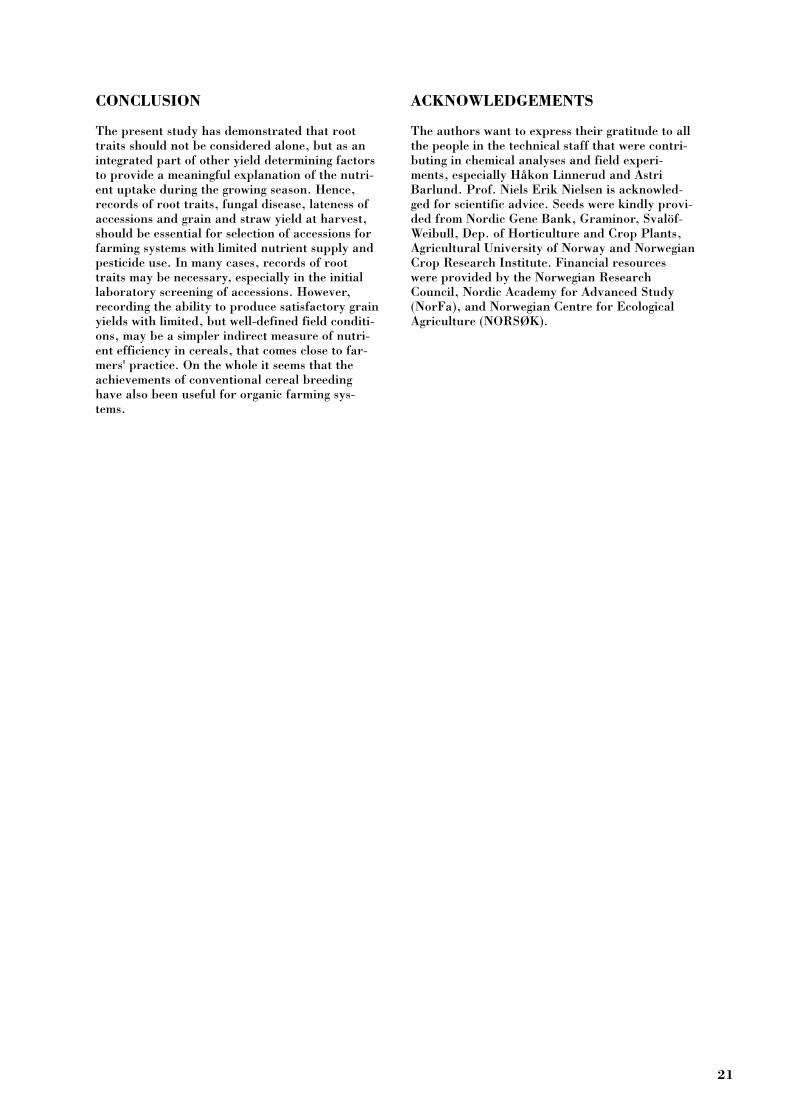
For the roots from the field experiment, a positivecorrelation was found between RHD and RHL forthe wheat accessions, r = 0.58(*). This may beseen in Figure 2, where the general impression isthat the accessions with the longest average roothairs also have the highest root hair density.
6
20
40
60
80
100
Figure 1. The relations between average values for each accession for P use efficiency (PUE) and root/shoot ratio,and PUE and m root g-1 plant DM (L*), for 17 wheat and 35 barley accessions grown in circulating low-P nutrientsolution.
Wheat Barley
Genotype Year of release Low-P nutrient solution Field
L* (m g –1 plant DM) PUE (g DM g-1 P) RHL (mm) RHL (mm)
BARLEYNOB019 ua*, 2r 64 216 0.39 0.48NOB9306 ua*, 2r 61 226 0.38 0.45Herta 1949 57 220 0.56 0.56NOB9319 ua*, 2r 54 237 0.36 0.54NOB013 ua*, 2r 54 208 0.40 0.48Dønnes <1900 51 228 0.46 0.62Herse 1939 43 239 0.56 0.54NK94682 ua 40 187 0.34 0.53Lise 1964 36 170 0.44 0.57Tore 1986 36 221 0.45 0.58Fager 2000 31 255 0.51 0.51
Level of sign. ** ** *** ***
LSD5% 31 74 0.12 0.10
WHEATBørsum ca 1900 60 204 0.51 0.52Snøgg 1940 57 183 0.70 0.49NK97537 ua* 56 186 0.61 0.43NK0058 ua 55 180 0.43 0.45NK98602 ua* 53 180 0.47 0.53NK97535 ua 50 218 0.77 0.60Møystad 1966 47 205 0.52 0.61Diamant 1928 45 219 0.82 0.63Brakar 1995 39 202 0.62 0.48
Level of sign. ns ** *** ***
LSD5% 30 58 0.14 0.10
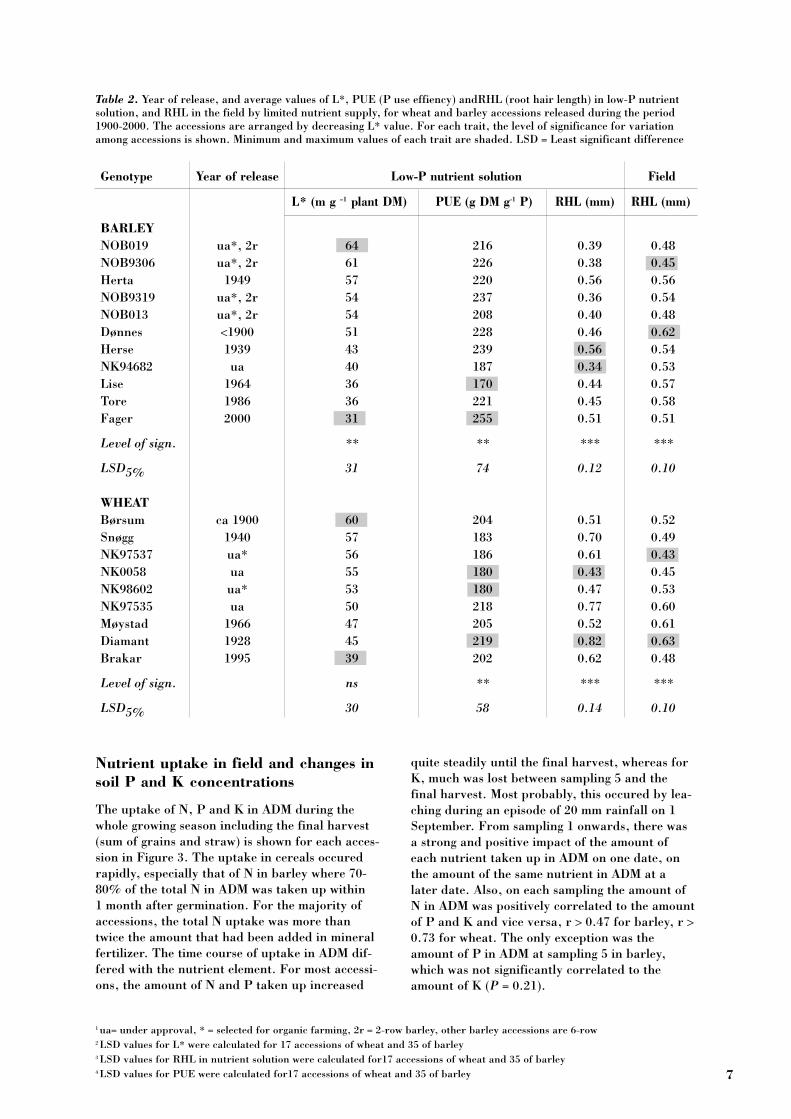
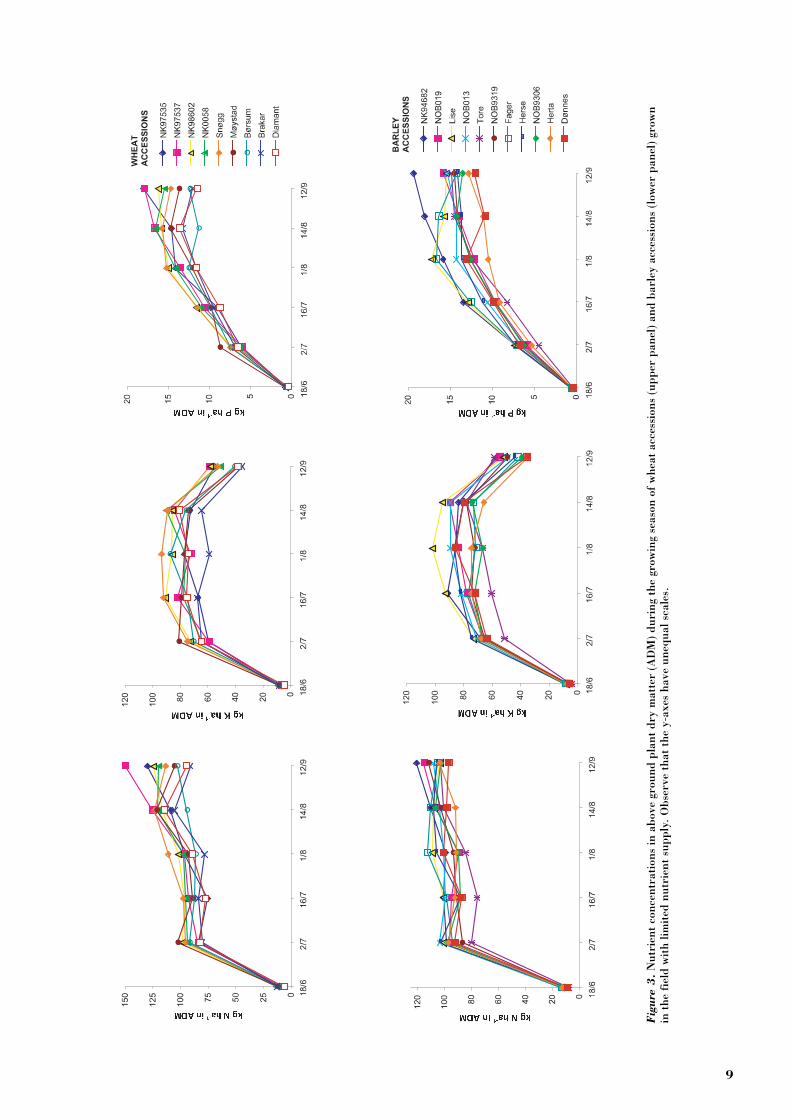
Nutrient uptake in field and changes insoil P and K concentrations
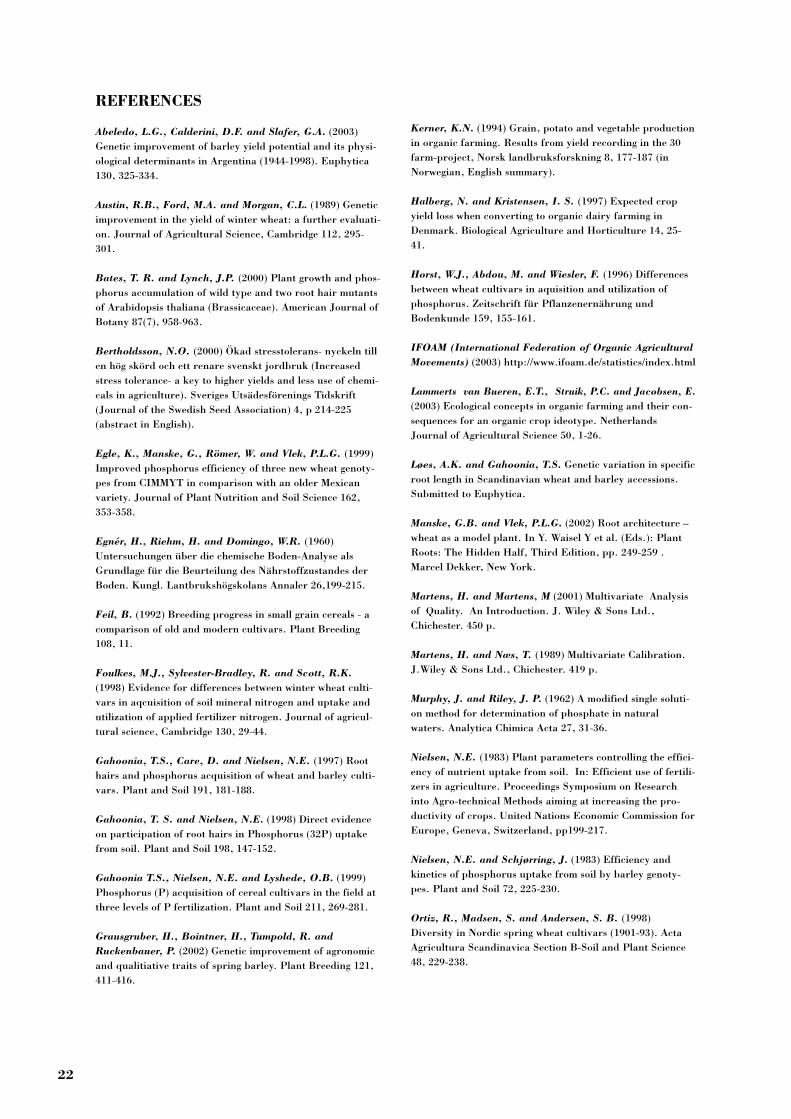
The uptake of N, P and K in ADM during thewhole growing season including the final harvest(sum of grains and straw) is shown for each acces-sion in Figure 3. The uptake in cereals occuredrapidly, especially that of N in barley where 70-80% of the total N in ADM was taken up within 1 month after germination. For the majority ofaccessions, the total N uptake was more thantwice the amount that had been added in mineralfertilizer. The time course of uptake in ADM dif-fered with the nutrient element. For most accessi-ons, the amount of N and P taken up increased
quite steadily until the final harvest, whereas forK, much was lost between sampling 5 and thefinal harvest. Most probably, this occured by lea-ching during an episode of 20 mm rainfall on 1September. From sampling 1 onwards, there wasa strong and positive impact of the amount ofeach nutrient taken up in ADM on one date, onthe amount of the same nutrient in ADM at alater date. Also, on each sampling the amount ofN in ADM was positively correlated to the amountof P and K and vice versa, r > 0.47 for barley, r >0.73 for wheat. The only exception was theamount of P in ADM at sampling 5 in barley,which was not significantly correlated to theamount of K (P = 0.21).
7
Table 2. Year of release, and average values of L*, PUE (P use effiency) andRHL (root hair length) in low-P nutrientsolution, and RHL in the field by limited nutrient supply, for wheat and barley accessions released during the period1900-2000. The accessions are arranged by decreasing L* value. For each trait, the level of significance for variationamong accessions is shown. Minimum and maximum values of each trait are shaded. LSD = Least significant difference
1 ua= under approval, * = selected for organic farming, 2r = 2-row barley, other barley accessions are 6-row2 LSD values for L* were calculated for 17 accessions of wheat and 35 of barley3 LSD values for RHL in nutrient solution were calculated for17 accessions of wheat and 35 of barley4 LSD values for PUE were calculated for17 accessions of wheat and 35 of barley
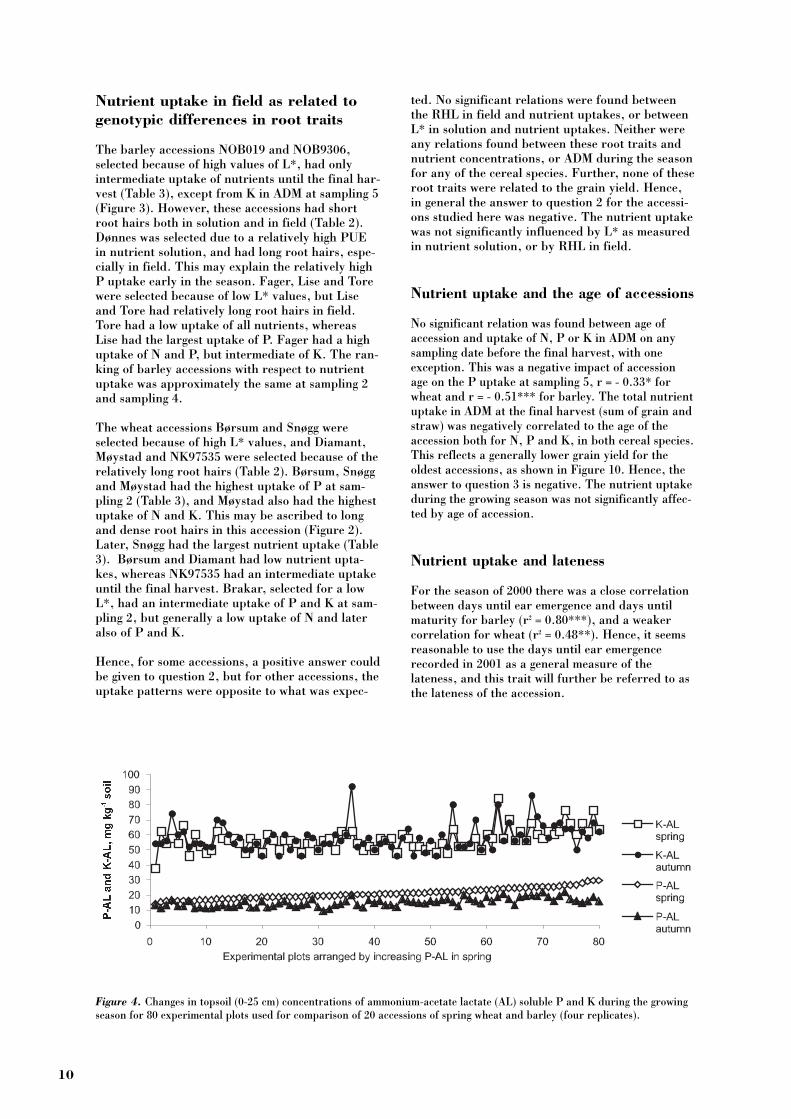
Significant differences (P > 0.05) between accessi-ons with respect to uptake of N, P or K in ADMon 2 July and 1 August are shown in Table 3. Forwheat, significant differences were only found atthese dates (sampling 2 and 4) as well as in grainand straw. For barley, the nutrient uptake wassignificantly different among accessions also atother samplings (data not shown). For the topsoil(0-25 cm depth) P-AL values, a significant decrea-se was found during the growing season (Figure4). On average for all plots, the decrease wasfrom to 21 to 15 mg P kg-1 soil, corresponding toan amount of 22 kg P ha-1 by a bulk density(Riley et al., 2003) of 1.45 t soil m-3. The averagetotal P uptake at harvest was 15 kg ha-1. As Puptake in the roots was not measured, a some-what larger decrease in soil than measured inADM seems reasonable. The easily available Kfraction was obviously replenished during the sea-son because no general decrease in topsoil K-AL
values was found, in spite of that the averageamount of K removed in grain and straw was 47kg ha-1. The average K-AL value was 57 mg K kg-1
soil in spring and 58 in autumn. The changes insoil P-AL or K-AL values from spring to autumn,hereafter called P or K balance, did not vary bet-ween barley or between wheat accessions.However, for barley, the average P balance foreach accession was related to average P uptake ingrain, r = 0.58(*) as well as to the total P uptakein grain and straw, r = 0.55 (*). Further, the Kuptake in ADM at sampling 3, 4 and 5 as well asin grains was related to the P balance for the bar-ley accessions (r varied from 0.64* to 0.71*). Forwheat, the P uptake in ADM at sampling 2 wasrelated to the P balance, r = 0.59 (*), but therewas no relation between K uptake and the Pbalance. The N uptake was not related to the Pbalance in wheat nor in barley, and no nutrientuptake was related to the K balance.
8
Figure 2. Root hairs from wheat and barley accessions with the lowest or highest values of root hair density, recor-ded in field with limited nutrient supply. Roots were sampled 18 days after germination, June 2001. Average roothair length (RHL) values are shown for each accession.
Wheat cv. NK97537, RHL 0.43 mm Wheat cv. Møystad, RHL 0.61 mm
Barley cv. NOB9306, RHL 0.45 mm Barley cv. Dønnes, RHL 0.62 mm
9
Fig
ure
3.
Nut
rien
t co
ncen
trat
ions
in a
bove
gro
und
plan
t dr
y m
atte
r (A
DM
) du
ring
the
gro
win
g se
ason
of
whe
at a
cces
sion
s (u
pper
pan
el)
and
barl
ey a
cces
sion
s (l
ower
pan
el)
grow
nin
the
fie
ld w
ith
limit
ed n
utri
ent
supp
ly.
Obs
erve
tha
t th
e y-
axes
hav
e un
equa
l sca
les.
10
Nutrient uptake in field as related togenotypic differences in root traits
The barley accessions NOB019 and NOB9306,selected because of high values of L*, had onlyintermediate uptake of nutrients until the final har-vest (Table 3), except from K in ADM at sampling 5(Figure 3). However, these accessions had shortroot hairs both in solution and in field (Table 2).Dønnes was selected due to a relatively high PUEin nutrient solution, and had long root hairs, espe-cially in field. This may explain the relatively highP uptake early in the season. Fager, Lise and Torewere selected because of low L* values, but Liseand Tore had relatively long root hairs in field.Tore had a low uptake of all nutrients, whereasLise had the largest uptake of P. Fager had a highuptake of N and P, but intermediate of K. The ran-king of barley accessions with respect to nutrientuptake was approximately the same at sampling 2and sampling 4.
The wheat accessions Børsum and Snøgg wereselected because of high L* values, and Diamant,Møystad and NK97535 were selected because of therelatively long root hairs (Table 2). Børsum, Snøggand Møystad had the highest uptake of P at sam-pling 2 (Table 3), and Møystad also had the highestuptake of N and K. This may be ascribed to longand dense root hairs in this accession (Figure 2).Later, Snøgg had the largest nutrient uptake (Table3). Børsum and Diamant had low nutrient upta-kes, whereas NK97535 had an intermediate uptakeuntil the final harvest. Brakar, selected for a lowL*, had an intermediate uptake of P and K at sam-pling 2, but generally a low uptake of N and lateralso of P and K.
Hence, for some accessions, a positive answer couldbe given to question 2, but for other accessions, theuptake patterns were opposite to what was expec-
ted. No significant relations were found betweenthe RHL in field and nutrient uptakes, or betweenL* in solution and nutrient uptakes. Neither wereany relations found between these root traits andnutrient concentrations, or ADM during the seasonfor any of the cereal species. Further, none of theseroot traits were related to the grain yield. Hence,in general the answer to question 2 for the accessi-ons studied here was negative. The nutrient uptakewas not significantly influenced by L* as measuredin nutrient solution, or by RHL in field.
Nutrient uptake and the age of accessions
No significant relation was found between age ofaccession and uptake of N, P or K in ADM on anysampling date before the final harvest, with oneexception. This was a negative impact of accessionage on the P uptake at sampling 5, r = - 0.33* forwheat and r = - 0.51*** for barley. The total nutrientuptake in ADM at the final harvest (sum of grain andstraw) was negatively correlated to the age of theaccession both for N, P and K, in both cereal species.This reflects a generally lower grain yield for theoldest accessions, as shown in Figure 10. Hence, theanswer to question 3 is negative. The nutrient uptakeduring the growing season was not significantly affec-ted by age of accession.
Nutrient uptake and lateness
For the season of 2000 there was a close correlationbetween days until ear emergence and days untilmaturity for barley (r2 = 0.80***), and a weakercorrelation for wheat (r2 = 0.48**). Hence, it seemsreasonable to use the days until ear emergencerecorded in 2001 as a general measure of thelateness, and this trait will further be referred to asthe lateness of the accession.
Figure 4. Changes in topsoil (0-25 cm) concentrations of ammonium-acetate lactate (AL) soluble P and K during the growing season for 80 experimental plots used for comparison of 20 accessions of spring wheat and barley (four replicates).
11
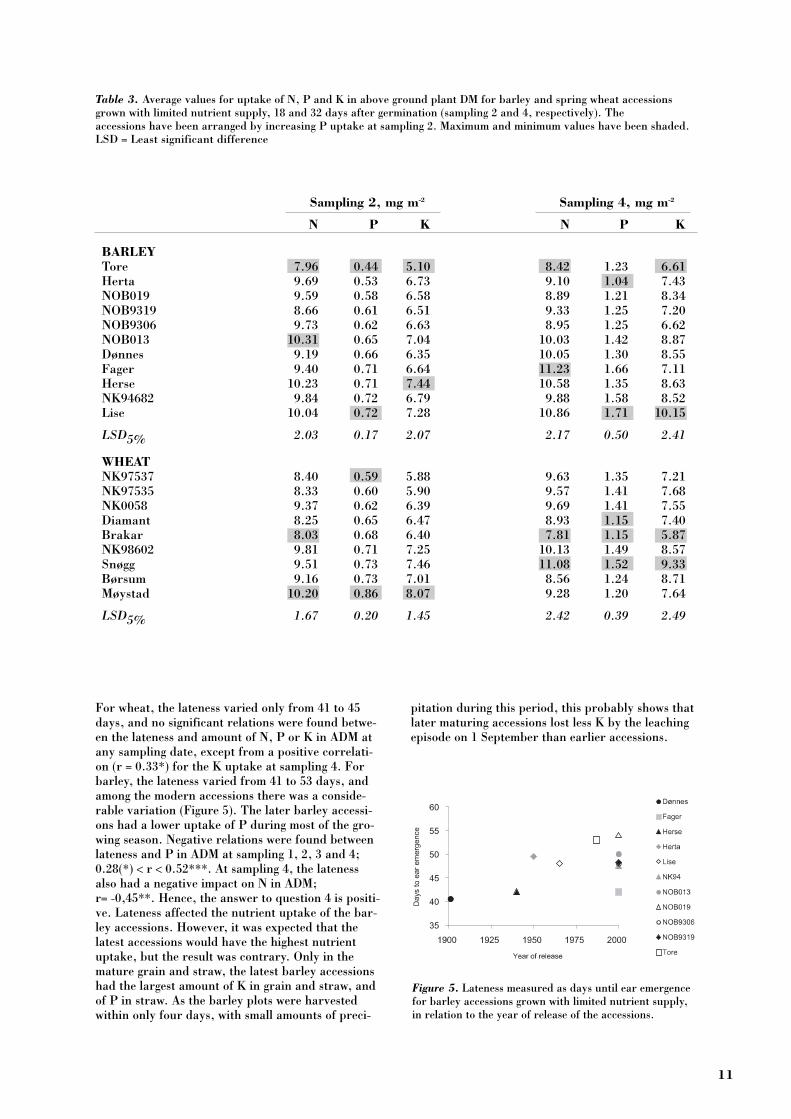
Table 3. Average values for uptake of N, P and K in above ground plant DM for barley and spring wheat accessionsgrown with limited nutrient supply, 18 and 32 days after germination (sampling 2 and 4, respectively). The accessions have been arranged by increasing P uptake at sampling 2. Maximum and minimum values have been shaded.LSD = Least significant difference
For wheat, the lateness varied only from 41 to 45days, and no significant relations were found betwe-en the lateness and amount of N, P or K in ADM atany sampling date, except from a positive correlati-on (r = 0.33*) for the K uptake at sampling 4. Forbarley, the lateness varied from 41 to 53 days, andamong the modern accessions there was a conside-rable variation (Figure 5). The later barley accessi-ons had a lower uptake of P during most of the gro-wing season. Negative relations were found betweenlateness and P in ADM at sampling 1, 2, 3 and 4;0.28(*) < r < 0.52***. At sampling 4, the latenessalso had a negative impact on N in ADM; r= -0,45**. Hence, the answer to question 4 is positi-ve. Lateness affected the nutrient uptake of the bar-ley accessions. However, it was expected that thelatest accessions would have the highest nutrientuptake, but the result was contrary. Only in themature grain and straw, the latest barley accessionshad the largest amount of K in grain and straw, andof P in straw. As the barley plots were harvestedwithin only four days, with small amounts of preci-
pitation during this period, this probably shows thatlater maturing accessions lost less K by the leachingepisode on 1 September than earlier accessions.
Sampling 2, mg m-2 Sampling 4, mg m-2
N P K N P K
BARLEYTore 7.96 0.44 5.10 8.42 1.23 6.61Herta 9.69 0.53 6.73 9.10 1.04 7.43NOB019 9.59 0.58 6.58 8.89 1.21 8.34NOB9319 8.66 0.61 6.51 9.33 1.25 7.20NOB9306 9.73 0.62 6.63 8.95 1.25 6.62NOB013 10.31 0.65 7.04 10.03 1.42 8.87Dønnes 9.19 0.66 6.35 10.05 1.30 8.55Fager 9.40 0.71 6.64 11.23 1.66 7.11Herse 10.23 0.71 7.44 10.58 1.35 8.63NK94682 9.84 0.72 6.79 9.88 1.58 8.52Lise 10.04 0.72 7.28 10.86 1.71 10.15
LSD5% 2.03 0.17 2.07 2.17 0.50 2.41
WHEATNK97537 8.40 0.59 5.88 9.63 1.35 7.21NK97535 8.33 0.60 5.90 9.57 1.41 7.68NK0058 9.37 0.62 6.39 9.69 1.41 7.55Diamant 8.25 0.65 6.47 8.93 1.15 7.40Brakar 8.03 0.68 6.40 7.81 1.15 5.87NK98602 9.81 0.71 7.25 10.13 1.49 8.57Snøgg 9.51 0.73 7.46 11.08 1.52 9.33Børsum 9.16 0.73 7.01 8.56 1.24 8.71Møystad 10.20 0.86 8.07 9.28 1.20 7.64
LSD5% 1.67 0.20 1.45 2.42 0.39 2.49
Figure 5. Lateness measured as days until ear emergencefor barley accessions grown with limited nutrient supply,in relation to the year of release of the accessions.
12
Fungal disease as related to age ofaccession and ADM
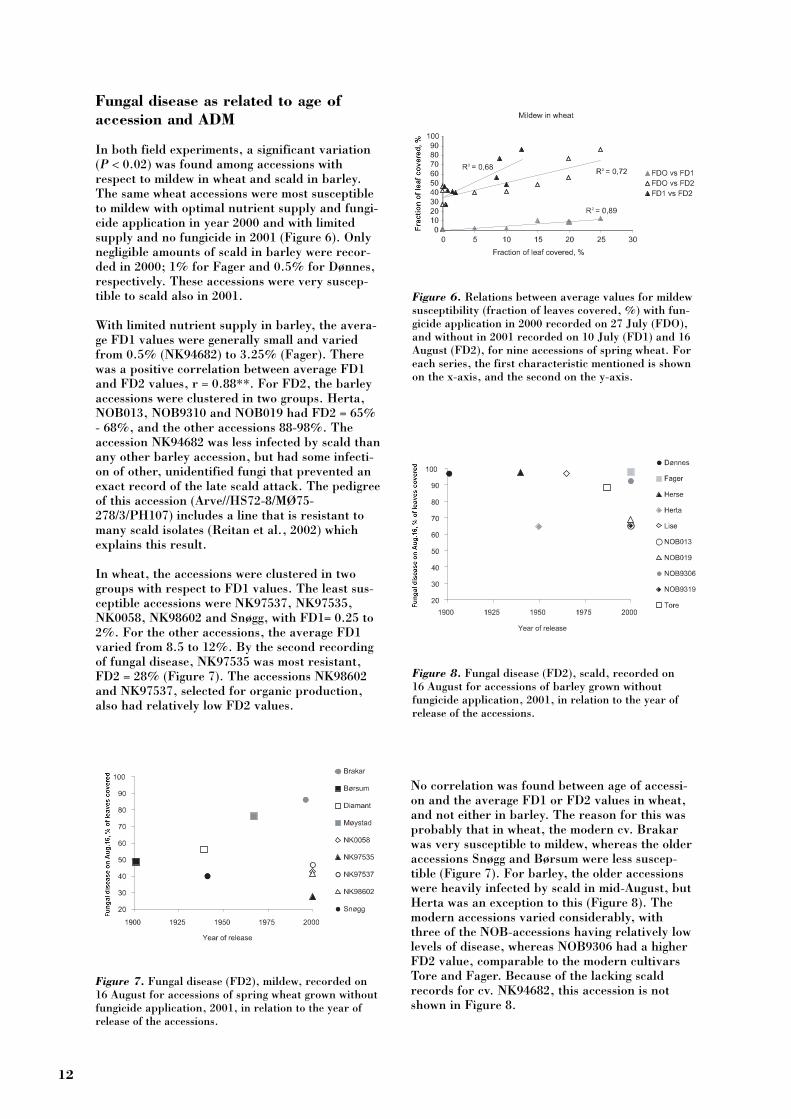
In both field experiments, a significant variation(P < 0.02) was found among accessions withrespect to mildew in wheat and scald in barley.The same wheat accessions were most susceptibleto mildew with optimal nutrient supply and fungi-cide application in year 2000 and with limitedsupply and no fungicide in 2001 (Figure 6). Onlynegligible amounts of scald in barley were recor-ded in 2000; 1% for Fager and 0.5% for Dønnes,respectively. These accessions were very suscep-tible to scald also in 2001.
With limited nutrient supply in barley, the avera-ge FD1 values were generally small and variedfrom 0.5% (NK94682) to 3.25% (Fager). Therewas a positive correlation between average FD1and FD2 values, r = 0.88**. For FD2, the barleyaccessions were clustered in two groups. Herta,NOB013, NOB9310 and NOB019 had FD2 = 65%- 68%, and the other accessions 88-98%. Theaccession NK94682 was less infected by scald thanany other barley accession, but had some infecti-on of other, unidentified fungi that prevented anexact record of the late scald attack. The pedigreeof this accession (Arve//HS72-8/MØ75-278/3/PH107) includes a line that is resistant tomany scald isolates (Reitan et al., 2002) whichexplains this result.
In wheat, the accessions were clustered in twogroups with respect to FD1 values. The least sus-ceptible accessions were NK97537, NK97535,NK0058, NK98602 and Snøgg, with FD1= 0.25 to2%. For the other accessions, the average FD1varied from 8.5 to 12%. By the second recordingof fungal disease, NK97535 was most resistant,FD2 = 28% (Figure 7). The accessions NK98602and NK97537, selected for organic production,also had relatively low FD2 values.
No correlation was found between age of accessi-on and the average FD1 or FD2 values in wheat,and not either in barley. The reason for this wasprobably that in wheat, the modern cv. Brakarwas very susceptible to mildew, whereas the olderaccessions Snøgg and Børsum were less suscep-tible (Figure 7). For barley, the older accessionswere heavily infected by scald in mid-August, butHerta was an exception to this (Figure 8). Themodern accessions varied considerably, withthree of the NOB-accessions having relatively lowlevels of disease, whereas NOB9306 had a higherFD2 value, comparable to the modern cultivarsTore and Fager. Because of the lacking scaldrecords for cv. NK94682, this accession is notshown in Figure 8.
Figure 6. Relations between average values for mildewsusceptibility (fraction of leaves covered, %) with fun-gicide application in 2000 recorded on 27 July (FDO),and without in 2001 recorded on 10 July (FD1) and 16August (FD2), for nine accessions of spring wheat. Foreach series, the first characteristic mentioned is shownon the x-axis, and the second on the y-axis.
Figure 8. Fungal disease (FD2), scald, recorded on 16 August for accessions of barley grown without fungicide application, 2001, in relation to the year ofrelease of the accessions.
Figure 7. Fungal disease (FD2), mildew, recorded on16 August for accessions of spring wheat grown withoutfungicide application, 2001, in relation to the year ofrelease of the accessions.
13
The answer to question 5 is that some modernaccessions were much more resistant to the fungaldiseases recorded here than some of the olderaccessions, but the variation was large and ingeneral the age of accession was not related to thefungal disease. Both for wheat and barley, someolder accessions were relatively resistant to mil-dew or scald, respectively. It should be noted thatthe selection of accessions was much less repre-sentative in 2001, when only 9 accessions of wheatand 11 of barley were grown, as compared to2000 when these numbers were 17 and 35, respec-tively. In the 2001-experiment, the modern acces-sions constituted a relatively higher proportionthan in 2000.
Nutrient concentrations in grains
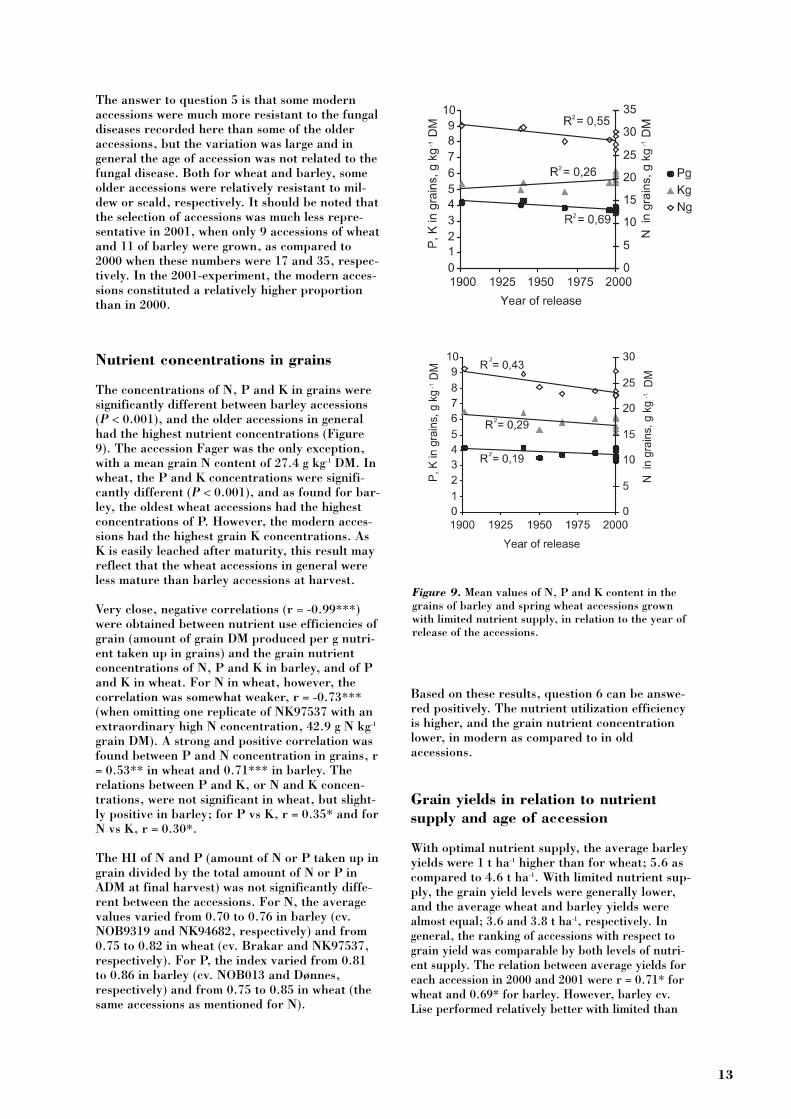
The concentrations of N, P and K in grains weresignificantly different between barley accessions(P < 0.001), and the older accessions in generalhad the highest nutrient concentrations (Figure9). The accession Fager was the only exception,with a mean grain N content of 27.4 g kg-1 DM. Inwheat, the P and K concentrations were signifi-cantly different (P < 0.001), and as found for bar-ley, the oldest wheat accessions had the highestconcentrations of P. However, the modern acces-sions had the highest grain K concentrations. AsK is easily leached after maturity, this result mayreflect that the wheat accessions in general wereless mature than barley accessions at harvest.
Very close, negative correlations (r = -0.99***)were obtained between nutrient use efficiencies ofgrain (amount of grain DM produced per g nutri-ent taken up in grains) and the grain nutrientconcentrations of N, P and K in barley, and of Pand K in wheat. For N in wheat, however, thecorrelation was somewhat weaker, r = -0.73***(when omitting one replicate of NK97537 with anextraordinary high N concentration, 42.9 g N kg-1
grain DM). A strong and positive correlation wasfound between P and N concentration in grains, r= 0.53** in wheat and 0.71*** in barley. Therelations between P and K, or N and K concen-trations, were not significant in wheat, but slight-ly positive in barley; for P vs K, r = 0.35* and forN vs K, r = 0.30*.
The HI of N and P (amount of N or P taken up ingrain divided by the total amount of N or P inADM at final harvest) was not significantly diffe-rent between the accessions. For N, the averagevalues varied from 0.70 to 0.76 in barley (cv.NOB9319 and NK94682, respectively) and from0.75 to 0.82 in wheat (cv. Brakar and NK97537,respectively). For P, the index varied from 0.81to 0.86 in barley (cv. NOB013 and Dønnes,respectively) and from 0.75 to 0.85 in wheat (thesame accessions as mentioned for N).
Based on these results, question 6 can be answe-red positively. The nutrient utilization efficiencyis higher, and the grain nutrient concentrationlower, in modern as compared to in old accessions.
Grain yields in relation to nutrient supply and age of accession
With optimal nutrient supply, the average barleyyields were 1 t ha-1 higher than for wheat; 5.6 ascompared to 4.6 t ha-1. With limited nutrient sup-ply, the grain yield levels were generally lower,and the average wheat and barley yields werealmost equal; 3.6 and 3.8 t ha-1, respectively. Ingeneral, the ranking of accessions with respect tograin yield was comparable by both levels of nutri-ent supply. The relation between average yields foreach accession in 2000 and 2001 were r = 0.71* forwheat and 0.69* for barley. However, barley cv.Lise performed relatively better with limited than
Figure 9. Mean values of N, P and K content in thegrains of barley and spring wheat accessions grownwith limited nutrient supply, in relation to the year ofrelease of the accessions.
14
with optimal supply, whereas Tore and Fager per-formed better with optimal than with limited supply.The wheat and barley cultivars selected for organicfarming performed well, especially with limitednutrient supply.
Both for wheat and barley, the grain yields weregenerally higher for modern as compared to oldercultivars, regardless of nutrient supply (Figure 10,Table 4). The wheat cv. Brakar was an exception tothis yield level pattern. This may be due to the sus-ceptibility of this cultivar to mildew. Another excep-tion was the wheat cv. Snøgg (released in1940),which performed relatively well and had a relativelylarge resistance to mildew.
An important reason for the higher grain yields inmodern accessions was a generally higher HI, espe-cially in wheat. The relation between age of accessi-on and the average HI for each accession was r = -0.92*** in wheat, and -0.72* in barley (Figure 11).Especially in barley, there was a large differencebetween the modern accessions with respect to HI. Grain yields as influenced by fungal
disease
As expected, the fungal disease had a negativeimpact on grain yields in both cereal species (Table5). It is somewhat surprising that the impact of FD2,recorded in mid-August 2001, was not more closelyrelated to the grain yields that year. As very fewbarley accessions were infected by scald at the dateof recording in 2000, no correlation between fungaldisease and grain yield were found in barley thatyear. The negative correlations between fungal dis-ease in 2001 and grain yields in 2000 show that forwheat, and as a tendency for barley, the susceptibili-ty to fungal disease was also reflected in the grainyield levels in 2000.
Surprisingly, neither FD1 nor FD2 had a negativeimpact on the ADM during the growing season (sam-pling 1-5). Further, no relation was found betweenFD1 or FD2 and straw yield by the final harvest inSeptember. On the contrary, FD1 was positively cor-related to the ADM in barley on sampling 2, r =0.28* and sampling 5, r = 0.30*. The reason for this may have been that the earliestaccessions (Fager, Herse, Dønnes; Figure 4) hadproduced relatively more ADM at sampling 2, onaverage 186 g m-2 as compared to 153 g for the other8 accessions. At the same time, these accessions weresomewhat more infected by scald in early July, onaverage FD1 = 3% as compared to 2% for the other8 accessions.
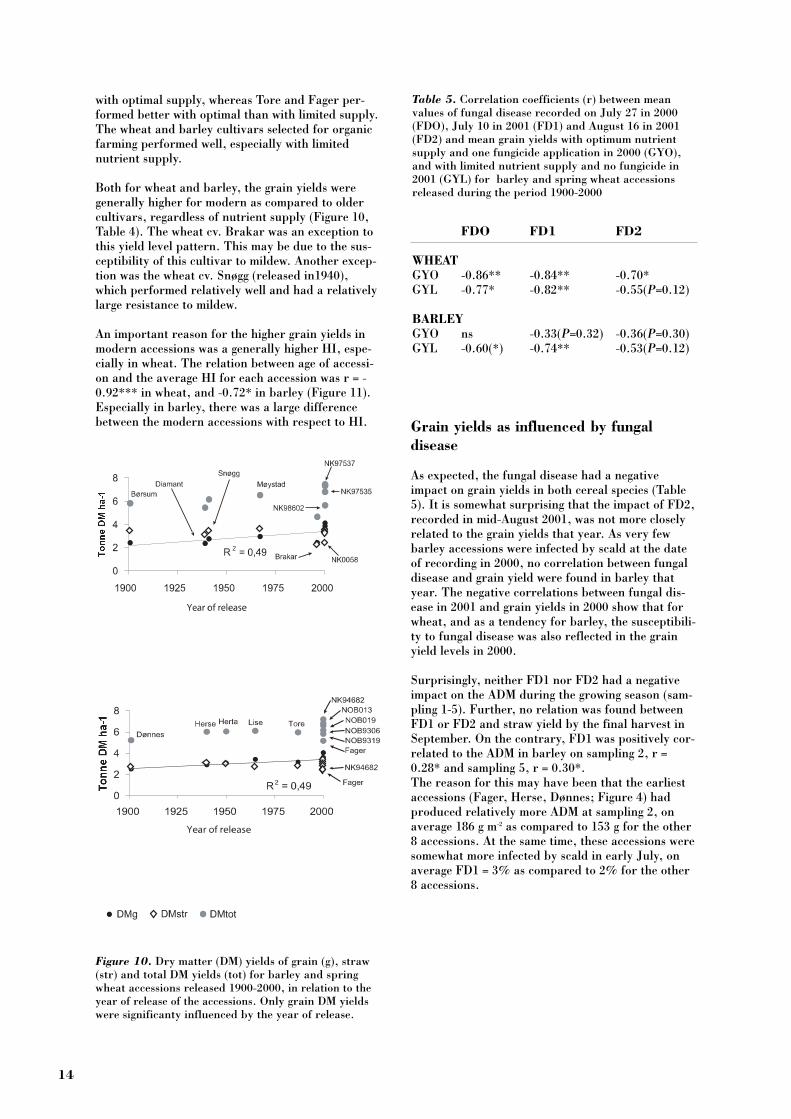
Figure 10. Dry matter (DM) yields of grain (g), straw(str) and total DM yields (tot) for barley and springwheat accessions released 1900-2000, in relation to theyear of release of the accessions. Only grain DM yieldswere significanty influenced by the year of release.
FDO FD1 FD2
WHEATGYO -0.86** -0.84** -0.70*GYL -0.77* -0.82** -0.55(P=0.12)
BARLEYGYO ns -0.33(P=0.32) -0.36(P=0.30)GYL -0.60(*) -0.74** -0.53(P=0.12)
Table 5. Correlation coefficients (r) between meanvalues of fungal disease recorded on July 27 in 2000(FDO), July 10 in 2001 (FD1) and August 16 in 2001(FD2) and mean grain yields with optimum nutrientsupply and one fungicide application in 2000 (GYO),and with limited nutrient supply and no fungicide in2001 (GYL) for barley and spring wheat accessionsreleased during the period 1900-2000
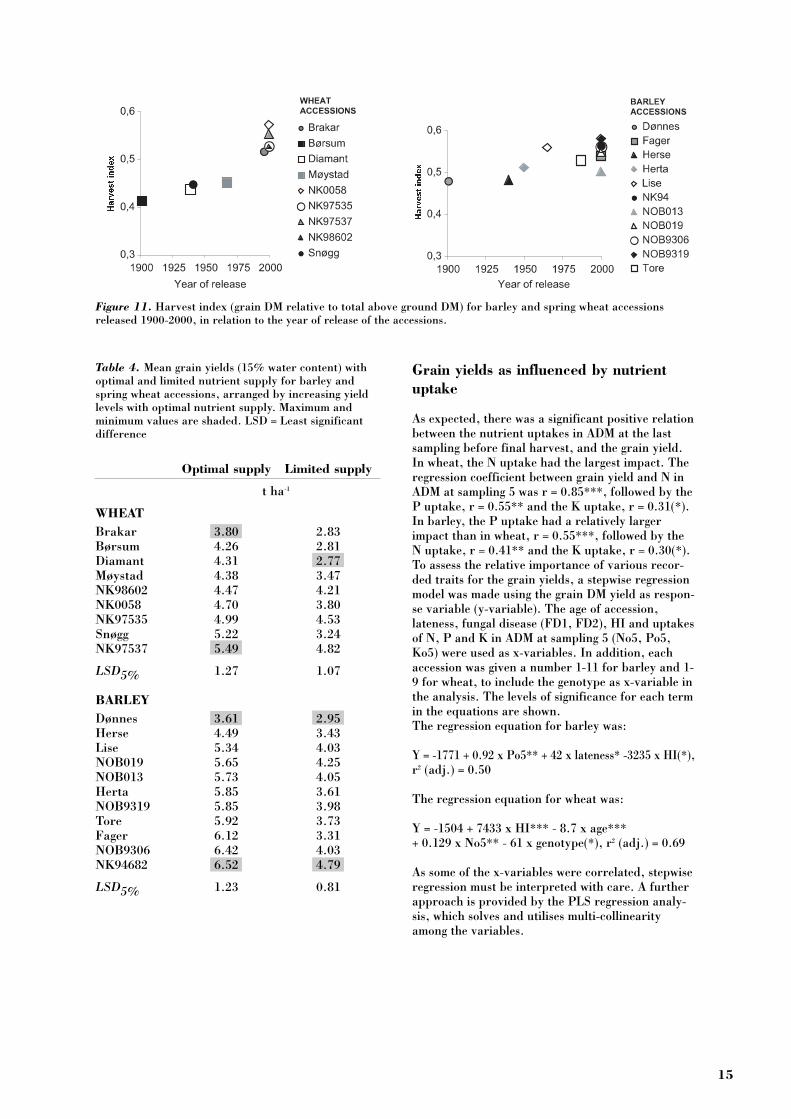
Grain yields as influenced by nutrientuptake
As expected, there was a significant positive relationbetween the nutrient uptakes in ADM at the lastsampling before final harvest, and the grain yield.In wheat, the N uptake had the largest impact. Theregression coefficient between grain yield and N inADM at sampling 5 was r = 0.85***, followed by theP uptake, r = 0.55** and the K uptake, r = 0.31(*).In barley, the P uptake had a relatively largerimpact than in wheat, r = 0.55***, followed by theN uptake, r = 0.41** and the K uptake, r = 0.30(*).To assess the relative importance of various recor-ded traits for the grain yields, a stepwise regressionmodel was made using the grain DM yield as respon-se variable (y-variable). The age of accession,lateness, fungal disease (FD1, FD2), HI and uptakesof N, P and K in ADM at sampling 5 (No5, Po5,Ko5) were used as x-variables. In addition, eachaccession was given a number 1-11 for barley and 1-9 for wheat, to include the genotype as x-variable inthe analysis. The levels of significance for each termin the equations are shown.The regression equation for barley was:
Y = -1771 + 0.92 x Po5** + 42 x lateness* -3235 x HI(*),r2 (adj.) = 0.50
The regression equation for wheat was:
Y = -1504 + 7433 x HI*** - 8.7 x age*** + 0.129 x No5** - 61 x genotype(*), r2 (adj.) = 0.69
As some of the x-variables were correlated, stepwiseregression must be interpreted with care. A furtherapproach is provided by the PLS regression analy-sis, which solves and utilises multi-collinearityamong the variables.
15
Figure 11. Harvest index (grain DM relative to total above ground DM) for barley and spring wheat accessionsreleased 1900-2000, in relation to the year of release of the accessions.
Table 4. Mean grain yields (15% water content) withoptimal and limited nutrient supply for barley andspring wheat accessions, arranged by increasing yieldlevels with optimal nutrient supply. Maximum andminimum values are shaded. LSD = Least significantdifference
Optimal supply Limited supply
t ha-1
WHEATBrakar 3.80 2.83 Børsum 4.26 2.81 Diamant 4.31 2.77 Møystad 4.38 3.47 NK98602 4.47 4.21 NK0058 4.70 3.80 NK97535 4.99 4.53 Snøgg 5.22 3.24 NK97537 5.49 4.82
LSD5% 1.27 1.07
BARLEYDønnes 3.61 2.95 Herse 4.49 3.43 Lise 5.34 4.03 NOB019 5.65 4.25 NOB013 5.73 4.05 Herta 5.85 3.61 NOB9319 5.85 3.98 Tore 5.92 3.73 Fager 6.12 3.31 NOB9306 6.42 4.03 NK94682 6.52 4.79
LSD5% 1.23 0.81
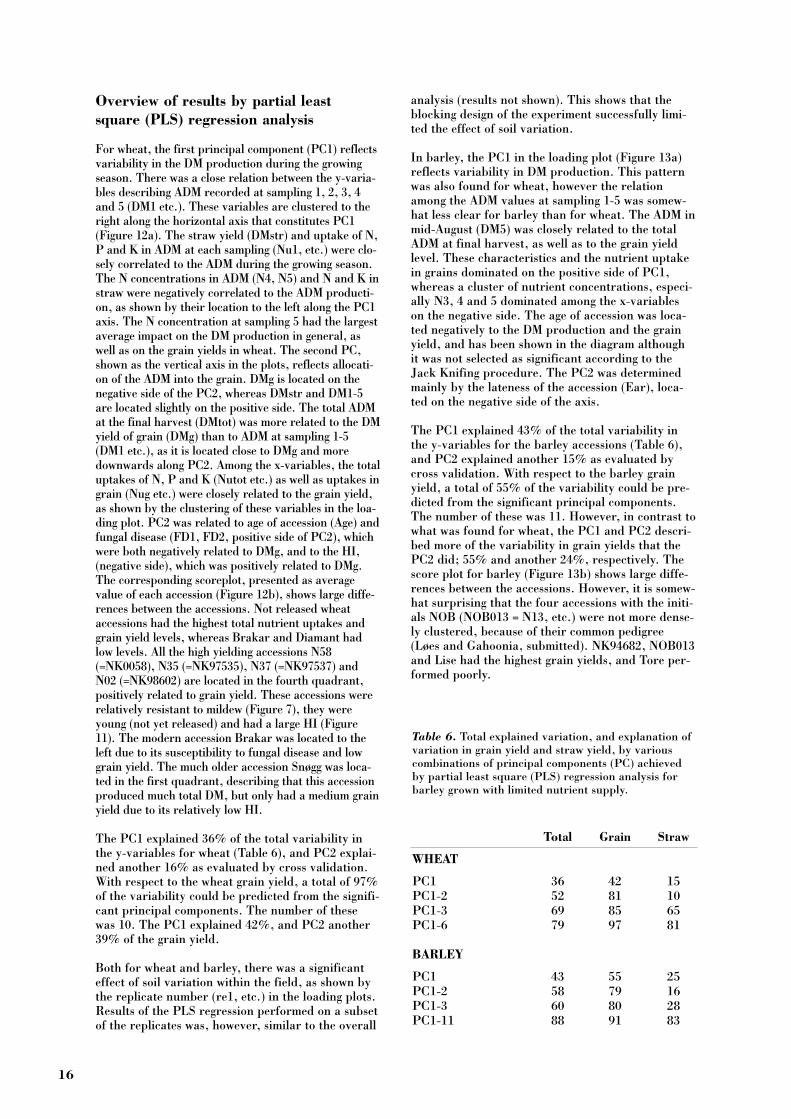
Overview of results by partial leastsquare (PLS) regression analysis
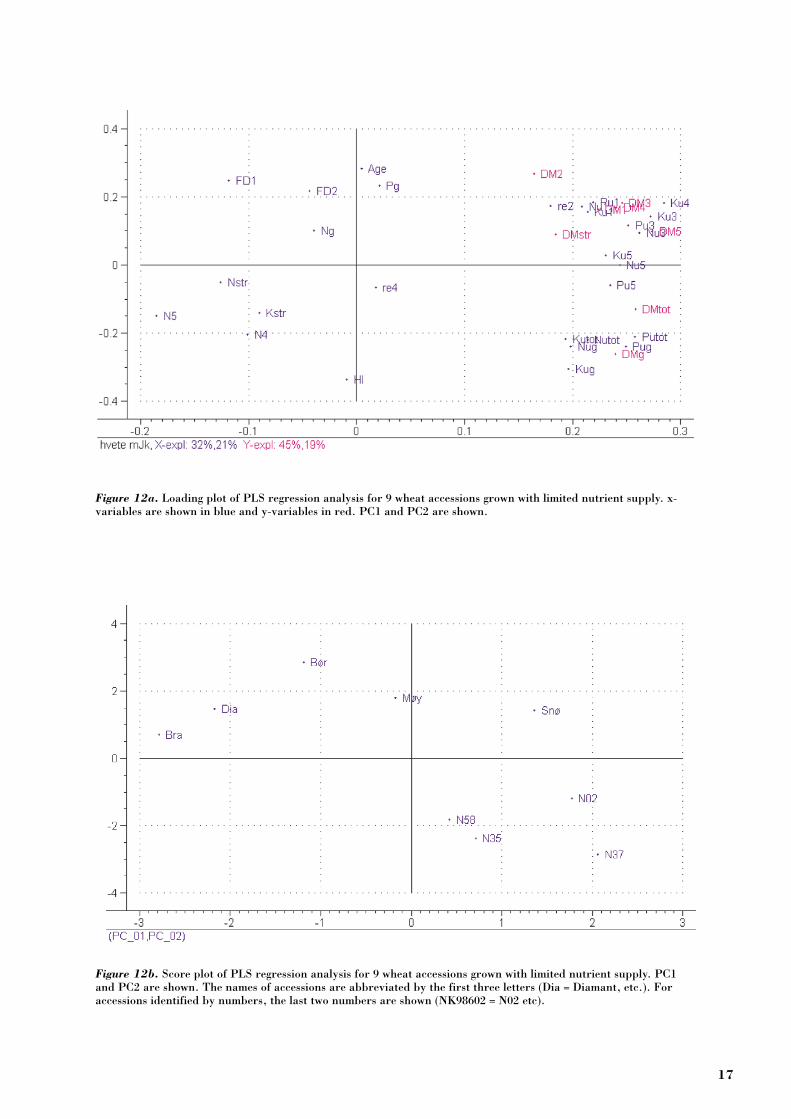
For wheat, the first principal component (PC1) reflectsvariability in the DM production during the growingseason. There was a close relation between the y-varia-bles describing ADM recorded at sampling 1, 2, 3, 4and 5 (DM1 etc.). These variables are clustered to theright along the horizontal axis that constitutes PC1(Figure 12a). The straw yield (DMstr) and uptake of N,P and K in ADM at each sampling (Nu1, etc.) were clo-sely correlated to the ADM during the growing season.The N concentrations in ADM (N4, N5) and N and K instraw were negatively correlated to the ADM producti-on, as shown by their location to the left along the PC1axis. The N concentration at sampling 5 had the largestaverage impact on the DM production in general, aswell as on the grain yields in wheat. The second PC,shown as the vertical axis in the plots, reflects allocati-on of the ADM into the grain. DMg is located on thenegative side of the PC2, whereas DMstr and DM1-5are located slightly on the positive side. The total ADMat the final harvest (DMtot) was more related to the DMyield of grain (DMg) than to ADM at sampling 1-5(DM1 etc.), as it is located close to DMg and moredownwards along PC2. Among the x-variables, the totaluptakes of N, P and K (Nutot etc.) as well as uptakes ingrain (Nug etc.) were closely related to the grain yield,as shown by the clustering of these variables in the loa-ding plot. PC2 was related to age of accession (Age) andfungal disease (FD1, FD2, positive side of PC2), whichwere both negatively related to DMg, and to the HI,(negative side), which was positively related to DMg.The corresponding scoreplot, presented as averagevalue of each accession (Figure 12b), shows large diffe-rences between the accessions. Not released wheataccessions had the highest total nutrient uptakes andgrain yield levels, whereas Brakar and Diamant hadlow levels. All the high yielding accessions N58(=NK0058), N35 (=NK97535), N37 (=NK97537) andN02 (=NK98602) are located in the fourth quadrant,positively related to grain yield. These accessions wererelatively resistant to mildew (Figure 7), they wereyoung (not yet released) and had a large HI (Figure11). The modern accession Brakar was located to theleft due to its susceptibility to fungal disease and lowgrain yield. The much older accession Snøgg was loca-ted in the first quadrant, describing that this accessionproduced much total DM, but only had a medium grainyield due to its relatively low HI.
The PC1 explained 36% of the total variability inthe y-variables for wheat (Table 6), and PC2 explai-ned another 16% as evaluated by cross validation.With respect to the wheat grain yield, a total of 97%of the variability could be predicted from the signifi-cant principal components. The number of thesewas 10. The PC1 explained 42%, and PC2 another39% of the grain yield.
Both for wheat and barley, there was a significanteffect of soil variation within the field, as shown bythe replicate number (re1, etc.) in the loading plots.Results of the PLS regression performed on a subsetof the replicates was, however, similar to the overall
analysis (results not shown). This shows that theblocking design of the experiment successfully limi-ted the effect of soil variation.
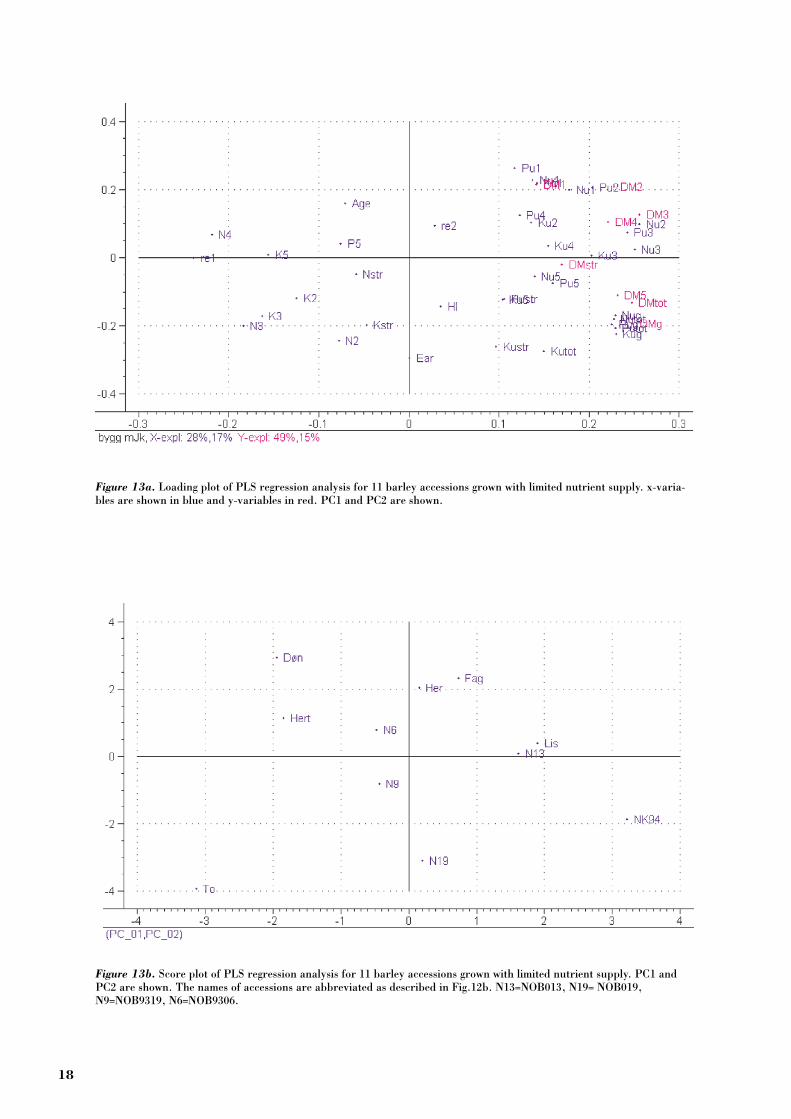
In barley, the PC1 in the loading plot (Figure 13a)reflects variability in DM production. This patternwas also found for wheat, however the relationamong the ADM values at sampling 1-5 was somew-hat less clear for barley than for wheat. The ADM inmid-August (DM5) was closely related to the totalADM at final harvest, as well as to the grain yieldlevel. These characteristics and the nutrient uptakein grains dominated on the positive side of PC1,whereas a cluster of nutrient concentrations, especi-ally N3, 4 and 5 dominated among the x-variableson the negative side. The age of accession was loca-ted negatively to the DM production and the grainyield, and has been shown in the diagram althoughit was not selected as significant according to theJack Knifing procedure. The PC2 was determinedmainly by the lateness of the accession (Ear), loca-ted on the negative side of the axis.
The PC1 explained 43% of the total variability inthe y-variables for the barley accessions (Table 6),and PC2 explained another 15% as evaluated bycross validation. With respect to the barley grainyield, a total of 55% of the variability could be pre-dicted from the significant principal components.The number of these was 11. However, in contrast towhat was found for wheat, the PC1 and PC2 descri-bed more of the variability in grain yields that thePC2 did; 55% and another 24%, respectively. Thescore plot for barley (Figure 13b) shows large diffe-rences between the accessions. However, it is somew-hat surprising that the four accessions with the initi-als NOB (NOB013 = N13, etc.) were not more dense-ly clustered, because of their common pedigree(Løes and Gahoonia, submitted). NK94682, NOB013and Lise had the highest grain yields, and Tore per-formed poorly.
16
Total Grain Straw
WHEAT
PC1 36 42 15PC1-2 52 81 10PC1-3 69 85 65PC1-6 79 97 81
BARLEY
PC1 43 55 25PC1-2 58 79 16PC1-3 60 80 28PC1-11 88 91 83
Table 6. Total explained variation, and explanation ofvariation in grain yield and straw yield, by variouscombinations of principal components (PC) achievedby partial least square (PLS) regression analysis forbarley grown with limited nutrient supply.
17
Figure 12b. Score plot of PLS regression analysis for 9 wheat accessions grown with limited nutrient supply. PC1and PC2 are shown. The names of accessions are abbreviated by the first three letters (Dia = Diamant, etc.). Foraccessions identified by numbers, the last two numbers are shown (NK98602 = N02 etc).
Figure 12a. Loading plot of PLS regression analysis for 9 wheat accessions grown with limited nutrient supply. x-variables are shown in blue and y-variables in red. PC1 and PC2 are shown.
18
Figure 13b. Score plot of PLS regression analysis for 11 barley accessions grown with limited nutrient supply. PC1 andPC2 are shown. The names of accessions are abbreviated as described in Fig.12b. N13=NOB013, N19= NOB019,N9=NOB9319, N6=NOB9306.
Figure 13a. Loading plot of PLS regression analysis for 11 barley accessions grown with limited nutrient supply. x-varia-bles are shown in blue and y-variables in red. PC1 and PC2 are shown.
19
DISCUSSION
In short, the answers to the initial six questionswere that the ranking of accessions with respectto RHL was not the same in field as in nutrientsolution. Only for a few accessions, a relation bet-ween L* or RHL and the nutrient uptake wasfound. The age of accession was not found toinfluence the nutrient uptake. For the barleyaccessions, lateness had a negative impact of thenutrient uptake. This was contrary to what wasexpected, namely increased nutrient uptake by anincreased growing period. The resistance to fun-gal diseases varied among the modern as well asamong the older accessions, but in general, themodern accessions were less susceptible. The con-centrations of nutrients in grains were higher inolder than in modern accessions.
Impact of root traits on nutrient efficiency
Many previous studies (Gahoonia et al., 1999;Nielsen and Schjørring, 1983; Römer et al., 1988;Römer and Schenk, 1998; Bertholdsson, 2000;Watt et al., 2001) have demonstrated significantgenetic variation in root traits. Some of these stu-dies (Nielsen and Schjørring, 1983; Bertholdsson,2000) did also show a clear relation between roottrait differences and grain yields. The presentstudy could not confirm the relationship of roottraits to nutrient uptake or grain yield. Theresults of Manske and Vlek (2002) may contributeto explain this. These authors found that rootlength density in soil was only positively correla-ted to wheat grain yields with low P-supply. Withhigh supply, there was a negative effect of highroot density on grain yield level, explained by thecarbon costs to produce the roots. The nutrientsupply in the field experiment of the presentstudy was low for Norwegian conditions, and thenutrient supply was indeed limited, only 50 kg Nha-1. Still, the nutrient supply might have beenabove a level where the differences in L* or RHLcould have a significant impact. The grain yieldswere equal to the average grain yields reported byKerner (1994) for commercial organic farmingsystems, fertilized with on average 25 t farmyardmanure ha-1y-1. This reflects that when a smallamount of easily available N is provided, cerealcrops have a large capacity to take up P and Kfrom soil, even when reserves of these nutrientsare small.
With respect to RHL, most evidence for theimportance of these plant organs in nutrient upta-ke have been achieved in controlled environmentstudies (Gahoonia et al., 1997; Gahoonia andNielsen, 1998; Bates and Lynch, 2000). However,in field the results regarding the impact of roothairs on nutrient uptake remained less clear. Wen
and Schnable (1994) found no restrictions in fieldgrowth for maize mutants with very restrictedroot hair elongation. In a study of pairs of barleyand wheat accessions with long vs. short roothairs, the barley accession with long root hairshad a significantly larger uptake of P in field.However, in wheat, the accession with the shor-test root hairs took up most P (Gahoonia et al.,1999), possibly due to P-mobilizing factors suchas root exudates. These results may contribute toexplain why RHL only in a few cases was positive-ly related to the nutrient uptake in the presentstudy.
Impact of other factors influencingnutrient uptake and grain yield
In most previous studies of nutrient efficiency incereals, variables such as susceptibility to fungaldisease and lateness have not been discussed. Ourstudy highlights the importance of linking roottraits and nutrient efficiency with such traits ofcereal accessions to achieve results that may bereliable and useful for low-input farming systemslike organic farming. Further, it must be mentio-ned that the present study mainly concentratedon morphological root traits like L* and RHL.Other possible differences in root traits, such asthe exudation of organic acids or the associationwith arbuscular mycorrhiza, might have contri-buted to explain the differences in nutrient upta-ke under conditions of limited nutrient supply.
Impact of breeding on nutrient efficiency, grain nutrient concentrations,fungal disease and grain yields
In the present study, the older accessions did notshow a higher nutrient uptake efficiency thanmodern accessions in any of the cereal species.This is in accordance with other authors (Egle etal., 1999; Feil, 1992; Horst et al., 1996; Stöppleret al., 1989). However, Foulkes et al. (1998) sho-wed that the oldest accessions released in theperiod 1969-1988 had a higher uptake of N fromsoil without N supply, whereas the most recentaccessions had a relatively higher uptake of Napplied in fertilizer. A common trait for themodern accessions in that study was the introduc-tion of semi-dwarf genes causing shorter strawand less vigorous pre-anthesis growth, but also aprolonged green canopy after anthesis, increasingthe period of N uptake. This demonstrates thatbreeding with ample N-supply may in fact influ-ence the nutrient efficiency of the accessions. Theother authors referred above used accessionsfrom a longer time period (typically 1900-1990) todraw their conclusions, so the results of Foulkeset al. (1998) is not necessarily contradictory totheir results. This reflects that whereas cereal
20
breeding in the first part of the last century didnot impact nutrient efficiency, there is a possibili-ty that the last decades of breeding has caused adecreasing ability to take up nutrients from soil.This should be further studied.
The grain nutrient concentrations in the presentstudy were generally higher, and the nutrient useefficiencies lower, in older as compared tomodern accessions. This is in accordance withAustin et al. (1980), whereas Foulkes et al. (1998)did not find any significant relationship.However, the years of release for the accessionsstudied by Austin et al. (1980), 1900-1986 weremore comparable to those in the present study. Alower nutrient concentration in the grains is notfortunate for farming systems with limited nutri-ent supply and pesticide use because it maydecrease the early growth vigor and hence thecompetitive ability of the seedlings. This topicshould be addressed in future cereal breeding.
Resistance to fungal disease has been an essentialgoal in Scandinavian cereal breeding, and thiswas reflected in the present data. Stöppler et al.(1989) also found that the susceptibility to mildewwas larger for the older accessions of wheat, andthat this contributed to significant higher yieldlevels for modern as compared to old accessionsgrown in an organic farming system. In the pre-sent study, some modern wheat accessions had arelatively strong resistance to mildew, and somemodern barley accessions to scald. However,some older accessions were also relatively resis-tant. All accessions with a relatively high uptakeof nutrients were those which were less suscep-tible to fungal disease (compare Figure 3 withFigures 7 and 8). A reason for this may be thatthese accessions were able to keep the nutrientuptake at a high level for a longer period of timebecause they kept their leaves green longer.
Not surprisingly, the results demonstrated closerelationships between ADM production and N, Pand K uptakes. ADM as well as the amounts of N,P and K included in ADM accumulated duringthe growing season, until the amount of K takenup declined from sampling 4 onwards (earlyAugust). Some accessions, notably wheat cv.Snøgg, NK98602, NK97535 and NK97537, andbarley cv. Lise, Fager and NK94682, had a relati-vely higher nutrient uptake during the seasonthan the other accessions. In some cases, theaccessions with the highest nutrient uptakes alsohad high grain yields, and for barley, the uptakeof P at sampling 5 was an important explanationfor the grain yields. However, in general the rela-tion between nutrient uptake in ADM in mid-August (when the grain-filling period started) andthe grain yields was weaker than could have beenexpected with the limited nutrient supply. Inaccordance with other authors (Stöppler et al.,1989), the modern accessions produced higher
grain yields than older accessions both with limi-ted and with optimal nutrient supply. This is notbecause the modern accessions have an increasedability to take up nutrients from soil, but anincreased HI and increased resistance to fungaldisease contributed to this result both in the pre-sent study and in the study of Stöppler et al.(1989).
Accessions of special interest for further breeding
The wheat cv. Møystad demonstrated an interes-ting correlation between root hairs and highnutrient uptake levels in the early growing sea-son. The wheat cv. Snøgg seemed to combine ahigh nutrient uptake, possibly correlated to ahigh L* value measured in nutrient solution, witha favorable resistance to fungal disease. In orga-nic farming systems with animal husbandry, cere-al straw yields are of interest both as fodder andfor bedding. Hence, some of the older accessionssuch as Snøgg and Møystad may be of interest fororganic farming systems because of their higherstraw yield (Figure 10). Some modern accessions,such as wheat accessions NK97537 and NK97535and barley NOB013, also had high straw yields.Both wheat accessions selected for organic far-ming, NK98602 and NK97537 performed well andproduced high grain yields regardless of nutrientregime conditions. NK97537 also had a largestraw yield, and hence is of special interest fororganic farming systems. However, it was takenout of breeding in 2002. Among the barley acces-sions selected for organic farming, NOB013 see-med to be the best when both grain and strawyields are considered. NK94682, actually selectedfor conventional farming, performed best of allthe barley lines and could probably have becomea good cultivar for organic farming systems.However, this accession was also taken out of bre-eding in 2002, as well as all NOB-accessions.
The simple measurements of root traits understressed conditions in nutrient solution describedby Bertholdsson (2000) seems promising, and toour knowledge this is the only commercial bree-ding effort that as routine includes records ofroot traits.
21
CONCLUSION
The present study has demonstrated that roottraits should not be considered alone, but as anintegrated part of other yield determining factorsto provide a meaningful explanation of the nutri-ent uptake during the growing season. Hence,records of root traits, fungal disease, lateness ofaccessions and grain and straw yield at harvest,should be essential for selection of accessions forfarming systems with limited nutrient supply andpesticide use. In many cases, records of roottraits may be necessary, especially in the initiallaboratory screening of accessions. However,recording the ability to produce satisfactory grainyields with limited, but well-defined field conditi-ons, may be a simpler indirect measure of nutri-ent efficiency in cereals, that comes close to far-mers' practice. On the whole it seems that theachievements of conventional cereal breedinghave also been useful for organic farming sys-tems.
ACKNOWLEDGEMENTS
The authors want to express their gratitude to allthe people in the technical staff that were contri-buting in chemical analyses and field experi-ments, especially Håkon Linnerud and AstriBarlund. Prof. Niels Erik Nielsen is acknowled-ged for scientific advice. Seeds were kindly provi-ded from Nordic Gene Bank, Graminor, Svalöf-Weibull, Dep. of Horticulture and Crop Plants,Agricultural University of Norway and NorwegianCrop Research Institute. Financial resourceswere provided by the Norwegian ResearchCouncil, Nordic Academy for Advanced Study(NorFa), and Norwegian Centre for EcologicalAgriculture (NORSØK).
22
REFERENCES
Abeledo, L.G., Calderini, D.F. and Slafer, G.A. (2003)Genetic improvement of barley yield potential and its physi-ological determinants in Argentina (1944-1998). Euphytica130, 325-334.
Austin, R.B., Ford, M.A. and Morgan, C.L. (1989) Geneticimprovement in the yield of winter wheat: a further evaluati-on. Journal of Agricultural Science, Cambridge 112, 295-301.
Bates, T. R. and Lynch, J.P. (2000) Plant growth and phos-phorus accumulation of wild type and two root hair mutantsof Arabidopsis thaliana (Brassicaceae). American Journal ofBotany 87(7), 958-963.
Bertholdsson, N.O. (2000) Ökad stresstolerans- nyckeln tillen hög skörd och ett renare svenskt jordbruk (Increasedstress tolerance- a key to higher yields and less use of chemi-cals in agriculture). Sveriges Utsädesförenings Tidskrift(Journal of the Swedish Seed Association) 4, p 214-225(abstract in English).
Egle, K., Manske, G., Römer, W. and Vlek, P.L.G. (1999)Improved phosphorus efficiency of three new wheat genoty-pes from CIMMYT in comparison with an older Mexicanvariety. Journal of Plant Nutrition and Soil Science 162,353-358.
Egnér, H., Riehm, H. and Domingo, W.R. (1960)Untersuchungen über die chemische Boden-Analyse alsGrundlage für die Beurteilung des Nährstoffzustandes derBoden. Kungl. Lantbrukshögskolans Annaler 26,199-215.
Feil, B. (1992) Breeding progress in small grain cereals - acomparison of old and modern cultivars. Plant Breeding108, 11.
Foulkes, M.J., Sylvester-Bradley, R. and Scott, R.K.(1998) Evidence for differences between winter wheat culti-vars in aqcuisition of soil mineral nitrogen and uptake andutilization of applied fertilizer nitrogen. Journal of agricul-tural science, Cambridge 130, 29-44.
Gahoonia, T.S., Care, D. and Nielsen, N.E. (1997) Roothairs and phosphorus acquisition of wheat and barley culti-vars. Plant and Soil 191, 181-188.
Gahoonia, T. S. and Nielsen, N.E. (1998) Direct evidenceon participation of root hairs in Phosphorus (32P) uptakefrom soil. Plant and Soil 198, 147-152.
Gahoonia T.S., Nielsen, N.E. and Lyshede, O.B. (1999)Phosphorus (P) acquisition of cereal cultivars in the field atthree levels of P fertilization. Plant and Soil 211, 269-281.
Grausgruber, H., Bointner, H., Tumpold, R. andRuckenbauer, P. (2002) Genetic improvement of agronomicand qualitiative traits of spring barley. Plant Breeding 121,411-416.
Kerner, K.N. (1994) Grain, potato and vegetable productionin organic farming. Results from yield recording in the 30farm-project, Norsk landbruksforskning 8, 177-187 (inNorwegian, English summary).
Halberg, N. and Kristensen, I. S. (1997) Expected cropyield loss when converting to organic dairy farming inDenmark. Biological Agriculture and Horticulture 14, 25-41.
Horst, W.J., Abdou, M. and Wiesler, F. (1996) Differencesbetween wheat cultivars in aquisition and utilization ofphosphorus. Zeitschrift für Pflanzenernährung undBodenkunde 159, 155-161.
IFOAM (International Federation of Organic AgriculturalMovements) (2003) http://www.ifoam.de/statistics/index.html
Lammerts van Bueren, E.T., Struik, P.C. and Jacobsen, E.(2003) Ecological concepts in organic farming and their con-sequences for an organic crop ideotype. NetherlandsJournal of Agricultural Science 50, 1-26.
Løes, A.K. and Gahoonia, T.S. Genetic variation in specificroot length in Scandinavian wheat and barley accessions.Submitted to Euphytica.
Manske, G.B. and Vlek, P.L.G. (2002) Root architecture –wheat as a model plant. In Y. Waisel Y et al. (Eds.): PlantRoots: The Hidden Half, Third Edition, pp. 249-259 .Marcel Dekker, New York.
Martens, H. and Martens, M (2001) Multivariate Analysisof Quality. An Introduction. J. Wiley & Sons Ltd.,Chichester. 450 p.
Martens, H. and Næs, T. (1989) Multivariate Calibration.J.Wiley & Sons Ltd., Chichester. 419 p.
Murphy, J. and Riley, J. P. (1962) A modified single soluti-on method for determination of phosphate in naturalwaters. Analytica Chimica Acta 27, 31-36.
Nielsen, N.E. (1983) Plant parameters controlling the effici-ency of nutrient uptake from soil. In: Efficient use of fertili-zers in agriculture. Proceedings Symposium on Researchinto Agro-technical Methods aiming at increasing the pro-ductivity of crops. United Nations Economic Commission forEurope, Geneva, Switzerland, pp199-217.
Nielsen, N.E. and Schjørring, J. (1983) Efficiency andkinetics of phosphorus uptake from soil by barley genoty-pes. Plant and Soil 72, 225-230.
Ortiz, R., Madsen, S. and Andersen, S. B. (1998)Diversity in Nordic spring wheat cultivars (1901-93). ActaAgricultura Scandinavica Section B-Soil and Plant Science48, 229-238.
23
Ortiz, R., Nurminiemi, M., Madsen, S., Rognli, O. A. andBjørnstad, Å. (2002) Genetic gains in Nordic spring barleybreeding over sixty years. Euphytica 126, 283-289.
Pratt, P.F. (1965) Potassium. In C.A. Black (ed.) Methodsof soil analysis Part 2: Chemical and microbiological proper-ties. American Society of Agronomy, Madison, Wisconsin,1023-1031.
Reitan, L., Grønnerød, S., Ristad, T. P., Salamati, S.,Skinnes, H., Waugh, R. and Bjørnstad, Å. (2002)Characterization of resistance genes against scald(Rhynchosporium secalis (Oudem.) J.J.Davis) in barley(Hordeum vulgare L.) lines from central Norway, by meansof genetic markers and pathotype tests. Euphytica 123, 31-39.
Riley, H., Løes,A.K., Hansen, S. and Dragland, S. (2003)Yield responses and nutrient utilization with the use of chop-ped grass and clover material as surface mulches in an orga-nic vegetable growing system. Biological Agriculture andHorticulture 21, p 63-90.
Römer, W., Augustin, J. and Schilling, G. (1988) The rela-tionship between phosphate absorption and root length innine wheat cultivars. Plant and Soil 111, 199-201.
Römer, W. and Schenk, H. (1998) Influence of genotype onphosphate uptake and utilization efficiencies in spring bar-ley. European Journal of Agronomy 8, 215-224.
SAS Institute (1989) SAS/STAT. User Guide. Version 5.SAS Institute Inc., Cary, NC, USA.
Sattelmacher, B., Horst, W. J. and Becker, H. C. (1994)Factors that contribute to genetic variation for nutrient effi-ciency of crop plants. Zeitschrift für Pflanzenernährungund Bodenkunde 157, 215-224.
Stöppler, H., Kölsch, E. and Vogtmann, H. (1989)Auswirkungen der Züchtung bei Winterweizen in einemlandwirtschaftlichen System mit geringerBetriebsmittelzufuhr von aussen. Journal of Agronomy andCrop Science 162, 325-332.
Watt, M., Kirkegaard, J.A., Simpendorfer, S., Rebetzke,G.J., and McCully, M.E. (2001) Variation in wheat genoty-pes to no-till farming- responses to soil biology and structu-re. In: Proceedings 6th International Society of RootResarch (ISRR) Symposium, Nagoya, Japan, pp 424-425.
Wen, T. J. and P. S. Schnable (1994) Analysis of mutant ofthree genes that influence root hair development in Zeamays (Graminae) suggests that root hairs are dispensable.American Journal of Botany 81, 833-842.