the impact of intensive stormwater infiltration on ... · the impact of intensive stormwater...
TRANSCRIPT
The Impact of Intensive Stormwater Infiltration on Groundwater Levels in PhiladelphiaPhiladelphia Water Department
AWRA Annual ConferencePhiladelphia November 1 – 4, 2010
Mark Maimone, Ph.D, P.E., D.WRE
Dan O’Rourke, PG

Presentation Overview
Infiltration through green infrastructure in urban settings is a national trend
Little known about impacts to the groundwater system
Two models developed for the Philadelphia Water Department to study impacts of their Green Infrastructure Program
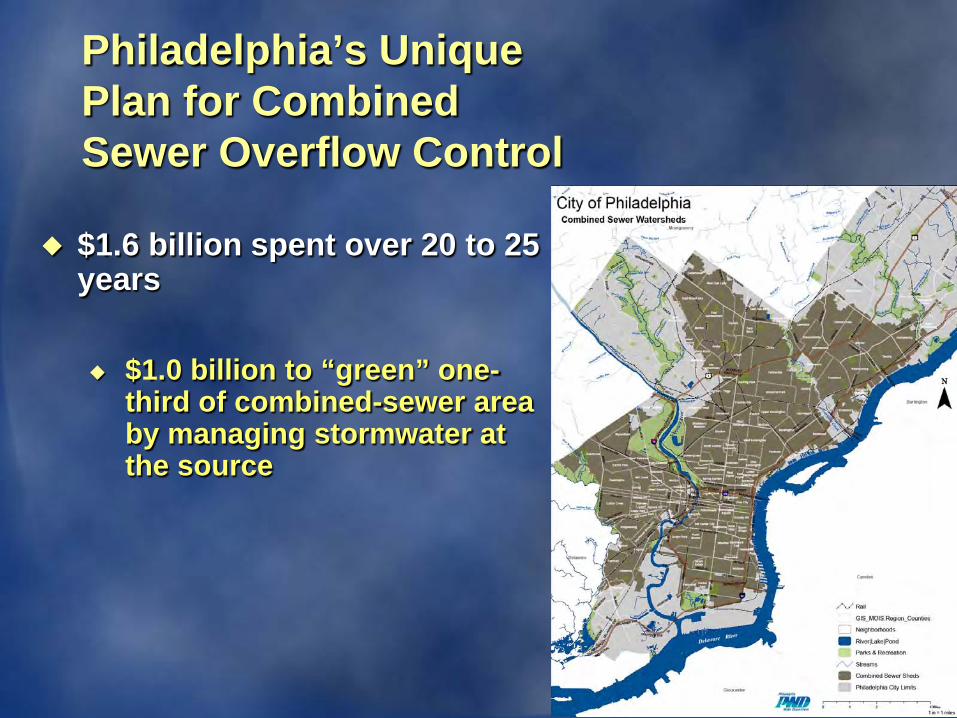
Philadelphia’s Unique Plan for Combined Sewer Overflow Control
$1.6 billion spent over 20 to 25 years
$1.0 billion to “green” one-third of combined-sewer area by managing stormwater at the source
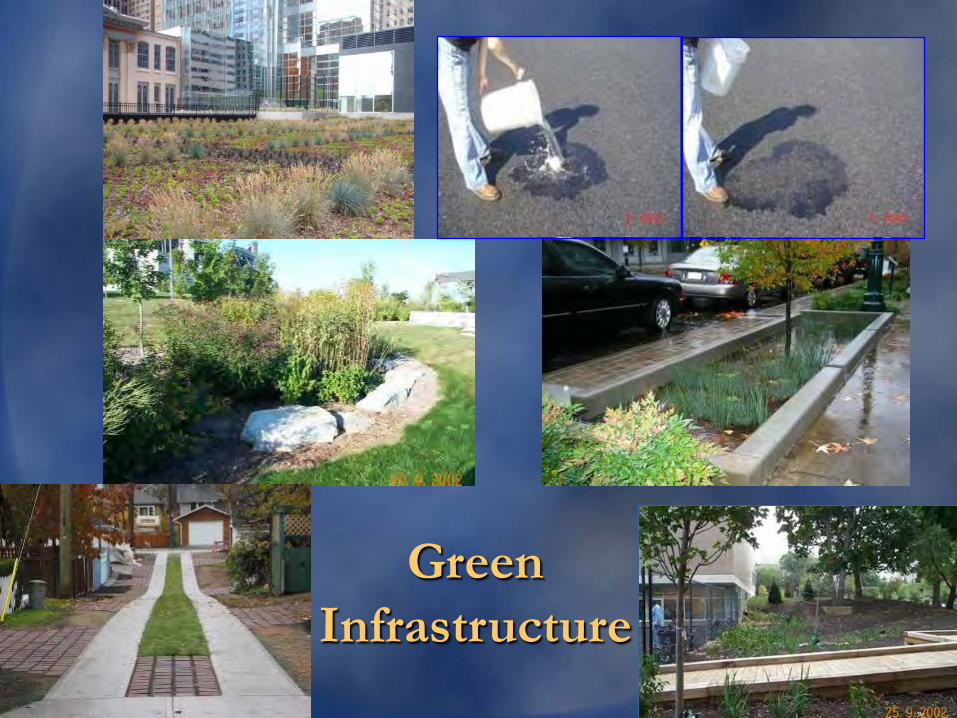
Green Infrastructure
“Greened Acres”
In order to achieve CSO capture objective, Philadelphia is planning to convert 9,500 impervious acres to Greened Acres
1 “Greened Acre” manages the 1st inch of runoff from 1
impervious acre prevents 250,000 gallons of overflow / year

Need for Groundwater Modeling
Philadelphia’s Program of stormwater infiltration in highly urban environment highly ambitious
Green infrastructure approaches are becoming very popular across the US for stormwater and CSO programs.
Impacts of concentrated infiltration in urban setting need to be evaluated
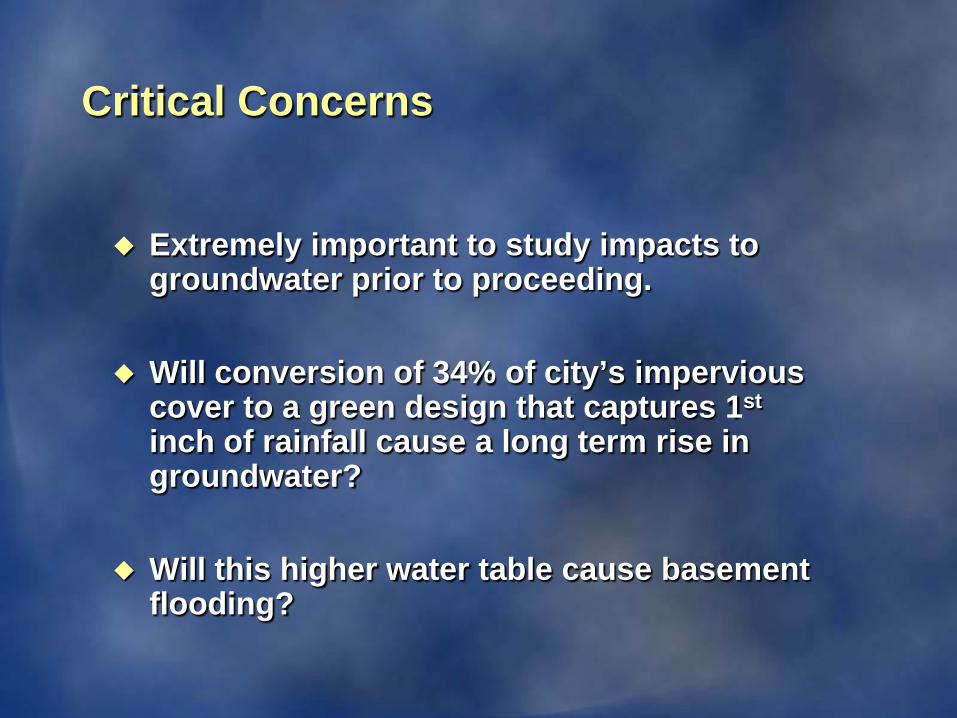
Critical Concerns
Extremely important to study impacts to groundwater prior to proceeding.
Will conversion of 34% of city’s impervious cover to a green design that captures 1st
inch of rainfall cause a long term rise in groundwater?
Will this higher water table cause basement flooding?
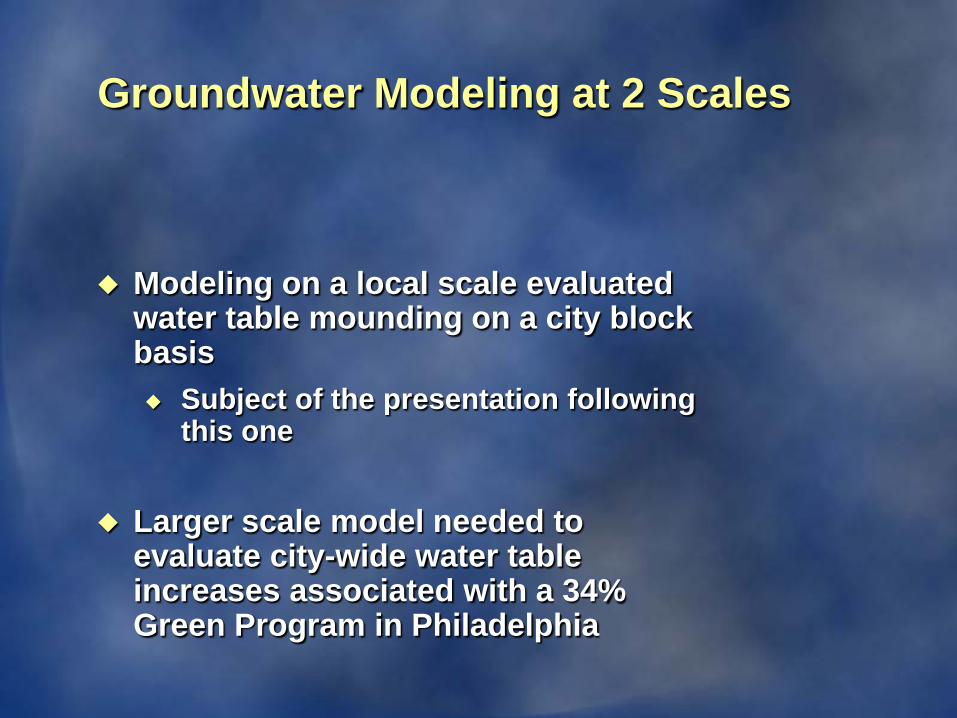
Groundwater Modeling at 2 Scales
Modeling on a local scale evaluated water table mounding on a city block basis Subject of the presentation following
this one
Larger scale model needed to evaluate city-wide water table increases associated with a 34% Green Program in Philadelphia
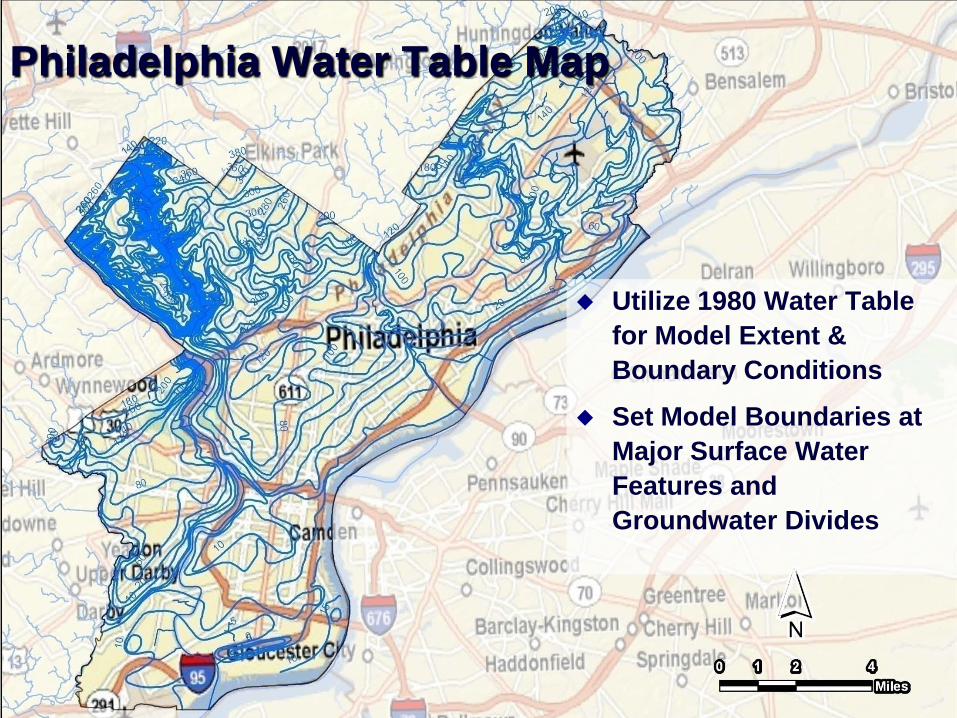
Philadelphia Water Table Map
Utilize 1980 Water Table for Model Extent & Boundary Conditions
Set Model Boundaries at Major Surface Water Features and Groundwater Divides
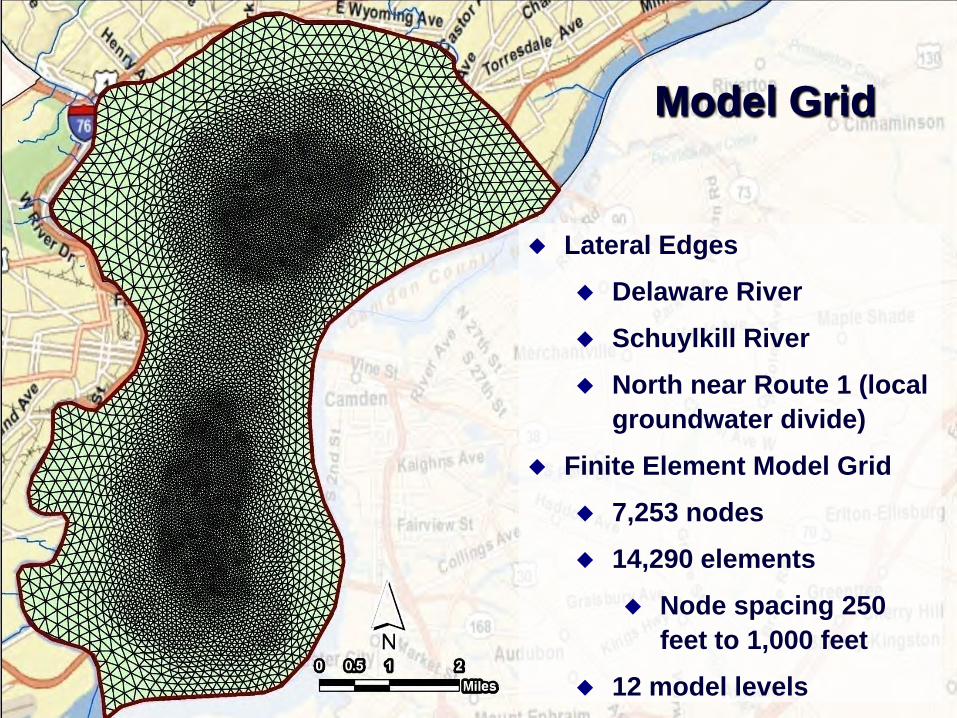
Lateral Edges
Delaware River
Schuylkill River
North near Route 1 (local groundwater divide)
Finite Element Model Grid
7,253 nodes
14,290 elements
Node spacing 250 feet to 1,000 feet
12 model levels
Model Grid

Model Stratigraphy and Hydrogeologic Framework
Model domain includes both the Coastal Plain & Piedmont physiographic provinces, divided by the Fall Line
Two very different hydrogeologic environments
from USGS WSP-2346, 1991
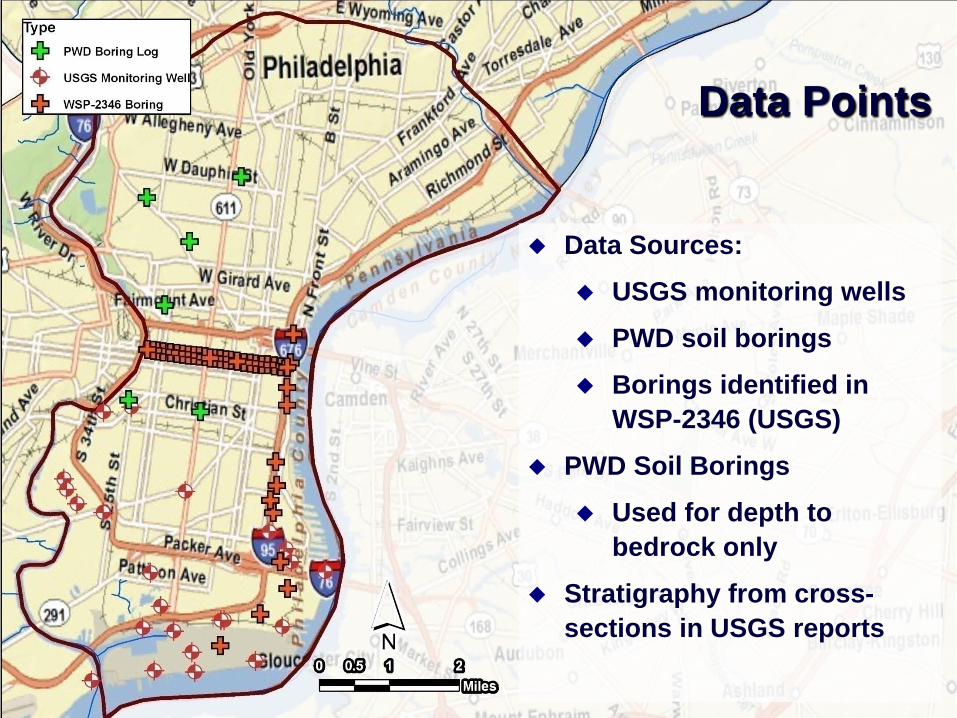
Data Sources:
USGS monitoring wells
PWD soil borings
Borings identified in WSP-2346 (USGS)
PWD Soil Borings
Used for depth to bedrock only
Stratigraphy from cross-sections in USGS reports
Data Points
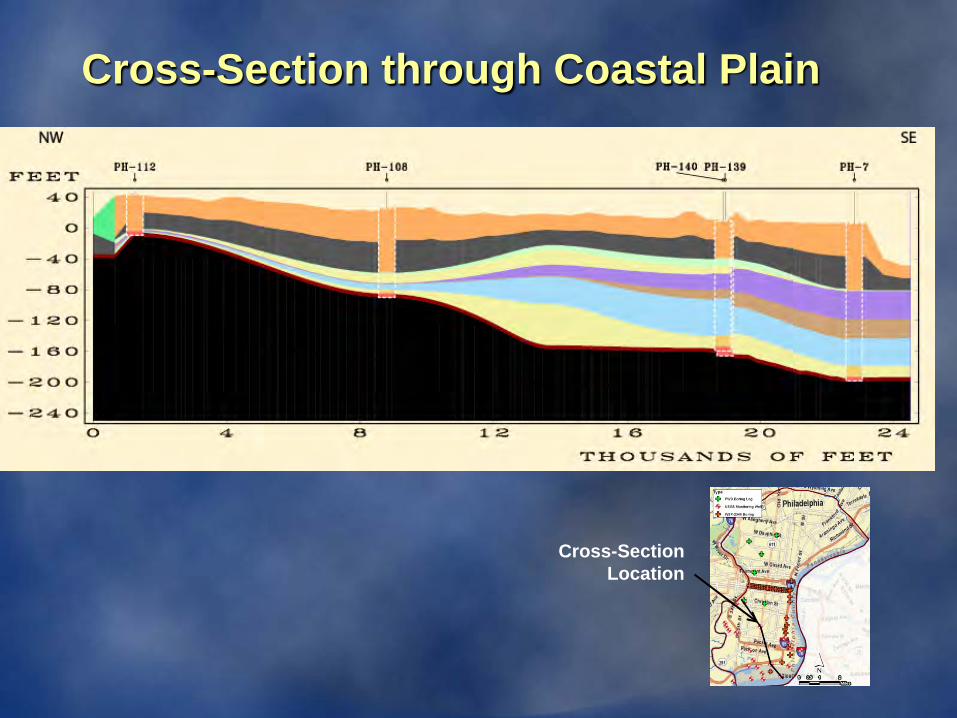
Cross-Section through Coastal Plain
Cross-Section Location
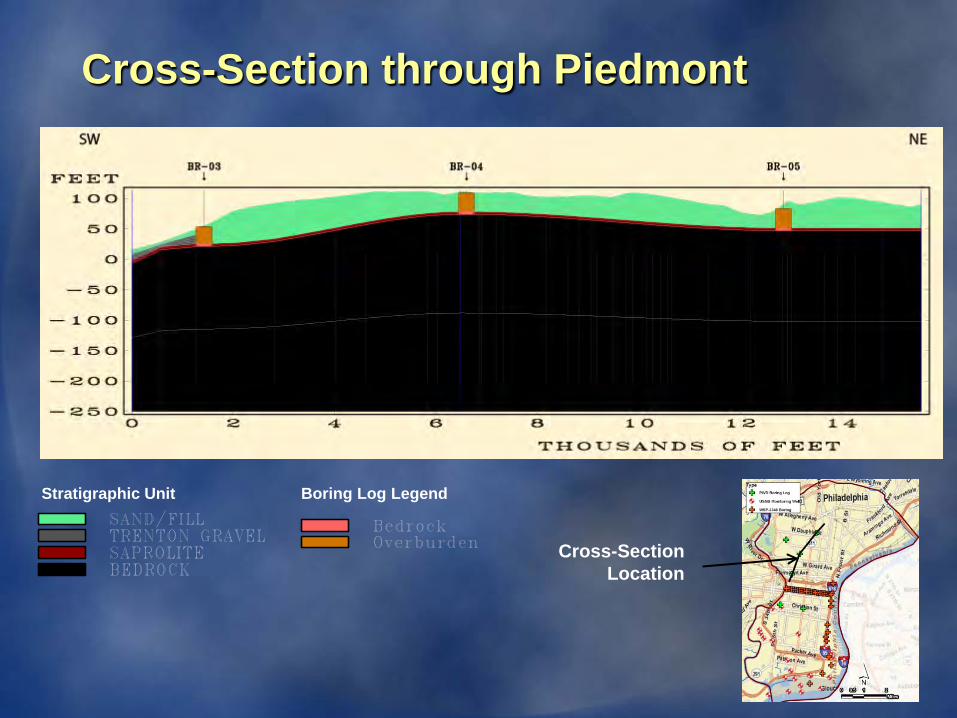
Cross-Section through Piedmont
Stratigraphic Unit Boring Log Legend
Cross-Section Location
Recharge & Groundwater Pumping Assumptions
For baseline, steady-state groundwater model, recharge is uniformly assigned to the model at 17.6 inches/year From SWMM models
The model currently does not include any groundwater withdrawals for industrial use or any dewatering that is occurring for subway tunnels or other facilities (Citizens Bank Park, etc)
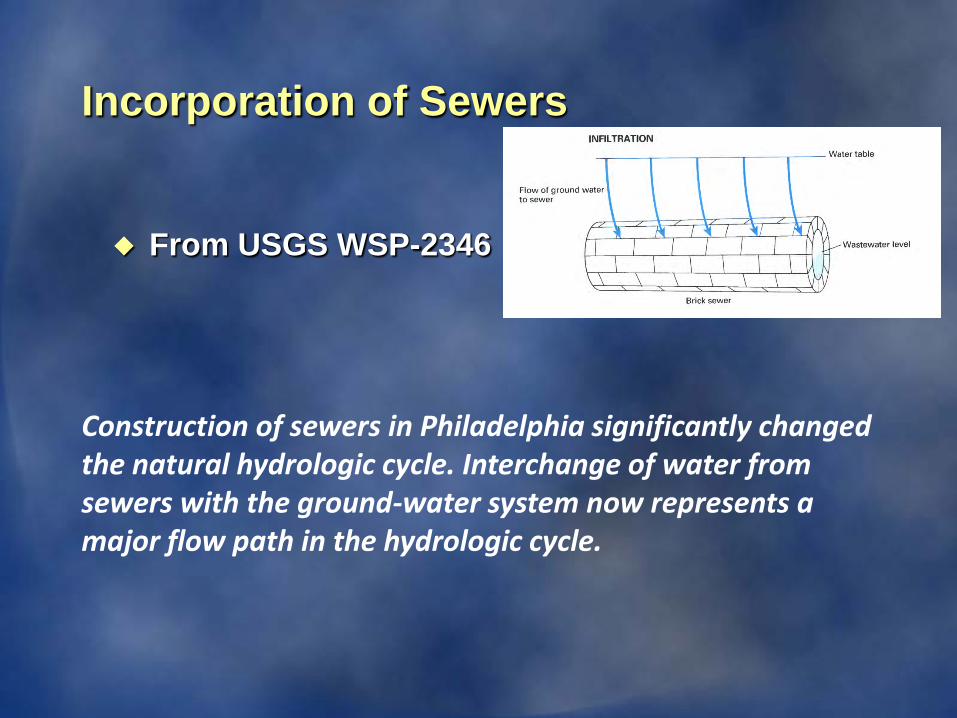
Incorporation of Sewers
From USGS WSP-2346
Construction of sewers in Philadelphia significantly changed the natural hydrologic cycle. Interchange of water from sewers with the ground-water system now represents a major flow path in the hydrologic cycle.
History (from USGS WSP 2346)
Sewer construction began ~ 1855 (brick) Sewers constructed before 1875 – no mortar
between brick to allow for groundwater infiltration to lower the water table and alleviate flooding Brick sewers that were built with mortar had
a lime based mortar which dissolved easily Brick sewers built until ~ 1940 Vitrified clay pipes Concrete pipes
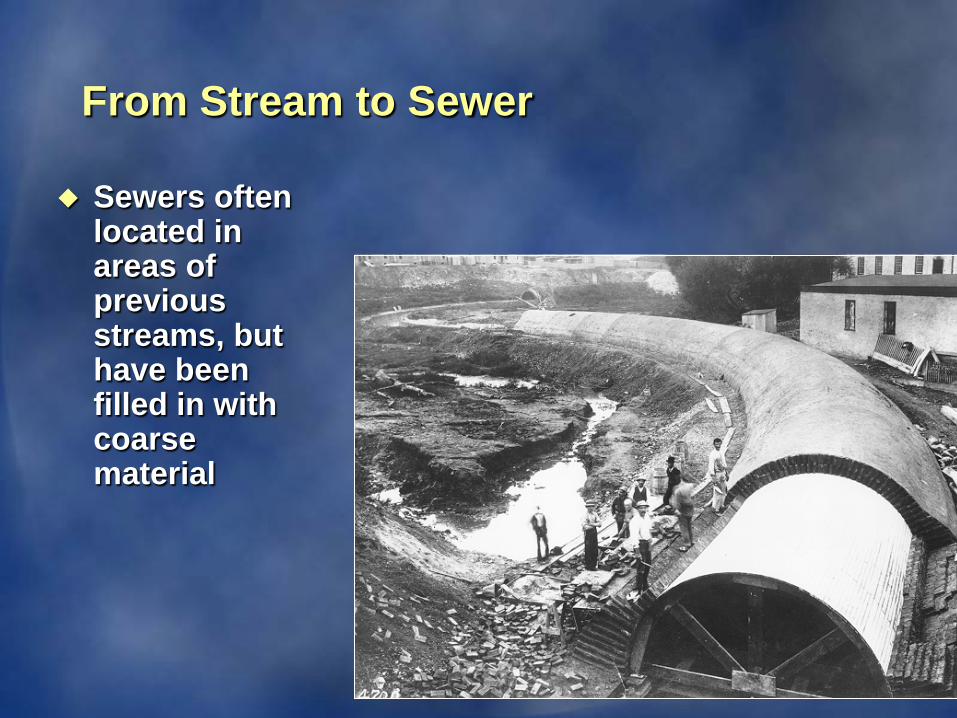
From Stream to Sewer
Sewers often located in areas of previous streams, but have been filled in with coarse material
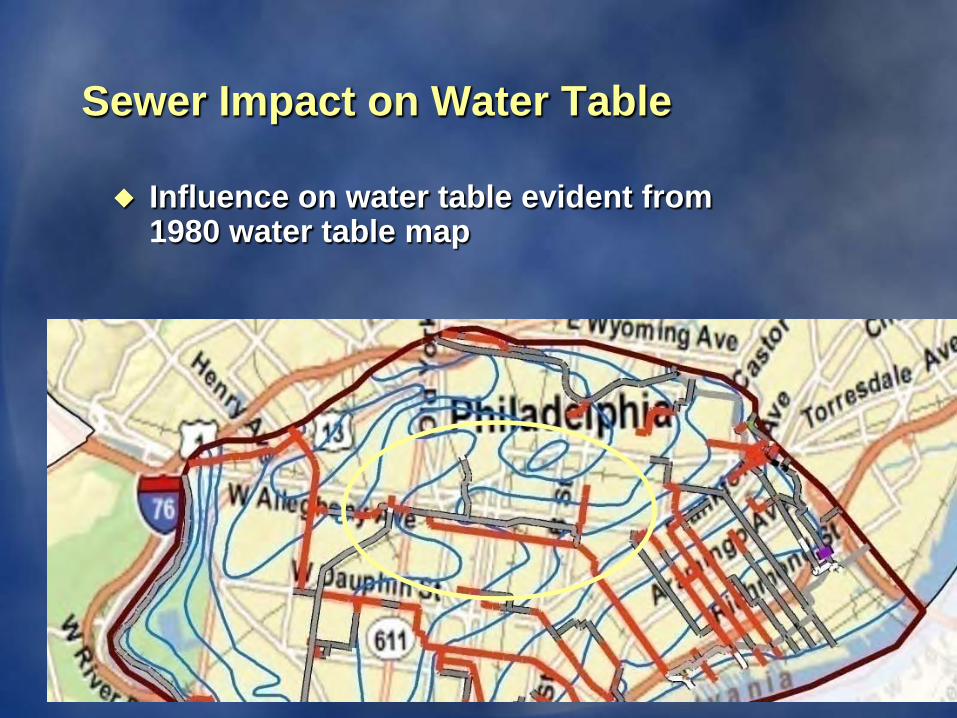
Sewer Impact on Water Table
Influence on water table evident from 1980 water table map
Baseline Simulation
Use current infiltration estimate for average annual rainfall year
Adjust boundary conditions and aquifer properties of steady-state model to match existing data
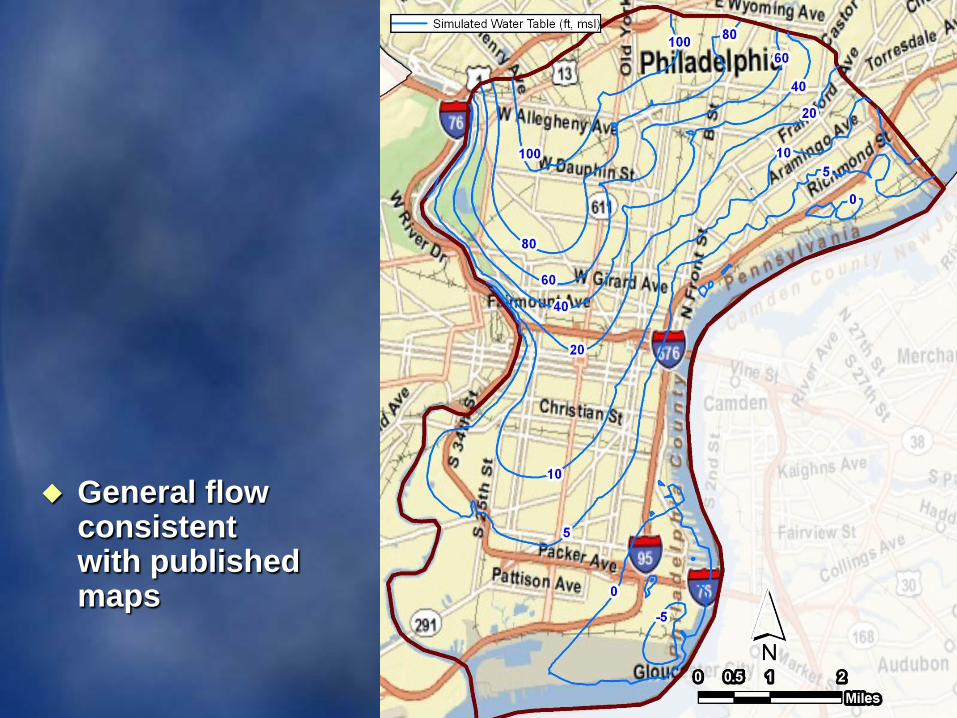
General flow consistent with published maps
Summary of Baseline Regional Model
Overall, the model is in general agreement with groundwater flow direction
Model suitable for exploratory simulations of water table mounding for Philadelphia’s Green Program
Simulated infiltration into sewers = 16 MGD under baseline (steady-state) conditions
Enhanced Recharge
Use baseline regional groundwater model to evaluate water table mounding resulting from implementation of a 34% Green Program
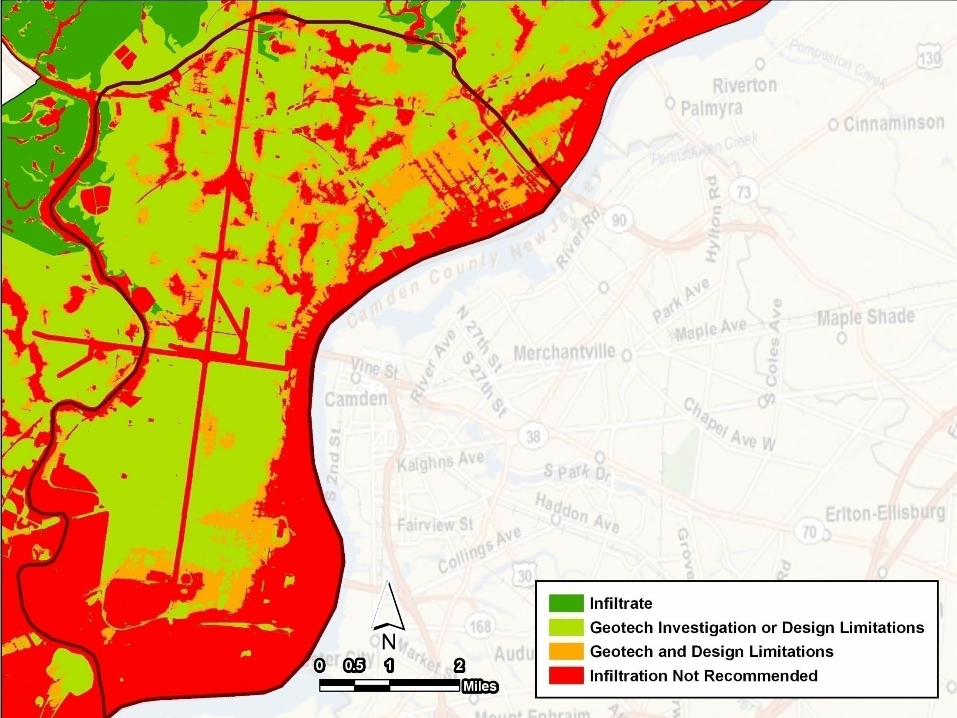
Areas of recharge determined from Philadelphia Infiltration Feasibility Map (PWD, 2009) Eliminate areas that have an infiltration score of >
0.50 Eliminate areas within 2,500 feet of model
boundaries (water table too shallow for infiltration)
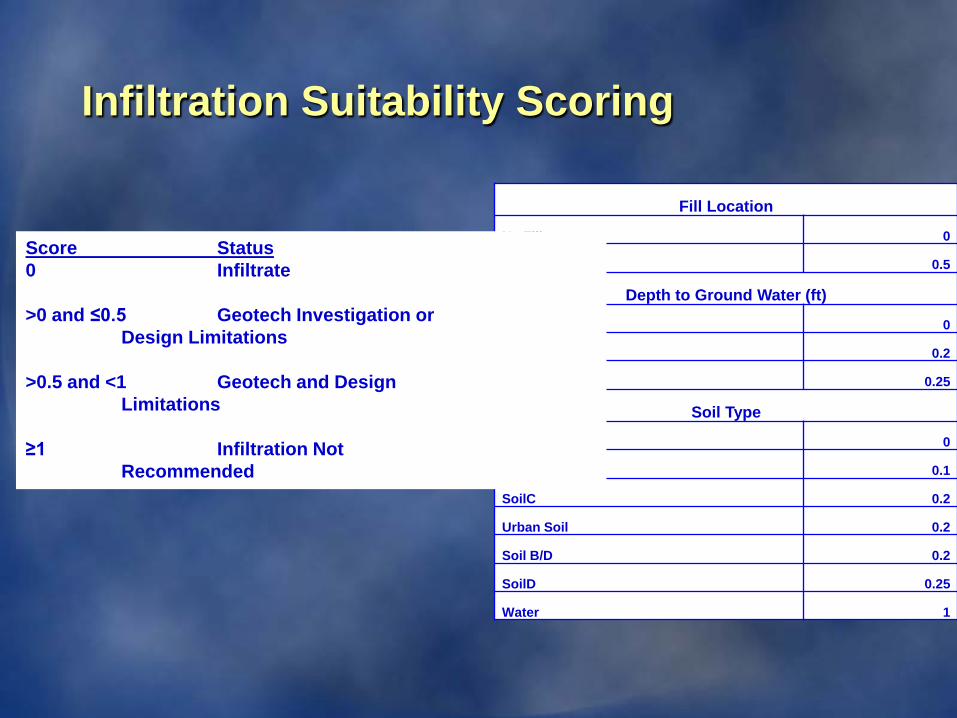
Infiltration Suitability Scoring
Fill Location
No Fill 0
Fill 0.5
Depth to Ground Water (ft)
> 10' 0
5' < and < '10 0.2
< 5' 0.25
Soil Type
SoilA 0
SoilB 0.1
SoilC 0.2
Urban Soil 0.2
Soil B/D 0.2
SoilD 0.25
Water 1
Score Status 0 Infiltrate
>0 and ≤0.5 Geotech Investigation or Design Limitations
>0.5 and <1 Geotech and Design Limitations
≥1 Infiltration Not Recommended
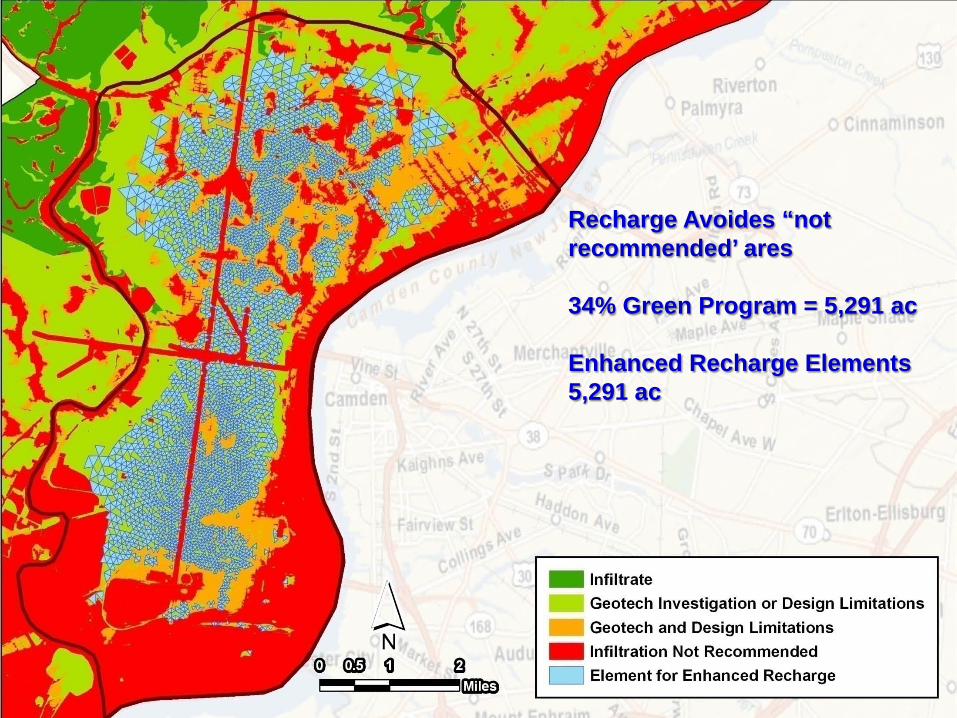
Recharge Avoides “not recommended’ ares
34% Green Program = 5,291 ac
Enhanced Recharge Elements5,291 ac
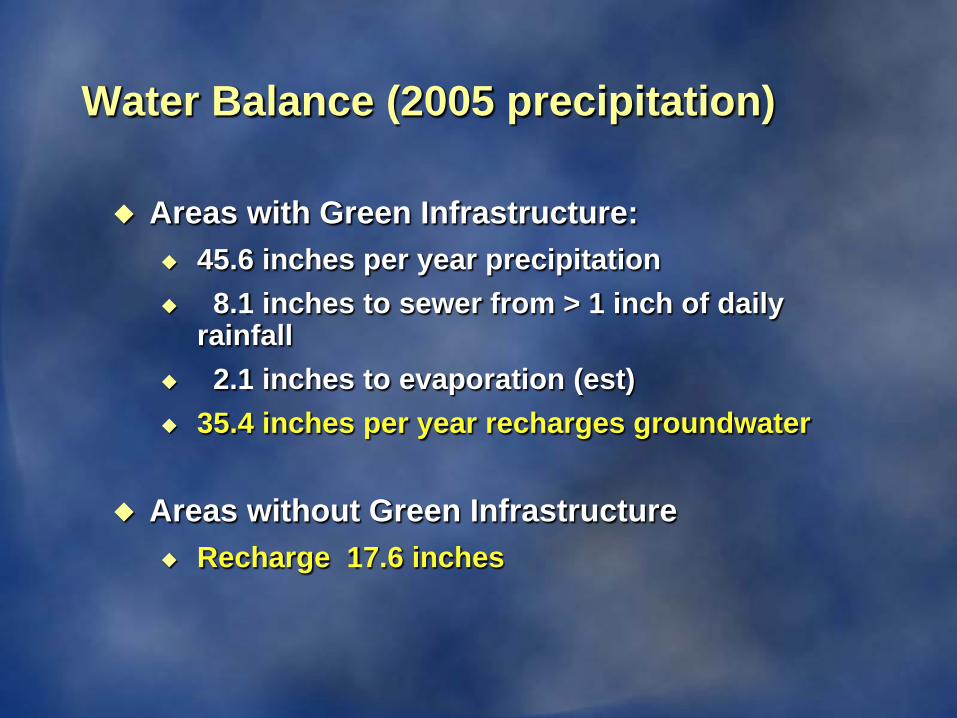
Water Balance (2005 precipitation)
Areas with Green Infrastructure: 45.6 inches per year precipitation 8.1 inches to sewer from > 1 inch of daily
rainfall 2.1 inches to evaporation (est) 35.4 inches per year recharges groundwater
Areas without Green Infrastructure Recharge 17.6 inches
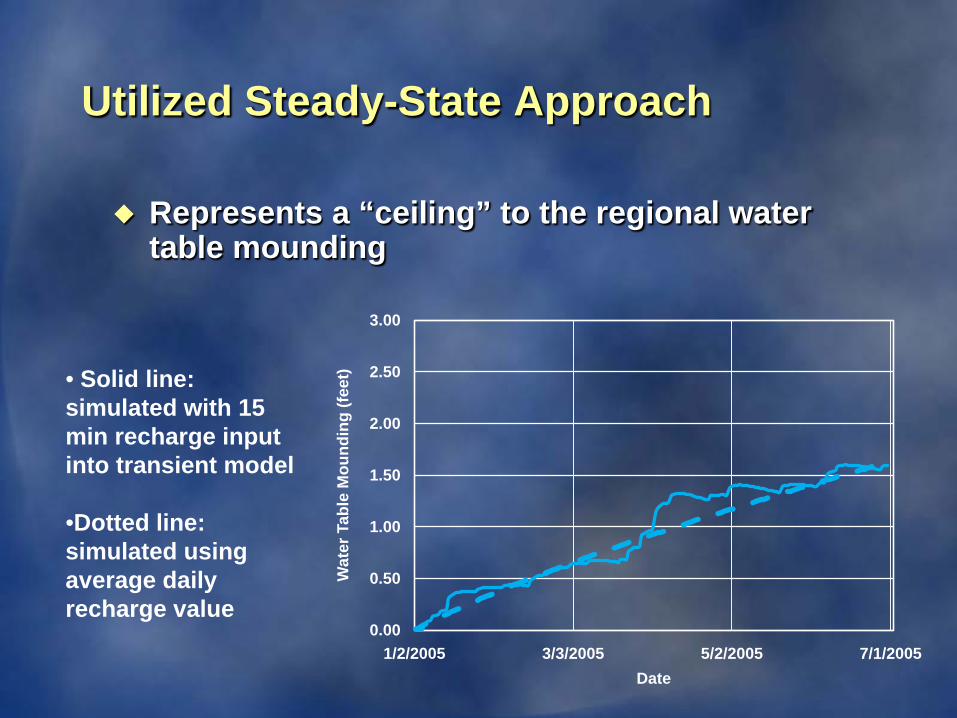
Utilized Steady-State Approach
Represents a “ceiling” to the regional water table mounding
0.00
0.50
1.00
1.50
2.00
2.50
3.00
1/2/2005 3/3/2005 5/2/2005 7/1/2005
Wat
er T
able
Mou
ndin
g (fe
et)
Date
• Solid line: simulated with 15 min recharge input into transient model
•Dotted line: simulated using average daily recharge value
Green Infrastructure: Recharge or Slow Release yet to be determined
Based on 2005 precipitation data: 35.4 inches per year in greened area enters
Green Infrastructure
Balance between recharge and slow release will be determined by soil conditions
Conservative estimate used: 70% recharge, 30% slow release
High recharge estimate: 90% recharge, 10% slow release
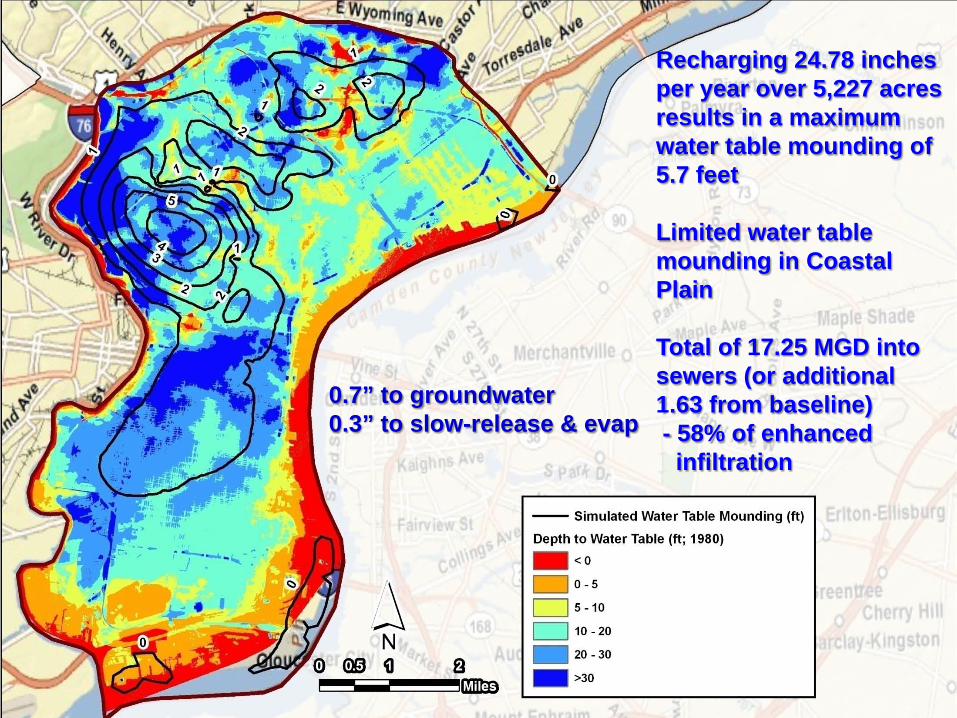
Recharging 24.78 inches per year over 5,227 acres results in a maximum water table mounding of 5.7 feet
Limited water table mounding in Coastal Plain
Total of 17.25 MGD into sewers (or additional 1.63 from baseline)- 58% of enhanced infiltration
0.7” to groundwater0.3” to slow-release & evap

Recharging 31.9 inches per year over 5,227 acres results in a maximum water table mounding of 9.6 feet
Limited water table mounding in Coastal Plain
Total of 18.81 MGD into sewers (or additional 3.18 from baseline)- 57% of enhanced infiltration
0.9” to groundwater0.1” to slow-release & evap
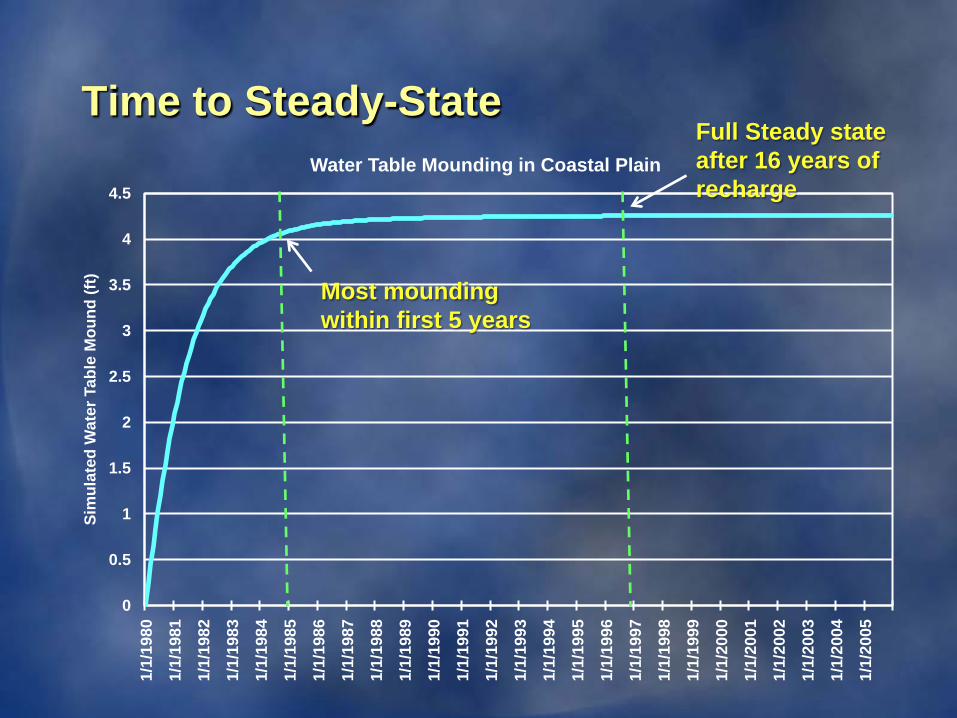
Time to Steady-State
0
0.5
1
1.5
2
2.5
3
3.5
4
4.5
1/1/
1980
1/1/
1981
1/1/
1982
1/1/
1983
1/1/
1984
1/1/
1985
1/1/
1986
1/1/
1987
1/1/
1988
1/1/
1989
1/1/
1990
1/1/
1991
1/1/
1992
1/1/
1993
1/1/
1994
1/1/
1995
1/1/
1996
1/1/
1997
1/1/
1998
1/1/
1999
1/1/
2000
1/1/
2001
1/1/
2002
1/1/
2003
1/1/
2004
1/1/
2005
Sim
ulat
ed W
ater
Tab
le M
ound
(ft)
Water Table Mounding in Coastal PlainFull Steady state after 16 years of recharge
Most mounding within first 5 years
0
2
4
6
8
10
12
1/1/
1980
1/1/
1981
1/1/
1982
1/1/
1983
1/1/
1984
1/1/
1985
1/1/
1986
1/1/
1987
1/1/
1988
1/1/
1989
1/1/
1990
1/1/
1991
1/1/
1992
1/1/
1993
1/1/
1994
1/1/
1995
1/1/
1996
1/1/
1997
1/1/
1998
1/1/
1999
1/1/
2000
1/1/
2001
1/1/
2002
1/1/
2003
1/1/
2004
1/1/
2005
Sim
ulat
ed W
ater
Tab
le M
ound
(ft)
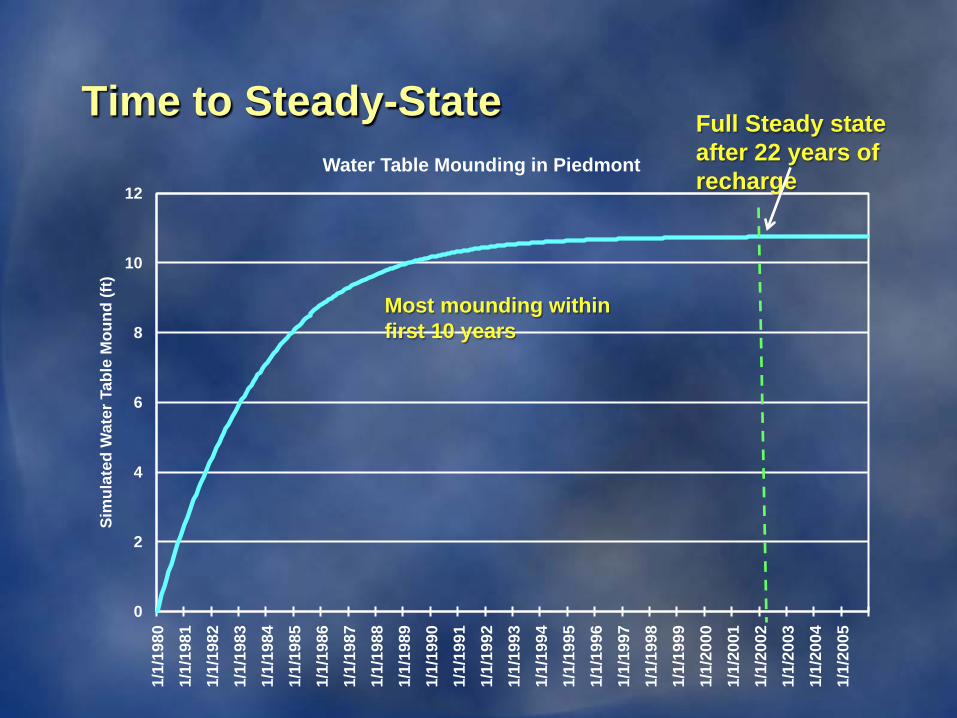
Water Table Mounding in Piedmont
Most mounding within first 10 years
Time to Steady-State Full Steady state after 22 years of recharge
SE Model Summary
Long term increases in the groundwater elevation can be managed by avoiding infiltration in areas of shallow groundwater
A significant percentage of the stormwater is likely to re-enter the sewers, but at a steadier, more controlled rate. For areas facing requirements to reduce CSOs, this is a beneficial effect.
SE Model Summary
In modeling urban groundwater systems, the interaction of infiltration, soil properties, and the design of green stormwater infrastructure interact in complex ways
Transient mounding effects near infiltration facilities are impossible to predict without using numerical models with transient capabilities. (discussed in next presentation)
SE Model Summary
The water table is usually lowered by impervious cover in cities as recharge is reduced. Green stormwater infrastructure can reverse this, and create enhanced recharge over natural recharge rate.
City-wide effects of enhanced recharge do occur over time, as the groundwater system seeks a new equilibrium.

Conclusions
An ambitious program such as Philadelphia’s can result in water table rises of up to 4-8 feet in some areas
Larger groundwater increases will occur in the Piedmont, where depth to groundwater is the greatest
Smaller increases of less than 2 feet will occur in Coastal Plain
In almost all of the city, long term groundwater level increases are not expected to cause basement flooding

Questions