the impact of global warming on water resources (case ... · the impact of global warming on water...
TRANSCRIPT
The impact of global warming on water resources (Case Study: Sirvan River Basin)
M.Gholizadeh, F.Ghaderi, M.Bayazid, M.Kaki Abstract In recent decades, human activities have caused increase in the concentration of greenhouse gases and consequent global temperature increase. The temperature rise also affected climatic variables and caused climate change, and consequently, the hydrological regime of rivers has changed. In this study, non-parametric Mann-Kendall method for trend analysis at the level of 95% was used. Also, for slope examination of the trend line San non-parametric estimator methods were used. For this purpose, the evaporation and rainfall data of seven rain gauge stations and four evaporation stations in Sirvan River Basin during the period (1980-2010) were used. Also using the Thiessen method in GIS average annual rainfall and evaporation in the river basin of Sirvan obtained and trend checking with the nonparametric test was also done for them. . The results showed that the amount of rainfall annually in Palangan station 158.3 and in Takhan station 152.65 mm is decreased and the amount of evaporation annually in the Palangan station 264.4 and 136.7 mm increased in Takhan station. Most significant changes in temperature and rainfall in southern Palangan station for hot and cold periods have occurred. In examining the slope of average rainfall and evaporation trend in the basin it was indicated that rate of evaporation was ten times rainfall during the last three decades and has had the an upward trend. Keywords: global warming, rainfall, evaporation, climate change, Sirvan River.
© 2015 BBT Pub. All rights reserved.
Introduction In recent decades, human activities have caused increase in the concentration of greenhouse gases and consequent global temperature increase. Scenarios published by Intergovernmental Panel on Climate Change (IPCC) indicate that the temperature of the planet by the year 2100 will increase 4.1-8.5° C compared to 1990. This increase also affects other Climatic variables and causes climate change (Bilking Sap and Fuller, 2007). By climatic variables changing, hydrological regime of rivers and consequently frequency and severity of droughts may also change. It has been noted in several studies (Bunce, 1993). On the other hand, given that Iran is located in arid and semi-arid areas is often prone to drought and water resources of surface and groundwater are affected and in periods of drought damage and various socio-economic consequences occurs. So far, many studies assessing the climate rainfall changing system and hydrological flow variable using trend analysis is conducted including, (Luo et al., 2008) rainfall trend of Beijing river basin in China at 63 stations and 7 sub-basin was examined as quarterly and annually during the period (2003-1959) in 17 time series (monthly, quarterly, annually, dry season, etc.) using Mann -Kendal method. Their results showed that there is a decline in rainfall in spring and monsoon and increase in rainfall in winter and autumn. Carrera et al. (2007) with Temporal and spatial analysis of daily and monthly rainfall and temperatures in the Basin of Mexico found that daily temperatures interpolation using the height factor as the second variable helps the validity of estimations; however, it is possible these two variables have a weak correlation. (Caloiero et al., 2009) Studied seasonal and annual rainfall trend in Calabria (southern Italy) using nonparametric tests (Mann-Kendall) and parametric (linear regression analysis). . The results showed that autumn, winter and annual rainfall in southern Italy show a decreasing trend and summer rainfall show an increasing trend. Rahim Zadeh et al (2011) studied evaluating index mutation of temperature trend and rainfall in the Hormozgan province; the results show that the increase of heat and reduction of rainfall in the province has been along with an increase in volatility in rainfall and temperature limit values. (Christ, et al., 2011) examined the relationship between climate and river flow in five hydrometric stations of Karkheh river in Iran. They showed that in some months an increasing trend (as of December) and others have experienced decreasing trend (like May). They often attributed this trend to changes in rainfall. (Esmaeelpour and Dinpajouh, 2011) examined Changes in rainfall in the Sarab desert with the monthly rainfall data in the period (2007-1976), using the Classic and modified Mann-Kendall. Their results indicated that there is a decline in rainfall in different time scales in Sarab desert area. Of studies in the field of meteorological variables trend (Tabari and Maroufi, 2011, Ataei and Fanie, 2012) can be pointed out.In this study which is done by the impact of global warming on water resources goal, so to achieve this goal the changes climatic variables trend rainfall and evaporation on Sirvan River Basin study in the time series of monthly, quarterly and annual and also checking changes in the average of this two parameters will be conducted in the basin during the past three decades. Materials and Methods The study area Sirvan River Basin with an area of 7500 square kilometers is considered the most waterful basins in Iran and Kurdistan. So that 8.2 billion cubic meters of surface water in this area is flowing. Sirvan River with a length of 213 kilometers is considered one of the largest and most waterful rivers of the province. River such as Garran, Gheshlagh, Gordlan and Razab are of the most important rivers in this basin. This river is located in the western
M.Gholizadeh et.al / Teknologi Tanaman /Vol (12), Supp (2) 2015 495
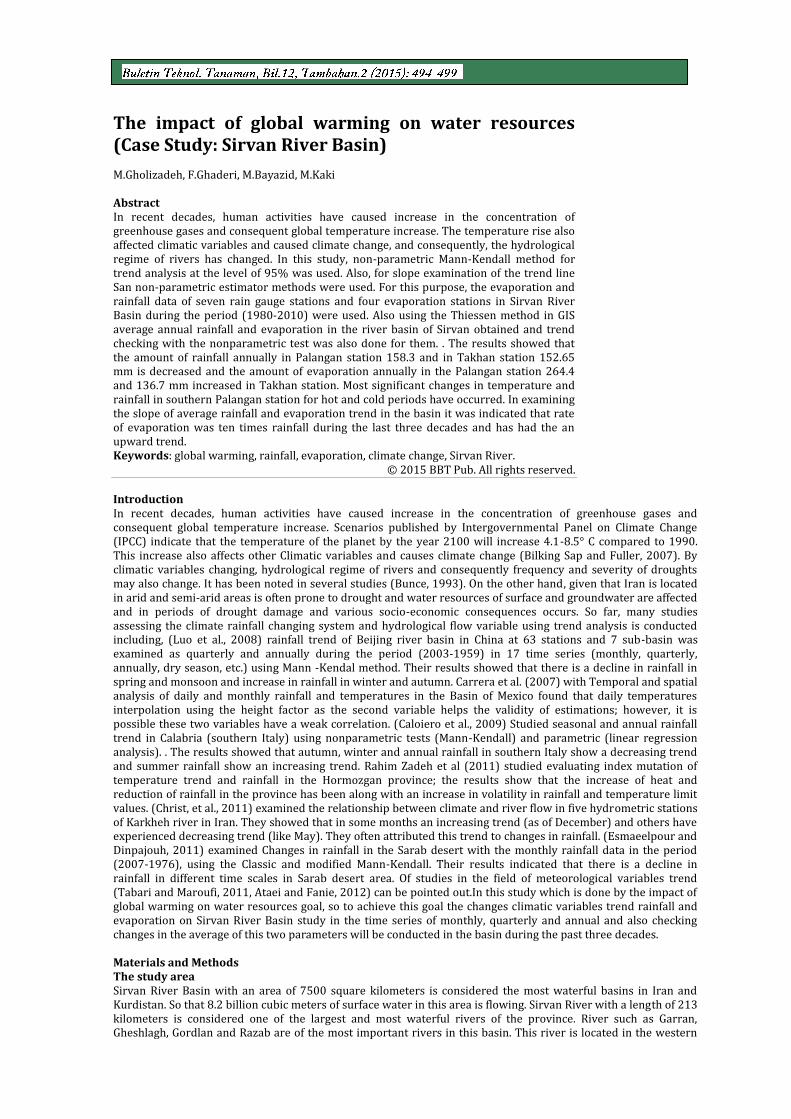
and northwestern of Uraman and divided Uraman area into two sections. This river originates from the Razab and Marivan in Kurdistan and after passing through the Northwest of Uraman, Doab and North Herta, Zhadrood, the Gheshlagh river, Lille, Lueshe, Zamkan, Dasht Hor rivers joins it and then goes to Iraq. This river basin particular topographical and morphological conditions in the Sirvan basin provided implementation of important economic projects in the area including the construction of large dams to irrigate agricultural lands, energy generation, fishing, aquaculture, tourism and large industries that require a lot of water. Sanandaj Gheshlagh dam with a capacity of 224 million cubic meters is one of existing dams that supply water to the city of Sanandaj. Currently dams of Gavoshan with volume of 550 million square meters and Garan dams in Marivan are under construction and Zarivar dam in order to increase the volume of lake from 35 million cubic meters to 90 million cubic meters is constructed with a height of 5 meters. In general, Sirvan Basin by being next to the major cities such as Sanandaj (capital of the province) and city of Marivan in the Iraqi border in terms of water resources has great potential and can improve the economic indicators in the province. This basin id formed of sub-basins of Sanandaj, Marivan and Sarvabad. Rain gauge and evaporation of Ministry of Energy stations’ position is shown in Figure 1 and also the stations specification in the Sirvan River Basin is given in Table 1.
Figure 1 Sirvan River basin position in the Iran’s basins and under study stations
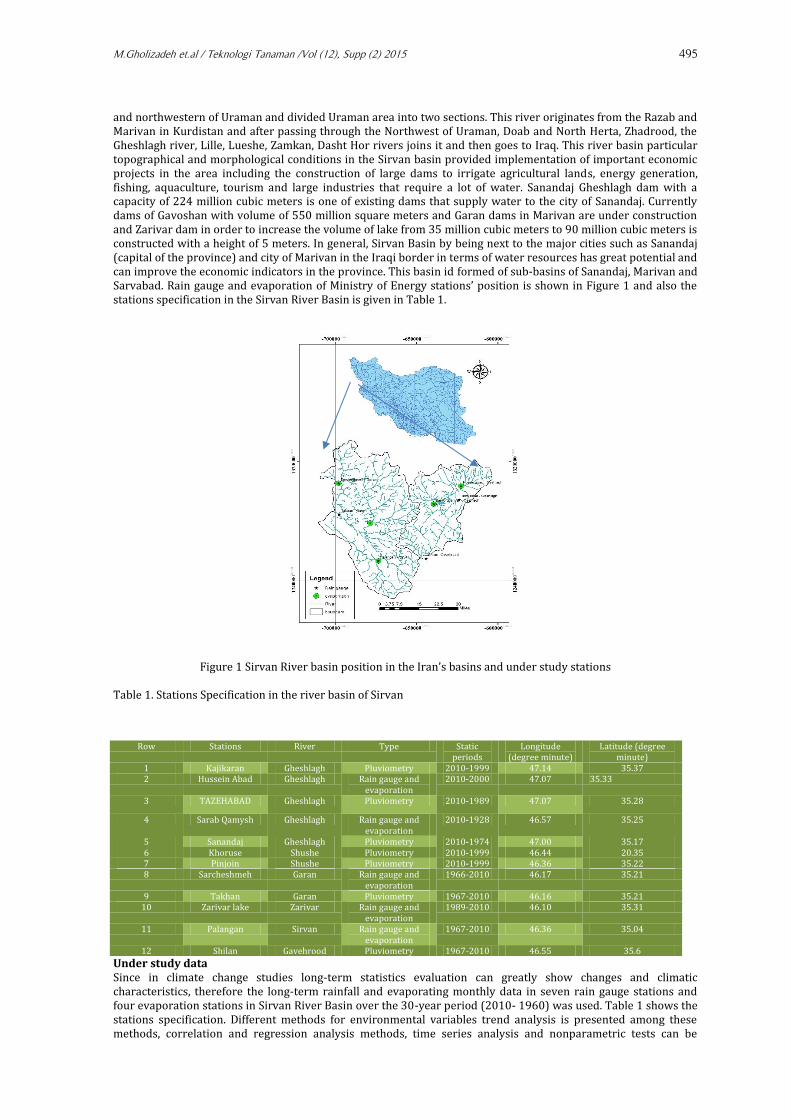
Table 1. Stations Specification in the river basin of Sirvan
Under study data Since in climate change studies long-term statistics evaluation can greatly show changes and climatic characteristics, therefore the long-term rainfall and evaporating monthly data in seven rain gauge stations and four evaporation stations in Sirvan River Basin over the 30-year period (2010- 1960) was used. Table 1 shows the stations specification. Different methods for environmental variables trend analysis is presented among these methods, correlation and regression analysis methods, time series analysis and nonparametric tests can be
Row Stations River Type Static periods
Longitude (degree minute)
Latitude (degree minute)
1 Kajikaran Gheshlagh Pluviometry 2010-1999 47.14 35.37 2 Hussein Abad Gheshlagh Rain gauge and
evaporation 2010-2000 47.07 35.33
3 TAZEHABAD Gheshlagh Pluviometry 2010-1989 47.07 35.28
4 Sarab Qamysh Gheshlagh Rain gauge and evaporation
2010-1928 46.57 35.25
5 Sanandaj Gheshlagh Pluviometry 2010-1974 47.00 35.17
6 Khoruse Shushe Pluviometry 2010-1999 46.44 20.35 7 Pinjoin Shushe Pluviometry 2010-1999 46.36 35.22 8 Sarcheshmeh Garan Rain gauge and
evaporation
1966-2010 46.17 35.21
9 Takhan Garan Pluviometry 1967-2010 46.16 35.21 10 Zarivar lake Zarivar Rain gauge and
evaporation
1989-2010 46.10 35.31
11 Palangan Sirvan Rain gauge and evaporation
1967-2010 46.36 35.04
12 Shilan Gavehrood Pluviometry 1967-2010 46.55 35.6
496 M.Gholizadeh et.al / Teknologi Tanaman /Vol (12), Supp (2) 2015
mentioned. In this study, to evaluate annually, quarterly and monthly rainfall and evaporating trend in all selected stations in the Sirvan river basin nonparametric test (Mann-Kendall) and for calculating the slope of the trend line the San estimation test was used. Mann-Kendall Non-parametric Mann-Kendall test is considered one of the most common methods of hydrological and meteorological series trend analysis. Several studies done using this method show the importance and widely use in the time series trend analysis (Hajjam et al., 2008). This test first in 1945 was presented by Mann and then in 1948 was developed by Kendall. The use of this method was recommended by the World Meteorological Organization. The method for hypothesis randomness of data sequence test is used against the existence of trends (Khalili and Bazrafshan, 2004). Of the strengths of Mann-Kendall method its appropriate use for time series that do not follow a particular distribution, can pointed out. Negligible influence of limit values in this method which are observed in some time series is one of other advantages of this method (Hajjam et al., 2008). The null hypothesis of this test on randomness and lack of trend of data series implies and acceptance of assuming a (the null hypothesis Rejecting) is evidence of trends existence in data series. Z score of the test is determined by the following formula:
0
)(
1
00
0
)(
1
sfor
sv
s
sfor
sfor
sv
s
z
S statistics calculation method and its variance are as follows:
)sgn(
11
1 1
i
n
i
n
ij
jxxs
In the above equation sgn(x) is the sign function and is defined as follows:
01
00
01
)sgn(
xfor
xfor
xfor
x
18
)52)(1()52)(1(
)(1
m
i
iiitttnnn
sv
In this test In case of statistic Z being positive, data series trend, upward and if it is negative is downward and also Z statistics at the level of 5% its significance the amount was 96.1. Trend slope rand (Sen Estimator) This method (Sen, 1968; Syl, 1950) is used to determine the amount trend slope. In this method outlier values in the data series, have little effect in determining the slope of trend which is the main advantage of it compared to
the linear regression. This indicator is displayed by β and its value is estimated using the following equation:
In which gk
is slope estimator for k-th station in g-th month. Positive values of gk
indicate an increasing trend
and its negative values represents a decreasing trend.
nji1 ,
ji
XXMedian
jgkigk
gk
Thiessenizing of the under study area
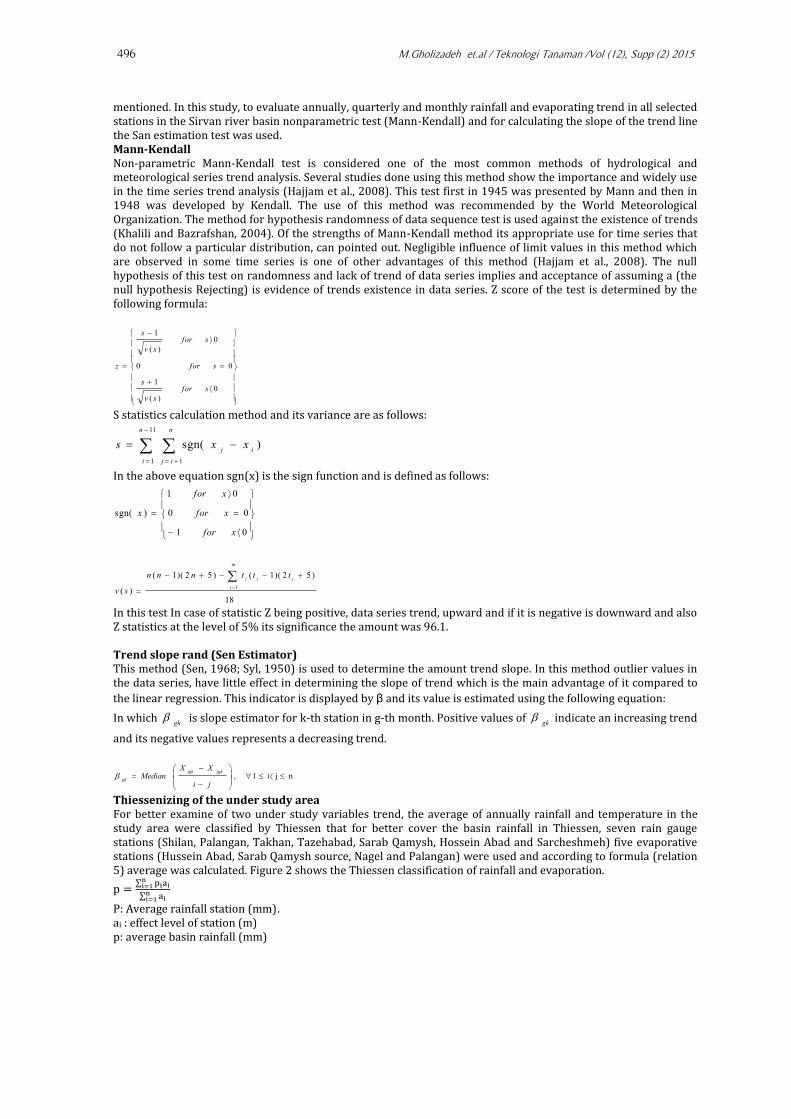
For better examine of two under study variables trend, the average of annually rainfall and temperature in the study area were classified by Thiessen that for better cover the basin rainfall in Thiessen, seven rain gauge stations (Shilan, Palangan, Takhan, Tazehabad, Sarab Qamysh, Hossein Abad and Sarcheshmeh) five evaporative stations (Hussein Abad, Sarab Qamysh source, Nagel and Palangan) were used and according to formula (relation 5) average was calculated. Figure 2 shows the Thiessen classification of rainfall and evaporation.
∑
∑
P: Average rainfall station (mm). ai : effect level of station (m) p: average basin rainfall (mm)
M.Gholizadeh et.al / Teknologi Tanaman /Vol (12), Supp (2) 2015 497
Figure 2: Thiessen Classification of Sirvan River Basin
Results and Discussion Annually and seasonal trend of changes
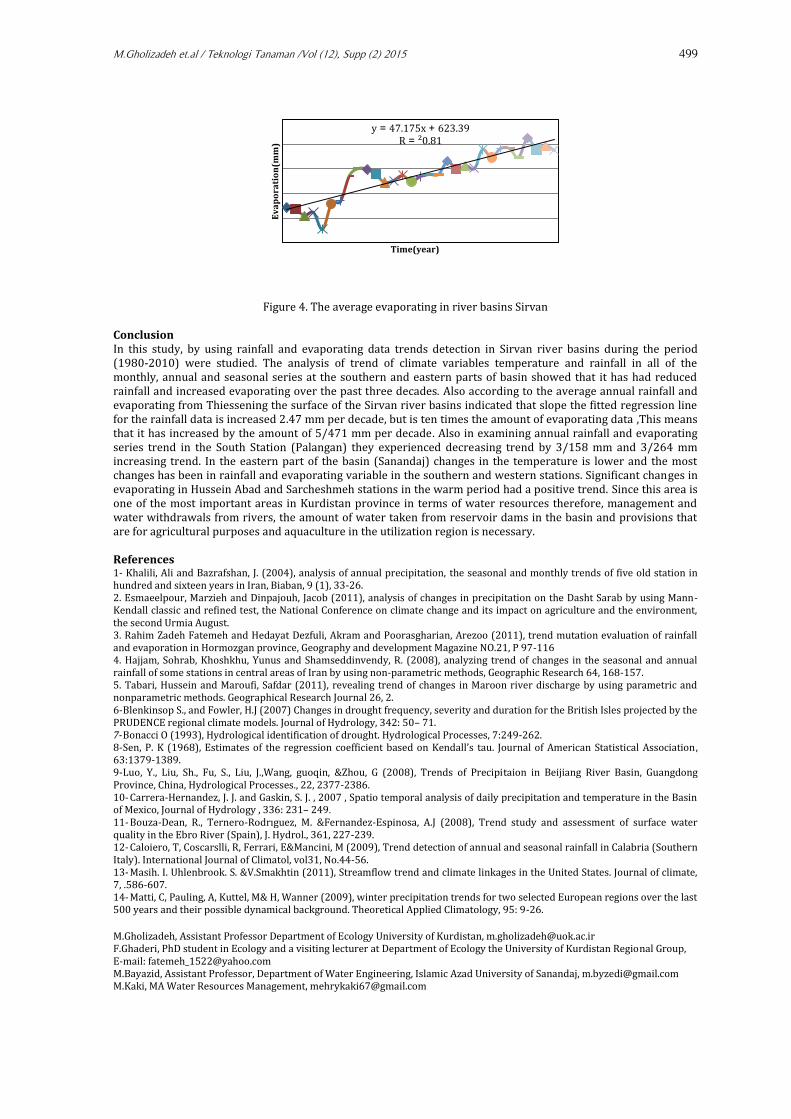
In Table (2 and 3), Mann-Kendall test results (Z) and Sen (Q) for under study stations was provided. As you can see, based on the Mann-Kendall annual rainfall in Palangan, Shilan, Hossein Abad, Sarcheshmeh and Takhan stations decreasing trend and also in Palangan station had significant decreasing trend at 5% level. But in two Tazehabad and Sarab Qamysh stations in the eastern part of the basin (the Sanandaj area) had increasing trend and a significant increasing trend in Sarab-Qamysh station occurred at 5%. Downward trend obtained by annually changes of research results (Lou et al., 2008), matches which examines Mann Kendall and Sen's estimation methods conducted in Beijing River in China. In the Palangan station in the West of basin in the annual series and fall, winter and spring seasons significant decreasing trend was observed. For the evaporating variable at Palangan, Sarab Qamysh and Hossein Abad stations an increasing trend and in Palangan station significant trend have experienced at 5% level. According to Figure 4, that average evaporating in the basin using Thiessen in the basin level was observed. Trend increased with a slope of 15.47 mm and the trend examination with the Mann-Kendall statistic value of (Z) equal to 78.5 showed significant increasing trend that showed existence of significant trends in the annual and average time series of evaporating in the basin by increase in temperature in the region. . Based on the slope of the line that presented in the tables (2 and 3), it can be concluded that the amount of annual rainfall in the Palangan station 3.158 and 65.152 mm in Takhan station is decreased and the amount of annual evaporation at Palangan station 4.264 and in the Takhan station is increased by 7.136 mm. According to the results of the nonparametric test series of seasonal rainfall has decreasing trend For 50% Series and for the evaporating variable at Sarab-Qamysh, Hossein Abad and Sarcheshmeh stations in the eastern and western parts of the basin have increasing trend. And this trend in the spring at the level of 5% significant had experienced a significant increase. Also According to spring trend line slope of evaporation variable of Hossein Abad station increases 5.77 mm per decade.
Table 2. The results of the Mann-Kendall and Sen For rainfall Station Annual Autumn winter Summer Spring
Z Q Z Q Z Q Z Q Z Q
Palangan *-3.79 -15.83
*.11 2- .31 4- *22 . 3- 31. 6- 0 66.0 *23 . 3- 66. 1-
Shilan 02. 0- 660.- 0.23 46.0 62. 1- 122.- *12 .2 0 41.1 64.1
Tazehabad 62.1 030. 0.42 0 620. 162. 66.0 641. *26 2.- 66. 6-
Sarab Qamysh *
31 .2 626. -0.22 -0.55 0.5 0.96 1.15 0 *2.88 66.3
Hossein abad 11. 1- 41. 4- -0.29 63. 0- *
16 . 2- 63. 4- 36.0 0 .540 061.
Sarcheshmeh 64. 0- 66. 2- -0.84 632.- 63.1 1 0 142. 40.- 260.-
Takhan 64. 1- 26.16- -1.39 026.- 66. 1- 666.- 321.- 0 12. 0- 140.-
* trend is at the 5% level significance .
Table 3. The results of Mann Kendall tests and Sen for evaporation Station Annual Autumn winter Summer Spring
Z Q Z Q Z Q Z Q Z Q
Palangan *12 2. 43.26 011.- 241.- *21 .2 62.2 011.- 228.- 36. 1- 46. 3-
Sarab Qamysh 32.0 22.1 66.0 06.1 13. 0- 0 661.- 26. 6- 36.0 261.
Hossein Abad 4.1 29. .011 201. *
03 2.- 0 03. 0- 06. 0- *
04 .2 667.
Sarcheshmeh 36. 1- 66. 13- 31.0 .410 621. 64.0 64. 0- 361.- * 24.2 66.6
* trend is at the 5% level significance.
Monthly Changes trends
Mann-Kendall test results for monthly rainfall and evaporating in under study stations are provided in tables (4 and 5). . Decreasing trends in monthly rainfall in Palangan stations in all data except July, August and September which no rains occurred in these months were determined by nonparametric test and in January, March and June
498 M.Gholizadeh et.al / Teknologi Tanaman /Vol (12), Supp (2) 2015
significant decreasing trend have been found. . But in Sarab-Qamysh station for February a significant increasing trend and in other stations and months of the year have shown a variable increasing or decreasing trend. The results of the monthly rainfall trend line slope at all stations except Sarab Qamysh station in Gheshlagh River that is considered branches of Sirvan river showed decreasing trend. The most amount of significant trend increase was related to the amount of 99.3 for evaporation of Sarcheshmeh station and the greatest number of significance trend was related to Palangan station for both variables. Zero values of line slope in the trends (Sen Estimator) which in some months, can be seen in the station indicates that a particular trend in this series of data over the past three decades haven’t been achieved. Due to the line slope of trends table (6), The most changes of monthly evaporating were observed in Hossein Abad and Sarcheshmeh station in April and May in the study period. So that the evaporating of Hossein Abad station 9.39 mm per decade in July and also in Sarcheshmeh stations for April and June was found the of 22.4 mm per decade.
Table 4. Mann-Kendall test for monthly rainfall Station October November December January February March April May June July August September
Palangan -0.60 -1.71 -1.23 -1.94* -1.58 -2.56* -1.86 -0.48 -2.23* * * *
Shilan -0.83 0.15 0.64 -0.81 0 -0.6 2.1 -0.11 0.38 2.27* * *
Tazehabad 0.48 0.03 -1.27 -1.91 -2.0* 0 1.5 -0.25 11.51 1.43 0.14 0
Sarab Qamysh
-.043 0.55 0.42 2.51 2.6* -0.35 0.82 2.58* 0.3 0.3 0.16 0.65
Hossein abad -1.54 -0.21 0 -2.1* 0.33 -2.06* 0.37 0.33 -1.09 0 1 0.19
Sarcheshmeh 0.44 -0.21 -1.44 0.38 0.93 -0.04 -0.07 -0.13 0.91 1.14 * *
Takhan 2.29* -0.66 -1.66 -3.08* 3.60 -1.06 -1.39 0.33 -1.42 * * *
* trend is at the 5% level significance.
Table 5. Mann-Kendall test for the monthly evaporating Station October November December January February March April May June July August September
Palangan 36.0 03. 2- *
36 . 2- 0.6 *
06 .2 *
6 .2 4.0 *
34 2.- 63. 0- 66. 0- 11.- 26. 1-
Sarab Qamysh
6.0 66.0 42. 0- 6. 1- 64. 1- 03. 1- *06 .2 62.0 31. 1- .62 0- 611.- 26. 1-
Hossein abad 66.0 62.0 160.- *2 2.- *26 . 2- *06 . 2-
*66 2. 36.0 06.1 61.0 23. 0- 0
Sarcheshmeh 640. 42.0 0 0 0 0 *22 .3 32.0 *16 .2 21.0 26. 0- 0120.
* trend is at the 5% level significance.
Table 6 Sen estimator slope for monthly rainfall statistics Station Octob
er Novem
ber Decemb
er Januar
y Febru
ary March April May June July August Septembe
r
Palangan 0 -1.8 -1.35 1.83- -1.5 -3.67 -1.84 -0.45 0 * * *
Shilan 0 0.26 0.55 -0.61 0 -0.32 1.75 -0.09 0 0 * *
Tazehabad 1.53 0.04 -1.5 -1 -3.5 0 3.1 0 0 0 0 *
Sarab Qamysh
0 0.80 0.39 0.24 1.93 -0.61 0.77 2.55 0 0 0 0
Hossein abad
-0.57 -0.33 -0.51 -1.22 0.46 -3.66 0.41 0.45 -0.38 0 0 0
Sarcheshmeh
0 -0.42 -1.53 0.34 0.68 -0.03 -0.75 -0.2 0 0 * *
Takhan 0 -1.19 -3.02 -3.7 0.18 -2.74 -2.08 0.15 0 0 0 0
Table 7. Sen Estimator slope for evaporation monthly statistics Station October November December January February March April May June July August September
Palangan 0.65 -1.62 -1.24 0.15 0.71 1.75 0.24 .64 2- -1.19 -1.84 2.56- 2.14-
Sarab Qamysh
0.55 0.5 -0.37 0 0 0 1.69 0.72 -2.11 -1.07 -3.29 -1.04
Hossein abad 0.64 0.49 0 0 0 0 3.99 0.39 2.17 0.91 -0.28 0.01
Sarcheshmeh -0.08 0.39 0.34 0 0 0.17 2.24 1.53 2.26 -0.21 -0.51 -0.71
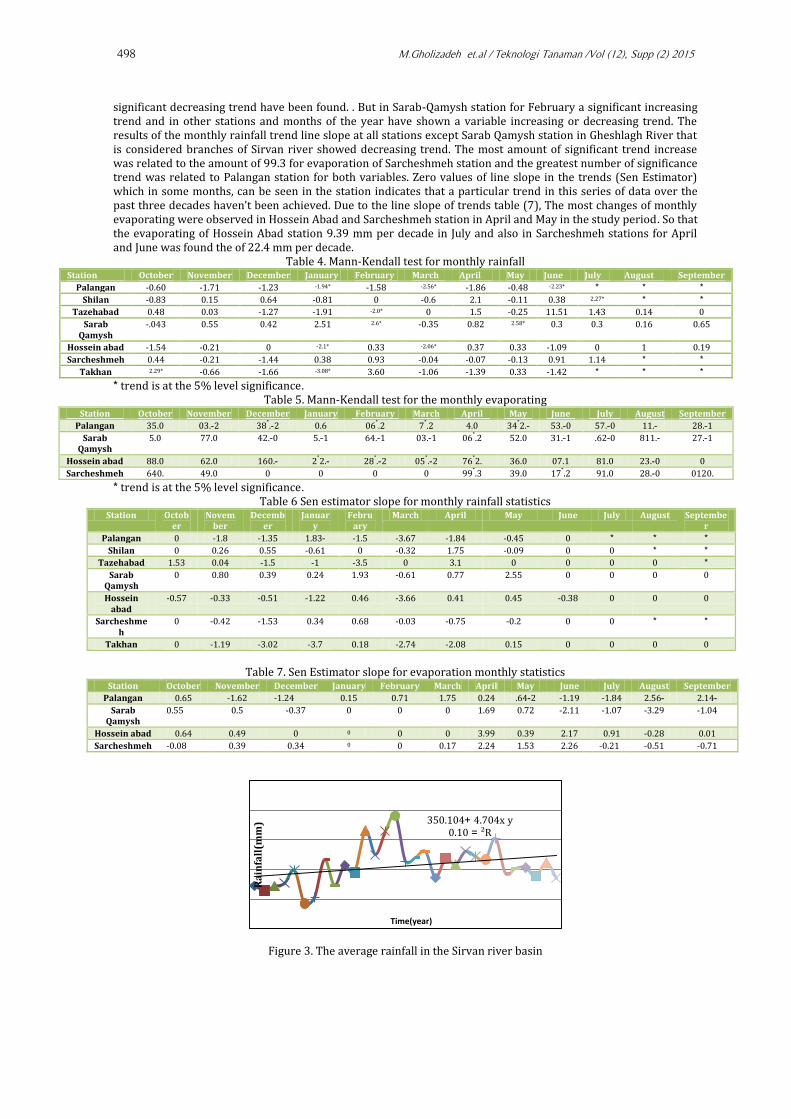
Figure 3. The average rainfall in the Sirvan river basin
y 4.704x +350.104 R² =0.10
Ra
infa
ll(m
m)
Time(year)
M.Gholizadeh et.al / Teknologi Tanaman /Vol (12), Supp (2) 2015 499
Figure 4. The average evaporating in river basins Sirvan
Conclusion
In this study, by using rainfall and evaporating data trends detection in Sirvan river basins during the period (1980-2010) were studied. The analysis of trend of climate variables temperature and rainfall in all of the monthly, annual and seasonal series at the southern and eastern parts of basin showed that it has had reduced rainfall and increased evaporating over the past three decades. Also according to the average annual rainfall and evaporating from Thiessening the surface of the Sirvan river basins indicated that slope the fitted regression line for the rainfall data is increased 2.47 mm per decade, but is ten times the amount of evaporating data ,This means that it has increased by the amount of 5/471 mm per decade. Also in examining annual rainfall and evaporating series trend in the South Station (Palangan) they experienced decreasing trend by 3/158 mm and 3/264 mm increasing trend. In the eastern part of the basin (Sanandaj) changes in the temperature is lower and the most changes has been in rainfall and evaporating variable in the southern and western stations. Significant changes in evaporating in Hussein Abad and Sarcheshmeh stations in the warm period had a positive trend. Since this area is one of the most important areas in Kurdistan province in terms of water resources therefore, management and water withdrawals from rivers, the amount of water taken from reservoir dams in the basin and provisions that are for agricultural purposes and aquaculture in the utilization region is necessary. References 1- Khalili, Ali and Bazrafshan, J. (2004), analysis of annual precipitation, the seasonal and monthly trends of five old station in hundred and sixteen years in Iran, Biaban, 9 (1), 33-26. 2. Esmaeelpour, Marzieh and Dinpajouh, Jacob (2011), analysis of changes in precipitation on the Dasht Sarab by using Mann-Kendall classic and refined test, the National Conference on climate change and its impact on agriculture and the environment, the second Urmia August. 3. Rahim Zadeh Fatemeh and Hedayat Dezfuli, Akram and Poorasgharian, Arezoo (2011), trend mutation evaluation of rainfall and evaporation in Hormozgan province, Geography and development Magazine NO.21, P 97-116 4. Hajjam, Sohrab, Khoshkhu, Yunus and Shamseddinvendy, R. (2008), analyzing trend of changes in the seasonal and annual rainfall of some stations in central areas of Iran by using non-parametric methods, Geographic Research 64, 168-157. 5. Tabari, Hussein and Maroufi, Safdar (2011), revealing trend of changes in Maroon river discharge by using parametric and nonparametric methods. Geographical Research Journal 26, 2. 6- Blenkinsop S., and Fowler, H.J (2007) Changes in drought frequency, severity and duration for the British Isles projected by the PRUDENCE regional climate models. Journal of Hydrology, 342: 50– 71. 7- Bonacci O (1993), Hydrological identification of drought. Hydrological Processes, 7:249-262. 8- Sen, P. K (1266), Estimates of the regression coefficient based on Kendall’s tau. Journal of American Statistical Association , 63:1379-1389. 9- Luo, Y., Liu, Sh., Fu, S., Liu, J.,Wang, guoqin, &Zhou, G (2008), Trends of Precipitaion in Beijiang River Basin, Guangdong Province, China, Hydrological Processes., 22, 2377-2386. 10- Carrera-Hernandez, J. J. and Gaskin, S. J. , 2007 , Spatio temporal analysis of daily precipitation and temperature in the Basin of Mexico, Journal of Hydrology , 336: 231– 249. 11- Bouza-Dean, R., Ternero-Rodrıguez, M. &Fernandez-Espinosa, A.J (2008), Trend study and assessment of surface water quality in the Ebro River (Spain), J. Hydrol., 361, 227-239. 12- Caloiero, T, Coscarslli, R, Ferrari, E&Mancini, M (2009), Trend detection of annual and seasonal rainfall in Calabria (Southern Italy). International Journal of Climatol, vol31, No.44-56. 13- Masih. I. Uhlenbrook. S. &V.Smakhtin (2011), Streamflow trend and climate linkages in the United States. Journal of climate, 7, .586-607. 14- Matti, C, Pauling, A, Kuttel, M& H, Wanner (2009), winter precipitation trends for two selected European regions over the last 500 years and their possible dynamical background. Theoretical Applied Climatology, 95: 9-26.
M.Gholizadeh, Assistant Professor Department of Ecology University of Kurdistan, [email protected] F.Ghaderi, PhD student in Ecology and a visiting lecturer at Department of Ecology the University of Kurdistan Regional Group, E-mail: [email protected] M.Bayazid, Assistant Professor, Department of Water Engineering, Islamic Azad University of Sanandaj, [email protected] M.Kaki, MA Water Resources Management, [email protected]
y = 47.175x + 623.39 R ² = 0.81
Ev
ap
ora
tio
n(m
m)
Time(year)