the impact of foreign bank deleveraging on korea impact of foreign bank deleveraging on korea...
TRANSCRIPT
The Impact of Foreign Bank Deleveraging on Korea
Sonali Jain-Chandra, Min Jung Kim, Sung Ho Park and Jerome Shin
WP/13/101
© 2013 International Monetary Fund WP/13/101
IMF Working Paper
Asia and Pacific Department
The Impact of Foreign Bank Deleveraging on Korea
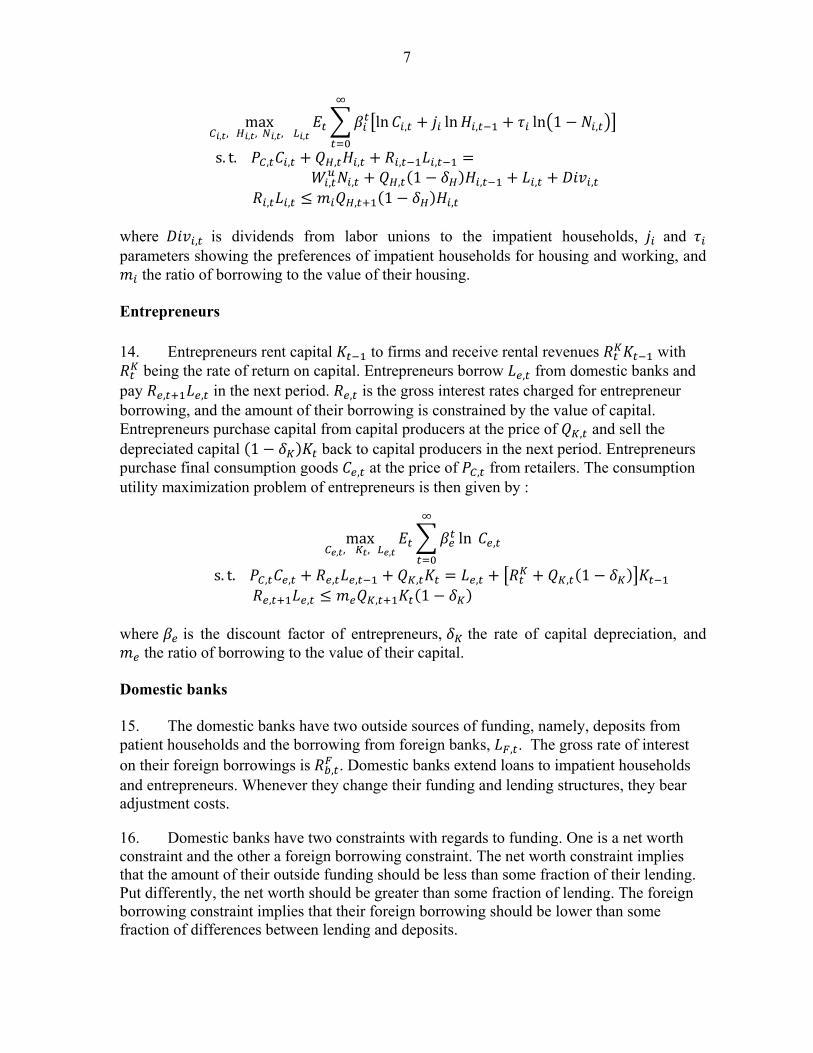
Prepared by Sonali Jain-Chandra, Min Jung Kim, Sung Ho Park and Jerome Shin1
Authorized for distribution by Luis Breuer
May 2013
Abstract
Korea was hit hard by the 2008 global financial crisis, with the foreign bank deleveraging channel coming prominently into play. The global financial crisis demonstrated that a sharp deleveraging can be transmitted to emerging markets through the bank lending channel to a slowdown in credit growth. The analysis finds that a sharp decline in external funding led to relatively modest decline in domestic credit by Korean banks, due to concerted policy efforts by the government in 2008. Impulse responses from a Dynamic Stochastic General Equilibrium (DSGE) model calibrated to Korea shows that it appears better prepared to handle such shocks relative to 2008. Indeed, Korea is much more resilient to such shocks due to the efforts by the authorities, which has led to the strengthening of external buffers, such as higher foreign exchange reserves and bilateral and multilateral currency swap arrangements.
JEL Classification Numbers: G2, E3, E5. Keywords: Global banks, liquidity shock, cross-border lending Author’s E-Mail Address:[email protected]
1 This paper was prepared as a part of joint research collaboration between the IMF and the Bank of Korea (BOK). We are grateful to Luis Breuer, Hoe Ee Khor, Junhan Kim, Seung Heon Lee, Jack Ree, and Tom Rumbaugh for insightful comments and suggestions. We are particularly thankful to Selim Elekdag for invaluable discussions on the DSGE model. We also thank the seminar participants at the Bank of Korea- IMF Joint research seminar for insightful discussions and comments. Thelma Choi provided excellent research assistance.
This Working Paper should not be reported as representing the views of the IMF. The views expressed in this Working Paper are those of the author(s) and do not necessarily represent those of the IMF or IMF policy. Working Papers describe research in progress by the author(s) and are published to elicit comments and to further debate.
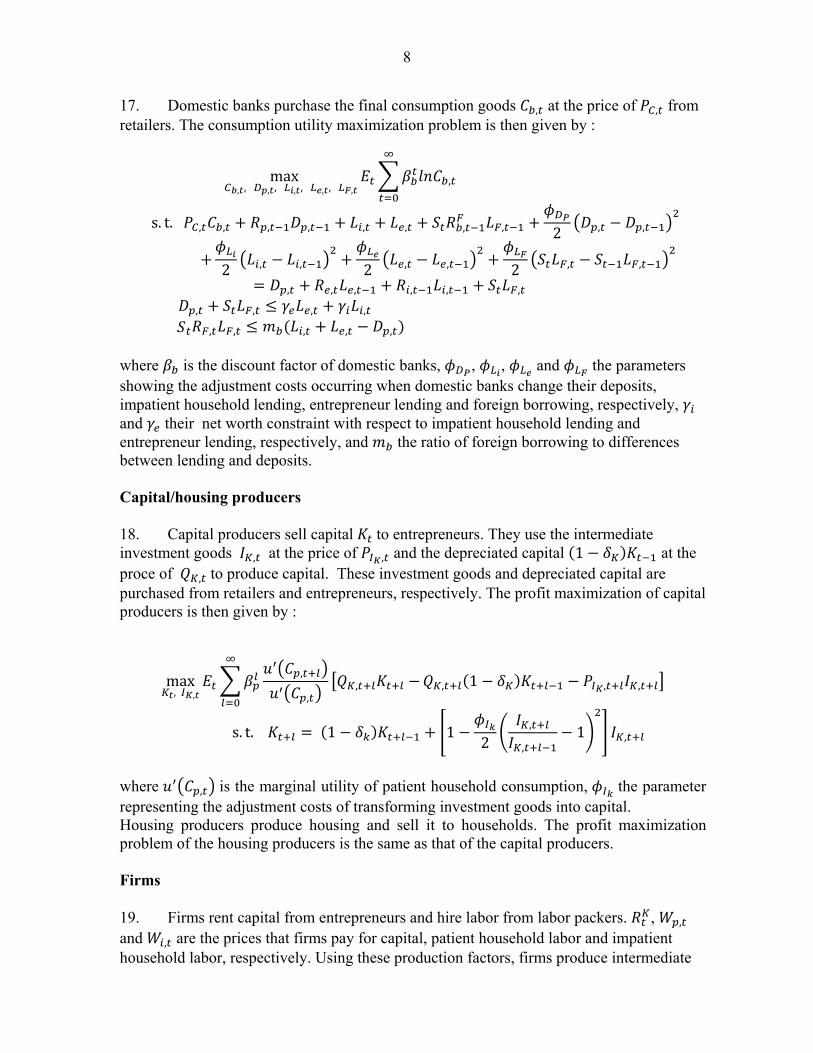
2
Contents Page
I. Introduction ............................................................................................................................3
II. Korea’s Linkages to International Banks: Stylized Facts .....................................................4
III. Effect of Foreign Bank Deleveraging on Korea: Evidence from a DSGE Model ...............5 A. Model Description.....................................................................................................6 B. Impulse Responses ..................................................................................................10
IV. The Transmission of the 2008 Crisis to Korean Banks: Regression Analysis ..................14
V. Conclusion ..........................................................................................................................19 References ................................................................................................................................20 Figures 1. Stock of Consolidated Foreign Claims to Euro Area, U.K., U.S., and Japan Banks ........ 5 2. Consolidated Foreign Claims of European and U.S. Banks on Selected Asian Economies ......................................................................................................................... 5 3. Stock of Consolidated Foreign Claims by Sector ............................................................. 5 4. Quarterly Change in Consolidated Foreign Claims .......................................................... 6 5. Impulse Responses to Negative Foreign Borrowing Shocks ...........................................14 6. Quarterly Change in Exchange Rate Adjusted Locational Cross Border Claims of BIS
Reporting Banks...............................................................................................................15 7. Change in External Liabilities of Banks ..........................................................................16 Tables 1. Ratios of Liabilities and Trade to GDP ...........................................................................12 2. Parameter Values ............................................................................................................12 3. Variance of Impulse Responses ......................................................................................13 4. Summary Statistics: Domestic Banks and Foreign Bank Branches ................................17 5. Panel Regression Results ................................................................................................19
3
I. INTRODUCTION
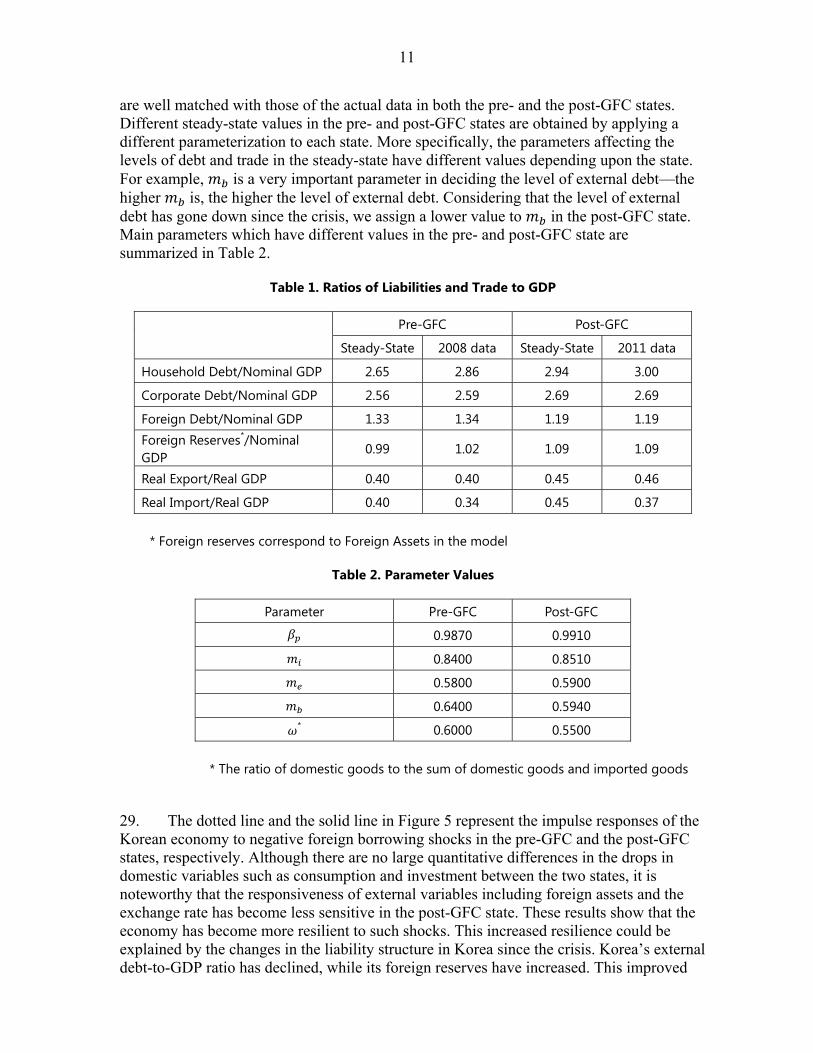
1. International banks constituted a key channel of transmission of financial stress during the global financial crisis (GFC). Indeed, the collapse in capital flows to emerging markets in the aftermath of the crisis was dominated by the precipitous fall in cross-border bank loans, as linkages with international banks played a major role in the transmission of the crisis (April 2009 World Economic Outlook). In the second half of 2011, as the crisis in Europe deepened and pressures on European banks intensified, deleveraging ensued in response to the European Banking Authority’s higher targets on bank capital adequacy ratios. So far, the evidence suggests it has been relatively orderly and gradual. The funding strains eased due to the European Central Bank’s Long-Term Refinancing Operations (LTRO) and resulted in re-leveraging by European banks in the first quarter of 2012.
2. Looking ahead, the possibility of a pull back resulting from a further intensification of the euro zone crisis cannot be ruled out. As the April 2012 Global Financial Stability Report (GFSR) pointed out, while some deleveraging by European banks is inevitable and even desirable, it is crucial to try to avoid synchronized and large scale shrinkage of balance sheets which would have serious implications for economic activity and financial markets within Europe and elsewhere.
3. This paper contributes to the emerging literature on the transmission to the real economy of the external funding shock to bank balance sheets during the GFC. We focus specifically on Korea as it is one of the economies in Asia that is significantly exposed to foreign bank funding risks as it relies on wholesale funding, though considerably less than in the past. This dependence resulted in serious knock-on effects during the 2008 crisis. This paper assesses whether the credit supply response in Korea to deleveraging by foreign banks was different than in other economies.
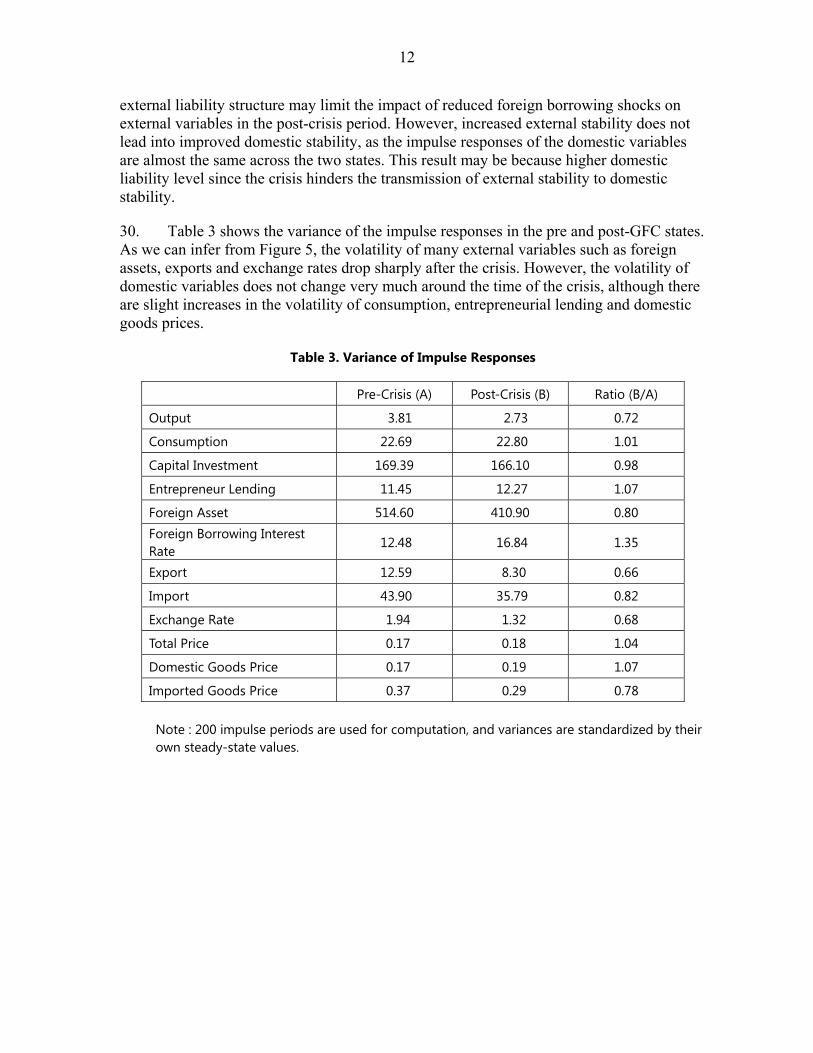
4. This paper asks the following questions:
• What is the nature of Korea’s linkages to international banks, and how have they evolved over time?
• How and to what extent did the freeze in external funding during the 2008 crisis affect Korean economy and the banks?
• Has the sensitivity to foreign bank inflows changed in the post-2008 period?
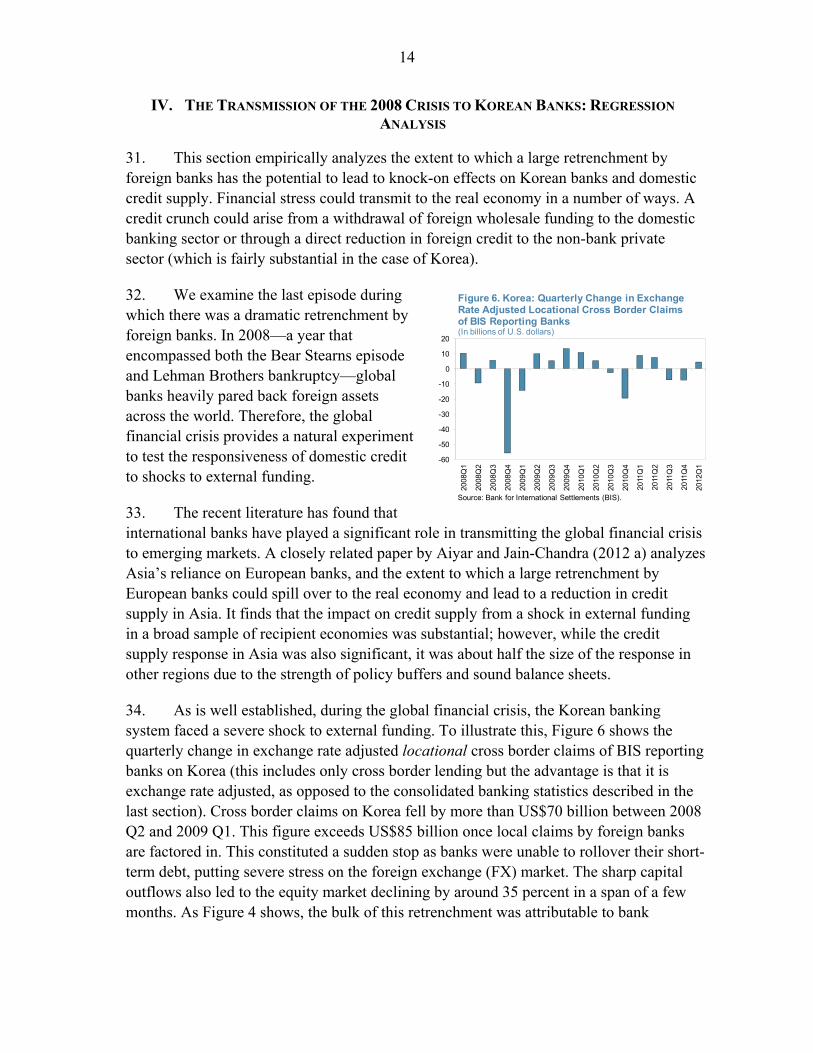
5. We use two approaches to analyze the effect of foreign bank deleveraging on Korea: impulse response functions from a DSGE) model with a full-fledged banking sector and bank-level panel regressions.
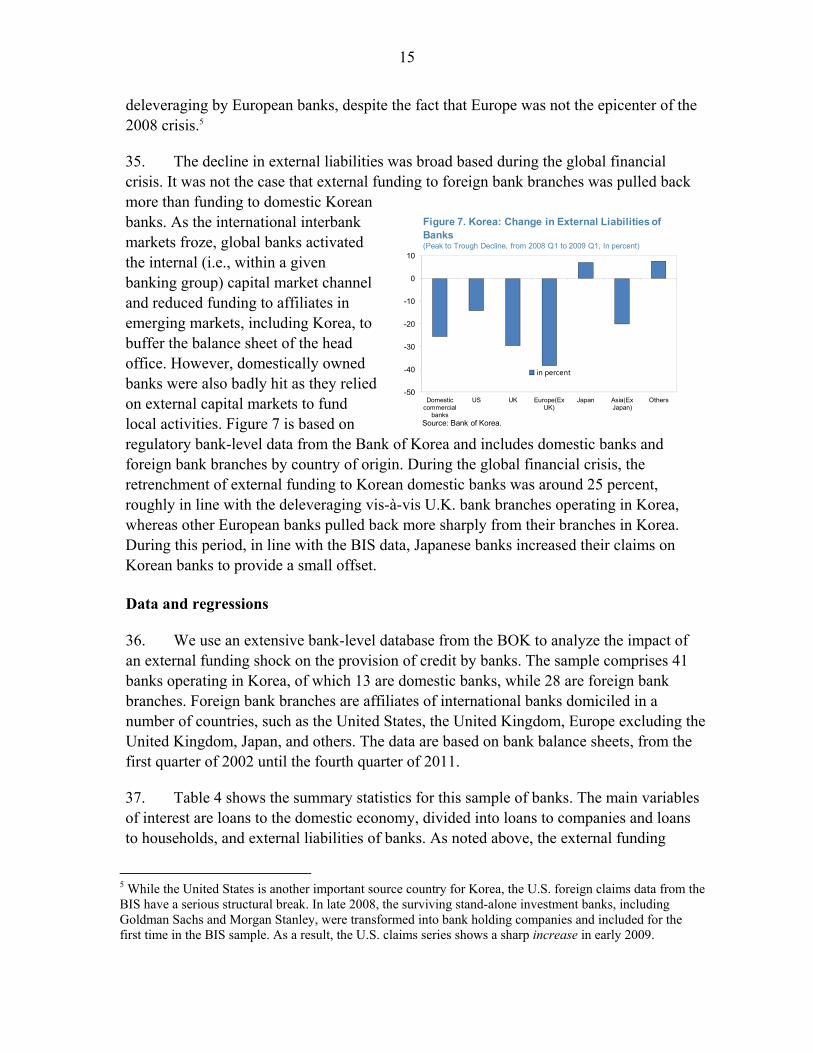
6. The paper is structured as follows: the next section explores the links between foreign banks and Korea by comparing the extent and nature of reliance on foreign bank funding within Asia. Section III presents a DSGE model that incorporates a fully fledged banking sector to trace the spillovers from foreign bank deleveraging on output and
4
external variables. It provides a rich description of the setup of the model and also compares the differences in responses before and after the global financial crisis. Section IV presents the panel regression framework and results. Section V concludes.
II. KOREA’S LINKAGES TO INTERNATIONAL BANKS: STYLIZED FACTS
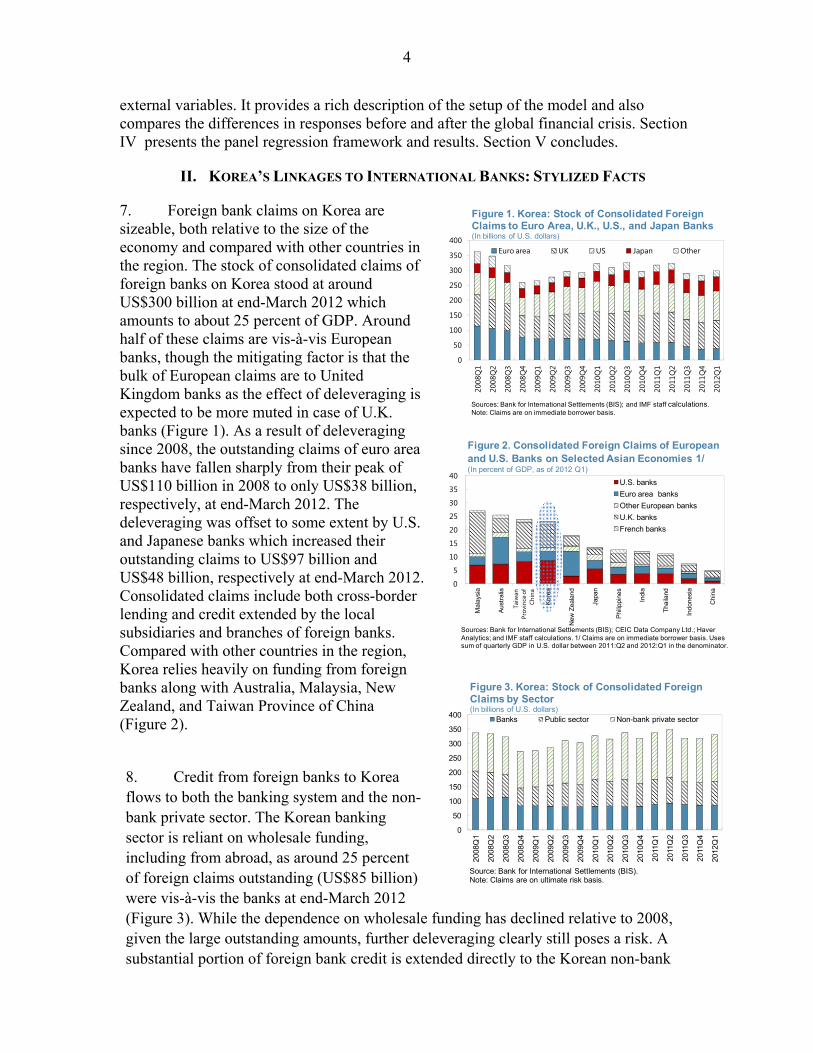
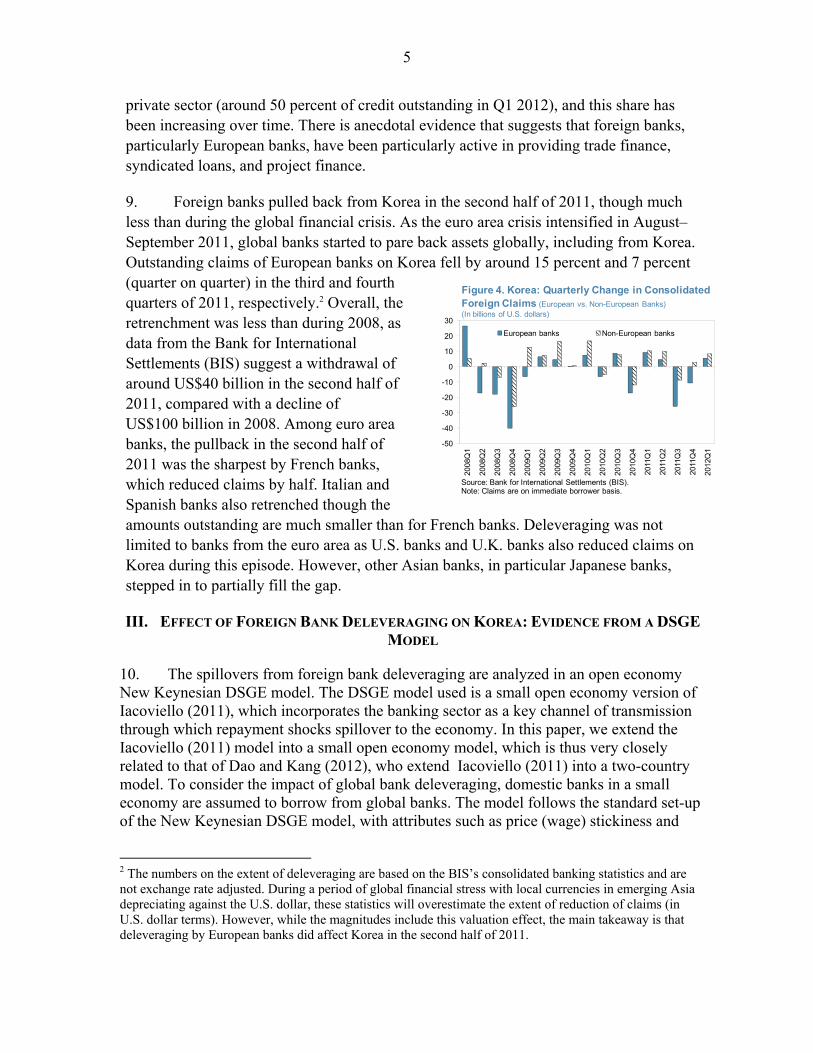
7. Foreign bank claims on Korea are sizeable, both relative to the size of the economy and compared with other countries in the region. The stock of consolidated claims of foreign banks on Korea stood at around US$300 billion at end-March 2012 which amounts to about 25 percent of GDP. Around half of these claims are vis-à-vis European banks, though the mitigating factor is that the bulk of European claims are to United Kingdom banks as the effect of deleveraging is expected to be more muted in case of U.K. banks (Figure 1). As a result of deleveraging since 2008, the outstanding claims of euro area banks have fallen sharply from their peak of US$110 billion in 2008 to only US$38 billion, respectively, at end-March 2012. The deleveraging was offset to some extent by U.S. and Japanese banks which increased their outstanding claims to US$97 billion and US$48 billion, respectively at end-March 2012. Consolidated claims include both cross-border lending and credit extended by the local subsidiaries and branches of foreign banks. Compared with other countries in the region, Korea relies heavily on funding from foreign banks along with Australia, Malaysia, New Zealand, and Taiwan Province of China (Figure 2).
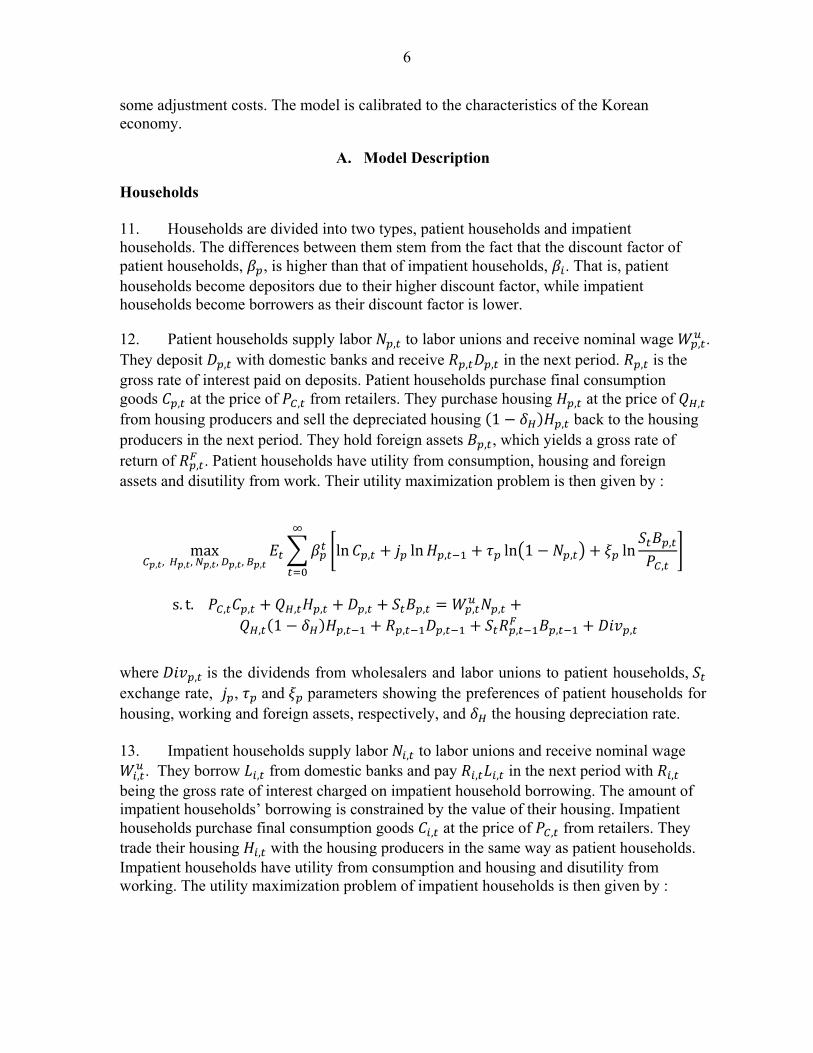
8. Credit from foreign banks to Korea flows to both the banking system and the non-bank private sector. The Korean banking sector is reliant on wholesale funding, including from abroad, as around 25 percent of foreign claims outstanding (US$85 billion) were vis-à-vis the banks at end-March 2012 (Figure 3). While the dependence on wholesale funding has declined relative to 2008, given the large outstanding amounts, further deleveraging clearly still poses a risk. A substantial portion of foreign bank credit is extended directly to the Korean non-bank
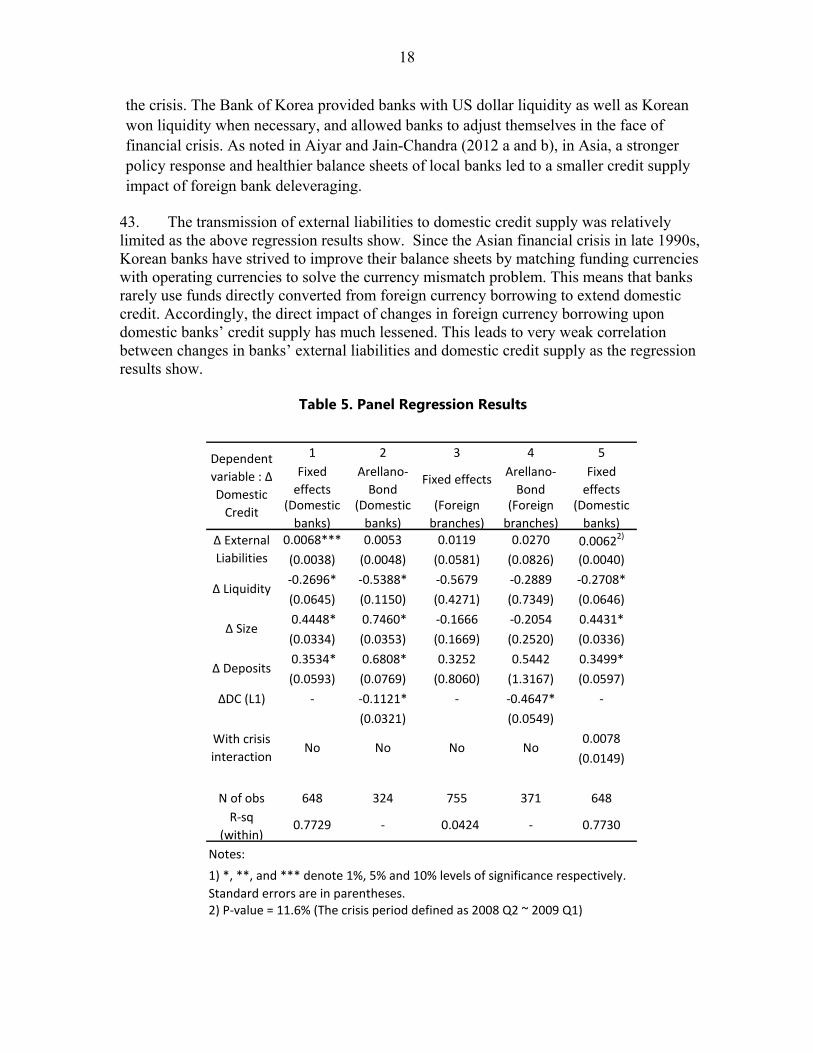
0
50
100
150
200
250
300
350
400
2008
Q1
2008
Q2
2008
Q3
2008
Q4
2009
Q1
2009
Q2
2009
Q3
2009
Q4
2010
Q1
2010
Q2
2010
Q3
2010
Q4
2011
Q1
2011
Q2
2011
Q3
2011
Q4
2012
Q1
Euro area UK US Japan Other
Figure 1. Korea: Stock of Consolidated Foreign Claims to Euro Area, U.K., U.S., and Japan Banks (In billions of U.S. dollars)
Sources: Bank for International Settlements (BIS); and IMF staff calculations.Note: Claims are on immediate borrower basis.
0
50
100
150
200
250
300
350
400
2008
Q1
2008
Q2
2008
Q3
2008
Q4
2009
Q1
2009
Q2
2009
Q3
2009
Q4
2010
Q1
2010
Q2
2010
Q3
2010
Q4
2011
Q1
2011
Q2
2011
Q3
2011
Q4
2012
Q1
Banks Public sector Non-bank private sector
Figure 3. Korea: Stock of Consolidated Foreign Claims by Sector(In billions of U.S. dollars)
Source: Bank for International Settlements (BIS).Note: Claims are on ultimate risk basis.
0
5
10
15
20
25
30
35
40M
alay
sia
Aus
tral
ia
Kor
ea
New
Zea
land
Japa
n
Phi
lippi
nes
Indi
a
Tha
iland
Indo
nesi
a
Chi
na
U.S. banks
Euro area banks
Other European banks
U.K. banks
French banks
Taiw
anPr
ovin
ce o
fCh
ina
Sources: Bank for International Settlements (BIS); CEIC Data Company Ltd.; Haver Analytics; and IMF staff calculations. 1/ Claims are on immediate borrower basis. Uses sum of quarterly GDP in U.S. dollar between 2011:Q2 and 2012:Q1 in the denominator.
Figure 2. Consolidated Foreign Claims of European and U.S. Banks on Selected Asian Economies 1/ (In percent of GDP, as of 2012 Q1)
5
private sector (around 50 percent of credit outstanding in Q1 2012), and this share has been increasing over time. There is anecdotal evidence that suggests that foreign banks, particularly European banks, have been particularly active in providing trade finance, syndicated loans, and project finance.
9. Foreign banks pulled back from Korea in the second half of 2011, though much less than during the global financial crisis. As the euro area crisis intensified in August–September 2011, global banks started to pare back assets globally, including from Korea. Outstanding claims of European banks on Korea fell by around 15 percent and 7 percent (quarter on quarter) in the third and fourth quarters of 2011, respectively.2 Overall, the retrenchment was less than during 2008, as data from the Bank for International Settlements (BIS) suggest a withdrawal of around US$40 billion in the second half of 2011, compared with a decline of US$100 billion in 2008. Among euro area banks, the pullback in the second half of 2011 was the sharpest by French banks, which reduced claims by half. Italian and Spanish banks also retrenched though the amounts outstanding are much smaller than for French banks. Deleveraging was not limited to banks from the euro area as U.S. banks and U.K. banks also reduced claims on Korea during this episode. However, other Asian banks, in particular Japanese banks, stepped in to partially fill the gap.
III. EFFECT OF FOREIGN BANK DELEVERAGING ON KOREA: EVIDENCE FROM A DSGE
MODEL
10. The spillovers from foreign bank deleveraging are analyzed in an open economy New Keynesian DSGE model. The DSGE model used is a small open economy version of Iacoviello (2011), which incorporates the banking sector as a key channel of transmission through which repayment shocks spillover to the economy. In this paper, we extend the Iacoviello (2011) model into a small open economy model, which is thus very closely related to that of Dao and Kang (2012), who extend Iacoviello (2011) into a two-country model. To consider the impact of global bank deleveraging, domestic banks in a small economy are assumed to borrow from global banks. The model follows the standard set-up of the New Keynesian DSGE model, with attributes such as price (wage) stickiness and
2 The numbers on the extent of deleveraging are based on the BIS’s consolidated banking statistics and are not exchange rate adjusted. During a period of global financial stress with local currencies in emerging Asia depreciating against the U.S. dollar, these statistics will overestimate the extent of reduction of claims (in U.S. dollar terms). However, while the magnitudes include this valuation effect, the main takeaway is that deleveraging by European banks did affect Korea in the second half of 2011.
-50
-40
-30
-20
-10
0
10
20
30
2008
Q1
2008
Q2
2008
Q3
2008
Q4
2009
Q1
2009
Q2
2009
Q3
2009
Q4
2010
Q1
2010
Q2
2010
Q3
2010
Q4
2011
Q1
2011
Q2
2011
Q3
2011
Q4
2012
Q1
European banks Non-European banks
Source: Bank for International Settlements (BIS).Note: Claims are on immediate borrower basis.
Figure 4. Korea: Quarterly Change in Consolidated Foreign Claims (European vs. Non-European Banks)(In billions of U.S. dollars)
6
some adjustment costs. The model is calibrated to the characteristics of the Korean economy.
A. Model Description
Households 11. Households are divided into two types, patient households and impatient households. The differences between them stem from the fact that the discount factor of patient households, , is higher than that of impatient households, . That is, patient households become depositors due to their higher discount factor, while impatient households become borrowers as their discount factor is lower.
12. Patient households supply labor , to labor unions and receive nominal wage , . They deposit , with domestic banks and receive , , in the next period. , is the gross rate of interest paid on deposits. Patient households purchase final consumption goods , at the price of , from retailers. They purchase housing , at the price of , from housing producers and sell the depreciated housing 1 , back to the housing producers in the next period. They hold foreign assets , , which yields a gross rate of return of , . Patient households have utility from consumption, housing and foreign assets and disutility from work. Their utility maximization problem is then given by :
max, , , , , , , , ,
ln , ln , ln 1 , ln ,
,
s. t. , , , , , , , , , 1 , , , , , ,
where , is the dividends from wholesalers and labor unions to patient households, exchange rate, , and parameters showing the preferences of patient households for housing, working and foreign assets, respectively, and the housing depreciation rate. 13. Impatient households supply labor , to labor unions and receive nominal wage
, . They borrow , from domestic banks and pay , , in the next period with , being the gross rate of interest charged on impatient household borrowing. The amount of impatient households’ borrowing is constrained by the value of their housing. Impatient households purchase final consumption goods , at the price of , from retailers. They trade their housing , with the housing producers in the same way as patient households. Impatient households have utility from consumption and housing and disutility from working. The utility maximization problem of impatient households is then given by :
7
max, , , , , , ,
ln , ln , ln 1 ,
s. t. , , , , , ,
, , , 1 , , , , , , 1 ,
where , is dividends from labor unions to the impatient households, and parameters showing the preferences of impatient households for housing and working, and
the ratio of borrowing to the value of their housing. Entrepreneurs 14. Entrepreneurs rent capital to firms and receive rental revenues with
being the rate of return on capital. Entrepreneurs borrow , from domestic banks and pay , , in the next period. , is the gross interest rates charged for entrepreneur borrowing, and the amount of their borrowing is constrained by the value of capital. Entrepreneurs purchase capital from capital producers at the price of , and sell the depreciated capital 1 back to capital producers in the next period. Entrepreneurs purchase final consumption goods , at the price of , from retailers. The consumption utility maximization problem of entrepreneurs is then given by :
max, , , ,
ln ,
s. t. , , , , , , , 1 , , , 1
where is the discount factor of entrepreneurs, the rate of capital depreciation, and
the ratio of borrowing to the value of their capital. Domestic banks 15. The domestic banks have two outside sources of funding, namely, deposits from patient households and the borrowing from foreign banks, , . The gross rate of interest on their foreign borrowings is , . Domestic banks extend loans to impatient households and entrepreneurs. Whenever they change their funding and lending structures, they bear adjustment costs.
16. Domestic banks have two constraints with regards to funding. One is a net worth constraint and the other a foreign borrowing constraint. The net worth constraint implies that the amount of their outside funding should be less than some fraction of their lending. Put differently, the net worth should be greater than some fraction of lending. The foreign borrowing constraint implies that their foreign borrowing should be lower than some fraction of differences between lending and deposits.
8
17. Domestic banks purchase the final consumption goods , at the price of , from retailers. The consumption utility maximization problem is then given by :
max , , , , , , , , ,
,
s. t. , , , , , , , , 2 , ,
2 , , 2 , , 2 , ,
, , , , , , , , , , , , , , ,
where is the discount factor of domestic banks, , , and the parameters showing the adjustment costs occurring when domestic banks change their deposits, impatient household lending, entrepreneur lending and foreign borrowing, respectively, and their net worth constraint with respect to impatient household lending and entrepreneur lending, respectively, and the ratio of foreign borrowing to differences between lending and deposits. Capital/housing producers 18. Capital producers sell capital to entrepreneurs. They use the intermediate investment goods , at the price of , and the depreciated capital 1 at the proce of , to produce capital. These investment goods and depreciated capital are purchased from retailers and entrepreneurs, respectively. The profit maximization of capital producers is then given by :
max, ,
,
,, , 1 , ,
s. t. 1 12
,
,1 ,
where , is the marginal utility of patient household consumption, the parameter representing the adjustment costs of transforming investment goods into capital. Housing producers produce housing and sell it to households. The profit maximization problem of the housing producers is the same as that of the capital producers. Firms 19. Firms rent capital from entrepreneurs and hire labor from labor packers. , , and , are the prices that firms pay for capital, patient household labor and impatient household labor, respectively. Using these production factors, firms produce intermediate

9
goods through the Cobb-Douglas production function and sell these goods to wholesalers at the price of , . The profit maximization problem of firms is given by :
max, , , ,
, , , , ,
s. t.
, , 26
where is the capital income shares and the labor income shares of impatient households, and the variable showing their technology level. Wholesalers and retailers 20. In order for the model to exhibit price stickiness, we introduce wholesalers and retailers.3 Wholesalers purchase intermediate goods, and differentiate them and finally sell them to retailers. Differentiation of intermediation goods gives wholesalers the power of setting their prices. Wholesalers decide the optimal prices with indexation, following Calvo (1983). Domestic wholesalers and imported goods wholesalers are distinct in that they purchase either domestic intermediate goods or foreign intermediate goods.
21. Retailers purchase differentiated goods, and combine and sell them to households, entrepreneurs, domestic banks, capital producers and housing producers. The combined goods sold to households, entrepreneurs and domestic banks become final consumption goods, while the combined goods sold to capital producers and housing producers become capital investment goods and housing investment goods, respectively. Labor unions and labor packers 22. To give the model wage stickiness, labor unions and labor packers are introduced. Labor unions hires labor from households, and differentiate and supply it to labor packers. Similar to wholesalers, labor unions can set the optimal wages during differentiation via Calvo (1983), with indexation. Labor packers hire differentiated labor, and combine and supply it to firms.4
Foreign sector 23. Since we assume that the economy under consideration is a small open economy, the foreign sector is so large that the domestic sector cannot affect the foreign sector, but the foreign sector can affect the domestic sector. The foreign sector is interconnected with the domestic sector in two ways. Firstly, firms export their intermediate goods to foreign wholesalers, while domestic imported good wholesalers import foreign intermediate goods.
3 To see how the optimal prices are determined by wholesalers and retailers, please refer to Bernanke et al (1999), Iacoviello (2005) etc. 4 To see how the optimal wages are determined, refer to Smet and Wouters (2007).
10
Secondly, domestic banks borrow from foreign banks, and patient households save their foreign assets and place them with foreign banks.
24. Net exports and net capital flows between the domestic and foreign sectors should cancel out, and so the following equality always holds :
, , , , , , , , where and represent exports and imports, and , and , are the respective prices of exports and imports. Monetary Policy 25. The central bank set the interest rates of deposits according to the Taylor rule as follows :
, ,,
where the smoothing parameter, and the responses of the central bank to output
and price, respectively, and , and the steady-state values of , , and , , respectively.
B. Impulse Responses 26. The model is used to trace out the effects on the economy when global banks deleverage and thereby reduce their credit supply to the domestic economy. Figure 5 below show the impulse responses to such a negative foreign credit supply shock. The drop in foreign borrowing reduces the size of domestic bank balance sheets. Thus, domestic banks cut their lending to entrepreneurs, who in turn reduce their investment, leading to a decline in output. Also, when global credit supply to the small open economy decreases, the exchange rate depreciates, leading to an increase in imported goods prices, which results in a higher overall price level. However, exchange rate depreciation boosts exports, which offsets the decline in output to some extent.
27. To see the changes in response of the Korean economy at around the time of the global financial crisis, we consider two states: pre-GFC and post-GFC. The main differences between these two states are as follows. Firstly, the external debt-to-GDP ratio has decreased markedly since the crisis, while foreign reserves have increased. Secondly, both household and corporate debt-to-GDP ratios have risen, which has boosted the overall level of domestic liabilities in Korea. Lastly, the ratio of exports and imports to GDP has increased, so that the Korean economy has become more dependent on the world economy. The ratios of the actual data in Table 1 demonstrate these changes in Korean economy.
28. The changes in Korea at around the time of the GFC, as mentioned above, are also reflected in the steady-state of the DSGE model. The ratios of the steady-state in Table 1
11
are well matched with those of the actual data in both the pre- and the post-GFC states. Different steady-state values in the pre- and post-GFC states are obtained by applying a different parameterization to each state. More specifically, the parameters affecting the levels of debt and trade in the steady-state have different values depending upon the state. For example, is a very important parameter in deciding the level of external debt––the higher is, the higher the level of external debt. Considering that the level of external debt has gone down since the crisis, we assign a lower value to in the post-GFC state. Main parameters which have different values in the pre- and post-GFC state are summarized in Table 2.
Table 1. Ratios of Liabilities and Trade to GDP
Pre-GFC Post-GFC
Steady-State 2008 data Steady-State 2011 data
Household Debt/Nominal GDP 2.65 2.86 2.94 3.00
Corporate Debt/Nominal GDP 2.56 2.59 2.69 2.69
Foreign Debt/Nominal GDP 1.33 1.34 1.19 1.19 Foreign Reserves*/Nominal GDP
0.99 1.02 1.09 1.09
Real Export/Real GDP 0.40 0.40 0.45 0.46
Real Import/Real GDP 0.40 0.34 0.45 0.37 * Foreign reserves correspond to Foreign Assets in the model
Table 2. Parameter Values
Parameter Pre-GFC Post-GFC
0.9870 0.9910
0.8400 0.8510
0.5800 0.5900
0.6400 0.5940 * 0.6000 0.5500
* The ratio of domestic goods to the sum of domestic goods and imported goods
29. The dotted line and the solid line in Figure 5 represent the impulse responses of the Korean economy to negative foreign borrowing shocks in the pre-GFC and the post-GFC states, respectively. Although there are no large quantitative differences in the drops in domestic variables such as consumption and investment between the two states, it is noteworthy that the responsiveness of external variables including foreign assets and the exchange rate has become less sensitive in the post-GFC state. These results show that the economy has become more resilient to such shocks. This increased resilience could be explained by the changes in the liability structure in Korea since the crisis. Korea’s external debt-to-GDP ratio has declined, while its foreign reserves have increased. This improved
12
external liability structure may limit the impact of reduced foreign borrowing shocks on external variables in the post-crisis period. However, increased external stability does not lead into improved domestic stability, as the impulse responses of the domestic variables are almost the same across the two states. This result may be because higher domestic liability level since the crisis hinders the transmission of external stability to domestic stability.
30. Table 3 shows the variance of the impulse responses in the pre and post-GFC states. As we can infer from Figure 5, the volatility of many external variables such as foreign assets, exports and exchange rates drop sharply after the crisis. However, the volatility of domestic variables does not change very much around the time of the crisis, although there are slight increases in the volatility of consumption, entrepreneurial lending and domestic goods prices.
Table 3. Variance of Impulse Responses
Pre-Crisis (A) Post-Crisis (B) Ratio (B/A)
Output 3.81 2.73 0.72
Consumption 22.69 22.80 1.01
Capital Investment 169.39 166.10 0.98
Entrepreneur Lending 11.45 12.27 1.07
Foreign Asset 514.60 410.90 0.80 Foreign Borrowing Interest Rate
12.48 16.84 1.35
Export 12.59 8.30 0.66
Import 43.90 35.79 0.82
Exchange Rate 1.94 1.32 0.68
Total Price 0.17 0.18 1.04
Domestic Goods Price 0.17 0.19 1.07
Imported Goods Price 0.37 0.29 0.78
Note : 200 impulse periods are used for computation, and variances are standardized by their own steady-state values.

13
Figure 5. Impulse Responses to Negative Foreign Borrowing Shocks
Notes: 1. The y-axis measures the percentage deviation from the steady state. 2. Post-GFC, Pre-GFC
‐0.0020
-0.0015
-0.0010
-0.0005
0.0000
0.0005
1 5 9 13 17
Output
-0.006
-0.004
-0.002
0.000
0.002
1 5 9 13 17
Consumption
-0.006
-0.004
-0.002
0.000
0.002
1 5 9 13 17
Capital Investment
-0.0024
-0.0016
-0.0008
0.0000
1 5 9 13 17
Entrepreneur Lending
-0.016
-0.012
-0.008
-0.004
0.000
1 5 9 13 17
Foreign Asset
-0.002
0.000
0.002
0.004
1 5 9 13 17
Foreign Interest Rate
-0.001
0.000
0.001
0.002
0.003
1 5 9 13 17
Export
-0.006
-0.004
-0.002
0.000
1 5 9 13 17
Import
-0.0008
0.0000
0.0008
0.0016
1 5 9 13 17
Exchange Rate
-0.00004
0.00000
0.00004
0.00008
0.00012
1 5 9 13 17
Total Price
-0.0002
-0.0001
0.0000
0.0001
0.0002
1 5 9 13 17
Domestic Goods Price
0.0000
0.0001
0.0002
0.0003
1 5 9 13 17
Imported Goods Price
14
IV. THE TRANSMISSION OF THE 2008 CRISIS TO KOREAN BANKS: REGRESSION
ANALYSIS
31. This section empirically analyzes the extent to which a large retrenchment by foreign banks has the potential to lead to knock-on effects on Korean banks and domestic credit supply. Financial stress could transmit to the real economy in a number of ways. A credit crunch could arise from a withdrawal of foreign wholesale funding to the domestic banking sector or through a direct reduction in foreign credit to the non-bank private sector (which is fairly substantial in the case of Korea).
32. We examine the last episode during which there was a dramatic retrenchment by foreign banks. In 2008—a year that encompassed both the Bear Stearns episode and Lehman Brothers bankruptcy—global banks heavily pared back foreign assets across the world. Therefore, the global financial crisis provides a natural experiment to test the responsiveness of domestic credit to shocks to external funding.
33. The recent literature has found that international banks have played a significant role in transmitting the global financial crisis to emerging markets. A closely related paper by Aiyar and Jain-Chandra (2012 a) analyzes Asia’s reliance on European banks, and the extent to which a large retrenchment by European banks could spill over to the real economy and lead to a reduction in credit supply in Asia. It finds that the impact on credit supply from a shock in external funding in a broad sample of recipient economies was substantial; however, while the credit supply response in Asia was also significant, it was about half the size of the response in other regions due to the strength of policy buffers and sound balance sheets.
34. As is well established, during the global financial crisis, the Korean banking system faced a severe shock to external funding. To illustrate this, Figure 6 shows the quarterly change in exchange rate adjusted locational cross border claims of BIS reporting banks on Korea (this includes only cross border lending but the advantage is that it is exchange rate adjusted, as opposed to the consolidated banking statistics described in the last section). Cross border claims on Korea fell by more than US$70 billion between 2008 Q2 and 2009 Q1. This figure exceeds US$85 billion once local claims by foreign banks are factored in. This constituted a sudden stop as banks were unable to rollover their short-term debt, putting severe stress on the foreign exchange (FX) market. The sharp capital outflows also led to the equity market declining by around 35 percent in a span of a few months. As Figure 4 shows, the bulk of this retrenchment was attributable to bank
-60
-50
-40
-30
-20
-10
0
10
20
2008
Q1
2008
Q2
2008
Q3
2008
Q4
2009
Q1
2009
Q2
2009
Q3
2009
Q4
2010
Q1
2010
Q2
2010
Q3
2010
Q4
2011
Q1
2011
Q2
2011
Q3
2011
Q4
2012
Q1
Figure 6. Korea: Quarterly Change in Exchange Rate Adjusted Locational Cross Border Claims of BIS Reporting Banks (In billions of U.S. dollars)
Source: Bank for International Settlements (BIS).
15
deleveraging by European banks, despite the fact that Europe was not the epicenter of the 2008 crisis.5
35. The decline in external liabilities was broad based during the global financial crisis. It was not the case that external funding to foreign bank branches was pulled back more than funding to domestic Korean banks. As the international interbank markets froze, global banks activated the internal (i.e., within a given banking group) capital market channel and reduced funding to affiliates in emerging markets, including Korea, to buffer the balance sheet of the head office. However, domestically owned banks were also badly hit as they relied on external capital markets to fund local activities. Figure 7 is based on regulatory bank-level data from the Bank of Korea and includes domestic banks and foreign bank branches by country of origin. During the global financial crisis, the retrenchment of external funding to Korean domestic banks was around 25 percent, roughly in line with the deleveraging vis-à-vis U.K. bank branches operating in Korea, whereas other European banks pulled back more sharply from their branches in Korea. During this period, in line with the BIS data, Japanese banks increased their claims on Korean banks to provide a small offset. Data and regressions 36. We use an extensive bank-level database from the BOK to analyze the impact of an external funding shock on the provision of credit by banks. The sample comprises 41 banks operating in Korea, of which 13 are domestic banks, while 28 are foreign bank branches. Foreign bank branches are affiliates of international banks domiciled in a number of countries, such as the United States, the United Kingdom, Europe excluding the United Kingdom, Japan, and others. The data are based on bank balance sheets, from the first quarter of 2002 until the fourth quarter of 2011.
37. Table 4 shows the summary statistics for this sample of banks. The main variables of interest are loans to the domestic economy, divided into loans to companies and loans to households, and external liabilities of banks. As noted above, the external funding
5 While the United States is another important source country for Korea, the U.S. foreign claims data from the BIS have a serious structural break. In late 2008, the surviving stand-alone investment banks, including Goldman Sachs and Morgan Stanley, were transformed into bank holding companies and included for the first time in the BIS sample. As a result, the U.S. claims series shows a sharp increase in early 2009.
-50
-40
-30
-20
-10
0
10
Domestic commercial
banks
US UK Europe(Ex UK)
Japan Asia(Ex Japan)
Others
in percent
Source: Bank of Korea.
Figure 7. Korea: Change in External Liabilities of Banks (Peak to Trough Decline, from 2008 Q1 to 2009 Q1, In percent)

16
shock translated into a sharp reduction in external liabilities for both domestic banks and foreign bank branches. The growth rate of domestic lending slowed down from the pre-crisis to the crisis period. While the same trend is witnessed for foreign bank branches, their importance in domestic lending is limited, with domestic banks accounting for 96 percent of total domestic loans. Instead, foreign bank branches in Korea typically focus on raising FX funds, including from their headquarters, and providing them to domestic banks through the swap market, and are not usually a provider of domestic credit.
Panel regressions 38. The following econometric specification is used to analyze the impact of an external funding shock on domestic credit:
∆ ∆ …. (1)
Where i=1… N refers to the number of banks in the sample and t=1…T refers to time. The main dependant variable is the change in loans to domestic residents (these are constructed as the sum of bank lending to households and to companies). The explanatory variables include the change in external liabilities, which is the main variable of interest to test the transmission of the external funding shock. The bank-specific control variables include the size of a bank calculated as the log of total assets, liquidity of bank’s assets calculated as cash plus securities scaled by total assets, and the share of funding from deposits is calculated as deposits divided by total liabilities. The priors are that banks that are larger, more liquid and have a more stable source of funding are likely to cut lending by less when faced with an external funding shock. It can be argued that larger banks encounter smaller informational asymmetries than smaller banks, and more liquid and better capitalized banks are able to marshal their resources to maintain lending when faced with a funding shock. The above regression includes bank-specific fixed effects. Also included are time dummies to control for the business cycle and economic policies, including the effect of changes in monetary policy, changes in regulation or government interventions, or changes in supervision. The time dummies also represent another way to capture any changes in loan demand effects through time. Reflecting the difference in business models, we estimate the regression separately for domestic banks and foreign bank branches.
(%) Pre-crisis growth rate Crisis growth rate Pre-crisis growth rate Crisis growth rateLoans to companies 37.47 10.32 29.43 -4.81Loans to households 17.33 4.08 4.13 -0.68Deposits 19.44 6.89 68.23 -12.33Borrowings 13.58 3.63 82.5 -15.65External liabilities 83.07 -21.78 226.74 -23.14Bonds 55.68 9.88 - -
Table 4. Summary Statistics: Domestic Banks and Foreign Bank Branches
Sources: Bank of Korea; and IMF staff calculations.
Domestic Banks FBBs

17
39. The estimation is confronted with two issues: potential endogeneity and disentangling loan demand from loan supply. This paper disentangles the portion of the observed lending slowdown that emanates from reduced loan supply, as opposed to loan demand. It is entirely conceivable that during the crisis, new loans dried up as economy activity slowed rapidly leading to reduced demand for credit, and therefore a decline in the ex post observed loans. Therefore, to establish the operation of a bank lending channel, the identification of a lending supply shock is critical by isolating loan demand shocks. Secondly, the relationship between domestic credit and foreign banking flows can in principle run in both directions. Reduced foreign inflows can lead to a decline in domestic credit, but it is also possible that anemic economic activity and bank credit may attract fewer inflows. This potential endogenity may mean that the regressors could be correlated with the error term. To circumvent these issues, we estimate the panel regression by using dynamic Generalized Method of Moments (GMM) using the Arellano and Bond (1991) estimator to ensure consistency of the estimates.
40. We test for changes in this relationship during the global financial crisis. The next specification introduces a crisis dummy C, which takes the value of one during the period 2008Q1–09Q1. The external liabilities variable is interacted with the crisis dummy to gauge whether the coefficient changes during the crisis period. We estimate the following equation:
∆ ∆….(2)
41. The results of the whole sample regression are summarized in Table 5. Given the different business models for domestic banks and foreign bank branches, we run these regressions separately. Columns 1 and 2 contain the regressions for domestic banks using fixed effects and dynamic GMM estimation, respectively. The finding is that size and a greater reliance on a deposit base are all positively associated with domestic lending. Furthermore, an increase in external liabilities is significantly associated with an increase in lending by domestic banks, although the magnitude is small. A 1 percent increase in external funding leads to a 0.01 percent increase in domestic lending using fixed effects. However, using dynamic GMM estimation for domestic banks, the coefficient on external liabilities is insignificant. Columns 3 and 4 show the regressions for foreign bank branches using fixed effects and dynamic GMM, respectively. As expected, the domestic lending by foreign bank branches is not sensitive to bank specific characteristics. Indeed, foreign bank branches are not very active in retail banking and focus on providing foreign exchange liquidity to domestic banks. These relationships hold during normal times.
42. Next we turn to the estimation of the relationship during the crisis. As noted above, a crisis dummy is introduced into the panel regression and interacted with the main variable of interest, namely the change in external liabilities. However, the results show (contained in column 5) that the crisis dummy is not statistically significant. The effect on domestic bank credit was relatively limited due to the efforts to provide liquidity during
18
the crisis. The Bank of Korea provided banks with US dollar liquidity as well as Korean won liquidity when necessary, and allowed banks to adjust themselves in the face of financial crisis. As noted in Aiyar and Jain-Chandra (2012 a and b), in Asia, a stronger policy response and healthier balance sheets of local banks led to a smaller credit supply impact of foreign bank deleveraging.
43. The transmission of external liabilities to domestic credit supply was relatively limited as the above regression results show. Since the Asian financial crisis in late 1990s, Korean banks have strived to improve their balance sheets by matching funding currencies with operating currencies to solve the currency mismatch problem. This means that banks rarely use funds directly converted from foreign currency borrowing to extend domestic credit. Accordingly, the direct impact of changes in foreign currency borrowing upon domestic banks’ credit supply has much lessened. This leads to very weak correlation between changes in banks’ external liabilities and domestic credit supply as the regression results show.
Table 5. Panel Regression Results 1 2 3 4 5
Fixed
effects
Arellano-
BondFixed effects
Arellano-
Bond
Fixed
effects(Domestic
banks)
(Domestic
banks)
(Foreign
branches)
(Foreign
branches)
(Domestic
banks)0.0068*** 0.0053 0.0119 0.0270 0.00622)
(0.0038) (0.0048) (0.0581) (0.0826) (0.0040)
-0.2696* -0.5388* -0.5679 -0.2889 -0.2708*
(0.0645) (0.1150) (0.4271) (0.7349) (0.0646)
0.4448* 0.7460* -0.1666 -0.2054 0.4431*
(0.0334) (0.0353) (0.1669) (0.2520) (0.0336)
0.3534* 0.6808* 0.3252 0.5442 0.3499*
(0.0593) (0.0769) (0.8060) (1.3167) (0.0597)
ΔDC (L1) - -0.1121* - -0.4647* -
(0.0321) (0.0549)
0.0078
(0.0149)
N of obs 648 324 755 371 648
R-sq
(within)0.7729 - 0.0424 - 0.7730
Notes:
2) P-value = 11.6% (The crisis period defined as 2008 Q2 ~ 2009 Q1)
1) *, **, and *** denote 1%, 5% and 10% levels of significance respectively.
Standard errors are in parentheses.
No No No No
Dependent
variable : Δ
Domestic
Credit
Δ External
Liabilities
Δ Liquidity
Δ Size
Δ Deposits
With crisis
interaction

19
V. CONCLUSION
44. Korea was hit very hard by the 2008 global financial crisis, with the foreign bank deleveraging channel coming prominently into play. The intensification of the euro area crisis in the second half of 2011 also led to significant deleveraging of Korean assets by European banks. Korea was hit hard along with other Asian economies, though the retrenchment was more modest than during the global financial crisis, commensurate with the size of the shock. Although the euro area banks’ exposure to Korea has substantially diminished, Korea may be vulnerable to sudden foreign bank deleveraging resulting from a further escalation of the crisis, as outstanding claims of European banks vis-à-vis Korea remain sizeable compared with other Asian countries. Furthermore, a significant worsening of the crisis and the accompanying deleveraging is unlikely to be confined to European banks alone and is likely to spillover to other international banks through global financial markets.
45. The global financial crisis demonstrated that a sharp deleveraging can be transmitted to emerging markets through the bank lending channel to a slowdown in credit growth. The analysis finds that a 1 percent decline in external funding leads to a 0.01 percent decline in domestic credit by domestic banks in Korea. The effect on the banking sector was limited by the efforts of the government to provide foreign currency liquidity.
46. Despite being vulnerable to sudden foreign bank deleveraging, Korea appears better prepared to handle such shocks relative to 2008.The DSGE model calibrated to Korea finds that the sensitivity of external variables (including net foreign assets) to a foreign bank deleveraging shock has become less after the global financial crisis, showing that the economy has become more resilient to such shocks. The increased resilience could be explained by a lower external debt to GDP ratio and higher foreign reserves since the crisis. Indeed, Korea is much better prepared to face such shocks due to the concerted efforts by the authorities, which has led to the strengthening of external buffers, such as higher foreign exchange reserves, bilateral and multilateral currency swap arrangements. At the same time, the adoption of macroprudential measures have reduced domestic banks’ reliance on short-term wholesale funding, leading to lower exposures to foreign banks.
20
REFERENCES Aiyar, S., forthcoming, “From Financial Crisis to Great Recession: The Role of Globalized
Banks,” American Economic Review Papers and Proceedings (May).
Aiyar, S and S. Jain-Chandra, 2012a, “The Likely Effect on Asia of a Sharp Deleveraging by European Banks,” Regional Economic Outlook: Asia and Pacific (Washington: International Monetary Fund).
––––––, 2012b, “The Domestic Credit Supply Response to International Bank Deleveraging: Is Asia Different?,” IMF Working Paper No. 12/258 (Washington: International Monetary Fund).
Arellano, M. and S. Bond, 1991, “Some Tests of Specification for Panel Data: Monte Carlo Evidence and an Application to Employment Equations. The Review of Economic Studies, 58, pp. 277–297.
Bernanke, B., Gertler M., and Gilchrist S., 1999, “The Financial Accelerator in a Quantitative Business Cycle Framework,” The Handbook of Macroeconomics, ed. by J. B. Taylor and M. Woodford, pp. 1341–1393.
Calvo, G. A., 1983, “Staggered Prices in a Utility-Maximizing Framework,” Journal of Monetary Economics, 12, 383–398.
Cetorelli, N., and L. Goldberg, 2011, “Global Banks and International Shock Transmission: Evidence from the Crisis,” IMF Economic Review, Vol. 59, No. 1, pp. 41–76.
Dao, T. and Kang, T. (2012), “International Financial Business Cycles.” Ehrmann, M, L. Gambacorta, J. Martinez-Pages, P. Sevestre, and A.Worms, 2001,
“Financial Systems and the Role of Banks in Monetary Policy Transmission in the Euro Area,” in Angeloni, Kashyap and Mojon edited “Monetary Transmission in the Euro Area.” (United Kingdom: Cambridge University Press).
Iacoviello, Matteo, 2005, “House Prices, Borrowing Constraints and Monetary Policy in the Business Cycles,” American Economic Review,Vol. 3, 739–764.
Iacoviello, Matteo, 2011, “Financial Business Cycle,” Federal Reserve Board (in progress).
Khwaja, A and A. Mian, 2008, “Tracing the Effect of Bank Liquidity Shocks: Evidence from an Emerging Market,” American Economic Review, Vol. 98(4).
Smets, Frank, and Raf Wouters, 2007, “Shocks and Frictions in U.S. Business Cycles: A Bayesian DSGE Approach,” American Economic Review, 97(3), 586–606.