the impact of customer relationship marketing …239882/fulltext01.pdf · the impact of customer...
TRANSCRIPT
Master Thesis, Halmstad University
i
Halmstad University
School of Business and Engineering
Master Program in International Marketing
The Impact of Customer Relationship
Marketing Tactics On Customer Loyalty
— Within Swedish Mobile Telecommunication Industry
Master’s Dissertation in International Marketing
Final seminar 2009-05-22
Authors:
Xuan Zhang 840905-T102 Yuanyuan Feng 801229-T186
Supervisor:
Venilton Reinert

Master Thesis, Halmstad University
ii
Acknowledgements
During working on this thesis, we have learned a lot. We would like to sincerely thank all the
people who helped us to complete this thesis.
We would like to express our gratitude towards our supervisor Mr. Venilton Reinert for his
helpful guidance, support and contribution. And there is a special thank to Professor Göran
Svensson who helped us solving some problems on statistical tests. Your information was
essential for us to conduct the data analysis.
We also appreciate all the students in Halmstad University who participated in our survey,
without your kind responses to the questionnaire we definitely cannot complete this study.
Thank all of you for your kind assistances and your valuable time.
Halmstand, 2009
Xuan Zhang and Yuanyuan Feng

Master Thesis, Halmstad University
iii
Abstract
Due to the more and more fierce competition in today’s business, many companies are
required to build long-term profitable relationship with customers and to achieve customer
loyalty. Therefore, relationship marketing has become more and more important since last
decade of 20th century, especially in service industry. There are many different relationship
marketing tactics implemented for retaining customer. However, some of those tactics did not
affect customer loyalty effectively, and switching behaviors frequently occur among most of
targeted customers. Therefore, this study is aimed to investigate the impact of relationship
marketing tactics on customer satisfaction and trust, which in turn increase customer loyalty,
by focusing on Swedish mobile telecommunication sector. A analytical model is developed as
a guildline to test the relationships between relationship marketing tactics, relationship quality
(trust and satisfaction) and customer loyalty.
a quantitative method with deductive approach are chosen in this research. In order to collect
primary data, a self-completed questionnaire is designed and randomly sent out by email to
the students in Halmstad University. The SPSS for windows is used to process the primary
data. The findings shows that Service Quality, Price Perception, and Value Offers have
impact on customer loyalty indirectly via the customer satisfaction and trust. Brand image is
positively and directly related to customer loyalty. However, switching costs is found to be
less correlation with customer loyalty, as well as satisfaction and trust in Sweden
telecommunication industry.
Keywords: Relationship Marketing, Relationship Marketing Tactics, Relationship
Quality, Customer Loyalty, Trust, Satisfaction, Switching Cost, Mobile Telecommunication.

Master Thesis, Halmstad University
iv
Table of Contents
1. INTRODUCTION ....................................................................................... - 1 -
1.1 Background ..............................................................................................................................- 1 -
1.2 Problem Discussion ................................................................................................................- 4 -
1.3 Research questions..................................................................................................................- 5 -
1.4 Purpose ......................................................................................................................................- 5 -
1.5 Delimitation..............................................................................................................................- 6 -
2. THEORETICAL FRAMEWORK............................................................... - 7 -
2.1 Relationship Marketing..........................................................................................................- 7 -
2.2 Relationship Marketing Tactics............................................................................................- 9 -
2.2.1 Service Quality..................................................................................................................- 9 -
2.2.2 Price Perception ..............................................................................................................- 11 -
2.2.3 Brand Image....................................................................................................................- 12 -
2.2.4 Value Offers ....................................................................................................................- 13 -
2.3 Relationship Quality.............................................................................................................- 15 -
2.3.1 Trust ................................................................................................................................- 16 -
2.3.2 Satisfaction......................................................................................................................- 18 -
2.4 Switching Costs .....................................................................................................................- 19 -
2.5 Customer Loyalty..................................................................................................................- 20 -
3. METHODOLOGY .................................................................................... - 22 -
3.1 Research Method...................................................................................................................- 22 -
3.2 Case selection and Sampling ..............................................................................................- 23 -
3.3 Questionnaire Design and Data Collection......................................................................- 24 -
3.4 Reliability and Validity ........................................................................................................- 28 -
3.4.1 Reliability........................................................................................................................- 28 -

Master Thesis, Halmstad University
v
3.4.2 Validity ............................................................................................................................- 28 -
3.5 Statistical Analysis ................................................................................................................- 28 -
4. EMPIRICAL DATA AND DATA ANALYSIS.......................................... - 30 -
4.1 Empirical Data .......................................................................................................................- 30 -
4.1.1 Empirical Data Reliability Testing..................................................................................- 30 -
4.1.2 Empirical Data of Correlation Analysis ..........................................................................- 31 -
4.1.3 Testing the hypothesized model ......................................................................................- 33 -
4.2 Data Analysis .........................................................................................................................- 40 -
4.2.1 The impact of the four tactics………….……………………………………………… - 40 -
4.2.2 The impact of relationship quality ..................................................................................- 41 -
4.2.3 The impact of switching costs………….……………………………………………... - 42 -
5. CONCLUSION, IMPLICATION AND LIMITATION ............................ - 43 -
5.1 Conclusion ..............................................................................................................................- 43 -
5.2 Implications ............................................................................................................................- 44 -
5.3 Limitations..............................................................................................................................- 45 -
Reference ....................................................................................................... - 47 -
Appendix :Questionnaire ............................................................................... - 52 -

Master Thesis, Halmstad University
- 1 -
1. INTRODUCTION
The introduction chapter will starts with a background of the subject and a analytical model
that will be researched, followed by a problem discussion and the research questions, then the
purpose of this study will be presented. This chapter will end up with delimitations.
1.1 Background
As the competitive environment becomes more turbulent, the most important issue the sellers
face is no longer to provide excellent, good quality products or services, but also to keep loyal
customers who will contribute long-term profit to organizations (Tseng, 2007). To compete in
such overcrowded and interactive marketplace, marketers are forced to look beyond the
traditional 4Ps of marketing strategy, which are not longer enough to be implemented for
achieving competitive advantage. Therefore, relationship marketing has become an alternative
means for organizations to build strong, ongoing associations with their customers. As a part
of marketing strategy, relationship marketing seek to acquire and retain customers by
providing good quality customer services, and therefore has become one of the keys to
success in acquiring strong competitiveness in the present markets, because of its implications
for access to markets, generation of repeat purchase, creation of exit barriers, and the view
that it benefits all parties (Andaleeb, 1996).
Relationship marketing has received much attention in both academy and practice areas in the
last few decades. It was during the last decade of the 20th century that relationship marketing
began to dominate the marketing field (Egan, 2001). During this period relationship
marketing became a major trend in marketing and management business (Ibid). Relationship
marketing is concerned about building customer loyalty by providing value to all the parties
involved in the relational exchanges (Peng and Wang, 2006), as customer loyalty is the final
goal of relationship marketing.
Buyers and sellers in markets achieve mutual benefits through developing relationships,
which are not simple that a customer is 100 per cent loyal to a vendor (Stone & Woodcock &

Master Thesis, Halmstad University
- 2 -
Machtynger, 2000). There are often switching behaviors occurred in different stages of a
partnership relationship. Relationship marketing tactics are thus approaches to apply
relationship marketing in practice (Tseng, 2007). Effective customer-oriented relationship
marketing tactics may help marketers to acquire customers, keep customers, and maximize
customer profitability, and finally build up customer loyalty..
The telecommunication industry is becoming one of the most important industries in the
world. The telecommunication industry delivers voice communications, data, graphics, and
video at ever increasing speeds. Telecommunication influences the world economy and the
telecommunication industry’s revenue was estimated to be $1.2 trillion in 2006. The
competition is also becoming more and more sharp. In order to obtain sustainable competitive
advantage, telecommunication firms are forced to make innovation and do the best for
customer satisfaction. Due to this, customer relationship marketing plays an important role in
telecommunication industry. It demands a relationship-oriented strategy in marketing
(Grönroos, 2004).
Moreover, the new electronic communication regulations suggested that the regulations would
harmonize the legislation of the EU countries and increased competition would favor the
consumers. And Sweden, as a precursor in this industry also faced a tense competition. In
2004, there are 6.447 million telephone main lines are in use, then in 2005, the number
became 8.044 million
Sweden liberalized its telecommunication sector starting in 1980s and being formally
liberalized in 1993 which was earlier three years than USA, and the European common policy
allowed for an open and competitive telecommunication market five years later. So, the
Swedish telecommunication industry has already became a mature market. The main Swedish
mobile operators – Tele2, Telia, Telenor, and 3(Hutchison) – have launched a mobile
marketing initiative. Facing the fierce competition, it is more and more important for each
firm to execute relationship marketing tactics in order to retain loyal customers who will bring
long-term profit and create competitive advantage to firms.
Considering the significant importance of relationship marketing in today’s business, it will

Master Thesis, Halmstad University
- 3 -
make sense to understand how the relationship marketing are executed in practice and how
this type of marketing take effect, e.g. influencing long-term relationship building and
customer loyalty. Therefore, this study is aimed to develop and exam a analytical model
regarding the field of relationship marketing in practice, based on reviewing literatures and
theories about relationship marketing tactics, relationship quality and customer loyalty. This
developed analytical model is presented as Figure 1.1.
Figure 1.1: Analytical model (developed by authors)
1. Relationship marketing tactics: Relationship marketing is carried out with many
relationship marketing tactics, which are widely to be applied in today’s business. Many
tactics may have potential to influence relationship quality and retaining customers. On basis
of previous researches, four ways of implementing relationship marketing tactics are focused
on this study, such as service quality, price perception, value offers and brand image. These
four tactics will be discussed in detail in the next chapter.
2. Relationship quality: It is usually used to assess the effectiveness of relationship marketing
tactics. It is also considered to be antecedent of achieving customer loyalty. Customer
Relationship
Marketing Tactics
Service
Quality
Price
Perception
Brand
Image
Value Offers
Relationship Quality
Customer
Trust
Customer
Satisfaction
Switching
Costs
Customer
Loyalty
The Impact of Relationship Marketing Tactics on Customer Loyalty
Master Thesis, Halmstad University
- 4 -
satisfaction and trust are two basic components for measuring relationship quality. Higher
level of relationship quality is reflected by higher level of customer satisfaction and trust.
3. Switching costs: It happens when a customer switches from an existing service provider to
a new one. Switching costs perceived by customers can be either monetary or non-monetary
(time, effort, risk taking, psychological nature, etc.). It is considered as a barrier that
influences customer’s decision to change service provider, in turn affect customer’s willing to
remain loyalty with current service provider.
4. Customer loyalty: It was defined by Oliver (1997, p.392) as “deeply held commitment to
rebury or repatronize a preferred product or service consistently in the future, thereby causing
repetitive same-brand or same brand-set purchasing, despite situational influences and
marketing efforts having the potential to cause switching behavior”. Customer loyalty is
thought to be the final goal that a firm apply relationship marketing tactics, by building
long-term mutual relationship with customers.
1.2 Problem Discussion
Confronted with the fierce competition in today telecommunication marketplace, there have
been many marketing strategies for service providers to plan and implement. However,
consumers are disturbed by a number of marketing activities ranging from aggressive sales
tactics, telemarketing, direct mail, doorstep selling, radio advertisement, TV advertisement,
and internet promotion to customer loyalty programmers (Peng and Wang, 2006). There are
also evidences shows that consumers tend to other competitors when they can not be satisfied
with the service quality.
Relationship marketing strategy might be one of the best ways for service providers to retain
customers and building customer loyalty. Many empirical studies have provided evidences
that relationship marketing tactics have impact on behavioral loyalty which affects customer
retention (Peng and Wang, 2006). Therefore, well awareness of the target consumers and
Master Thesis, Halmstad University
- 5 -
building good relationship with them is the most significant issue.
The challenge for telecommunication service providers is to attract more customers, focus on
building good relationship quality with customers, make customers satisfied and trust, and
step by step obtain customer’s loyalty, through relationship marketing tactics.
1.3 Research questions
Companies have implemented various relationship marketing tactics into practice. However,
some of those tactics did not work effectively, and there are phenomena showing that
switching behavior frequently occur among most of targeted customers. Accordingly, our
research questions are brought forward as follows:
(1) What kinds of relationship marketing tactics in practice positively contribute to customer
loyalty?
(2) How do different relationship marketing tactics impact on customer loyalty?
(3) Is the analytical model showed as figure 1.1 proved to be correct?
1.4 Purpose
The purpose of this research is to investigate the impact of customer relationship marketing
tactics on customer loyalty within Swedish mobile telecommunication sector, by analyzing
the relationship of every construct in the analytical model (show as figure 1.1). This study is
expected to exam the relationship between the eight constructs in the model (service quality,
price, value offers, brand image, satisfaction, trust, switching cost and customer loyalty),
which can be a reference for Swedish mobile telecommunication industry.
In order to achieve this purpose, the research focuses on analyzing the developed conceptual
model from consumer’s perspective, accordingly the following hypothesizes are aimed to be

Master Thesis, Halmstad University
- 6 -
tested.
H1a: High service quality perceived by customers is positively related to customer satisfaction.
H1b: High service quality perceived by customers is positively related to customer trust.
H2a: Fair price perceived by customers is positively related to customer satisfaction.
H2b: Fair price perceived by customers is positively related to customer trust.
H3a: Positive brand image perceived by customers is positively related to customer
satisfaction
H3b: Positive brand image perceived by customers is positively related to customer trust.
H4a: The value offers perceived by customers is positively related to customer’s satisfaction.
H4b: The value offers perceived by customers is positively related to customer’s trust.
H5: Customer trust is positively related to customer loyalty.
H6: Customer satisfaction is positively related to customer loyalty.
H7: High switching costs perceived by customer is positively related to customer loyalty.
1.5 Delimitation
First, in terms of the constructs showing in the model, only four ways of relationship
marketing tactics (service quality, brand image, price perception and value offers) are focused;
and only two basic components (satisfaction and trust) are used to measure relationship
quality. Other tactics and quality measurements are beyond this study.
Second, this study only focus on Swedish mobile telecommunication industry, the other
sectors in other countries are not involved.
Third, this study will be done only from customer’s point of view, the service firms’
perspective about this subject are not be researched.

Master Thesis, Halmstad University
- 7 -
2. THEORETICAL FRAMEWORK
This chapter consists of five parts, the theory of the relationship marketing will be discussed
firstly, and then followed by discussing the relationship marketing tactics, relationship quality,
switching costs and customer loyalty, in which each construct showed in the model is
discussed respectively, and the research hypothesises are proposed accordingly.
2.1 Relationship Marketing
During the last decade of the 20th century, relationship marketing has been seen as the
mainstream of though in planning a marketing strategy both in industrial marketing and
consumer marketing (Tseng, 2007). According to Morgan and Hunt (1994), relationship
marketing was defined as all the marketing activities that are designed to establishing,
developing, and maintaining successful relational relationship with customers.
Hougaard and Bjerre (2002, p.40) also defined relationship marketing as “company behavior
with the purpose of establishing, maintaining and developing competitive and profitable
customer relationship to the benefit of both parties”. Due to profitable relationship on a
lifetime basis may also create loss in some stages during the lifetime, Hougaard and Bjerre
(2002, p.40) argued that marketing management must pay attention to three different
objectives in terms of :
� “The management of the initiation of customer relationships”;
� “The maintenance and enhancement of existing relationships”;
� “The handling of relationship termination”.
Wulf et al. (2001) suggested that different levels of relationship duration would result in
different levels of consumption experience, producing different results, satisfaction and
loyalty with different relationship marketing tactics.
Compared with traditional marketing, relationship marketing is more concerned about

Master Thesis, Halmstad University
- 8 -
building customer relationships in order to achieve long-term mutual benefits for all parties
involved in the exchanges. Relationship marketing essentially means developing customers as
partners, where a approach is different from traditional transaction (Bowen and Shoemaker,
2003). Table 2.1 as below shows the differences between relationship marketing and
traditional marketing.
Table 2.1 Relationship marketing compared with traditional marketing
Source: Bowen and Shoemaker, 2003
Since the final purpose of relationship marketing is to gain the maximal value of a customer,
customer loyalty should be emphasized to achieve this goal. The benefits of relationship
marketing derive from the continuing patronage of loyal customers who as a partnership are
not sensitive to price cut over time (Bowen and Shoemaker, 2003). Interdependence, mutual
cooperation and commitment between supplier and customer tend to be essential in
relationship marketing, as such whole relationship is viewed as the key to competitive
advantage (Hougaard and Bjerre, 2002).
Relationship marketing compared with traditional marketing
Relationship Marketing Traditional marketing
Orientation to customer retention Orientation to single sales Continual customer contact Episodic customer contact Focus on customer value Focus on product features Long-term horizon Short-term horizon High customer-service emphasis Little emphasis on customer service High commitment to meeting Limited commitment to meeting Customer expectations customer expectations Quality concerns all staff members Quality concerns only production staff *Traditional marketing can also be considered transactional marketing, in which each sale is considered to be a discrete event. This table is based on an idea from: F. Robert Dwyer, Paul Schurr, and Sejo Oh, “ Developing Buyer-seller Relationships.” Journal of Marketing, Vol. 51, April 1987, pp. 11-27.

Master Thesis, Halmstad University
- 9 -
2.2 Relationship Marketing Tactics
There have been various ways for marketers to implement relationship marketing tactics,
which are expected to have impact on customer retention and loyalty. Bansal, Taylor and
James (2005) suggested that relationship marketing tactics can be executed through service
quality, price perception, value offered, alternative attractiveness, and so on. Tseng (2007)
discussed that tactics as direct mail, tangible rewards, interpersonal communication,
preferential treatment and membership could enhance long-term relationship and increase
relationship satisfaction, trust and commitment. Peng and Wang (2006) also examed the
application of relationship tactics in service quality, reputation (brand), price perception, value
offers.
Based on the early theories, certain relationship marketing tactics which are considered of
importance in service industry, such as service quality, price perception, value offers and
brand image, will be focused in the following parts.
2.2.1 Service Quality
Service is different from physical products. Compared with physical products, Service is
thought to be intangible, heterogeneous, produced and consumed simultaneously, unable to be
kept in stock, etc. A widely accepted definition of service is proposed by Grönroos in 1990 as:
“A service is a process consisting of a series of more or less intangible activities that normally,
but not necessarily always, take place in interactions between the customer and service
employees and/or physical resources or goods and/or systems of the service provider, which
are provided as solutions to customer problems” (see Grönroos, 2000, p.46). This definition
implied that service is a process where interactions between customer and service provider
most often exist. Hence, in a service context, there are almost a relationship between customer
and service provider, such relationship can be used as a basis for marketing (Grönroos, 2000).
In order to retain loyal customer who will bring long-term profit to the firm, the key issue for
service provider is to make use of this relationship in the way it manages customers by

Master Thesis, Halmstad University
- 10 -
offering what the customers needs and wants.
The quality of a service is subjectively perceived by customers during the interactions with a
firm (Grönroos, 2000). Parasuraman et al. (1988) defined service quality as the consumers’
judgment about a firm’s overall excellence or superiority. What happens and perceived by
customers in the interaction process will obviously have critical impacts on customers’
evaluation of service quality (Grönroos, 2000).
Due to the peculiar attributes of service, the evaluation of service quality is more complex
than evaluation of product quality. There have been various ways for measurements of service
quality proposed by previous researches and literatures. The famous measurement model of
service quality is SERVQUAL developed by Parasuraman et al.(1988), who measured the
differences between customer expectations and perceptions cross five determinants as
follows:
� Tangibles: Appearance of physical facilities, equipment, employees and communication materials from a service company.
� Reliability: A service company’s ability to perform the promised service dependably and accurately.
� Assurance: employees’ knowledge and behavior about courtesy and ability to convey trust and confidence.
� Responsiveness: A service company is willing to help customers and provide punctual services.
� Empathy: A service company provides care and individualized attention to its customers, as well as having convenient operating hours.
Later, based on integrating previous studies and conceptual works, Grönroos (2000)
summarized seven criteria of good perceived service quality as: (1) professionalism and skills;
(2) employees’ attitudes and behavior; (3) accessibility and flexibility; (4) reliability and
trustworthiness; (5) service recovery; (6) serviscape; and (7) reputation and credibility. The
first criteria is outcome-related and thus a technical quality dimension; the last one is
image-related and fulfils a filtering function; and the rest five ones are process-related and
present the functional quality dimensions (Ibid).

Master Thesis, Halmstad University
- 11 -
High service quality is regarded as a key to succeed in competitive service markets. Many
researches have showed that service quality perceived by customers are will directly influence
customers’ satisfaction, as well as their trust in the service firm (Parasuraman et al., 1988;
Aydin and Özer, 2005; Ismail et al., 2006; etc.). Customers might be satisfied when a firm
provide better services than their pre-purchase expectations. Customer trusts also emerge
when customers perceive positive service quality from a firm, and believe the service firm
would bring preferable outcomes for them. In mobile telecommunication industry which
belongs to service industry, service quality is an important indicator to assess a service
provider’s performance. Offering a high quality service is considered to be a visible way to
create customers trust and satisfaction, as well as obtaining competitive advantages and
building a long-term relationship with customers.
Therefore, the following hypotheses are proposed based on the above discussion:
H1a: High service quality perceived by customers is positively related to customer satisfaction.
H1b: High service quality perceived by customers is positively related to customer trust.
2.2.2 Price Perception
Price is the monetary cost for a customer to buy products or services. It is the critical
determinant that influences customer buying decision. Customers usually select their service
providers strongly relying on perceived price. How much consumers are willing to pay differs
due to their different needs and wants. Thus, the price perceptions to the same service
products may differ among individuals. Higher pricing perceived by consumers might
negatively influence their purchase probabilities (Peng and Wang, 2006). Price perception is
also thought to be related to price searching (Lichtenstein et al., 1993). Consumers are likely
to be attracted by perceived high-quality services at perceived competitive prices during the
searching process.
Oliver (1997) suggested that consumers often judge price relating to service quality, and

Master Thesis, Halmstad University
- 12 -
accordingly generate satisfaction or dissatisfaction, depending on the equity principle. If a
consumer perceives price as fairness, he or she is willing to conduct this transaction with the
service provider. Based on previous studies, Cheng et al. (2008) proposed that price
perception can be measured by two dimensions: one is reasonableness of prices, which
reflects the way that price is perceived by customers comparing to that of competitors.;
another is value for money, which implies the relative status of the service provider in terms
of price. In general, high-quality services are considered to cost more than low-quality
equivalents (Chitty et al., 2007)
Many researchers have pointed out that price perception influences customer satisfaction and
trust (Oliver, 1997; Peng and Wang, 2006; Cheng et al., 2008; Kim et al., 2008). Customer
often switch mainly due to some pricing issues, e.g. high price perceived, unfair or deceptive
pricing practices (Peng and Wang, 2006). Therefore, in order to increase customer satisfaction,
it is essential for service firms to actively manage their customers’ price perceptions, e.g.
carrying out attractive pricing, offering reasonable prices mix, lower prices without
decreasing quality, etc.
Based on above discussion, the following hypothesis is proposed:
H2a: Fair price perceived by customers is positively related to customer satisfaction.
H2b: Fair price perceived by customers is positively related to customer trust.
2.2.3 Brand Image
Brand concept has been frequently discussed in marketing literatures. Brand building is not
only an important driving force for marketing physical products, it is also a vital issue for
service firms. Brand image was defined by Keller (1993, p3) as the “perceptions about a
brand as reflected by the brand associations held in consumers’ memory.” It is thought as the
perception or mental picture of a brand formed and held in customers’ mind, through
customers’ response, whether rational or emotional (Dobni and Zinkhan, 1990). According to
Grönroos (2000, p.287), “A brand is not first built and then perceived by the customers.

Master Thesis, Halmstad University
- 13 -
Instead, every step in the branding process, every brand massages, is separately perceived by
customers and together add up to a brand image, which is formed in customers’ minds”.
Therefore, brand image is consequence of how a customer perceives the relationship with a
brand over time (Ibid).
The concept of relationship marketing within services displays the importance of one-to-one
relationships between businesses and customers as well as relationships between consumers
and the brands (O’Loughlin, Szmigin, and Turnbull, 2004). The development of a brand
relationship with customers is based on a series of brand contacts experienced by customers
(Grönroos, 2000). What customer perceives the brand image during such experience is critical
issue for a service firm to realize. Furthermore, customers is likely to form brand image in
mind from inexperience ways, such as word of mouth from other consumers, a company’s
reputation in public, marketing communication, and so on. A positive brand image make it
easier for a firm to convey its brand value to consumers, also generates favorable word of
mouth among people; contrarily, a negative image affect people in opposite direction; a
neutral or unfamiliar image may not cause any damage, but it does not increase the
effectiveness of communication and word of mouth either (Ibid). The more customers
consider a brand valuable, the more sales can be expected to be achieved (Ibid).
Therefore, a positive brand image is supposed to meet customer’s expectation and offer more
benefits to customer, which may lead to customer satisfaction and trust. Two hypotheses are
thus proposed as follows:
H3a: Positive brand image perceived by customers is positively related to customer satisfaction
H3b: Positive brand image perceived by customers is positively related to customer trust.
2.2.4 Value Offers
Customers will judge the value of consumption after contrasting benefits gained from
products and services with their costs (Zeithaml, 1988). Service firms provide superior value
through enhanced offers can improve customer satisfaction by increasing the customer’s

Master Thesis, Halmstad University
- 14 -
perceived benefits and reducing the sacrifice so that customer retention is improved (Ravald
and Grönroos, 1996).
Ravald and Grönroos (1996) described the effect of value-adding strategies in long term
relationship (show as figure 2.2).
Figure 2.2. The Effect of Value-Adding Strategies in a Long Term Relationship
Source: Ravald and Gröonroos (1996)
According to figure 2.2, It is clear that companies execute certain value-adding strategies can
increase customer’s perceived benefits and reducing customer’s perceived sacrifices, which in
turn stimulate customer repurchasing activities and remain in the same service provider. In a
long-term relationship, customer perceived value offered is related to both episodes and
expectations (Ravald and Grönroos , 1996). When customer’s expectations are satisfied, they
will feel safety, credibility, and security as perceived value in this relationship, which all
together increase trust and then enhance customer’s loyalty (Ibid).
Therefore, companies should concern about customer’s value from customer’s point of view,
and thoroughly understand customer’s value chain in order to be able to reduce
customer-perceived sacrifice (Wilson and Jantrania, 1995). Increasing the customer benefits
means adding something to the core product that the customer perceives important, beneficial
Increasing the benefits/ reducing the sacrifice
Stimulate repurchasing activity
Relation
Safety Credibility Security
Trust
Loyalty
Mutually profitable relationship
for supplier and customer
Episode
value
Relationship
value

Master Thesis, Halmstad University
- 15 -
and of unique value (Ibid). In telecommunication sector, it is essential for operators to offer
something valuable to customers in service interaction process, such as reward refund
activities and promotional offers, in order to gain customer satisfaction and trust, which are
expected to enhance customer loyalty.
Therefore, the following hypotheses are proposed:
H4a: The value offers perceived by customers is positively related to customer’s satisfaction.
H4b: The value offers perceived by customers is positively related to customer’s trust.
2.3 Relationship Quality
Relationship Quality (RQ) emerged from the field of Relationship Marketing (RM). Due to
the importance of relationship marketing in today’s businesses, relationship quality is
essential for assessment of relationship strength and the satisfied degree of customer needs
and expectations (Crosby & Evans & Cowles, 1990; Smith, 1998). Successful exchange
events can finally lead to an enduring buyer-seller relationship if they are properly treated
from both a buyer and a seller’s perspectives (Crosby et al., 1990). In some service contexts,
since service is invisible and heterogeneous, customers would feel high uncertainty and risk in
the transaction (Li and Ho, 2008). Whereas, good relationship quality could reduce service
uncertainty and risk for the purpose of increasing customers’ reliability to develop long-term
relationships (Crosby et al., 1990; Li and Ho, 2008). In other words, higher quality of
relationship creates association between service providers and customers, and fosters
long-term stable exchanges where both parties can gain mutual benefits (Singh, 2008).
Relationship quality does not have a widely accepted definition and measures (Singh, 2008).
Various dimensions have been used to measure relationship quality within marketing
researches. One attempt to conceptualize relationship quality has been proposed by Grosby et
al. (1990), who viewed relationship quality as a high-order construct and should contain at
least two dimensions: trust and satisfaction. Morgan and Hunt (1994) drew the

Master Thesis, Halmstad University
- 16 -
commitment-trust theory by proposing that trust and commitment are two basic constructs for
measuring relationship quality. By integrating different research viewpoint, Chakrabarty,
Whitten and Green (2007) discussed that relationship quality is measured in terms of trust,
commitment, culture, interdependence, and communication. Otherwise, Lages et al. (2005),
from a perspective of business organization rather than consumers, suggested that relationship
quality reflected the intensity of information sharing, communication quality, long-term
orientation and satisfaction with the relationship between the exporter and importer.
Although there are no consensuses regarding the components that form up relationship quality,
it is generally accepted that trust and satisfaction are two significant factors for measuring
relationship quality. Especially in the context of service markets, high relationship quality
perceived by customers is achieved through customer trusts and customer satisfaction, which
are two key points for service providers to consolidate stable long-term relationship with their
customers, and in turn achieve customer retention and loyalty behavior. Therefore, we study
relationship quality by focusing on trust and satisfaction from customers’ perspectives.
2.3.1 Trust
Trust is one of the most widely subjects across multi disciplines, including management,
economics, philosophy and psychology. Various definitions of trusts have been given in
previous literatures. One general concept of trust was provided by Mayer, Davis and
Schoorman (1995), who systematically studied organizational trust and defined trust as the
willingness of a party to be vulnerable to the actions of another party based on the expectation
that the other will perform a particular action important to the trustor, irrespective of the
ability to monitor or control the other party. Geyskens and Steenkamp (1995) also
summarized trust as the extent to which a firm believes that its exchange partner is benevolent
and honest. Doney and Cannon (1997) emphasized that trust is the perceived credibility and
benevolence. Based on above definitions, it is clear that trust is a human characteristic that is
based on assessment of one another’s personality traits (Chu, 2009), motives and behaviors
(Tian et al., 2008). In the development of trust, trustors’ expectations and perception about
trustees are involved. This is suggested that the level of trust is different significantly among

Master Thesis, Halmstad University
- 17 -
individuals based on their personal decision-making habits and characteristics (Chu, 2009).
Trust or distrust often takes place with a relationship built up. As a supplier actively makes
relationship efforts, it provides evidence to customers that the supplier can be trusted,
concerns about the customers’ interests and is willing to make sacrifices for satisfying
customers’ needs in the relationship (Liang and Wang, 2008)).
In practical business activities, therefore, the development of trust is considered to be a
critical result of establishing a long-term successful relationship between all the parties
involved. In face of complicated service markets, customers tend to behave and make
purchasing decision depending on their previous consuming experiences (Doney and Cannon,
1997), their expectations (Anderson and Narus, 1990; Mayer et al., 1995) and perception (Liu
et al., 2008; Gwinner et al., 1998; Doney and Cannon, 1997) to service providers. Investing in
long-term relationship with customers thus helps to develop customer trusts and improve the
effective quality of a relationship in order to obtain mutual interests (Anderson & Weitz,
1989). Customers with trusts in service providers’ capability would probably be willing to
commit to a service relationship for meeting their expectations (Morgan and Hunt, 1994).
Even when the environment is changing, the customers would believe that the service
provider will take customers’ interests into account instead of doing anything harmful to the
development of relationship (Liu et al., 2008).
Mayer et al. (1995) conceptualized organizational trust by proposing three core elements as:
trustee’s ability, trustee’s benevolence and trustee’s integrity. These three dimensions have
been further supported and adopted by several researchers to operate trust in their later studies.
(Lin and Ding, 2005; Aydin and Özer, 2005; Tian et al., 2008). Besides, cumulative process in
a relationship was considered to construct trust on the basis of a party’s capability of
implementing its obligations continuously (Doney and Cannon, 1997; Aydin and Özer, 2005).
Trust is considered so important to long-term relationships and enhancing customer loyalty.
Many researches have suggested that customers’ trust is a significant role in building
long-term relationship and achieving customer loyalty (Berry, 1995; Bowen and Shoemaker,
2003; Chu, 2009). With trust as a precursor, a customer becomes loyal to a firm and forms a

Master Thesis, Halmstad University
- 18 -
commitment to that firm (Bowen and Shoemaker, 2003).
Therefore, the following hypothesis is proposed:
H5: Customer trust is positively related to customer loyalty.
2.3.2 Satisfaction
Customer satisfaction has been paid much attention among theoretical literatures and practical
researches. It is also an expected outcome of implementing marketing activities, as providing
satisfying products or services to customers relates to success achieved in today’s tensely
competitive would of business.
Fornell (1992) defined satisfaction as an overall evaluation dependent on the total purchase
and consumption experience of the target product or service performance compared with
repurchase expectations over time. Oliver (1997, 1999) reviewed satisfaction as pleasurable
fulfillment which is sensed by customers in the consumption. It means that “the consumer
senses that consumption fulfills some need, desire, goal, or so forth and that this fulfillment is
pleasurable” (Oliver, 1999, p.34).
In relationship marketing literatures, customer satisfaction has also been thought to be an key
performance indicator for evaluating the quality of a relationship between service provider
and customers. Customers’ eexpectations regarding costs and benefits of the relationship
mainly depend on past experience, and satisfying experiences increase the motivation and the
likelihood that an individual stays in the relationship (Mouri, 2005).
Customer perception to products or services has been widely used to measure customer
satisfaction. According to Li (2008), five emotions perceived by customers as below are
satisfactory:
(1) Satisfaction: the products can be accepted or tolerated;
(2) Content: the products bring people with a positive and happy experience;
(3) Relieved: the products remove people’s negative state;

Master Thesis, Halmstad University
- 19 -
(4) Novelty: the products bring people with freshness and exciting;
(5) Surprise: the products make customer unexpectedly pleased.
Furthermore, customer satisfaction also has been measured relying on the phases of customer
relationship life cycle, which characterizes different stages of a customer relationship and
requires focus on specific target and customer expectation of different stages (Spath and
Fähnrich, 2007).
In general, customer satisfaction enhances the quality of relationship between customers and
service providers, and increases the repeat purchase behavior.
Therefore, the following hypothesis is proposed:
H6: Customer satisfaction is positively related to customer loyalty.
2.4 Switching Costs
Switching behavior refers to customer’s termination of a relationship with a provider (Mouri,
2005). There are many reasons that might lead to customer switching behavior. Bitner (1990)
proposed that customers change service provider due to time limitation, money constraints,
and unavailable access to information, or habit among parties. Keaveney (1995) also
suggested eight critical factors will cause switch behavior, such as attraction by competitors,
inappropriate employee response to service failures, pricing problems, core service failures,
service encounter failures, inconvenience, ethical problems, and situation changes.
Switching cost incurred when a customer switches from an existing service provider to a new
one. It is a barrier that influence customer’s decision to change service provider. Selnes (1993)
suggested that switching cost includes the technical, financial, and psychological costs that
make it difficult or costly for customers to change brands. Patterson and Smith (2003) defined
switching cost as the customer’s perception of the importance of the additional cost led to
ending up a relationship and to securing an alternative one. N’Goala (2007) argues that the

Master Thesis, Halmstad University
- 20 -
perceived costs of switching can be either monetary or non-monetary (time, effort, risk taking,
psychological nature, etc.).
Higher switching costs perceived by customers may affect their switching behaviors. In other
words, the higher switching costs perceived, the more willing of a customer to remain loyalty
with current service provider.
Therefore, the following hypothesis is proposed:
H7: High switching costs perceived by customer is positively related to customer loyalty
2.5 Customer Loyalty
Customer loyalty is the most important goal of implementing relationship marketing activities.
Oliver (1997, p.392) defined customer loyalty as a “deeply held commitment to rebury or
repatronize a preferred product or service consistently in the future, thereby causing repetitive
same-brand or same brand-set purchasing, despite situational influences and marketing efforts
having the potential to cause switching behavior” .
Customers are the driving force for profitable growth and customer loyalty can lead to
profitability (Hayes, 2008). For a customer, loyalty is a positive attitude and behavior related
to the level of re-purchasing commitment to a brand in the future (Chu, 2009). Loyal
customers are less likely to switch to a competitor solely because of price, and they even
make more purchases than non-loyal customers (Bowen and Shoemaker, 2003). Loyal
customers are also considered to be the most important assets of a company (Blackton, 1995).
It is thus essential for vendors to keep loyal customers who will contribute long-term profit to
the business organizations (Tseng, 2007). Attempt to make existing customers increase their
purchases is one way to strengthen the financial growth of a company (Hayes, 2008).
Furthermore, organization’s financial growth is dependent on a company’s ability to retain
existing customers at a faster rate than it acquires new ones (Ibid). Therefore, good managers
should understand that the road to growth runs through customers – not only attracting new
customers, but also holding on existing customers, motivating them to spend more and getting

Master Thesis, Halmstad University
- 21 -
them to recommend products and services to the other people (Keiningham et al., 2008).
Customer loyalty has been generally divided into attitudinal loyalty and behavioral (Aydin
and Özer, 2005). Attitudinal loyalty describes customer’s attitude toward loyalty by
measuring customer preference, buying intention, supplier prioritization and recommendation
willingness; on the other hand, behavioral loyalty relates to shares of purchase, purchasing
frequency (Ibid).
There are evidences suggesting that stronger relationship commitment leads to buyers’ repeat
patronage. Wulf et al. (2001) defined the construct of behavioral loyalty as a composite
measure based on a consumer’s purchasing frequency and amount spent at a retailer compared
with the amount spent at other retailers from whom the consumer buys. Morgan and Hunt
(1994) found significant relationships between the level of a buyer’s relationship commitment
and his acquiescence, propensity to leave, and cooperation, all of which can be regarded as
behavioral outcomes of relationships.
In general, customer loyalty are the final purpose that firms implement relationship marketing.
This study is seeking to investigate the impact of the above mentioned relationship marketing
tactics on relationship quality and customer loyalty, by examining the above proposed
hypothesizes.

Master Thesis, Halmstad University
- 22 -
3. METHODOLOGY
This chapter begins with an explanation of the chosen method for this research, followed by
case selection and sampling, questionnaire design and data collection, finally the reliability
and validity and statistical analysis tool will be explained.
3.1 Research Method
There are two helpful research methodologies: quantitative and qualitative. Bryman and Bell
(2003) pointed out that the connection between theory and research, epistemological
considerations and ontological considerations, quantitative and qualitative research can be
considered as two distinctive clusters of research strategy.
Figure 3.1 Fundamental differences between quantitative and qualitative research strategies
Source: Bryman and Bell (2003)
Due to the purpose of this research is to test the proposed hypothesizes, a quantitative method
is chosen in this research.
“Quantitative research can be construed as a research strategy that emphasizes quantification
Fundamental differences between quantitative and qualitative research strategies
Quantitative Qualitative
Principal orientation to the role Deductive; testing of theory Inductive; generation of theory
of theory in relation to research
Epistemological orientation Natural science model, in Interpretivism
Particular positivism
Ontological orientation Objectivism Constructionism

Master Thesis, Halmstad University
- 23 -
in the collection and analysis of data and that:
� Entails a deductive approach to the relationship between theory and research, in which
the accent is placed on the testing of theories;
� Has incorporated the practices and norms of the natural scientific model and of positivism
in particular; and
� Embodies a view of social reality as an external. Objective reality.”
(Bryman and Bell, 2003, p25)
3.2 Case selection and Sampling
In this research, the case selection is focused on the Sweden mobile telecommunication sector.
One of the reasons is that the authors are studying in Sweden, and it will be easy for the
authors to do research by focusing on Swedish industry. On the other hand, Sweden has
liberalized its telecommunication industry since 1980s and has been formally liberalized since
1993, which was three years earlier than USA, and the European common policy allowed for
an open and competitive telecommunication market five years later. So that the Sweden
telecommunication industry has already became a mature market. And the companies in this
industry want to achieve long-term competitive advantage depend on customer loyalty.
Therefore, it is make sense to choose Swedish mobile telecommunication sector to study.
A population is the whole group that the research focuses on (Jacobsen, 2002). Sample is the
segment of the population that is selected for investigation (Bryman and Bell, 2003). In
quantitative research, the need to sample is one that is almost invariably encountered. And
sampling constitutes a key step in the research process in social survey research.
Due to the research is studied from customers’ point of view, the population was expected to
involve the people who are consuming the mobile services from Swedish telecom service
provider. However, it is not possible for researchers to get in touch with a big number of
Master Thesis, Halmstad University
- 24 -
sample, as the sample size is an critical question in practice. The decision about the size of the
sample needs to consider about time and cost, the need of precision, and a variety of further
considerations. (Bryman and Bell, 2003). Due to the limit of time and costs, the population
are changed to targeted on the university students, therefore, undergraduate students and
master students who study in Halmstad University are chosen as survey sample.
3.3 Questionnaire Design and Data Collection
Yin (1994) has recognized five popular ways of collecting and analyzing empirical data in
business research. It includes experiments, survey, and analysis of archival information,
histories and case studies. The research used survey as the main method strategy to research.
In surveys, data are standardized, and comparison is easy, however it costs much time to do it.
In this survey, a self-completion questionnaire with closed questions are developed. The
self-completion questionnaire is very similar method of business research, and the research
instrument has to be especially easy to follow and its questions have to be particularly easy to
answer (Bryman and Bell, 2003). Meanwhile, whether to ask a question in an open or closed
format is one of the most significant considerations for many researchers. According to
Bryman and Bell (2003), closed questions have some advantages: it is easy to process
answers; it enhances the comparability of answers, and makes them easier to show the
relationship between variables. It is better than open question for this research.
The questionnaire was composed of two parts and total 40 statements (see appendix). The first
part is about individual characteristics with two questions by asking respondents’ gender and
the name of the mobile telecom operator they are choosing currently. The second parts
contains all eight constructs in the research model with total 38 statements. Several items on
each construct are developed and adopted from relevant literatures (show as Table 3.1). all of
the items were measured by using a five-point Likert-type response scales, anchored at 5
strongly agree and 1 strongly disagree.

Master Thesis, Halmstad University
- 25 -
Constructs Items Referred to
Service
quality
1. This mobile telecom operator follows up in a timely
manner to customer requests
2. The frontline employees of this operator are always willing
to help me.
3. This operator is consistent in providing good quality
service.
4. This operator is consistent in providing good quality
service.
5. This operator offers personalized services to meet
customers’ need.
6. This operator provides timely information when there are
new services.
Peng and Wang
(2006);
Grönroos (2000)
Parasuraman et al.
(1988);
Price
Perception
1. This operator took effective ways to help us know its
pricing policies of products and services.
2. The pricing policies of products and services from this
operator are attractive.
3. The calling rate offered by this operator is reasonable.
4. This operator is offering flexible pricing for various
services that meet my needs.
5. I will continue to stay with this operator unless the price is
significantly higher for the same service.
Cheng et al. (2008)
Peng and Wang
(2006);
Brand
Image
1. I consider that this operator’s reputation is high.
2. I have a good feeling about the operator’s social
responsibility.
3. The operator delivered a good brand image to its customers.
Aydin and Özer
(2005);
Grönroos (2000);
Ravald and Grönroos
(1996)
Value
Offered
1. The promotional offers from this operator were worth the
money.
2. It was easy to get benefits from the promotional offers.
3. The proposed rewards from this operator were what I
wanted.
4. It is highly likely that I will achieve the proposed reward.
Peng and Wang
(2006);
Zeithaml (1988);
Trust
1. This operator is reliable because it is mainly concerned with
the consumers’ interests.
2. The billing system of this operator is trustworthy.
3. The reputation of this operator is trustworthy.
4. The policies and practices of this operator are trustworthy.
5. The service process provided by this operator is secure.
Chu (2009);
Aydin and Özer,
(2005);
Tian et al.(1998);
Morgan and Hunt
(1994); etc.

Master Thesis, Halmstad University
- 26 -
Satisfaction 1. I am satisfied with the overall service quality offered by this
operator.
2. I am satisfied with the professional competence of this
operator.
3. I am satisfied with the performance of the frontline
employees of this operator.
4. I am comfortable about the relationship with this operator.
Mouri (2005);
Oliver (1997);
Fornel (1992);
etc.
Switching
cost
1. I feel that switching to a new operator causes monetary
cost.
2. To switch to a new operator; I should compare all operators
(on account of services, coverage area, billing, etc.)
3. Even if I have enough information, comparing the operators
with each other takes a lot of energy, time and effort
4. If I change my phone number, I would be concerned if
people dial my previous number but could not reach me.
5. If I switch to a new operator, I am not able to use some
services (MMS, GPrice Perceptions, WAP, etc.), until I
learn to use them
N’Goala (2007)
Aydin and Özer
(2005);
Keaveney (1995);
etc.
Customer
Loyalty
1. I intend to continue using mobile services from this
operator for a long time.
2. If I want to change a new telecom service, I am willing to
continue selecting this operator.
3. Even if another operator’ price is lower, I will go on using
this provider.
4. I am willing to say positive things about this operator to
other people.
5. I will encourage friends and relatives to use the services
offered by this operator.
6. To me, this operator clearly is able to provide the best
service.
Aydin and Özer,
(2005);
Wulf et al. (2001);
Morgan and Hunt
(1994);
etc.
Table 3.1: Constructs and Items
Questionnaires are administrated in different ways: face to face, telephone, postal, e-mail and
Web. In this study Web and e-mail questionnaires methods been chosen. This survey chose
on-line questionnaire to collect data about people’s attitude of customer loyalty and other
relationship marketing tactics.
During the survey research, there are some errors which we almost can not avoid.
Bryman and Bell (2003, pp 110-111) suggested that there are four main factors will make our

Master Thesis, Halmstad University
- 27 -
survey research error:
Figure 3.2: Four sources of error in social survey research
Source: Bryman and Bell (2004)
� Sampling error—this kind of error arises because it is extremely unlikely that one will
end up with a truly representative sample, even when probability sampling is employed
� Sampling-related error—this kind of error arises from activities or events that are related
to the sampling process and that are connected with the issue of generalizability or
external validity of findings.
� Data-collection error—this source of error includes such factors as: poor question
wording in self – completion questionnaire and so on.
� Data processing error—this kind of error arises from faulty management of data, in
particular, errors in the coding of answers.
The authors sent out e-mail to a total of 700 undergraduate students and master students
(percent males) to tell them the questionnaire’s Website and ask their help. At the end of
survey, there are 101 students answered the questionnaire. The numbers of students studied in
Halmstad University is almost 7000, thus, 101 feedbacks will lead to 10 percent margin of
error during statistical analysis which can be undertaken. Meanwhile, the data-collection error
and data processing error will be decreased when doing the Statistical Analysis.
Error
Sampling error Sampling-related
error
Data collection
error
Data processing
error

Master Thesis, Halmstad University
- 28 -
3.4 Reliability and Validity
3.4.1 Reliability
Reliability is defined as be fundamentally concerned with issues of consistency of measures.
(Bryman and Bell, 2003) There are three prominent factors related to considering whether a
measure is reliability: stability, internal reliability and inter-observer consistency. (Ibid). In
this study, internal reliability will be considered. Bryman and Bell (2003) suggested that a
multiple-item measure in which each answers to each questions are aggregated to form an
overall score, we need to be sure that all our indicators are related to each other. It can be test
use Cronbach’s alpha method. The result of 0.7 and above implies an acceptable level of
internal reliability.
3.4.2 Validity
Validity is defined as how much any measuring instrument measures what it is intended to
measure. Bryman and Bell (2003) also suggested that the important issue of measurement
validity relates to whether measures of concepts really measure the concept.
“Validity refers to the issue of whether an indicator (or set of indicators) that is devised to
gauge a concept really measures that concept. Several ways of establishing validity are: face
validity; concurrent validity; predictive validity; construct validity; and convergent validity.”
(Bryman and Bell, 2003, p 77). In this thesis, construct validity has been used. This study
deduces hypotheses from a theory that is relevant to the concept.
3.5 Statistical Analysis
The results of the survey were analyzed using descriptive statistics. There are many basic
techniques for analyzing quantitative data. In this study, the research chose the software of
SPSS for Windows to analyze the exploratory factors. SPSS for Windows is probably the
most widely used computer software for analysis of quantitative data for social scientists.

Master Thesis, Halmstad University
- 29 -
SPSS, which originally was short for Statistical Package for the Social Sciences, has been in
existence since the mid-1960’s and over the years has undergone many revisions, particularly
since the arrival of personal computers (Bryman & Bell, 2003 ). It is easy for the research to
operate. Given the scales of items for a construct, the Cronbach’s alpha’s are calculated to
assess the reliability of those items. For construct with alpha under certain threshold (0.7 in
this report), items within each construct are to be checked in order to ensure that the items
have high correlations. After reliability confirmed, the summated averages of the items in
each construct will be studied further. Correlation matrix is calculated to show the pair-wise
correlations between constructs, which provides useful but limited information about our
hypotheses testing. To account for the effects of other construct, multivariate linear regression
is applied for the hypotheses in two main stages, one for the left part of Figure 1.1, and one
for the right. These measures provide more information on the correlation structure between
constructs and therefore facilitate a further step in hypotheses testing.

Master Thesis, Halmstad University
- 30 -
4. EMPIRICAL DATA AND DATA ANALYSIS
This chapter will present the empirical data collected from the survey, the data will be
presented on table with SPSS data processing results, followed by the data analysis which are
combined with theories and empirical data.
4.1 Empirical Data
4.1.1 Empirical Data Reliability Testing
In this survey, there are total 101 feedbacks from sample population. All the feedbacks are
complete, i.e. no missing data in the questionnaires. For the eight constructs that this study
focused on, it is necessary to measure internal reliability of each construct with its different
number of items. To test the internal reliability, the Cronbach’s alpha are calculated for items
designed for the same construct. If the items are multi-dimensional, Cronbach’s alpha will
generally be low, in which case, it can either make use of factor analysis or the correlation
matrix of the items to select a subset of items that tend to be unidimensional. For the 8
constructs we have, 7 of them have Cronbach’s alphas larger than 0.7 (a level considered
“acceptable” in most social science research) except for Switching Cost (Table 4.1).
Table 4.1 Cronbach’s alpha for constructs
Constructs Cronbach’s Alpha Number of Items
Service Quality 0.791 6
Price Perception 0.766 5
Brand Image 0.798 3
Value Offers 0.791 4
Trust 0.848 5
Satisfaction 0.808 4
Switching Costs 0.486 5
Customer Loyalty 0.850 6

Master Thesis, Halmstad University
- 31 -
Due to the Cronbach’s alphas of Switching Costs is only 0.486 (< 0.7), it indicates that the
internal reliability/consistency of this construct is low and there may be some items that are
multi-dimensional. In order to select a subset of items that tend to have internal consistency,
the correlation matrix for the 5 items of Switching Cost is then calculated (the result showed
as Table 4.2). The fifth item (SC5) seems to be uncorrelated with any other item within this
construct (the correlation coefficients are not significant). Therefore, SC5 is removed from the
analysis, the lack of correlations of SC5 could be due to the fact that the statement does not
capture the characteristics of switch cost. After the removal, the Cronbach’s alpha for
Switching Costs with 4 items increase to 0.529 (show as Table 4.3), which is still a little low.
Table 4.2 Pearson’s correlations between items of Switching Cost
Items SC1 SC2 SC3 SC4 SC5
SC1 1 .297(**) .107 .195 .137
SC2 .297(**) 1 .094 .288(**) .012
SC3 .107 .094 1 .334(**) .163
SC4 .195 .288(**) .334(**) 1 -.018
SC5 .137 .012 .163 -.018 1
Note: ** Correlation is significant at the 0.01 level (2-tailed).
SC = Switching Costs
Table 4.3 Cronbach’s alpha for new switching costss
Constructs Cronbach’s Alpha Number of Items
New Switching Costs 0.529 4
4.1.2 Empirical Data of Correlation Analysis
After checking the reliability of the items, it needs to take the averaged scores of items for
each construct as the final score upon which we conduct further analysis. Table 4.4 shows the
means, standard deviations for all the constructs. Five of the eight constructs have scales

Master Thesis, Halmstad University
- 32 -
mean that are within half of the scale of the center of scales (3) except for (Service Quality,
Value and Customer Loyalty). The sample standard deviations of Brand Image (0.779) and
Customer Loyalty (0.724) are relatively higher, while the others range from 0.605 to 0.696
(mean 0.665). Many of the constructs are negatively skew, the non-normality could be a sign
of inter-correlations.
Table 4.4 Summary of descriptive statistics of constructs
Constructs Mean Std. Deviation Skewness*
Service Quality 3.4785 .60812 .057
Price Perception 3.6535 .69102 -.149
Brand Image 3.5578 .77904 -.727
Value Offers 3.3540 .62676 .066
Trust 3.6574 .66051 -.486
Satisfaction 3.5396 .60491 .135
New Switching Costs 3.7574 .69593 -.743
Customer Loyalty 3.3845 .72409 -.576
Note: * Standard errors of skewness 0.240
From the correlation matrix in Table 4.5, preliminary tests of the hypotheses were implicitly
performed. Almost all the variables are positively correlated to each other at the 0.01 level
except for the pair of Value Offers and Switching Cost. Meanwhile, the correlations between
Switching Cost and other variables are weaker if we look at the scale of correlation more
closely, ranging from (0.183 to 0.450, while the correlations between other pairs are at least
0.392 (Brand Image and Value Offers), ranging from 0.392 to 0.750. Pair-wise correlations
provide a rough view of the relationships between these different factors. To investigate the
structure of the hypotheses in a more sophisticated way, it is better to fit the corresponding
(multivariate) linear models by accounting for the effects of other constructs.

Master Thesis, Halmstad University
- 33 -
Table 4.5 Pearson’s correlations between constructs
SQ PR BI VA TR SA New SC CL
SQ 1 .507 (**) .594 (**) .444 (**) .616 (**) .682 (**) .301 (**) .628 (**)
PR .507 (**) 1 .551 (**) .456 (**) .601 (**) .600 (**) .346 (**) .585 (**)
BI .594 (**) .551 (**) 1 .392 (**) .742 (**) .602 (**) .344 (**) .730 (**)
VA .444 (**) .456 (**) .392 (**) 1 .438 (**) .467 (**) .183 .501 (**)
TR .616 (**) .601 (**) .742 (**) .438 (**) 1 .600 (**) .450 (**) .701 (**)
SA .682 (**) .600 (**) .602 (**) .467 (**) .600 (**) 1 .314 (**) .750 (**)
New SC .301 (**) .346 (**) .344 (**) .183 .450 (**) .314 (**) 1 .375 (**)
CL .628 (**) .585 **) .730 (**) .501 (**) .701 (**) .750 (**) .375 (**) 1
Note: ** Correlation is significant at the 0.01 level (2-tailed).
SQ = Service Quality; PR = Price Perception; BI = Brand Image; VA = Value Offers;
TR = Trust; SA = Satisfaction; New SC = New Switching Costs; CL = Customer Loyalty.
4.1.3 Testing the hypothesized model
4.1.3.1 Relationship Marketing Tactics (Hypothesis 1a, 1b, 2a, 2b, 3a, 3b, 4a
and 4b)
The hypothesized analytical model in Figure 1.1 was tested with multivariate linear regression.
For the first stage, we adjust a multivariate model to test hypothesis H1a, H1b, H2a, H2b, H3a,
H3b, H4a and H4b.
H1a: High service quality perceived by customers is positively related to customer satisfaction.
H1b: High service quality perceived by customers is positively related to customer trust.
H2a: Fair price perceived by customers is positively related to customer satisfaction.
H2b: Fair price perceived by customers is positively related to customer trust.
H3a: Positive brand image perceived by customers is positively related to customer satisfaction

Master Thesis, Halmstad University
- 34 -
H3b: Positive brand image perceived by customers is positively related to customer trust.
H4a: The value offers perceived by customers is positively related to customer’s satisfaction.
H4b: The value offers perceived by customers is positively related to customer’s trust.
In table 4.6, we chose Service Quality, Brand Image, Price Perception, Value Offers as
independent variables; Switching Cost, Satisfaction, and Trust as dependent variables to test if
the four relationship marketing tactics, which be mentioned previous, are positively correlated
to customer satisfaction, trust and switching cost.
Table 4.6 Parameter estimates for Service Quality, Brand Image, Price Perception, Value Offers to Switching Cost,
Satisfaction, Trust
Dependent Variable Parameter B Std. Error t Sig.
Satisfaction Intercept .515 .275 1.874 .064
Service Quality .397 .087 4.568 .000
Price Perception .216 .074 2.910 .004
Brand Image .146 .069 2.129 .036
Value Offers .100 .075 1.338 .184
Trust Intercept .506 .281 1.800 .075
Service Quality .207 .089 2.335 .022
Price Perception .195 .076 2.562 .012
Brand Image .415 .070 5.915 .000
Value Offers .073 .076 .950 .344
New Switching Costs Intercept 2.120 .448 4.733 .000
Service Quality .114 .142 .802 .424
Price Perception .210 .121 1.735 .086
Brand Image .162 .112 1.446 .151
Value Offers -.030 .122 -.247 .805
In Table 4.6, the statistics of multivariate tests provide the information that the regression of
switching cost, none of the independent variables have coefficients significantly different than
0 (significance levels ranging from (0.086 to 0.424). Meanwhile, given the independent
variables, in the model, only a small amount of sum of squares (Type III) are explained for SC:
7.73 versus 21.29 and 27.61(in Table 4.8), which also support the model in Figure 1.1 that
switching cost is not affected by the service quality, brand image, price and values.

Master Thesis, Halmstad University
- 35 -
Table 4.7 Tests of Between-Subjects Effects for the rival model
Source Dependent Variable Type III Sum
of Squares df Mean Square F Sig.
Satisfaction 21.287 (a) 4 5.322 33.382 .000
Trust 27.615 (b) 4 6.904 41.390 .000 Corrected
Model
New Switching Costs 7.725 (c) 4 1.931 4.554 .002
Note: a R Squared = .582 (Adjusted R Squared = .564) ; b R Squared = .633 (Adjusted R Squared = .618)
c R Squared = .159 (Adjusted R Squared = .124)
Table 4.8 Residual SSCP Matrix
Satisfaction Trust Switching Costs
Correlation Satisfaction 1.000 .054 .042
Trust .054 1.000 .255
New Switching Cost .042 .255 1.000
Note: Based on Type III Sum of Squares
To study the effects of Service Quality, Price Perception, Brand Image, Value Offers on Trust
and Satisfaction, adjust the model again without Switching Costs. In Table 4.9, the statistics
of multivariate tests provide the information on the overall effects of an independent variable
to dependent variables (Trust and Satisfaction).
Table 4.9 Multivariate Tests(b)
Effect Value F Hypothesis df Error df Sig.
Intercept Pillai's Trace .063 3.170(a) 2.000 95.000 .046
Wilks' Lambda .937 3.170(a) 2.000 95.000 .046
Pillai's Trace .208 12.492(a) 2.000 95.000 .000 Service
Quality Wilks' Lambda .792 12.492(a) 2.000 95.000 .000
Pillai's Trace .129 7.063(a) 2.000 95.000 .001 Price
Perception
Wilks' Lambda .871 7.063(a) 2.000 95.000 .001
Pillai's Trace .285 18.938(a) 2.000 95.000 .000 Brand
Image
Wilks' Lambda .715 18.938(a) 2.000 95.000 .000

Master Thesis, Halmstad University
- 36 -
Pillai's Trace .026 1.269(a) 2.000 95.000 .286 Value
Offers Wilks' Lambda .974 1.269(a) 2.000 95.000 .286
Note: a Exact statistic
b Design: Intercept+Service Quality+Price Perception+Brand Image+Value Offers
Table 4.10 Parameter Estimates
Dependent Variable Parameter B Std. Error t Sig.
Satisfaction Intercept .515 .275 1.874 .064
Service Quality .397 .087 4.568 .000
Price Perception .216 .074 2.910 .004
Brand Image .146 .069 2.129 .036
Value Offers .100 .075 1.338 .184
Trust Intercept .506 .281 1.800 .075
Service Quality .207 .089 2.335 .022
Price Perception .195 .076 2.562 .012
Brand Image .415 .070 5.915 .000
Value Offers .073 .076 .950 .344
Table 4.11 Residual SSCP Matrix
Satisfaction Trust
Correlation Satisfaction 1.000 .054
Trust .054 1.000
Note: Based on Type III Sum of Squares
Table 4.12 Bartlett's Test of Sphericity (a)
Likelihood Ratio .842
Approx. Chi-Square .323
df 2
Sig. .851
Note: (1)Tests the null hypothesis that the residual covariance matrix is proportional to an identity matrix.
(2) a Design: Intercept+Service Quality+Price Perception+Brand Image+Value Offers

Master Thesis, Halmstad University
- 37 -
In Table 4.10, the variables of service quality, price perception and brand image are
significantly affecting the dependent variables, except value offers. So in order to try to see
whether value directly affects the customer loyalty via the univariate linear model with
Customer Loyalty as dependent variable and Satisfaction, Trust, Value Offers as independent
variables (since from the correlation matrix, Value Offers has the largest correlation with
Customer Loyalty among others). However, the parameter for Value Offers in that model is
again not significant.(Table 4.13)
Table 4.13 Parameter Estimates
Dependent Variable: Customer Loyalty
Parameter B Std. Error t Sig. 95% Confidence Interval
Intercept -.552 .291 -1.898 .061 -1.130 .025
Satisfaction .569 .091 6.272 .000 .389 .750
Trust .398 .082 4.867 .000 .236 .561
Value Offers .139 .078 1.776 .079 -.016 .293
4.1.3.2 Relationship Quality and Switching Cost (Hypothesis5, H6 and H7)
For the second stage, fit the model with Switching Cost, Satisfaction and Trust as independent
variables and Customer Loyalty as dependent variable to study the hypothetical structure on
the right of Figure 1.1.
H5: Customer trust is positively related to customer loyalty.
H6: Customer satisfaction is positively related to customer loyalty.
H7: High switching costs perceived by customer is positively related to customer loyalty..
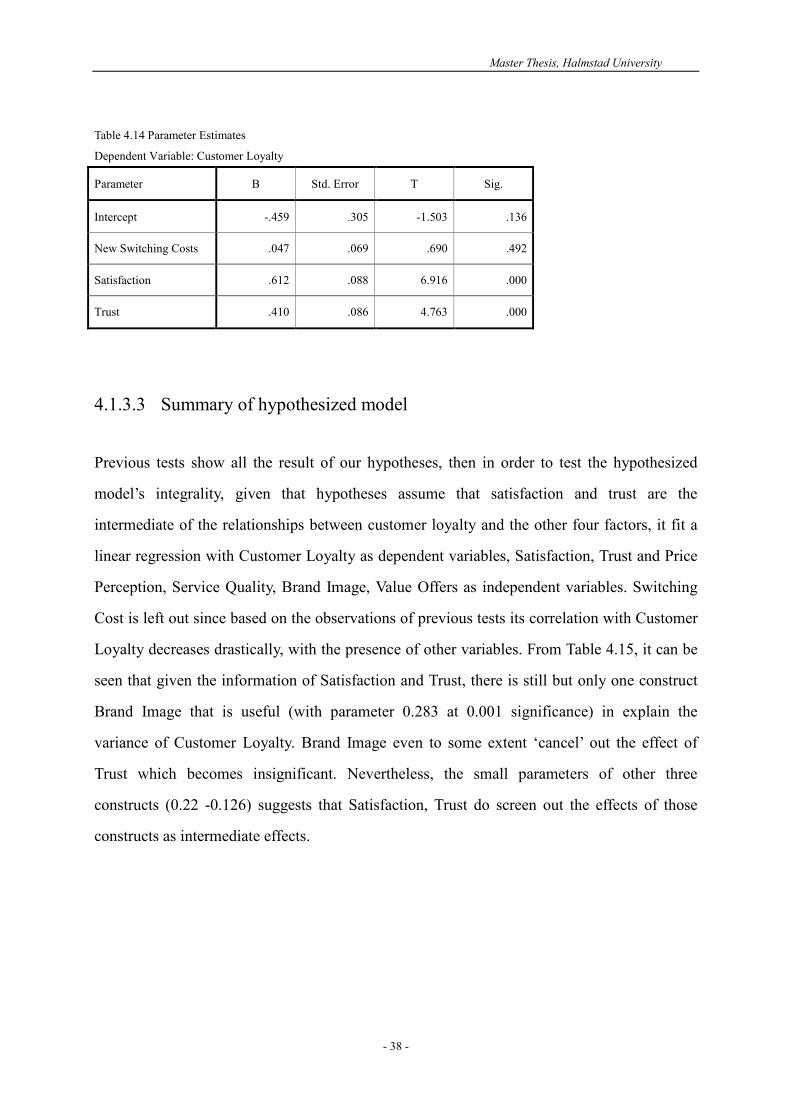
Master Thesis, Halmstad University
- 38 -
Table 4.14 Parameter Estimates
Dependent Variable: Customer Loyalty
Parameter B Std. Error T Sig.
Intercept -.459 .305 -1.503 .136
New Switching Costs .047 .069 .690 .492
Satisfaction .612 .088 6.916 .000
Trust .410 .086 4.763 .000
4.1.3.3 Summary of hypothesized model
Previous tests show all the result of our hypotheses, then in order to test the hypothesized
model’s integrality, given that hypotheses assume that satisfaction and trust are the
intermediate of the relationships between customer loyalty and the other four factors, it fit a
linear regression with Customer Loyalty as dependent variables, Satisfaction, Trust and Price
Perception, Service Quality, Brand Image, Value Offers as independent variables. Switching
Cost is left out since based on the observations of previous tests its correlation with Customer
Loyalty decreases drastically, with the presence of other variables. From Table 4.15, it can be
seen that given the information of Satisfaction and Trust, there is still but only one construct
Brand Image that is useful (with parameter 0.283 at 0.001 significance) in explain the
variance of Customer Loyalty. Brand Image even to some extent ‘cancel’ out the effect of
Trust which becomes insignificant. Nevertheless, the small parameters of other three
constructs (0.22 -0.126) suggests that Satisfaction, Trust do screen out the effects of those
constructs as intermediate effects.

Master Thesis, Halmstad University
- 39 -
Table 4.15 Tests of Between-Subjects Effects
Dependent Variable: Customer Loyalty
Source Type III Sum of
Squares df Mean Square F Sig.
Corrected Model 37.298(a) 6 6.216 38.616 .000
Intercept .558 1 .558 3.467 .066
Service Quality .008 1 .008 .053 .819
Price Perception .017 1 .017 .108 .743
Brand Image 1.940 1 1.940 12.051 .001
Value Offers .426 1 .426 2.647 .107
Trust .554 1 .554 3.440 .067
Satisfaction 3.271 1 3.271 20.319 .000
Error 15.132 94 .161
Total 1209.361 101
Corrected Total 52.430 100
Note: a R Squared = .711 (Adjusted R Squared = .693)
Table 4.16 Parameter Estimates
Dependent Variable: Customer Loyalty
Parameter B Std. Error t Sig.
Intercept -.531 .285 -1.862 .066
Service Quality .022 .098 .229 .819
Price Perception .026 .080 .329 .743
Brand Image .283 .081 3.471 .001
Value Offers .124 .076 1.627 .107
Trust .186 .100 1.855 .067
Satisfaction .463 .103 4.508 .000
As discussed previously, brand image has potential to be another intermediate. One more
regression was fitted for Service Quality, Price Perception, Value Offers and Brand Image

Master Thesis, Halmstad University
- 40 -
(dependent variables). Both the parameters of Service Quality and Price Perception are
significantly larger than 0, indicating that Brand Image could indeed be another intermediate
variable.
Table 4.17 Parameter Estimates
Dependent Variable: Brand Image
Parameter B Std. Error t Sig.
Intercept .174 .407 .427 .670
Service Quality .518 .118 4.404 .000
Price Perception .354 .104 3.404 .001
Value Offers .086 .110 .780 .437
4.2 Data Analysis
All empirical data gave the legible and specific results of the analytical model. In this part, the
analytical model will be confronted with both empirical data and the theoretical framework in
order to analyze all the hypotheses and achieve the research purpose.
4.2.1 The impact of the four tactics (Hypothesis H1a, H1b, H2a, H2b,
H3a, H3b, H4a and H4b)
From the estimated Table 4.6, it shows that for the regression of Switching Cost, none of the
independent variables have coefficients significantly different than 0 (significance levels
ranging from (0.086 to 0.424). Meanwhile, in Table 4.8 (Switching Cost: 7.73 versus 21.29
and 27.61) also support the model (in figure 1.1 ) that switching cost is not affected by the
service quality, brand image, price perception and value offers.
In the hypotheses, service quality, price, brand image and value affect customer loyalty
indirectly via the customer’s satisfaction and trust for the mobile service. Through our study,

Master Thesis, Halmstad University
- 41 -
in Table 4.10, it is clear that service quality, price and brand image all have positive effects on
satisfaction and trust. More important, satisfaction and trust seem to be uncorrelated from
each other given the information about service quality, price and brand image. The positive
correlations between service quality (trust) and loyalty are also supported by the data. In
addition, the residual correlation structure and Barlette’s test in Table 4.11 and 4.12 suggest
that Service Quality, Price Perception and Brand Image completely almost completely explain
the possible correlations between Satisfaction and Trust.
However, value does not provide much useful information as it is in the hypotheses (H4a,
H4b). Table 4.9 pointed out that Value Offers (significance 0.286) is not significantly affecting
the dependent variables, given Service Quality, Price Perception and Brand Image. From
Table 4.10, we can look more closely on the effects of independent variables separately on
dependent variables. At 5% significance level, for Satisfaction, the parameters of Service
Quality, Price Perception, Brand Image are all different from 0 and the same for Trust.
Ravald and Grönroos (1996) claimed that value is an important element of relationship
marketing, and one of the most successful relationship marketing strategies is the ability to
provide superior value to customers. Customer selects a service operator which can supply
value offers to them. Looking back the empirical data about the hypotheses H4a and H4b of
value offers, the parameters for value offers are not significant (Sig. 0.344 and 0.184).
Actually, it not means value offers are not important for customer satisfaction and trust, even
customer loyalty. The results of this empirical data are due to customers’ assessment about the
value offers of a operator depends on their harvest. However, the language that the operators
used in Sweden mobile telecom market is Swedish. Some of the students who complete this
questionnaire are international students, so that many of them can not obtain the information
about the value offers.
4.2.2 The impact of relationship quality (Hypothesis 5 and Hypothesis 6)
Customer always prefers to buy a service that they trust. Many early researches have
underscored that trust and its implication is an important factor to drive profitable, long-term

Master Thesis, Halmstad University
- 42 -
customer relationships (Garbarino and Johnson, 1999).
A high customer satisfaction level leads to a high customer loyalty level that helps firms
realizing economic success in terms of profitability, market share and investment return
(Reichheld, 1996).
Go back to see the Table 4.14, both Satisfaction and Trust have parameters significantly larger
than 0, indicating that there exists positive relationships between satisfaction and customer
loyalty as well as trust and, which are consistent with our hypotheses.
According to above, operators in Sweden mobile telecommunication industry want to obtain
long-term relationship with customers must to adopt different tactics (high service quality,
equal price, value offers and building good brand image) to get customers’ trust and
satisfaction.
4.2.3 The impact of switching costs (Hypothesis 7)
Many researches claimed that switching costs is an important factors influence customer
loyalty. However, according to this research empirical data on the Table 4.5 and 4.14, it shows
that even though switching cost and customer loyalty have pair-wise correlations, their
correlations decrease (not significant) with the presence of other constructs (satisfaction and
trust) in Sweden mobile telecom industry. On the one hand, the products of mobile telecom
industry are easy to use, so that the learning cost has less influence on choosing the operators.
On the other hand, Sweden is high wealthy country, compared the incoming and the
transaction cost on switch a new mobile telecom operator, the impact of switching costs on
customer loyalty is unapparent. However, it is very different from other developing countries.
In the developing country, many surveys show that switching costs cover the impact of
customer loyalty comparing the presence of satisfaction.

Master Thesis, Halmstad University
- 43 -
5. CONCLUSION, IMPLICATION AND LIMITATION
In this chapter a conclusion for the whole study will be made, then the implication both for
theoretical academics and practical marketing will be discussed, finally the limitation of this
study will be pointed out.
5.1 Conclusion
Retaining customers in the service industry has become a major objective of relationship
marketing. Relationship marketing tactics are considered to be essential for building
long-term relationship with customers in order to achieve mutual benefits of all parties.
Although relationship marketing tactics has been widely implemented by service providers,
customers still tend to switch to competitor.
Therefore, this study was conducted to exam the impact of relationship marketing tactics
(service quality, price perception, value offered and brand image) on relationship quality (trust
and satisfaction), and in turn effect the customer loyalty within on Sweden mobile
telecommunication industries. The findings of the survey can be summarized as below:
� The four Relationship marketing tactics are positively related to relationship quality.
Among the tactics, value offered tactic show lowest relationship with customer trust and
satisfaction. This implied that the value-adding activities implemented by the telecom
service providers, such as reward refund, are not effectively perceived by students group.
� Relationship quality (trust and satisfaction) are positively related to loyalty. This result
also provide empirical evidence supporting previous theories that higher level of trust and
satisfaction perceived by customers, the higher level of customer loyalty achieved by
service providers.
� Switching cost however does not show much correlation with customer loyalty, as well as
customer trust and satisfaction. Different from other previous evidence in other industries,

Master Thesis, Halmstad University
- 44 -
switching costs in this study is proved to be less important in affecting customer loyalty
in Sweden mobile telecom industries, due to the fact that the comparatively low
switching cost perceived by consumers is not taken into account when customers making
decision of consumption.
� Brand image tactic especially turns out to directly lead to customer loyalty, regardless of
the influence of mediated factors as trust and satisfaction. It reveals that brand image tend
to also be an independent variable influenced by other factors.
5.2 Implications
This research provides both theory development for academics and practical implication for
marketing managements.
Theoretical implications
Based on previous theories and researches regarding relationship marketing and its outcomes,
this study shows clear links among relationship marketing tactics, relationship quality and
customer loyalty, which helps readers deeply understand the relationship and interaction
between these three fields.
The findings support the view points that: relationship marketing tactics can enhance the
quality of a buyer-seller relationship and in turn increase customer loyalty; customer trust and
satisfaction as the quality of a partnership relationship are not only the desired outcomes of
relationship marketing tactics but also the antecedents of customer loyalty; customer loyalty
are the final goal of developing a relationship with customers by executing relationship
marketing tactics.
The study also explore that switching costs is not always significant in influence customer
loyalty as well as trust and satisfaction. In the case of Sweden mobile telecom industry,
consumers probably do not much care about switching cost in the decision of staying with
current render or switching to another. This suggests that the impact of switching cost on
customer loyalty among different industries.

Master Thesis, Halmstad University
- 45 -
Practical implications
The findings of this research also provider important evidence for managers who take charge
of relationship marketing tactics. It is helpful for marketers understand the effectiveness of
relationship marketing tactics from consumer’s perspective.
Although many relationship tactics have potential for developing customer trust, satisfaction
and loyalty, some tactics are more sensitive than others. Marketers should put their efforts into
implementing more effective relationship marketing tactics, in order to enhance customer
perceived trust, satisfaction and loyalty. In this case, value-adding tactic are less effective than
service quality, price tactic and brand image tactic for building customer trust and satisfaction.
This implied that the consumer might be not satisfied with or not sensitive to some
value-adding promotional activities. Therefore, the mobile service providers should consider
to improving the way of interaction with consumers. For example, offering more attractive
reward, using English rather than Swedish language in promotion activities to communicate
with more foreigners.
It is also essential for service providers to realize importance of relationship quality and
customers loyalty for practical business. A higher quality of a relationship might lead to a
higher level of customer loyalty, which makes vendors profit more.
5.3 Limitations
This study investigates tactics influencing customer satisfaction and trust which will bring
customer loyalty, using the survey research method. Although it builds up a new test model
which based on theoretical knowledge, it also has some limitations and further research
direction as follow:
� In this research, it investigates some important tactics which influence customer loyalty
on Swedish telecommunication industry. However, Bansal, Taylor and James (2005) also
pointed out the impact of the relationship marketing tactics — “push effects”(quality,
satisfaction, value, trust, price perception, commitment), the “pull effects”(alternative
attractiveness) and the “moor effects”(attitude towards switching, subjective norms,
Master Thesis, Halmstad University
- 46 -
switching costs, prior switching experience, variety seeking) — on retaining customers.
There are others important tactics such as commitment and customer behavior, which
could influence customer loyalty, have not been discussed in this study. Thus further
research needs to contain more desirable tactics, in order to gain better insight.
� In this research, it uses the survey research method. The research make sampling for the
undergraduate students and master students who study in Halmstad University in Sweden.
Inevitably, the survey findings will not be generalized cross other group of population. It
will bring limitation to complete a deeper research about the impact of customer
relationship marketing tactics on customer loyalty. Further research could expand the
survey in order to reduce the sample errors.
� The items for each construct stated in the questionnaire were adapted from previous
articles or developed by the researchers without pre-testing for reliability and validity
before conducting the research. Some of the items might be ambiguous or hard to
understand, this would cause invalid data collected, which definitely influenced the
research results.

Master Thesis, Halmstad University
- 47 -
Reference
1. Andaleeb, S. S. (1996). An Experimental Investigation of Satisfaction and Commitment in Marketing Channels: The Role of Trust and Dependence, Journal of Retailing, Vol.72, No.1, pp.77-93, ISSN 0022-4359.
2. Anderson, E. and Weitz, B. (1989). Determinants of continuity in conventional industrial channel dyads, Marketing Science, Vol.8, No.4, pp.310-323.
3. Anderson, J.C. and Narus, J.A. (1990). A model of distributor firm and manufacturer firm working relationships, Journal of Marketing, Vol.54, No.1, pp.42-58.
4. Aydin, S. and Özer, G. (2005). The analysis of antecedents of customer loyalty in the Turkish mobile telecommunication Market, European Journal of Marketing, Vol.39, No.7/8, pp.910-925..
5. Bansal, H. S., Taylor, S.F. and St. James, Y. (2005). Migrating to New Service Providers: Toward a Unifying Framework of Consumers Switching Behaviors, Journal of the Academy of Marketing Science, Vol. 33, No. 1, pp. 96-115
6. Berry, L. L. (1995). Relationship marketing of service: Growing Interest, emerging perspective, Journal of the Academy of Marketing Science, Vol.23, No.4, pp. 236-245.
7. Bitner, M.J.; Booms, B.H. andTetreault, M. (1990). The service encounter: diagnosing
favorable and unfavorable incidents, Journal of Marketing, Vol.54, No.1, pp.71-84.
8. Bryman, A. and Bell, E. (2003). Business Research Methods,. New York:Oxford University Press Inc.
9. Bowen, J. T. and Shoemaker, S. (2003). Loyalty: A Strategic Commitment, Cornell Hotel and Restaurant Administration Quarterly, Oct-Dec 2003, 44, 5/6, pp.31-46.
10. Chakrabarty, S.; Whitten, D. and Green, K. (2007). Understanding Service Quality and Relationship Quality in IS Outsourcing: Clinet Orientation & Promotion, Project Management Effectiveness, and the Task-Technology-Structure Fit, Journal of Computer
Information Systems, Vol. 48, No.2, pp.1-15.
11. Cheng, T. C. E.; Lai, L. C. F. and Yeung, A. C. L. (2008), “The Driving Forces of Customer Loyalty: A Study of Internet Service Providers in Hong Kong”, International Journal of E-Business Research, Vol. 4, No. 4, pp. 26-42.
12. Chitty, Bill; Ward, Steven; and Chua, Christina (2007), “An application of the ECSI model as a predictor of satisfaction and loyalty for backpacker hostels”, Marketing

Master Thesis, Halmstad University
- 48 -
Intelligence and Planning, Vol.25, No.6, pp.563-580.
13. Chu, Kuo-Ming. (2009). The Construction Model of Customer Trust, Perceived Value and Customer Loyalty, The Journal of American Academy of Business, Cambridge,
Vol.14, No.2, pp.98-103.
14. Crosby, L. A.; Evans, K. R. and Cowles, D. (1990). Relationship Quality in Services Selling: An Interpersonal Infulence Perspective, Journal of Marketing, Vol.54, No.3, pp.68-81.
15. Dobni, D.& Zinkhan, G. M.(1990). In search of brand image: a foundation analysis, Advances in Consumer Research, Vol.17(1), pp. 110-119
16. Doney, P. and Cannon, J. P. (1997). An examination of the nature of trust in buyer seller
relationships, Journal of Marketing, Vol.61, No.2, pp.35-51.
17. Egan, J. (2001). Relationship Marketing: Exploring Relational Strategies in Marketing, Pearson Education Limited, ISBN 0273-64612-5.
18. Fornell, C. (1992). A national customer satisfaction barometer: The Swedish experience. Journal of Marketing, Vol. 56, No.1, pp.6-21.
19. Garbarino, E. and Mark, S. J. (1990). The different roles of satisfaction, trust and
commitment in customer relationships, Journal of Marketing, Vol. 63 (April), pp. 70-87
20. Geyskens, Inge; Steenkamp, Jan-Benedict E.M. and Kumar, Nirmalya (1998). Generalizations about trust in marketing channel relationships using meta-analysis, International Journal of Research in Marketing, Vol.15 (July), pp.223-248.
21. Gilbert, D.F. Buttle, ed. (1996). Airlines, In Relationship Marketing: Theory and Practice, London: Paul Chapman Inc.
22. Grönroos, C. (2000), “Service Management and Marketing: A Customer Relationship Management Approach”, John Wiley & Sons, Ltd., (Second edition). ISBN 0-471-72034-8.
23. Grönroos, C. (2004). The Relationship Marketing Process: Communication, Interaction, Dialogue, Value, The Journal of Business & Industrial Marketing, 19 (2), 99-113.
24. Gwinner, K.P., Gremler, D.D. and Bitner, M.J. (1998). Relational benefits in services industries: the customer’s perspective, Journal of the Academy of Marketing Science, Vol.26, No.2, pp.101-114.
25. Hayes, B. E. (2008). The True Test of Loyalty, Quality Progress, 41, 6, pp.20-26.
26. Hougaard, S. and Bjerre, M. (2002). Strategic Relationship Marketing, Samfundslitteratur Press. ISBN 87-593-0840-0.
27. Ismail, I.; Haron, H.; Ibrahim, D. N.; and Isa, S. M. (2006), “Service quality, client satisfaction and loyalty towards audit firms: perceptions of Malaysian public listed

Master Thesis, Halmstad University
- 49 -
companies”, Managerial Auditing Journal, Vol.21, No.7, pp.738-756.
28. Keaveney, S.M. (1995). Customer switching behavior in service industries: an explorator
study, Journal of Marketing, Vol.59, No.2, pp.71-82.
29. Keiningham, T. L.; Aksoy, L.; Cooil, B. and Andreassen, T. W. (2008). Linking Customer Loyalty to Growth, MITSloan Management Review, Vol.49, No.4, pp.50-57.
30. Keller, K. (1993). Conceptualizing, measuring, managing customer-based brand equity, J Mark, Vol.57(1), pp 1-22.
31. Kim, C. S.; Zhao, W. H. and Yang, K. H. (2008), “An Empirical Study on the Integrated Framework of e-CRM in Online Shopping: Evaluating the Relationships Among Perceived Value, Satisfaction, and Trust Based on Customers’ Perspectives”, Journal of
Electronic Commerce in Organizations, Vol.6, No.3, pp.1-19.
32. Lages, C.; Lages, C. R. and Lages, L. F. (2005). The RELQUAL scale: a measure of relationship quality in export market ventures, Journal of Business Research, Vol.58, pp.1040-1048.
33. Leong, Y. P. & Qing, W. (2006). Impact of relationship marketing tactics (RMTs) on switchers and stayers in a competitive service industry, Journal of Marketing Management, Vol.22, pp. 25-29
34. Li Liu (2008). Study of the relationship between customer satisfaction and loyalty in telecom enterprise, 2008 IEEE International Conference on Service Operations and Logistics, and Informatics, Vol. 1, pp. 896-901
35. Li, Ye-Chuen and Ho, Yung-Ching (2008). Discuss the Impact of Customer Interaction on Customer Relationship in Medical Service, The Business Review, Cambridge, Vol.11, No.1, pp.152-158.
36. Liang, Chiung-Ju and Wang, Wen-hung (2008). Do Loyal and More Involved Customers Reciprocate Retailer’s Relationship Efforts?, Journal of Services Research, Vol.8, No.1, pp.63-90.
37. Lichtenstein, D. R., Ridgway, N. M. and Netemeyer, R.G..(1993). Price perceptions and consumer shopping behaviour: a field study, Journal of Marketing Research, Vol.30, No.2, pp.234-245.
38. Liou, J.J.H. (2009). A novel decision rules approach for customer relationship management of the airline market, Expert Systems with Applications, Vol. 36, No. 3, pp. 4374-4381.
39. Liu, Y.; Li, Y.; Tao, L.; and Wang, Y. (2008). Relationship stability, trust and relational risk in marketing channels: Evidence from China, Industrial Marketing Management, Vol.37, pp.432-446.
40. Mayer, R.C.; Davis, J. H. and Schoorman, F. D. (1995). An integrative model of

Master Thesis, Halmstad University
- 50 -
organizational trust, Academy of Management Review, Vol.20, No.3, pp.709-734.
41. Morgan, R.M. & Hunt, S. (1994). The Commitment-Trust Theory of Relationship
Marketing, Journal of Marketing, Vol.58 (July 1994), pp.20-38.
42. Mouri, N. (2005). A Consumer-based Assessment of Alliance Performance: An Examination of Consumer Value, Satisfaction and Post-purchase behavior; University of Central Florida, 2005, 156 pages; AAT 3193496, available on 01/03/2009 http://proquest.umi.com/pqdweb?did=1014307471&sid=1&Fmt=2&clientId=46934&RQT=309&VNa
me=PQD
43. N’Goala, Gilles (2007). Customer Switching Resistance (CSR): The effect of perceived equity, trust and relationship commitment, International Journal of Service Industry Management, Vol.18, No.5, pp.510-533.
44. Oliver, R. L. (1997). Satisfaction: A Behavioral Perspective on the Consumer, New York:
McGraw Hill.
45. Oliver, R. L. (1999). When consumer loyalty? Journal of Marketing, Vol.63, pp.33-44.
46. O’Loughlin, D., Szmigin, I. and Turnbull, P.(2004). Branding and relationships: customer and supplier perspectives, Journal of Financial Services Marketing, Vol.8, No.3, pp.218-230
47. Parasuraman, A., Zeithamal, V.A.and Berry, L.L. (1988). SERVQUAL: A multiple-item scale for measuring consumer perceptions of service quality, Journal of Retailing, 64, pp.12-40.
48. Patterson, P. G. and Smith, T. (2003), “A cross-cultural study of switching barriers and propensity to stay with service providers”, Journal of Retailing, Vol.79, No.2, pp.107-120.
49. Peng, Leong Yow & Wang, Qing (2006). Impact of Relationship Marketing Tactics (RMTs) on Switchers and Stayers in a Competitive Service Industry, Journal of Marketing Management, V.22, pp.25-59.
50. Peppers, D. and Rogers, M. (2004). Managing Customer Relationships: A strategic Framework, Published by John Wiley & Sons, Inc., Hoken, New Jersey. ISBN 0-471-48590-X.
51. Ravald, A. & Gronroos, C. (1996). The value concept and relationship marketing, European Journal of Marketing, Vol. 30, No.2, PP.19-30.
52. Saunders, M., Lewis, P., and Thomhil, A.(2000). Research Methods for Business Students ,(second edition), London: Pearson Education Limited.
53. Selnes, F. (1993), “An examination of the effect of product performance on brand reputation, satisfaction and loyalty”, European Journal of Marketing, Vol.27, No.9, pp.19-35.

Master Thesis, Halmstad University
- 51 -
54. Singh, R. (2008), “Relational embeddedness, tertius iungens orientation and relationship quality in emerging markets”, Asia Pacific Journal of Marketing and Logistics, Vol.20, No.4, pp.479-492.
55. Smith, J. B. (1998), “Buyer-Seller Relatioships: Similarity, Relationship Management,
and Quality”, Psychology and Marketing, Vol.15, No.1, pp. 3-21.
56. Spath, D. and Fähnrich, K.-P. (Eds) (2007), “Advances in Services Innovations”, Springer, Berlin, ISBN: 978-3-540-29858-8.
57. Stone, M., Woodcock, N., and Machtynger, L. (2000). Customer Relationship Marketing: Get to know your customers and win their loyalty, 2
nd Edition, Kogan Page Ltd, ISBN
0-7494-2700-0.
58. Tseng, Yi Ming (2007). The Impacts of Relationship Marketing Tactics on Relationship Quality in Service Industry, The Business Review, Cambridge; Summer 2007, 7 (2),
pp.310-314.
59. Tian, Yu; Lai, Fujun and Daniel, Francis (2008), “An examination of the nature of trust in logistics outsourcing relationship: Empirical evidence from China”, Industrial
Management & Data Systems, Vol.108, No.3, pp.346-367.
60. Wilson, D. T. & Jantrania, S. (1995). Understanding the Value of a Relationship, Asia-Australia Markeing Journal, 2(1), pp. 55-66
61. Wood, J. A. (2008). The Effect of Buyers’ Perceptions of Environmental Uncertainty on Satisfaction and Loyatly, Journal of Marketing Theory and Practice, Vol.16, No.4, pp.309-320.
62. Wulf, K. D., Odekerken-schroder, G. and Iacobucci, D. (2001). Investments in consume relationships: a cross-country and cross-industry exploration, Journal of Marketing, Vol. 65, No.4, pp. 33-50
63. Yin, R. K. (1994). Case Study Research: design and methods, (second edition), Thousand Oaks, London. Sage Publication Inc.
64. Zeithaml, V. A. (1988). Consumer perceptions of price, quality and value: a means-end model and
synthesis of evidence, Journal of Marketing, Vol.52 (July), pp. 2-22

Master Thesis, Halmstad University
- 52 -
Appendix :Questionnaire
Dear Participants,
We are conducting a survey of Swedish mobile telecommunication markets. In the
following questionnaire, we would like to know your attitudes and behaviors related to
satisfaction and loyalty about the Swedish mobile service provider you are using
presently. This survey is a part of our master thesis, and your kindly help is crucial for
our successful completion of this research project. Your responses will be anonymous;
data will be combined and analyzed as a whole. Please attempt to answer all the
questions and click one appropriate box that best suits your perspective for each
statement.
Your participation in the study will be greatly appreciated. Thank you very much for
your time and assistance.
Individual Characteristics
a) Your Gender: Male Female
b) Please fill in the name of the mobile telecom operator you are using now? (e.g. Tele2, Telia and so on ) _____________________________
Service quality
1. This mobile telecom operator follows up in a timely manner to customer requests. 5 strongly agree 4 agree 3 neutral 2 disagree 1 strongly disagree
2. The frontline employees of this operator are always willing to help me. 5 strongly agree 4 agree 3 neutral 2 disagree 1 strongly disagree
3. The response to consumers’ complaints are always taken quickly. 5 strongly agree 4 agree 3 neutral 2 disagree 1 strongly disagree
4. This operator is consistent in providing good quality service. 5 strongly agree 4 agree 3 neutral 2 disagree 1 strongly disagree

Master Thesis, Halmstad University
- 53 -
5. This operator offers personalized services to meet customers’ need. 5 strongly agree 4 agree 3 neutral 2 disagree 1 strongly disagree
6. This operator provides timely information when there are new services. 5 strongly agree 4 agree 3 neutral 2 disagree 1 strongly disagree
Price
7. This operator took effective ways to help us know its pricing policies of products and services.
5 strongly agree 4 agree 3 neutral 2 disagree 1 strongly disagree
8. The pricing policies of products and services from this operator are attractive. 5 strongly agree 4 agree 3 neutral 2 disagree 1 strongly disagree
9. The calling rate offered by this operator is reasonable. 5 strongly agree 4 agree 3 neutral 2 disagree 1 strongly disagree
10. This operator is offering flexible pricing for various services that meet my needs. 5 strongly agree 4 agree 3 neutral 2 disagree 1 strongly disagree
11. I will continue to stay with this operator unless the price is significantly higher for the same service.
5 strongly agree 4 agree 3 neutral 2 disagree 1 strongly disagree
Brand Image
12. I consider that this operator’s reputation is high. 5 strongly agree 4 agree 3 neutral 2 disagree 1 strongly disagree
13. I have a good feeling about the operator’s social responsibility. 5 strongly agree 4 agree 3 neutral 2 disagree 1 strongly disagree
14. The operator delivered a good brand image to its customers. 5 strongly agree 4 agree 3 neutral 2 disagree 1 strongly disagree
Value Offered
15. The promotional offers from this operator were worth the money. 5 strongly agree 4 agree 3 neutral 2 disagree 1 strongly disagree
16. It was easy to get benefits from the promotional offers. 5 strongly agree 4 agree 3 neutral 2 disagree 1 strongly disagree
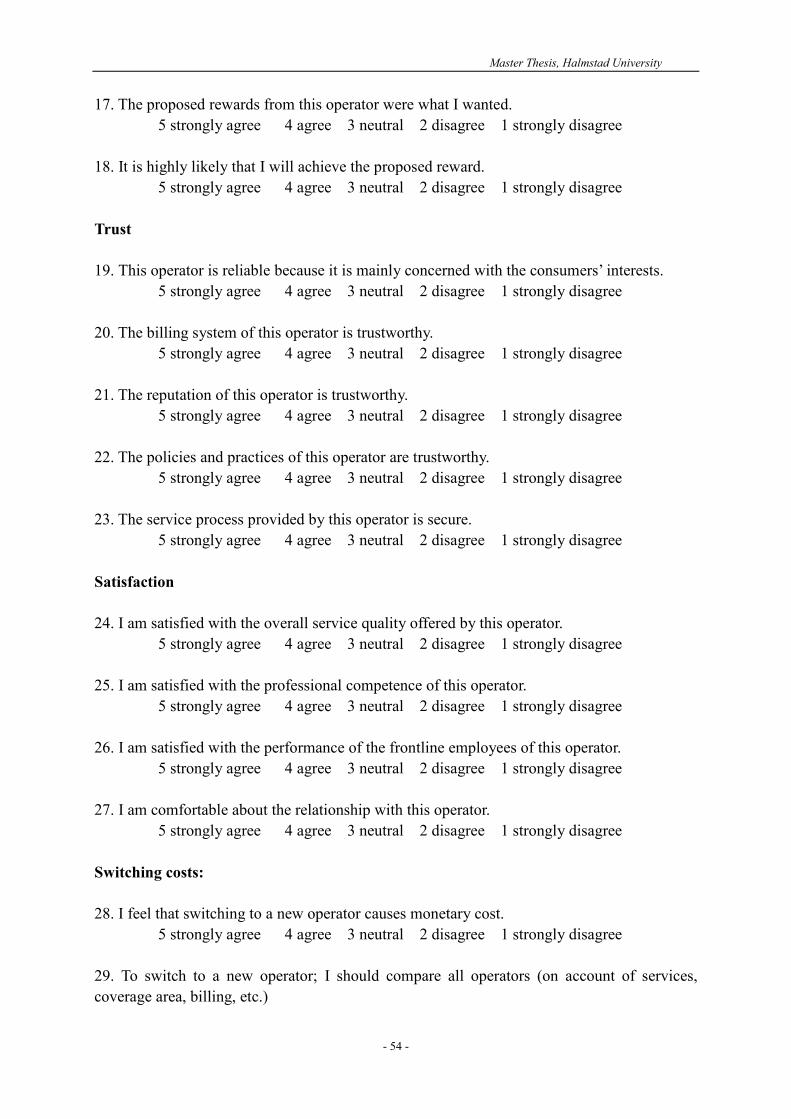
Master Thesis, Halmstad University
- 54 -
17. The proposed rewards from this operator were what I wanted. 5 strongly agree 4 agree 3 neutral 2 disagree 1 strongly disagree
18. It is highly likely that I will achieve the proposed reward. 5 strongly agree 4 agree 3 neutral 2 disagree 1 strongly disagree
Trust
19. This operator is reliable because it is mainly concerned with the consumers’ interests. 5 strongly agree 4 agree 3 neutral 2 disagree 1 strongly disagree
20. The billing system of this operator is trustworthy. 5 strongly agree 4 agree 3 neutral 2 disagree 1 strongly disagree
21. The reputation of this operator is trustworthy. 5 strongly agree 4 agree 3 neutral 2 disagree 1 strongly disagree
22. The policies and practices of this operator are trustworthy. 5 strongly agree 4 agree 3 neutral 2 disagree 1 strongly disagree
23. The service process provided by this operator is secure. 5 strongly agree 4 agree 3 neutral 2 disagree 1 strongly disagree
Satisfaction
24. I am satisfied with the overall service quality offered by this operator. 5 strongly agree 4 agree 3 neutral 2 disagree 1 strongly disagree
25. I am satisfied with the professional competence of this operator. 5 strongly agree 4 agree 3 neutral 2 disagree 1 strongly disagree
26. I am satisfied with the performance of the frontline employees of this operator. 5 strongly agree 4 agree 3 neutral 2 disagree 1 strongly disagree
27. I am comfortable about the relationship with this operator. 5 strongly agree 4 agree 3 neutral 2 disagree 1 strongly disagree
Switching costs:
28. I feel that switching to a new operator causes monetary cost. 5 strongly agree 4 agree 3 neutral 2 disagree 1 strongly disagree
29. To switch to a new operator; I should compare all operators (on account of services, coverage area, billing, etc.)

Master Thesis, Halmstad University
- 55 -
5 strongly agree 4 agree 3 neutral 2 disagree 1 strongly disagree
30. Even if I have enough information, comparing the operators with each other takes a lot of energy, time and effort
5 strongly agree 4 agree 3 neutral 2 disagree 1 strongly disagree
31. If I change my phone number, I would be concerned if people dial my previous number but could not reach me.
5 strongly agree 4 agree 3 neutral 2 disagree 1 strongly disagree
32. If I switch to a new operator, I am not able to use some services (MMS, GPrice PerceptionS, WAP, etc.), until I learn to use them
5 strongly agree 4 agree 3 neutral 2 disagree 1 strongly disagree
Customer loyalty
33. I intend to continue using mobile services from this operator for a long time. 5 strongly agree 4 agree 3 neutral 2 disagree 1 strongly disagree
34. If I want to change a new telecom service, I am willing to continue selecting this operator. 5 strongly agree 4 agree 3 neutral 2 disagree 1 strongly disagree
35. Even if another operator’ price is lower, I will go on using this provider. 5 strongly agree 4 agree 3 neutral 2 disagree 1 strongly disagree
36. I am willing to say positive things about this operator to other people. 5 strongly agree 4 agree 3 neutral 2 disagree 1 strongly disagree
37. I will encourage friends and relatives to use the services offered by this operator. 5 strongly agree 4 agree 3 neutral 2 disagree 1 strongly disagree
38. To me, this operator clearly is able to provide the best service. 5 strongly agree 4 agree 3 neutral 2 disagree 1 strongly disagree
Thanks for your assistance! It is greatly appreciated!