the impact of collusion on price behavior…ageconsearch.umn.edu/bitstream/19164/1/sp05bo01.pdf ·...
TRANSCRIPT
THE IMPACT OF COLLUSION ON PRICE BEHAVIOR:
EMPIRICAL RESULTS FROM TWO RECENT CASES
Yuliya Bolotova, John M. Connor, and Douglas J. Miller*
Purdue University Department of Agricultural Economics
403 West State Street West Lafayette, IN, 47907-2056
[email protected] [email protected] [email protected]
Selected Paper prepared for presentation at the American Agricultural Economics Association
Annual Meeting, Providence, Rhode Island, July 24-27, 2005 _________________________________________________________________________ * The authors are Ph.D. Candidate, Professor, and Assistant Professor, respectively. Contact author is Yuliya Bolotova. Research for this paper was supported in part by the Edmund S. Muskie Ph.D. Fellowship Program, a program of the Bureau of Educational and Cultural Affairs (ECA), U.S. Department of State, administered by the American Councils for International Education (ACTR/ACCELS). The opinions expressed in the paper are those of the authors and do not necessarily express the views of either ECA or American Councils.
Copyright 2005 by Yuliya Bolotova, John M. Connor, and Douglas J. Miller. All rights reserved. Readers may make verbatim copies of this document for non-commercial purposes by any means, provided that this copyright notice appears on all such copies.
2
Abstract
We used extensions of traditional ARCH and GARCH models to examine the
difference in the behavior of the first two moments of the price distribution during
collusion and the absence of it using prices from two recently discovered conspiracies,
citric acid and lysine. According to our results, the citric acid conspiracy increased prices
by 9 cents per pound relative to pre-cartel and post-cartel periods. The lysine conspiracy
managed to raise prices by 25 cents per pound. In addition, the variance of prices during
the lysine conspiracy was lower than the variance of prices during pre-cartel and post-cartel
periods as we expected. In contrast, the variance of prices during the citric acid conspiracy
was higher relative to more competitive periods.
Key words: ARCH, cartel, citric acid, GARCH, lysine, overcharge, price, variance
3
Introduction
During recent decades collusive behavior has been the primary focus of many theoretical
and empirical studies in both economics and law. Changes in antitrust legislation of many
countries created additional incentives for research analyzing overt collusive conduct. A
considerable number of theoretical studies concentrated on mathematical derivations of
conditions characterizing collusive behavior under different assumptions. Over time, more
data became available from court records, uncovered cartels that had terminated earlier,
and different public sources. Researchers in the rapidly developing area of empirical
industrial organization used available data and new econometric techniques to study cartels
behavior and test hypotheses formulated in the theoretical literature. Still there remain
many determinants and effects of collusive behavior to be studied and analyzed.
Different empirical studies have analyzed numerous aspects of collusive behavior
such as price and output strategies, price wars, duration, stability, profitability,
effectiveness, and impact on the market and consumer behavior. Our study belongs to the
group of research investigating the impact of collusive conduct on the market price
behavior. Our objective is to use econometric techniques to analyze the impact of collusion
on the behavior of the first two moments of the price distribution, the mean and the
variance. We hypothesize that the first two moments of prices under successful collusion
are different than during non-collusive periods. In particular, the mean price is higher and
the variance of the price is lower during collusion in comparison with the period when
there is no collusion. To test the hypotheses we use price data from two recently discovered
conspiracies, citric acid and lysine, and employ an extension of the traditional
autoregressive conditional heteroscedasticity (ARCH) and generalized ARCH (GARCH)
models.
4
The hypothesized changes in the first two moments of the price distribution may
indicate the presence of collusive behavior in certain situations. The proposed econometric
procedure may be used by antitrust and competition authorities to screen firm conduct. In
addition, it may also be used as an alternative to the econometric models commonly
employed in court proceedings to quantify the effect of conspiracy on market price. An
advantage of using the ARCH and GARCH models is that they may use a relatively small
sample of prices for a cartelized product before, during and after a hypothesized or known
conspiracy.
Our paper is organized as follows. Theoretical background and hypotheses are
presented in the next section followed by a section discussing empirical models. Next, the
data set description is presented, and the last section includes discussion of results and
conclusions.
Theoretical Background and Hypotheses
Cartels, groups of independent companies binding themselves with an agreement on prices
or quantities, are more likely to operate in heavily concentrated or oligopolistic markets. In
most cases cartels are self-enforced agreements, and these may be legal or illegal.
Assuming that the behavior of the firms acting in oligopolistic markets is profit
maximizing, they have an incentive to collude in order to increase their joint level of profit
(Stigler, 1961 and 1964). If their collusion is successful, the collusive firms may achieve a
monopolistic level of profit if they manage to act as a multiplant monopolist1. According to
microeconomic theory, firms may achieve this goal by reducing output, which results in an
increase in the market price. In practice, the firms may control output, prices, or both. In
terms of practical implementation the easiest strategy to use is price control (Stigler, 1961).
1 The first order maximization condition outcomes are the same for a multiplant monopolist and for a cartel (proved in Besanko and Braeutigam, 2001).
5
The output control strategy may also be easy to employ, but the actions would be too
revealing to antitrust authorities.
As it turns out not all cartels pursue joint profit maximization by means of a direct
price increase as the main strategy. Another strategy is to reduce the variance of prices by
homogenizing firms’ business practices as in the case of the Sugar Institute (Genesove and
Mullin, 2001). A reduction in price variance could lead to an increase in the joint profits of
colluding firms as well. Finally, colluding firms may implement a cost efficiency strategy
as in the case of some Webb-Pomerene export cartels (Dick 1996a and 1996b).
In general, both legal and illegal cartels are self-enforced agreements2. Success of
collusive agreements depends on two major factors. These are the ability of a cartel to
effectively enforce its discipline and the market environment the cartel operates in, i.e.
market supply and demand conditions. Failure to enforce a collusive agreement effectively
(i.e. quickly detect deviators, punish them and prevent opportunistic behavior in the future)
often leads to termination of a collusive agreement. Also, changing market conditions such
as new entry or demand or supply shocks may break an existing cartel. As it was shown in
the theoretical and empirical literature, a large demand shock creates incentives for cartel
members to deviate from the established discipline (Porter (1983), Green and Porter
(1984), Rotemberg and Saloner (1986), Ellison (1994)). This usually results in a price war
or in termination of collusion accompanied by a decrease in the market price to a more
competitive level.
The opportunistic behavior of cartel members, also known as cheating in the cartel
literature, is a major problem in effective enforcement of cartel discipline. Deviators do not
rigorously follow established price discipline and sell the product for lower prices than
required by the collusive agreement. A deviator seeks to increase its individual profit. Also, 2 For example, Webb-Pomerene cartels were legal cartels. They operated under the umbrella of the Webb-Pomerene Export Trade Act, but were self-enforced agreements. Thus, they faced the same problems with the enforcement of cartel discipline as illegal cartels.

6
buyers may provoke opportunistic behavior of the cartel’s members. A large buyer
searching for big discounts may increase an incentive to deviate. The search cost for buyers
in markets with few sellers is relatively low. An incentive to deviate always exists as long
as it potentially guarantees higher individual profit. The deviators are also aware of the
possible cost of their behavior, which is punishment if their actions are revealed to other
members. This cost approximately equals to the probability of being detected by other
members multiplied by the probability of being punished by them if they decide to do this
and the expected cost of punishment. Other members may detect opportunistic behavior if
their market shares start shrinking. They may decide not to punish because this could result
in a decrease of the cartel profit. If they decide to punish, it usually comes in the form of
price war, “tit-for-tat” strategy of other members, or termination of collusion. Given that
opportunistic behavior of cartel members is common, short-run individual benefits of
deviators often outweigh the expected losses.
In summary, rigorously followed cartel discipline may result in a price increase and
variance decrease. As firms start following the established price discipline, the variance of
prices tends to decrease in comparison with the non-collusive period. It is more challenging
to control the variance of prices, although it would generate additional profits for the cartel.
Collusion is more common in homogeneous product market where it is easier for firms to
monitor prices. However, heterogeneity of contract conditions such as quantity discounts,
delivery terms, and interest may introduce additional variability in prices of homogenous
products. Also, the participants of collusive agreements may intentionally use contract
conditions to deviate in order to obtain extra profit. Thus, different strategies of
opportunistic behavior may contribute additional variability in prices.
Our study analyzes two uncovered conspiracies that are known to be successful.
Our first hypothesis relates to the mean price behavior. We expect that the mean price
7
during collusion is higher than the mean price when there is no collusion. The price
increase follows from the profit-maximization conditions on the concentrated markets. Our
second hypothesis relates to the variance behavior. We expect that the variance of prices
during successful collusion (i.e. when most of the members in most of the time follow
established price discipline and the cartel may effectively address opportunistic behavior of
its members) is lower than the variance of prices when there is no collusion. Our
hypotheses are formulated under the assumption that there is no significant change in the
market environment of the cartel that could introduce an additional shock to prices.
Empirical Model
To examine the behavior of the first two moments of the price distribution, mean and
variance, we employ an econometric procedure that allows simultaneous analysis of the
mean and the variance. In this section we discuss the AR(m), ARCH(m), and GARCH
(m,r) models that we use in our analysis. An autoregressive process of order m, denoted
AR(m), for an observable variable Y in period t is represented as:
Yt = c + φ1Yt-1 + φ2Yt-2 +…+ φmYt-m + ut (1)
where ut is a white noise:
E(ut)=0, (2)
E(utus)=σ² for t=s, and 0 otherwise. (3)
Condition (3) implies that the unconditional variance of ut is the constant σ², and the
conditional variances could change over time. The square of ut itself may follow an AR(m)
process:
u²t = ζ + α1 u²t-1 + α2 u²t-2 +…+ αm u²t-m + wt (4)
where wt is a new white noise process:
E(wt)=0 (5)
8
E(wtws)= λ² for t=s, and 0 otherwise. (6)
A noise process ut satisfying the variance equation (4) is described as an
autoregressive conditional heteroscedastic process of order m, denoted as ARCH(m).
The sufficient stationarity (regularity) condition requires ζ >0 and αj ≥0 for all j ≤ m. This
class of models was introduced by Engle (1982). The ARCH(m) specification can be
considered as an AR(m) process for u²t (Hamilton, 1994).
Generalized ARCH (GARCH) type models are extensions of ARCH type models.
The GARCH(r,m) variance equation is represented by (7):
ht = k + δ1ht-1 + δ2h t-2 +…+ δrht-r + α1 u²t- 1+ α2 u²t-2 +…+ αm u²t-m (7)
where ut = th vt and vt is i.i.d with mean zero and unit variance. The sufficient
stationarity (regularity) condition requires k >0, δi ≥0 for all i ≤ r, αj ≥0 for all j ≤ m, and
∑=
r
tt
1
δ + ∑=
m
tt
1
α ≤ 1. Calculation of the sequence of conditional variances {ht} for t=1 to
t=T requires their pre-sample values. Usually they are calculated as a sample average of the
squared predicted residuals for each pre-sample observation in the T sequence (Bollerslev
(1996), Hamilton (1994)).
We estimate extensions of traditional ARCH(m) and GARCH(m,r) models to
analyze the mean and the variance behavior in our study. To test whether the mean price
and its variance during a conspiracy differ from the mean price and the variance when there
is no conspiracy, we introduce a conspiracy dummy variable in the models. It is
incorporated both in the mean and the variance equations to control for the shift in their
behavior between collusive and non-collusive regimes. The exact specification of each
model is presented in the tables with the estimation results in the appendix.
9
Data and Descriptive Statistic Analysis
Citric Acid3. We use the citric acid prices reported by Connor (1998b, Appendix, Table 1).
These are monthly U.S. contract citric acid prices for the period of February 1990 - April
1997 reported by Purchasing Magazine4. This price time-series was based on monthly
surveys of up to 500 chemical purchasing agents and buyers of bulk purchases (truck or
tanker-car loads), f.o.b., USP grade citric acid. Contract prices are prices of supply
contracts in force for three months, or more (usually one year). For the purpose of this
study we assume that July 1991 is the beginning date of the conspiracy and June 1995 is
the ending date of the conspiracy5.
Lysine6. We use the lysine prices reported by Connor (2000, Appendix, Table A2).
We use the average monthly price of lysine for the U.S. market available for the period of
January 1990 to June 1996. These prices are obtained from Exhibit C to the Plantiff’s
Interim Report No.1 (April 29, 1996 supplement), In re Amino Acid Lysine federal class-
action suit; exhibits 61,63, 65, and 67 in U.S. v. Michael Andreas et al. For the purpose of
3 Citric acid is a colorless, crystalline organic chemical, one of the carboxylic acids. It is present in almost all plants, especially citrus fruits, and in many animal tissues and fluids. It is used in many foods, confections, and soft drinks. Citric acid is widely used in industry as a water conditioner, cleaning polishing agent, and chemical intermediate. 4 Price diagrams are presented in the appendix. 5 Four companies pled guilty to fixing prices and output levels of citric acid in the United States, Archer Daniels Midland Co. (ADM), Bayer AG, Hoffmann-La Roche AG, and Jungbunzlauer AG. The last three are the Swiss companies. According to ADM’s plea agreement the period of the conspiracy was vaguely identifies as “at least as early as January 1993” and ending June 1995. The terms of this plea agreement were negotiated with the US Department of Justice (DOJ) before filing with the Court in October 1996. Though, later (1997), when DOJ filed against three Swiss conspirators, the beginning date of the conspiracy was specified as July 1991. Connor (1998) points out that July 1991 is a more reasonable date for the beginning of the conspiracy. In addition, he argues that the conspiracy had effect on the market far beyond June 1995. This is because the prices do not adjust to before- conspiracy levels quickly. For details on the citric acid market and collusion see Connor (2001). 6 Lysine is an essential amino acid found in proteins. It is required for growth and bone development in children, assists in calcium absorption and maintaining the correct nitrogen balance in the body and maintaining lean body mass. Furthermore it is needed to produce antibodies, hormones, enzymes, collagen formation as well as repair of tissue. Lysine is produce from dextrose, a sugar made from corn. Lysine is an important food and feed ingredient. It is widely used as a feed component in hogs, poultry and fish production. The technological process for lysine production was discovered in Asia in the 1960s.
10
our study we assume the period of conspiracy as August 1992 - June 1995 excluding the
four months of the collusion lapse in April-July 19937.
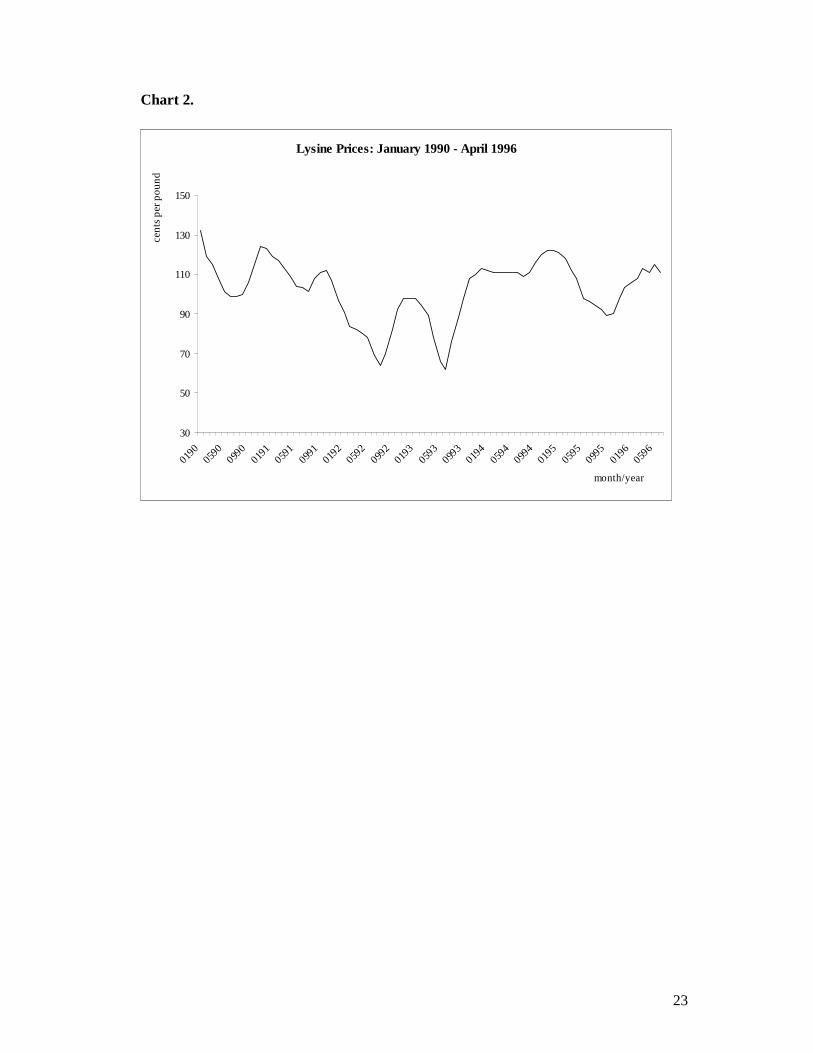
Descriptive Statistical Analysis
Descriptive statistical analysis reveals some evidence of the presence of collusive behavior
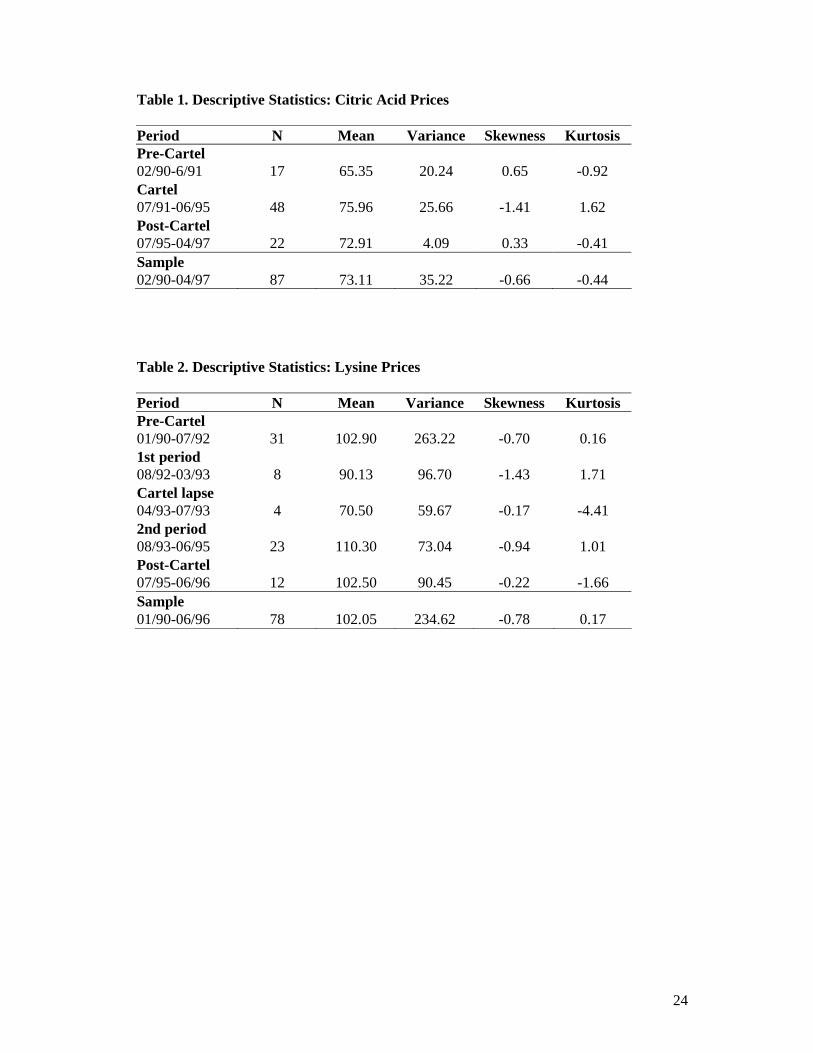
on both the citric acid and lysine markets (Table 1 and Table 2 respectively8). The mean
cartel price for citric acid is 75.96 cents per pound. This price is higher than the mean pre-
cartel and post-cartel prices that are 65.35 and 72.91 cents per pound respectively. The
mean cartel price for lysine during the 1st period of conspiracy is 90.13 cents per pound and
is 110.30 cents per pound during the 2nd, more effective period. The latter is higher than the
pre-cartel and post-cartel lysine prices, which are approximately the same, 102.90 and
102.50 cents per pound respectively. Thus, in both cases we observe a noticeable increase
in price during the conspiracy relative to non-conspiracy periods.
The behavior of the lysine price variance supports our expectation, i.e. it decreases
during collusive period. In contrast, the variance of the citric acid price exhibits shifts that
are contrary to expectations. In the citric acid case, the variance during the conspiracy is
25.66, which is higher than the variance before or after the conspiracy. In the lysine case,
the variance during the 2nd period of conspiracy is 73.04 and this is lower than the variance
during the pre-cartel, post-cartel and first cartel episode. Actually the lowest variance we
observe is during a lapse of the lysine cartel in April – July 1993. This may be explained by 7 Before ADM’s entry in 1991, three Asian companies, Ajinamoto, Kyowa, and Sewon Group were the major producers of lysine in the world and the only firms sharing the US market. They admitted they had employed price-fixing strategies. When ADM entered the market, world lysine prices dropped from $1.30 to $0.64 per pound, which was below the cost of production for all producers in the lysine market. In June 1992, ADM met with Asian companies representatives in Mexico City to discuss the condition of a future global conspiracy. Increasing prices and sharing information on prices and volumes were discussed during this meeting. Asian companies reached an agreement with the DOJ to plead guilty, pay fines, and cooperate in prosecuting ADM and its officers in August, 1996. ADM pled guilty and agreed to pay a fine in October, 1996. Connor (2001) inclines to consider June 1992 to be the beginning date of lysine conspiracy and July 1995 to be the termination of conspiracy that lasted a total of 36 months. August 1992 is considered to be the first month when the conspiracy had an effect on the market. March – July 1993 is considered to be a period when the conspiracy was not effective. Defendants’ plea agreements adopted a shorter conspiracy period, November 1993-June 1995 (Connor, 2001a). For more details on lysine market and collusion see Connor (2000, 2001a and 2001b). 8 All tables are presented in appendix.
11
the short duration of this lapse during which the remaining impact of the previous market
price could have been strong. Another justification could be that prices observed during
this period were almost on the same level as marginal cost (or even lower). Thus, the
conspirators had to prevent their decrease.
The unexpected behavior of the variance in citric acid case may be explained by the
actual length of the conspiracy period under consideration as well as the length and
conditions of the pre-cartel and post-cartel periods. The citric acid conspiracy period in our
analysis is longer than the lysine conspiracy period, but the pre-cartel period is almost half
as long9. The pre-cartel period contains more variability in the prices than the post-cartel
periods. The post-cartel variance may be low because the conspiracy market price effect
stays on the market for a certain period of time after the conspiracy has been formally
terminated. Also, the market price effect during the conspiracy does not take place
immediately after the first meeting of the conspirators and their decision to collude. There
is a period that may last several months, or even a few years, when prices are growing until
they reach the level on which they are going to be fixed. Certainly, the variance is lower in
the sub-period of the conspiracy when prices have reached the level on which they are
actually being fixed. Also, the time required for the collusive agreement to affect prices
will vary for each particular conspiracy. Other problematic issues that may impact this
unexpected variance behavior are cartel discipline and the market conditions the cartel
operates in (as we discussed earlier). So, under certain circumstances it may be expected
that the variance of the price during conspiracy is higher than the variance of the price
when there is no conspiracy. Also, it is known that the lysine conspiracy was effective in
terms of cartel discipline enforcement. The cartel participants followed their agreement in
approximately 90 percent of all cases (Connor, 2001a).
9 The choice of the length of the pre-cartel and post-cartel periods is totally determined by the number of the available observations.
12
From the descriptive statistical analysis we also note additional features of the price
behavior that may indicate the presence of collusion. In the case of citric acid, the post-
cartel price is kept on a level close to the cartel price and is higher than the pre-cartel price.
Also, the variance during the post-cartel period is very small. In the lysine case although
the post-cartel price is approximately at the same level as the pre-cartel price, the variance
of the former is less than half the variance of the latter. This supports the hypothesis that
market price effect of the conspiracy stays on the market for a certain period of time and
does not disappear immediately. This happens because conspirators cannot control all
market forces and the long-term contract provisions are in force. In addition an expected
antitrust indictment followed by civil suit may encourage conspirators to continue to
influence prices but in more relax way10. In summary, the presence of these factors that
may affect the price variance highlights the need to use dynamic models of conditional
heteroscedasticity like the ARCH and GARCH models.
Results
Citric Acid. Using the ARCH test we reject the null hypothesis of homoscedasticity at a p-
value equal to 0.000011. The conclusion of this test is the same if we repeat it for any model
including from 1 to 15 lags. Also, we use the modified Box-Pierce (Ljung-Box-Pierce)
statistic to test for the presence of serial autocorrelation in the residuals and the square
residuals (variances) obtained from the OLS regression12. Q(1) for the model with the first
lag only is 79.92 and has a p-value equal to 0.0000. Q(2)-Q(20) are statistically significant
10 Sproul (1993) analyzed the effect of antitrust prosecution on prices charged by firms indicted for price-fixing. Using the survey of 25 cases filed between 1973 and 1984 he found that prices increased by approximately 7 percent over the four years following an indictment. 11 ARCH test is based on the Lagrange multiplier principle. LM statistic = N*R2, where N is the number of observations and R2 is a goodness-of-fit statistic from the regression of the squared residuals on a constant and q lagged values of the squared residuals. This statistics has Chi-Square distribution with q degrees of freedom. 12 Modified Box-Pierce (Ljung-Box-Pierce) statistic has a Chi-Square distribution with the number of degrees of freedom equal to the number of the lags included in the model. Q(1) is the statistic based on the model with one lag.
13
at the same level of significance. Therefore, we reject the null hypothesis of uncorrelated
mean price changes. The same procedure applied to the squared residuals reveals similar
results. The Ljung-Box-Pierce statistics for the models including up to the first twenty lags
are statistically significant at p-values equal to 0.0000. Thus, we reject the null hypothesis
of homoscedasticity. This suggests that ARCH and GARCH models may be suitable for
describing the error process. To choose the order of the AR process for the ARCH and the
GARCH mean equations we use the Akaike (AIC) and Swartz (SC) information criteria13.
We concentrate on the evaluation of these criteria for the models including up to the first
four lags14. Both AIC and SC are minimized when one lagged variable is included in the
model. Thus, we use the AR(1) specification for the mean equation in the ARCH and the
GARCH models.
Lysine. To investigate the autocorrelation structure of the lysine prices we use the
same procedure as in the case of citric acid15. The outcomes of the ARCH and Ljung-Box-
Pierce tests applied to the residuals and squared residuals are similar to those of citric
acid16. The statistics along with their significance levels are close in both cases. The final
conclusion is that we reject the null hypotheses of uncorrelated price changes and
homoscedasticity for lysine prices as well. As for the order of the AR process, AIC is
minimized for the model with only one lag and SC is minimized for the model with two
13 Under the standard Dickey-Fuller unit root test, we fail to reject the unit root hypothesis for models with 1-9 lags. However, as first noted by Perron (1989), the presence of mean or trend shift can alter the outcome of the unit root test. Following Perron, we conduct the unit root test with shifts in mean and trend during the pre-cartel, cartel, and post-cartel regimes. The Dickey-Fuller test statistic is -6.05, and the simulated critical value is -4.76 at 10 percent level. Therefore, we reject a unit root. 14 Due to the limited number of the observations available and the econometric technique employed we can consider only a limited number of lagged variables to estimate the ARCH and GARCH models. 15 In contrast to the citric acid case we reject a unit root when one or two lagged lysine prices are included in the model. For example, the Dickey-Fuller statistic and augmented Dickey-Fuller statistic for the model with one lag are –3.6277 and –3.6027 while critical values of t-statistics are –2.57 and –3.13 respectively. 16 In the lysine case, the ARCH LM test statistic is statistically significant with a p-value equal to 0.0000 for all models including up to 17 lags. The Ljung-Box-Pierce statistics are statistically significant for Q(1)…Q(20) both in the case of the residuals and the squared residuals.
14
lags. Thus, both AR(1) and AR(2) are potential candidates, and we estimate both of them
and discuss the model that performs best.
Maximum likelihood estimation results for the ARCH and the GARCH models are
presented in Table 3 and Table 4 for the citric acid case and in Table 5 and Table 6 for the
lysine case. We present the ARCH(1) and the GARCH(1,1) results. Estimates of the higher
order ARCH models showed that higher order lagged squared error terms were not
statistically significant and did not satisfy the stationarity constraints. Similar outcomes
were observed when alternatives to the GARCH(1,1) model specifications were estimated.
In addition, we had numerical problems with estimation of the GARCH(2,2) and higher
order GARCH models. Thus, we present and discuss the estimation results for the
ARCH(1) and the GARCH(1,1) models. In each product case we estimated three different
specifications of our model with different combinations of independent variables in the
mean and the variance equations (see Tables 3-6).
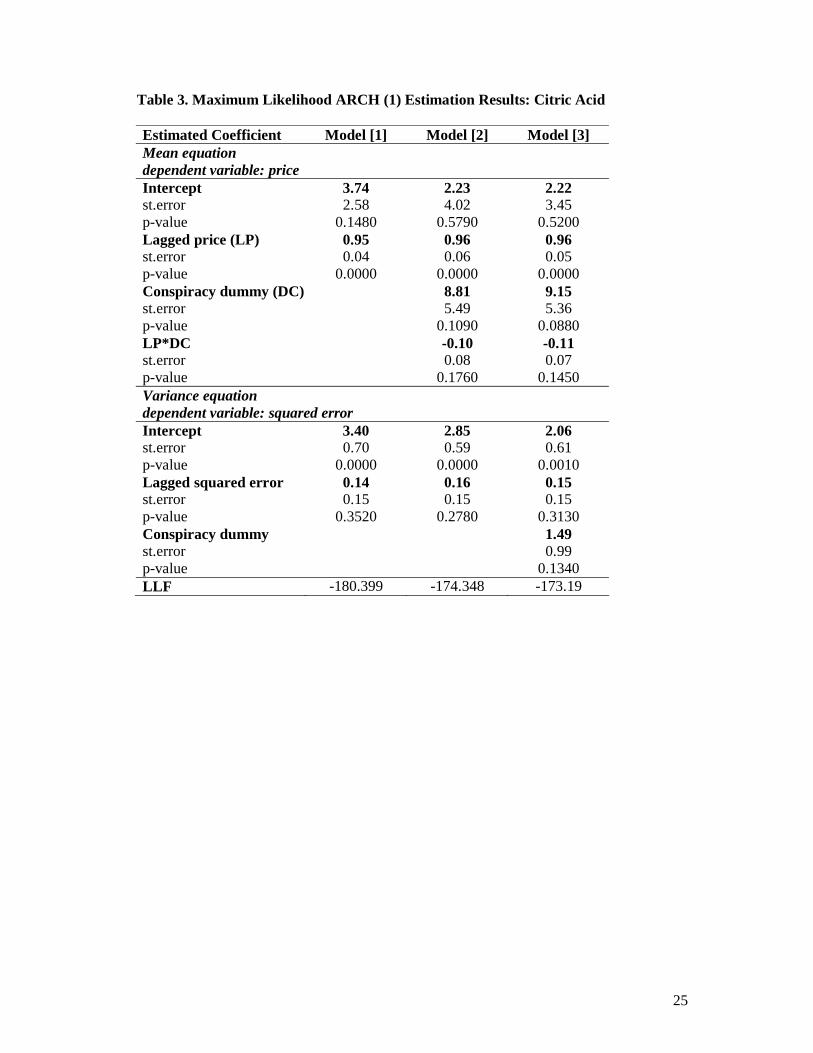
Citric Acid. All estimated coefficients in the ARCH(1) models satisfy the
stationarity constraints. Model [1] is estimated as an ARCH(1) model with lagged price and
a constant as the explanatory variables. The lagged squared error term in the variance
equation is positive as required by sufficient stationarity constraint and has a p-value of
0.3520. Model [2] includes a conspiracy dummy variable and its interaction with the lagged
price in the mean equation. The estimated coefficients for these two variables have
acceptable p-values. The estimated coefficient for the conspiracy dummy variable is 8.81
and has a p-value equal to 0.1090. The interaction effect has a small magnitude and a p-
value equal to 0.1760. Given this specification of the mean equation, the lagged square
error term becomes more statistically significant than in Model [1], and has similar
magnitude. Finally, we incorporated the conspiracy dummy variable in the variance
equation as well (Model [3]) to control for the hypothesized shift in the variance induced
15
by collusion. Thus, the estimation results for Model [3] are those we discuss in greater
detail.
The estimated coefficient for the conspiracy dummy variable in the mean equation
is 9.15 and has a p-value equal to 0.0880. The estimated coefficient for the interaction
effect of conspiracy dummy variable and lagged price is –0.11 and has a p-value equal to
0.1450. Both estimated coefficients are statistically significant at acceptable Type 1 error
probability. Thus, the mean price of citric acid during collusion is 9.04 cents per pound
higher than the mean price during the period when there is no collusion, which is
represented by the pre-cartel and post-cartel periods. The estimated effect of conspiracy on
the mean price is similar to the effect discussed earlier in the descriptive analysis section.
The estimation results for the variance equation show that the lagged squared error term
has a p-value of 0.3130 only, which does not suggest a highly statistically significant
impact of the past squared error terms on the present squared error term. The positive
magnitude of this coefficient suggests that the higher is the squared error term yesterday,
the higher is the squared error term today. The estimated coefficient for the conspiracy
dummy variable in the variance equation is 1.49 and has a p-value equal to 0.1340. The
positive effect of the conspiracy on the variance is not what we hypothesized. But this
result is consistent with the variance analysis using descriptive statistic.
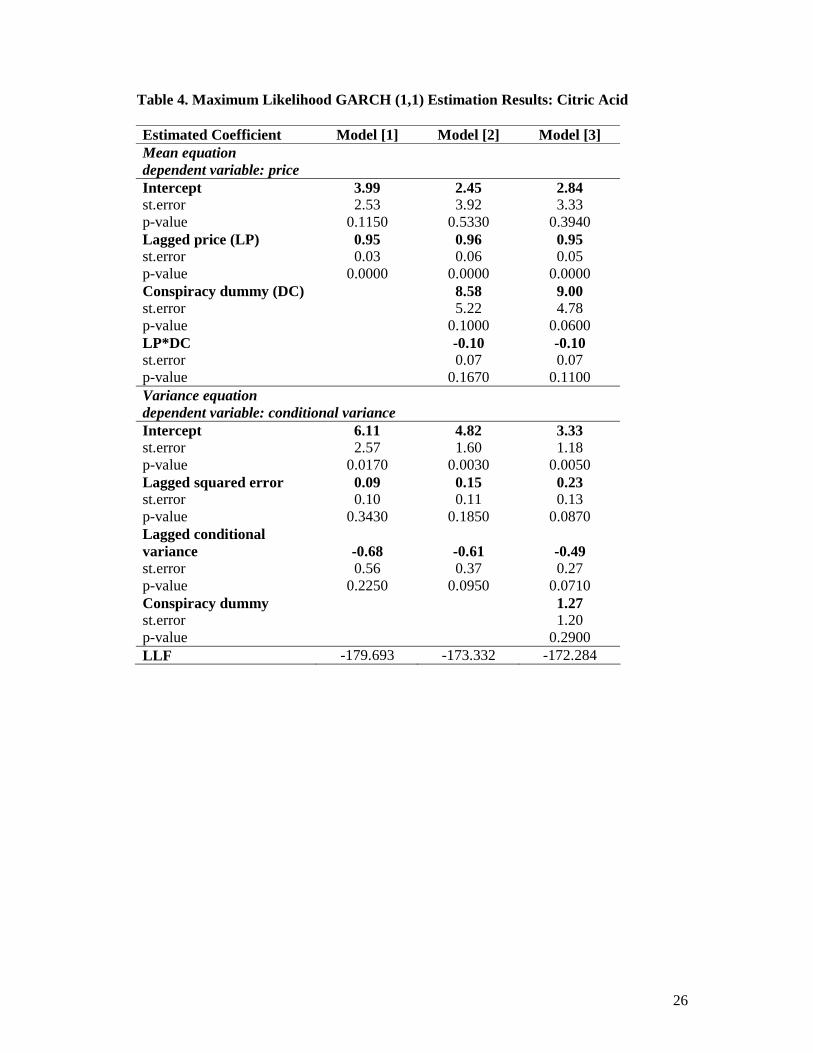
The estimation results for the mean equation in the GARCH(1,1) model are similar
in magnitude and statistical significance to the estimation results for the mean equation in
the ARCH(1) model. The squared error term has a stronger statistical effect in the
GARCH(1,1) model than in the ARCH(1) model. Its estimated coefficient is positive and
has a p-value of 0.0870. The estimated coefficient for the lagged conditional variance is
negative and has a p-value of 0.0710. This suggests that higher values of past conditional
variance generate lower values of present conditional variance. The estimated coefficient
16
for the conspiracy dummy variable is positive, as in the ARCH(1) variance equation, and is
not statistically significant with a p-value equal to 0.2900. Thus, in the case of citric acid,
the estimation results confirm the hypothesis that the conspiracy results in the statistically
significant price increase and they show different from the expected effect of the
conspiracy on the variance behavior.
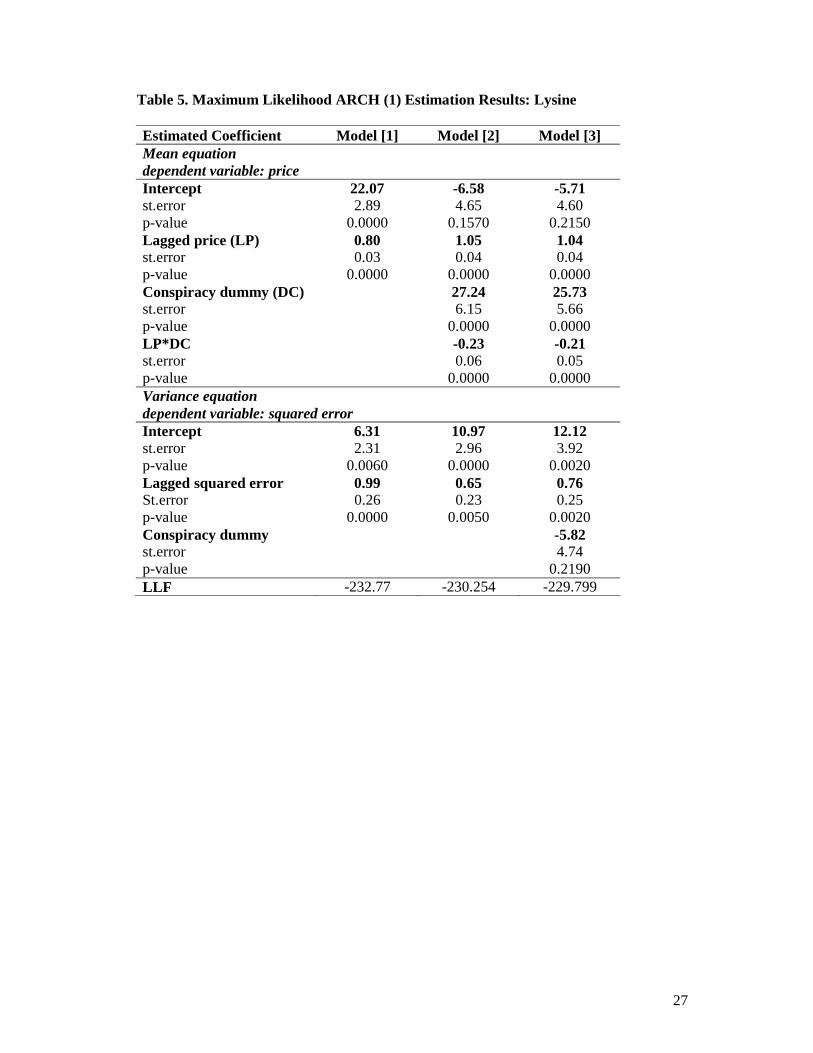
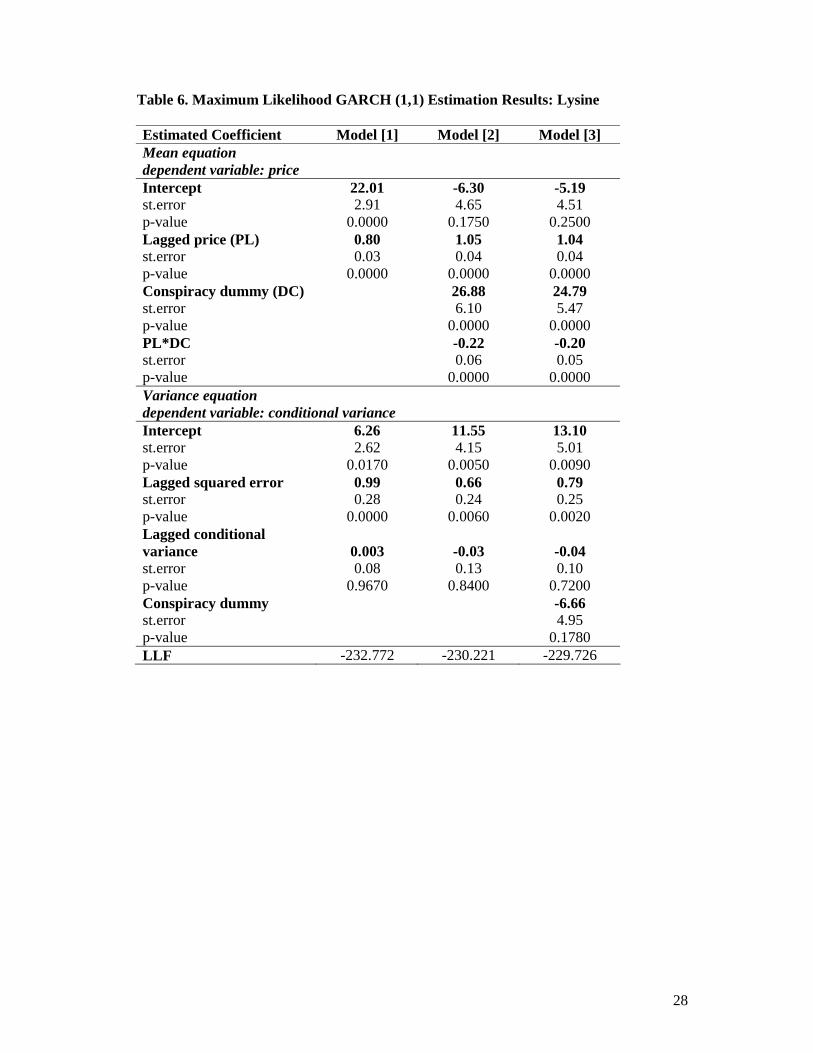
Lysine. To examine the impact of the lysine conspiracy on price behavior we used
methods similar to the citric acid case. According to the estimation results, the ARCH(1)
effect is stronger and the GARCH(1,1) is weaker in the case of the lysine conspiracy than
in the case of the citric acid conspiracy. In the ARCH(1) case the estimated coefficient for
the lagged squared error term is positive and statistically significant at the 1 percent level in
all three models. The estimated coefficient for the conspiracy dummy variable in the mean
equation is 25.73 and has a p-value of 0.0000. The estimated coefficient for the interaction
effect between the conspiracy dummy variable and the lagged price is negative and has a p-
value equal to 0.0000 as well. The ARCH(1) estimation results suggest that the lysine
conspiracy increased the price by 25.52 cents per pound. In the variance equation the
estimated coefficient for the conspiracy dummy variable is negative as expected, but it is
not statistically significant with a p-value equal to 0.2190. The estimation results obtained
using the GARCH(1,1) procedure show similar magnitude and direction of effect in the
estimated coefficients. According to the GARCH(1,1) estimation results the conspiracy
effect on the market price was 24.59 cents per pound. The lagged squared error term is
statistically significant at an acceptable level. The lagged conditional variance is not
statistically significant at an acceptable Type 1 error probability. In summary, in the case of
lysine we find support for both hypotheses. The mean price was higher and the variance
was lower during conspiracy periods relative to the periods when this conspiracy was not
effective.
17
Conclusion
We used extensions of traditional ARCH and GARCH models to examine the difference in
the behavior of the first two moments of the price distribution (mean and variance) during
collusive and non-collusive periods using prices from two recently discovered conspiracies,
citric acid and lysine. We expect that successful collusion increases the mean price and
decreases its variance relative to the pre-cartel and post-cartel periods. Thus, the change in
the price behavior confirmed by the changes in the first two moments of the price
distribution may indicate the presence of collusive behavior on the market.
For the lysine prices we find support for both the mean and variance hypotheses.
Citric acid prices support the mean price hypothesis and fail to support the variance
hypothesis. The citric acid conspiracy resulted in a statistically significant price increase of
approximately 9 cents per pound relative to the pre-cartel and post-cartel periods. The
lysine conspiracy managed to raise the price by approximately 25 cents per pound relative
to the pre-cartel and post-cartel periods and a sub-period when the conspiracy was not
effective. In addition, the variance of prices during the lysine conspiracy was lower than
the variance of prices during the pre-cartel and post-cartel periods. In contrast, the variance
of the citric acid prices during the conspiracy was higher relative to the pre-cartel and post-
cartel periods. There may be at least two explanations for the unexpected variance
behavior. First, the length of the citric acid conspiracy is longer than the lysine conspiracy.
Thus, it could be more difficult for the cartel to supervise and enforce cartel discipline
during longer period of time. Possible opportunistic behavior of cartel members could
contribute to the variability in citric acid prices. In the lysine case we know that this
conspiracy was successful; cartel members followed the discipline in 90 percent of all
cases. Second, the data availability problem may have had an impact on the analysis
outcome. The number of available pre-cartel observations in the citric acid case is almost
18
half the number of available pre-cartel observations in the lysine case and less than the
number of observations available for the cartel period. Thus, prices may appear to be more
volatile during conspiracy.
The results of our study have implications for both antirust policy and court
decision-making dealing with illegal cartel conduct. In particular, the econometric
technique employed can be used to test for the presence of collusive behavior in markets
where collusion is likely to take place. Thus, it may be used in the screening analysis
conducted by antitrust authorities. It may be also used as an alternative to the econometric
models commonly employed in court proceedings to quantify the effect of conspiracy on
market price. An advantage of using the ARCH and GARCH models is that they require
relatively small samples of the price for a cartelized product before, during and after the
hypothesized or known conspiracy.
19
References
Asch, P. and J.J Seneca. “Is Collusion Profitable?” The Review of Economics and
Statistics. Vol. LVIII, February 1976, No.1: 1-12.
Bollerslev, T. “Generalized Autoregressive Conditional Heteroscedasticity,” Journal of
Econometrics, 31, 1986: 307-327.
Connor, John M. Archer Daniels Midland: Price-Fixer to the World. 4th edition. Staff
Paper 00-11, December 2000. Department of Agricultural Economics, Purdue
University, West Lafayette, IN. Available on AGECON Search.
http://agecon.lib.umn.edu/cgi-bin/pdf_view.pl?paperid=2871&ftype=.pdf
(visited 03/27/2005).
___________. Collusion and Price Dispersion. Staff Paper, 2004. Purdue University, West
Lafayette, IN.
http://agecon.lib.umn.edu/cgi-bin/pdf_view.pl?paperid=15553&ftype=.pdf
(visited 03/27/2005).
_____________. “Our Customers Are Our Enemies”: The Lysine Cartel of 1992-1995.
Review of Industrial Organization, 18, 2001a: 5-21.
______________. Global Price Fixing: Our Customers are the Enemy. Studies in Industrial
Organization. Volume 24. Kluwer Academic Publishers. 2001b.
____________. “The Global Citric Acid Conspiracy: Legal-Economic Lessons.”
Agribusiness. Vol. 14, No. 6, 1998a: 435-452.
___________. What Can We Learn from the ADM Global Price Conspiracies? Staff
Paper, #98-14, August 1998b, Department of Agricultural Economics, Purdue
University, West Lafayette, IN.
http://agecon.lib.umn.edu/cgi-bin/pdf_view.pl?paperid=932&ftype=.pdf
(visited 03/27/2005)
20
Dick, A.R. “Identifying Contracts, Combinations and Conspiracies in Restraint of Trade.”
Managerial and Decision Economics. Vol. 17, March/April 1996: 203-216.
_________ “When are Cartels Stable Contracts?” Journal of Law and Economics. Vol.
XXXIX, April 1996: 241-283.
Ellison, G. “Theories of Cartel Stability and the Joint Executive Committee.” RAND
Journal of Economics. Vol. 25, No.1, Spring 1994: 37-57.
Engle, R.F. “Autoregressive Conditional Heteroscedasticity with Estimates of the Variance
of United Kingdom Inflation,” Econometrica, Vol. 50, No. 4, July 1982: 987-1008.
Genesove D. and W.P. Mullin. “Rules, Communication, and Collusion: Narrative
Evidence from the Sugar Institute Case.” The American Economic Review, Vol.91,
No.3, June 2001: 379-398.
Green, E.J. and R.H. Porter. “Noncooperative Collusion Under Imperfect Price
Competition.” Econometrica. Vol.52, 1984: 87-100.
Hamilton, J. Time Series Analysis. Princeton University Press, 1994.
Mittelhammer R.C., G.G. Judge, and D.J. Miller. Econometric Foundations. Cambridge
University Press. 2000.
Perron, Pierre. “The Great Crash, the Oil Price Shock, and the unit Root Hypothesis,”
Econometrica, Vol. 57, No. 6, November 1989: 1361-1401.
Porter, Robert H. “A Study of Cartel Stability: the Joint Executive Committee, 1880-
1886,” Bell Journal of Economics, 14, 1983: 301-314.
Rotemberg, G.G. and G. Saloner. “A Supergame-Theoretic Model of Price Wars During
Booms.” American Economic Review. Vol. 76, 1986: 390-407.
Sproul, Michael F. “Antitrust and Prices.” Journal of Political Economy, Vol. 101, No. 4,
1993: 742-754.
21
Stigler, G.J. “A Theory of Oligopoly.” The Journal of Political Economy. Vol.72, No.1,
February 1964: 33-61.
__________ “The Economics of Information.” The Journal of Political Economy LXIX,
No 3, June 1961: 213-225.
White, Lawrence J. “Lysine and Price Fixing: How Long? How Severe?” Review of
Industrial Organization, 18, 2001: 23-31.
Wooldridge, Jeffrey M. Econometric Analysis of Cross Section and Panel Data. MIT
Press, 2002.

22
Appendix
Chart 1.
Citric Acid Prices: February 1990 - March 1997
50
55
60
65
70
75
80
85
290
790
1290
591
1091
392
892
193
693
1193
494
994 295 795129
5596
1096
397
month/year
cent
s pe
r pou
nd
23
Chart 2.
Lysine Prices: January 1990 - April 1996
30
50
70
90
110
130
150
0190
0590
0990
0191
0591
0991
0192
0592
0992
0193
0593
0993
0194
0594
0994
0195
0595
0995
0196
0596
month/year
cent
s pe
r pou
nd
24
Table 1. Descriptive Statistics: Citric Acid Prices Period N Mean Variance Skewness Kurtosis Pre-Cartel 02/90-6/91 17 65.35 20.24 0.65 -0.92 Cartel 07/91-06/95 48 75.96 25.66 -1.41 1.62 Post-Cartel 07/95-04/97 22 72.91 4.09 0.33 -0.41 Sample 02/90-04/97 87 73.11 35.22 -0.66 -0.44 Table 2. Descriptive Statistics: Lysine Prices Period N Mean Variance Skewness Kurtosis Pre-Cartel 01/90-07/92 31 102.90 263.22 -0.70 0.16 1st period 08/92-03/93 8 90.13 96.70 -1.43 1.71 Cartel lapse 04/93-07/93 4 70.50 59.67 -0.17 -4.41 2nd period 08/93-06/95 23 110.30 73.04 -0.94 1.01 Post-Cartel 07/95-06/96 12 102.50 90.45 -0.22 -1.66 Sample 01/90-06/96 78 102.05 234.62 -0.78 0.17
25
Table 3. Maximum Likelihood ARCH (1) Estimation Results: Citric Acid Estimated Coefficient Model [1] Model [2] Model [3] Mean equation dependent variable: price Intercept 3.74 2.23 2.22 st.error 2.58 4.02 3.45 p-value 0.1480 0.5790 0.5200 Lagged price (LP) 0.95 0.96 0.96 st.error 0.04 0.06 0.05 p-value 0.0000 0.0000 0.0000 Conspiracy dummy (DC) 8.81 9.15 st.error 5.49 5.36 p-value 0.1090 0.0880 LP*DC -0.10 -0.11 st.error 0.08 0.07 p-value 0.1760 0.1450 Variance equation dependent variable: squared error Intercept 3.40 2.85 2.06 st.error 0.70 0.59 0.61 p-value 0.0000 0.0000 0.0010 Lagged squared error 0.14 0.16 0.15 st.error 0.15 0.15 0.15 p-value 0.3520 0.2780 0.3130 Conspiracy dummy 1.49 st.error 0.99 p-value 0.1340 LLF -180.399 -174.348 -173.19
26
Table 4. Maximum Likelihood GARCH (1,1) Estimation Results: Citric Acid Estimated Coefficient Model [1] Model [2] Model [3] Mean equation dependent variable: price Intercept 3.99 2.45 2.84 st.error 2.53 3.92 3.33 p-value 0.1150 0.5330 0.3940 Lagged price (LP) 0.95 0.96 0.95 st.error 0.03 0.06 0.05 p-value 0.0000 0.0000 0.0000 Conspiracy dummy (DC) 8.58 9.00 st.error 5.22 4.78 p-value 0.1000 0.0600 LP*DC -0.10 -0.10 st.error 0.07 0.07 p-value 0.1670 0.1100 Variance equation dependent variable: conditional variance Intercept 6.11 4.82 3.33 st.error 2.57 1.60 1.18 p-value 0.0170 0.0030 0.0050 Lagged squared error 0.09 0.15 0.23 st.error 0.10 0.11 0.13 p-value 0.3430 0.1850 0.0870 Lagged conditional variance -0.68 -0.61 -0.49 st.error 0.56 0.37 0.27 p-value 0.2250 0.0950 0.0710 Conspiracy dummy 1.27 st.error 1.20 p-value 0.2900 LLF -179.693 -173.332 -172.284
27
Table 5. Maximum Likelihood ARCH (1) Estimation Results: Lysine Estimated Coefficient Model [1] Model [2] Model [3] Mean equation dependent variable: price Intercept 22.07 -6.58 -5.71 st.error 2.89 4.65 4.60 p-value 0.0000 0.1570 0.2150 Lagged price (LP) 0.80 1.05 1.04 st.error 0.03 0.04 0.04 p-value 0.0000 0.0000 0.0000 Conspiracy dummy (DC) 27.24 25.73 st.error 6.15 5.66 p-value 0.0000 0.0000 LP*DC -0.23 -0.21 st.error 0.06 0.05 p-value 0.0000 0.0000 Variance equation dependent variable: squared error Intercept 6.31 10.97 12.12 st.error 2.31 2.96 3.92 p-value 0.0060 0.0000 0.0020 Lagged squared error 0.99 0.65 0.76 St.error 0.26 0.23 0.25 p-value 0.0000 0.0050 0.0020 Conspiracy dummy -5.82 st.error 4.74 p-value 0.2190 LLF -232.77 -230.254 -229.799
28
Table 6. Maximum Likelihood GARCH (1,1) Estimation Results: Lysine Estimated Coefficient Model [1] Model [2] Model [3] Mean equation dependent variable: price Intercept 22.01 -6.30 -5.19 st.error 2.91 4.65 4.51 p-value 0.0000 0.1750 0.2500 Lagged price (PL) 0.80 1.05 1.04 st.error 0.03 0.04 0.04 p-value 0.0000 0.0000 0.0000 Conspiracy dummy (DC) 26.88 24.79 st.error 6.10 5.47 p-value 0.0000 0.0000 PL*DC -0.22 -0.20 st.error 0.06 0.05 p-value 0.0000 0.0000 Variance equation dependent variable: conditional variance Intercept 6.26 11.55 13.10 st.error 2.62 4.15 5.01 p-value 0.0170 0.0050 0.0090 Lagged squared error 0.99 0.66 0.79 st.error 0.28 0.24 0.25 p-value 0.0000 0.0060 0.0020 Lagged conditional variance 0.003 -0.03 -0.04 st.error 0.08 0.13 0.10 p-value 0.9670 0.8400 0.7200 Conspiracy dummy -6.66 st.error 4.95 p-value 0.1780 LLF -232.772 -230.221 -229.726