the impact of child labor and school quality on academic ...ftp.iza.org/dp4062.pdf · the impact of...
TRANSCRIPT
IZA DP No. 4062
The Impact of Child Labor and School Quality onAcademic Achievement in Brazil
Márcio Eduardo G. BezerraAna Lúcia KassoufMary Arends-Kuenning
DI
SC
US
SI
ON
PA
PE
R S
ER
IE
S
Forschungsinstitutzur Zukunft der ArbeitInstitute for the Studyof Labor
March 2009
The Impact of Child Labor and School Quality on Academic
Achievement in Brazil
Márcio Eduardo G. Bezerra Universidade de Sao Paulo
Ana Lúcia Kassouf Universidade de Sao Paulo
Mary Arends-Kuenning
University of Illinois at Urbana-Champaign and IZA
Discussion Paper No. 4062 March 2009
IZA
P.O. Box 7240 53072 Bonn
Germany
Phone: +49-228-3894-0 Fax: +49-228-3894-180
E-mail: [email protected]
Any opinions expressed here are those of the author(s) and not those of IZA. Research published in this series may include views on policy, but the institute itself takes no institutional policy positions. The Institute for the Study of Labor (IZA) in Bonn is a local and virtual international research center and a place of communication between science, politics and business. IZA is an independent nonprofit organization supported by Deutsche Post Foundation. The center is associated with the University of Bonn and offers a stimulating research environment through its international network, workshops and conferences, data service, project support, research visits and doctoral program. IZA engages in (i) original and internationally competitive research in all fields of labor economics, (ii) development of policy concepts, and (iii) dissemination of research results and concepts to the interested public. IZA Discussion Papers often represent preliminary work and are circulated to encourage discussion. Citation of such a paper should account for its provisional character. A revised version may be available directly from the author.
IZA Discussion Paper No. 4062 March 2009
ABSTRACT
The Impact of Child Labor and School Quality on Academic Achievement in Brazil*
We analyze the impact of child labor on school achievement using Brazilian school achievement test data from the 2003 Sistema Nacional de Avaliação da Educação Básica (SAEB). We control for the endogeneity of child labor using instrumental variable techniques, where the instrumental variable is the average wage for unskilled male labor in the state. Using our preferred OLS estimates, we find that child labor causes a loss in students’ school achievement. Children and adolescents who do not work have better school performance than students who work. Up to two hours of work per day do not have a statistically significant effect on school performance, but additional hours decrease student’s achievement. Differences in work conditions affect school performance. For high school students in Portuguese, compared to students who have schooling as their only activity, students who work only at home score 4 percent lower on the tests. Those students who only work outside the house are worse off than those who only work within the house, with test scores decreasing by 5 percent. Students who work both inside and outside the house have the lowest test scores of all the working conditions, decreasing by up to 7 percent. JEL Classification: I21, J13, J22, O15 Keywords: child labor, school achievement, Brazil Corresponding author: Mary Arends-Kuenning Department of Agricultural and Consumer Economics University of Illinois at Urbana-Champaign 408 Mumford Hall MC-710 1301 W. Gregory Urbana, IL 61801 USA E-mail: [email protected]
* Paper prepared for the seminar on the Quality of Education in Latin America, Universidad Iberoamericana, Mexico City, February 2007. An earlier version of this paper was presented at the Population Association of America annual meetings, Los Angeles, CA, April 2006. We thank Susan Parker for her helpful comments.
2
1. Introduction
In recent years, Brazil has experienced an impressive decline in child labor.
According to the national household survey, the Pesquisa Nacional de Amostra por
Domicilios (PNAD), in 1992, about 15 percent of Brazilian children aged 5 to 15 worked,
compared to 8 percent in 2005 (IBGE 2005). With respect to educational indicators such
as illiteracy rates and years of schooling, Brazil still lags behind other Latin American
countries. However, during the 1990s, school attendance increased, principally in
primary school and for students aged 7 to 14. In 1992, 87 percent of the children aged 7
to 14 attended school. By 2005, this percentage reached 97 percent (IPEA 2005).
A possible reason why Brazil continues to lag other countries in school
achievement despite the increases in school attendance is that a high percentage of
students work while they attend school. According to the 2003 PNAD data, of Brazilian
children aged 7 to 15, 88.1 percent only study, 1.0 percent work and do not study, 8.4
percent combine work with study, and 2.6 percent neither work nor study.1
This study contributes to the literature by analyzing the direct impact of child
labor on the academic progress of students as measured by standardized achievement
tests. Authors such as Gunnarsson et al. (2004), Psacharopoulos (1997), Heady (2003),
Akabayashi e Psacharopoulos (1999), Stinebrickner and Stinebrickner (2003) studied the
effect of early child labor on student achievement test scores. However, this study differs
This statistic
shows that there are a significant number of children and adolescents who continue to
divide their time between working and studying, which could harm their school
achievement.
1 In the 2003 PNAD, the rural populations of the states of Rondônia, Acre, Amazonas, Roraima Pará and Amapá in the Northern region of Brazil are not included.
3
from previous studies because we investigate how the number of hours worked by young
people might harm student learning. In addition, we find that student performance is
affected differently by work conducted inside the household than by work in the labor
market.
Estimating the relationship between child labor and schooling is complicated
because students who work might do poorly in school, but poor performance in school
can also lead to families deciding that children should invest more time in work. School
characteristics, family characteristics, and individual characteristics all affect both child
labor and school achievement. We address the issue of causality through using the
instrumental variable of low-skilled wages, which affect child labor without directly
affecting school achievement. We control for school characteristics using a rich set of
variables available from a school census. A novel aspect of this paper is the use of
controls for individual students’ motivation in the regression analyses.
2. Data
The Ministry of Education (MEC) through INEP makes available educational
statistics to measure the quality of the Brazilian primary school system. The Sistema
Nacional de Avaliação da Educação Básica (SAEB) (National system of basic education
evaluation) was started in 1990 and since 1995 has administered a national standardized
test every two years.
The data set used in this study is from SAEB, (INEP, 2003), which makes
available microdata that include standardized test scores in Portuguese and Mathematics
for students in the 4th and 8th grades of ensino fundamental (primary school) and the third
year of ensino médio (secondary school) in public and private schools. The SAEB data
4
set includes information about students’ study habits, students’ sociocultural
characteristics, the characteristics and teaching practices of teachers and school
administrators, managerial mechanisms, and school infrastructure.
The SAEB is collected from a representative sample of the population of students
who are enrolled in the three grades of interest in the schools chosen to participate in the
School Census.2
SAEB administered standardized, multiple-choice exams designed to measure
students’ abilities and capacities in Portuguese (with a focus on reading comprehension)
and Mathematics.
This sample is stratified by the following criteria: grade, state of
residence, whether the school is public or private, location of school (state capital city,
large cities defined as greater than 200,000 habitants, small cities), and size of school. In
2003, approximately 300,000 students, 17,000 teachers, and 6,000 administrators in
6,270 schools participated in the SAEB, covering all 26 states plus the Federal District
(INEP/SAEB 2005). In this study, we include the data for eighth grade and the third
year of high school, because few fourth graders work. Data are only available for
students who live in urban areas because rural schools are not included in the sample for
these higher-grade levels.
3
2 The School Census is a national and annual undertaking, covering basic education at different levels (preschool, primary, and secondary schooling) and types (regular, special, and youth and adult education). It provides a data base with educational information about all the school establishments involved in basic education, both public and private. 3 More detailed descriptions about the learning competencies and abilities can be found in the research paper SAEB in INEP (2002).
The exam scores are mapped into cumulative performance scales,
implying that students who are placed at a given level are competent at the skills required
at the previous levels of the scale. Based on percentage scales, SAEB classifies students
5
into five levels of achievement in Portuguese and in Mathematics—very critical, critical,
intermediate, adequate, and advanced.
3. The econometric model
To analyze the effect of child labor on student school achievement test scores, we
use two estimation methods—ordinary least squares and two-stage least squares. In
addition to analyzing whether the student works or not, the analyses also consider the
number of hours worked and the work conditions, specifically whether the student only
works, studies and works only at home, studies and works only outside the home, or
studies and works in both locations. The hours of work and work conditions have
important impacts on students’ achievement because they determine how much time
students can spend on school activities.
To obtain an estimate of the impact of child labor on school performance, control
variables are included such as the individual characteristics of the student and of the
family environment, characteristics of the school including the quality of school
infrastructure, and the supply of educational services, geographic characteristics of the
schools, and, uniquely, controls for the student’s motivation to study. These factors have
been shown to affect both child labor and school achievement (Barros and Mendonca
1996, Psacharopoulos 1997, Cavalieri 2000, Gunnarsson et al., 2004, Soares 2002).
The dependent variables are the Portuguese and Mathematics test scores, which
are continuous variables, for each grade that is evaluated. The test score can vary,
theoretically, from 0 to 500 points. However, according to INEP, no students obtained
the scores at the limits of the interval (values of 0 and 500 points). Therefore, the use of
OLS rather than a tobit model is appropriate.
6
The model to measure the effect of early labor on the students’ school
performance is as follows:
issiiii GEMXLD ελθρδβα ++++++= , ni ,....,1= , Ss ,....,1= (9)
Where D is the dependent variable that represents the school achievement test score of
each student i in Mathematics or Portuguese in the 8th grade of primary school and the
third year of secondary school. The exogenous variables are represented by Li, which
refers to the information about child labor for each student i, Xi, which are the individual
and family characteristics of students, Mi, which are the variables that proxy for students’
motivation to study, E, which represents the schools’ infrastructure and educational
resources for each school, s, and G, which are the geographic aspects of each school s. In
addition, there is an error term ε, which represents the unobservable characteristics that
affect learning achievement and that are not captured by the specified variables.
The primary purpose of this work is to identify the effect of child labor on school
achievement, obtained with the estimated parameter β . We expect that
0<∂∂
LD , (10)
Or, the more that the child works, the lower is school achievement.
Authors like Heady (2003) and Gunnarsson et al. (2004) note the possibility that
an endogeneity problem exists between child labor and school achievement. It is difficult
to determine the true impact of work on school performance because factors that
encourage children to work are the same factors that discourage school attendance.
7
For example, working leaves children with fewer hours to spend in school or
study. Another point is that children who are doing well in school might be more
motivated to study and might know how to use their time efficiently than children who do
poorly. These characteristics are also related to child labor so that differences in
achievement might be erroneously related to child labor instead of underlying
characteristics. Also, doing poorly in school might cause students to leave school and
start working early. Finally, schools with little infrastructure and low teaching quality
discourage students from only studying and increase the probability that students work.
To correct for the endogeneity problem, we treat the variables indicating whether
the child works or not and indicating hours worked as endogenous and apply instrumental
variables techniques. O’Donnell et al. (2003) suggested using variables that reflected the
local labor market conditions as instruments for child labor. The instrumental variable
we use is the average unskilled wage earned in the state where the child resides, which is
defined as the average wage earned by male workers aged 20 to 30 who have less than
primary education. This variable is expected to affect the probability that a child works
and the number of hours worked, but not to affect a child’s achievement test scores
except through child work. Duryea and Arends-Kuenning (2003) found that child labor
responded to state-level unskilled wages, which were defined similarly.
For the case in which aiL in equation (9) is the endogenous variable hours of
work, the two-stage least squares procedure is performed in a multiple regression model
because both the endogenous variable and the dependent variable are continuous. In the
case of the variable that indicates whether the child works or not, we have a continuous
variable (school achievement) and a dichotomous variable (work or not). In this case, we
8
use a technique based on Maddala (1983) where the probability that the student
participates is estimated using a probit. The resulting estimated probabilities are then put
in the equation for school achievement, which is estimated by least squares.
The variables that capture the type of work (domestic work, work outside the
household or both) are also potentially endogenous. We do not estimate the predicted
values of these variables with two-stage least squares because this would involve
including several binary variables as independent variables with a continuous dependent
variable. We argue below that it is appropriate to treat the type of work as exogenous
because Hausman tests for the regressions with the variables indicating whether the child
works or not and the number of hours fail to reject exogeneity.
4. Descriptive results for the relationship between school performance and child
labor
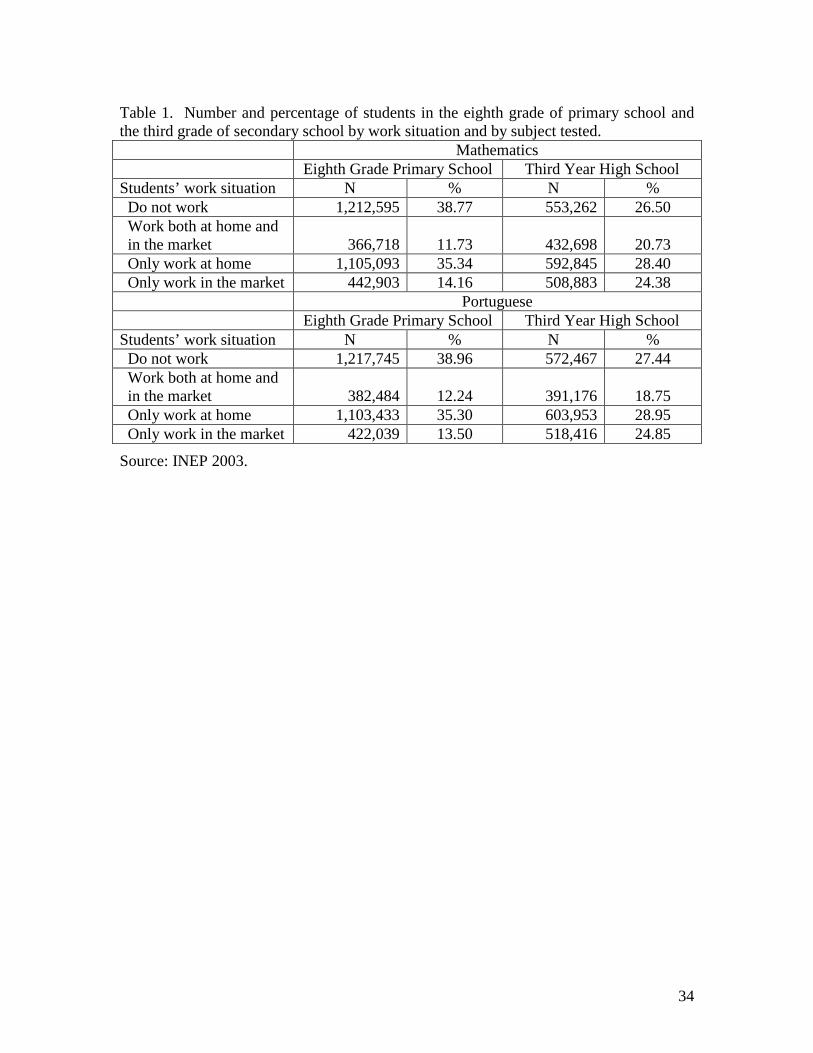
Table 1 presents descriptive statistics for adolescents in the 8th grade of primary
school and in the third year of secondary school, by subject and by work situation. Note
that in both the Mathematics and the Portuguese samples, children enrolled in the higher
grade are more likely to be working outside the household or combining work outside the
household with domestic work than those enrolled in the lower grade. As children get
older, the opportunity cost of staying out of the labor market increases.
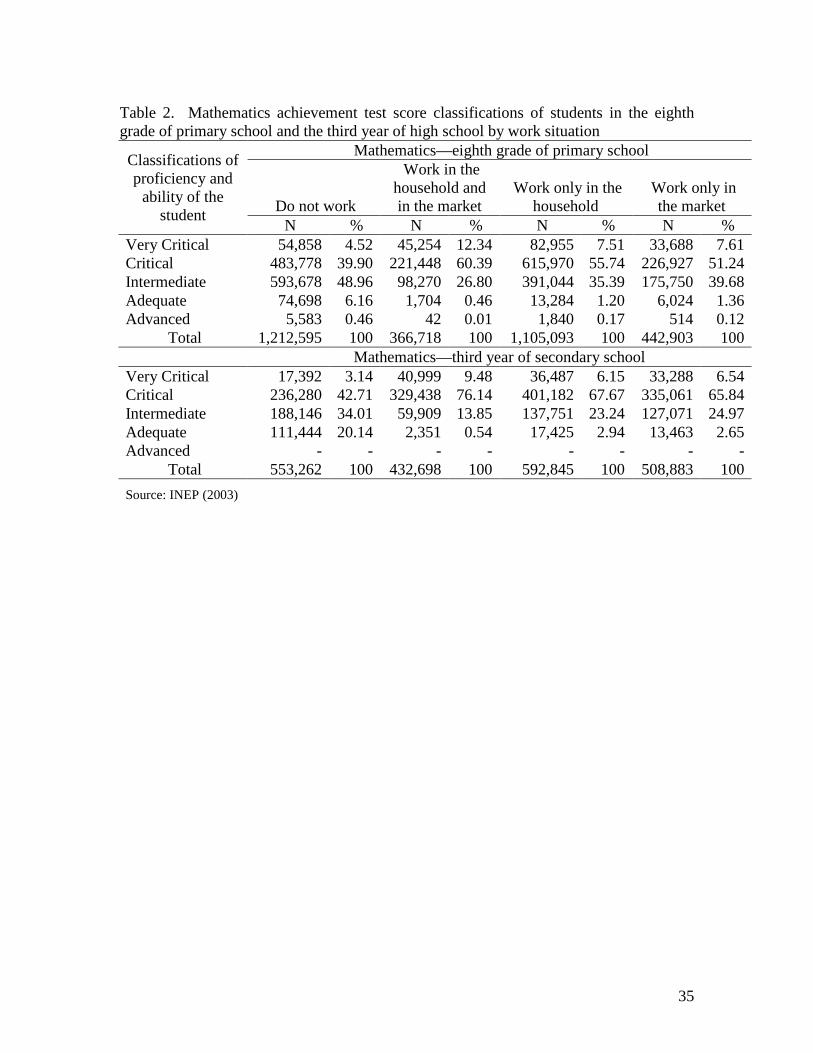
Table 2 presents descriptive information about students’ achievement by subject,
by grade, and by work situation. A striking feature of the table is the low level of
achievement that is demonstrated by students regardless of work situation.
9
A higher proportion of students who were not working achieved a superior score
on the exams compared to students who worked. Table 2 shows that of the students in
the two grades who were tested in Mathematics who did not work, more than 54 percent
tested at the levels of intermediate, adequate, and advanced, despite the high number of
students who tested below intermediate at the levels of critical and very critical.
In the group of students who worked, academic performance was much worse.
More than 60 percent of the students in the two grades who worked, regardless of work
situation, scored at the levels of critical and very critical. The result suggests that
working and studying simultaneously can hinder the acquisition and development of
knowledge. The worst achievement test scores are found for those students who work
both inside the household and outside in the job market. The students who work only in
the household or only outside the household have similar levels of academic
achievement. In Mathematics for those in eighth grade and those in the third year of high
school, those who work only in the household have slightly worse achievement test
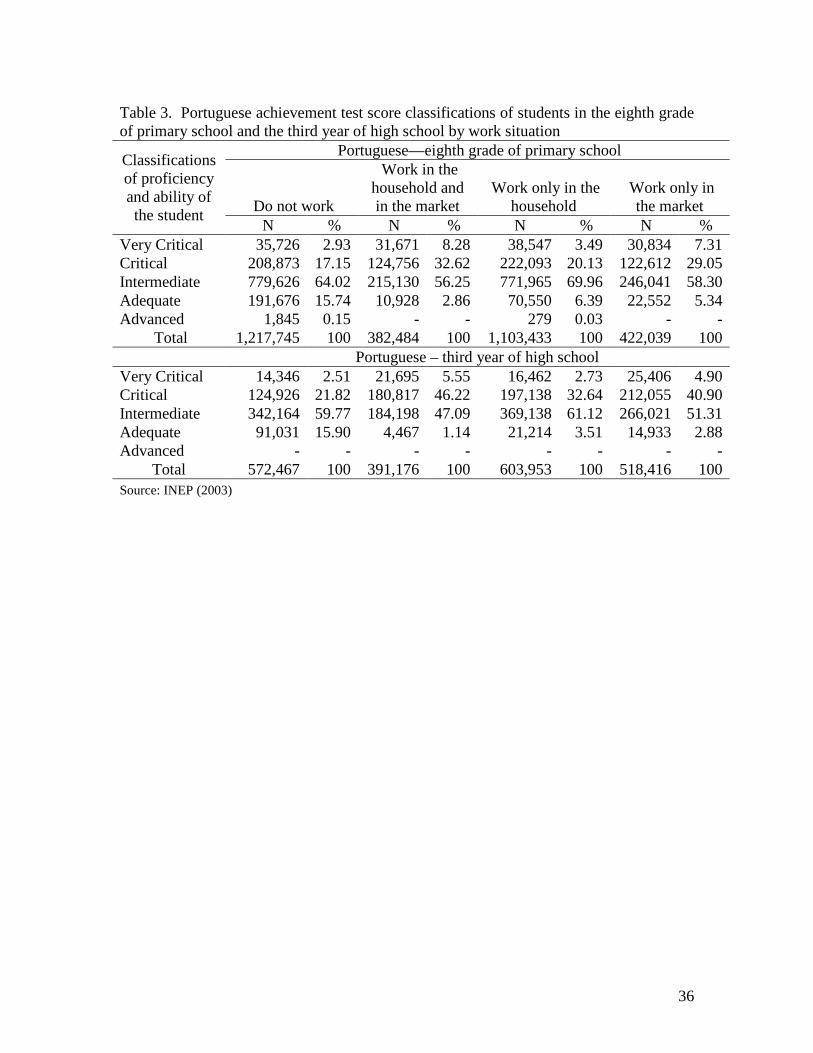
scores than those who work only in the market. Similar results for Portuguese exams are
found in Table 3.
Among the students who were working, those who worked both in the household
and in the market showed worse test performance in all the evaluated grades than the
other work situations. Those students who worked only outside the household did worse
than students who worked only within the household. An explanation for these
differences according to work situation could be that individuals who work in both
situations or only outside the household worked more hours or worked more intensely
during each hour worked than those who worked only at home, within a familiar
10
environment. Results where the statistics presented in Table 3 are broken down by
gender (not shown) show that the difference is not due to gender differences; both males
and females have lower test scores when they work only outside the household than when
they work only inside the household.
5. Results and Discussion
In this section, we present regression results to estimate the effect of child labor
on children’s school achievement. The regressions include weights based on sample
expansion factors.
For each grade and both subjects, three regressions are presented. Child labor is
indicated in three different ways—in the first regression as a dichotomous variable
indicating whether the child works or not, in the second regression as the number of
hours worked, and in the third regression as dummy variables indicating whether the
child works inside the household or in the market. All regressions include controls for
individual and family characteristics, school characteristics, and student motivation. The
student motivation variables attempt to capture the preferences of students for studying in
order to minimize omitted variable problems. Inclusion of these variables also helps to
eliminate the endogeneity problem brought about by the correlation between student
preferences, child labor, and school achievement. We then present the results using
instrumental variable techniques. For the regressions including hours of work as the
measure of child labor, the results of Hausman tests are also presented to compare the
OLS estimates with the 2SLS estimates.
11
Descriptive analysis of the variables
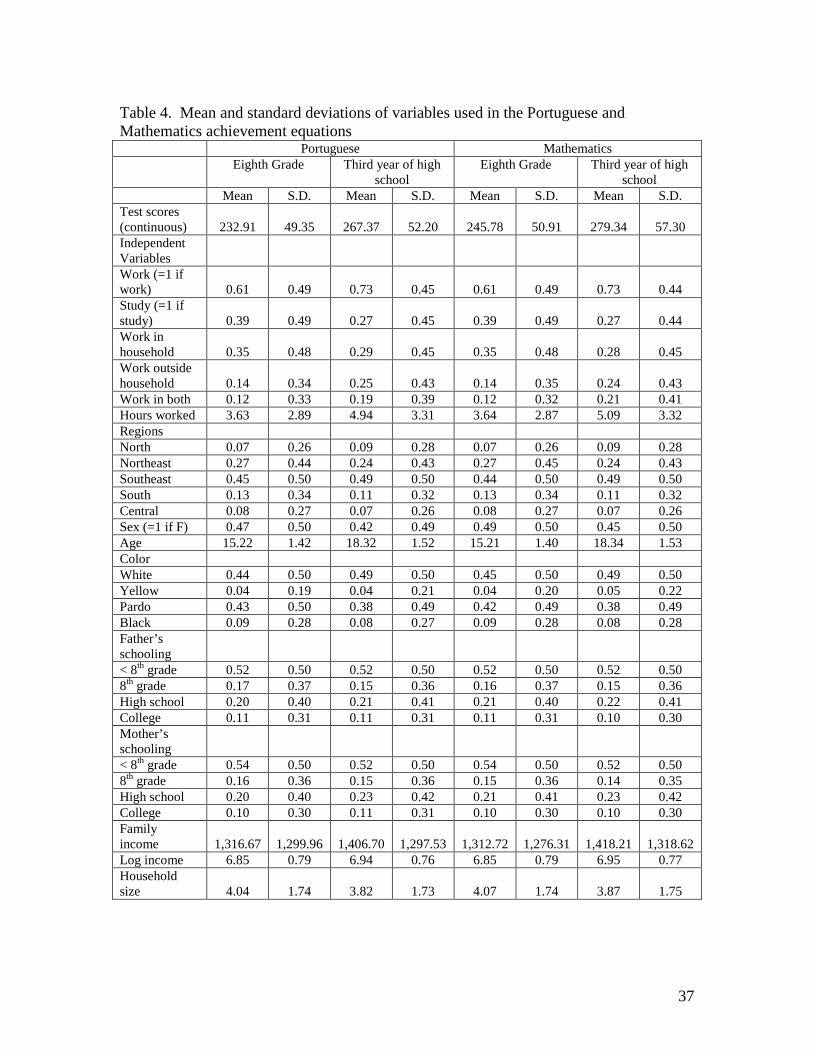
In Table 4, for each variable included in the model estimation, the means and
standard deviations are presented, weighted by the sample expansion factor of the 2003
SAEB. The statistics are given for each grade and each subject evaluated.
The average student achievement score was less than adequate when compared to
the standards set by SAEB. In the eighth grade, the average achievement test score of
Mathematics students was 246 points, considered the intermediate level according to the
achievement scales devised by SAEB. By the 3rd year of high school, the average
achievement test score of students is considered to be at the critical level, given the
average of 279 points.
Almost 39 percent of the students in eighth grade and almost 27 percent of the
students in the third year of high school respond that they did not work more than one
hour per day and are therefore classified as non workers (only study). The rest of the
students work and are classified as working only in the household, working outside the
household, or as working in both locations. The majority of students who work do so
only in the household (35 percent of eighth graders and 28 percent of those students in
the third year of high school), followed by those who work only outside the household
(14 percent and 24 percent, respectively) and those who work in both locations (12
percent and 21 percent, respectively).
Students in the higher grade level who report that they are working devote more
of their time to work than students in the lower grade level who work. Eighth grade
students who report working more than one hour per day work an average of 3.6 hours
per day and students in third year of high school who report working work an average of
12
5.1 hours per day. Therefore, if the work week is five days, eighth grade students who
work devote 18 hours per week on average to working and high school students in the
third year who work devote 25.5 hours per week on average to working. The results are
consistent with those of Kassouf (2002), which showed that the older the child was, the
higher the probability that the child was working and the less likely the child was
studying.
The majority of students in both grades are females, with males accounting for 49
percent of the students in eighth grade and 45 percent of the students in the third year of
high school who were tested in Mathematics. Considering grade-for-age, students on
average are one year older than the correct age for the grade in which they are enrolled.
In eighth grade, students have an average age of about 15 years, and in the third year of
high school, the average age is approximately 18 years. Menezes-Filho (2003) found a
negative effect of age on school achievement when he analyzed the causes of the decline
in achievement scores that occurred between the SAEB exams administered in 1995 and
2001.
Of the total number of students in both grades who knew their parents’ schooling
level, over 50 percent had mothers and fathers who had not completed primary school (up
to eighth grade). Kassouf (2002) found that mothers’ schooling had a larger impact on a
children’s school attendance than fathers’ schooling. Ray and Lancaster (2004) also find
strong evidence of positive effects of adult schooling on children’s learning in the
countries studied.
The average monthly family income for eighth grade students was R$ 1,313 and
for students in the third year of high school, it was R$ 1,418. Because the SAEB data do
13
not include direct measures of income, the presence of goods such as televisions and
computers is used to impute income through a point system developed by Associação
Brasileira de Empresas de Pesquisa, a research organization that studies consumer
behavior (ABEP 2003). The imputed values of income from the SAEB data are greater
than the average monthly income of students in these grade levels estimated using the
PNAD data.4
The average number of people living in the same household is lower at the higher
grade level than at the lower grade level. Children in eighth grade live in households
Students enrolled in the higher grade level live in families with higher family
incomes. Higher family income is associated with higher demand for education in
Vietnam (Glewwe and Jacoby 2004), with higher school attendance in Pakistan and
Nicaragua (Rosati and Rossi 2003), and with higher achievement test scores in Brazil
(Albernaz et al. 2002). As children get older, those from poor families are more likely to
drop out of schooling, while children from rich families remain. We expect that income
has a positive and significant effect on students’ test scores.
A variable that often is found to be important in studies of child labor and
education is the number of people residing in the household. Household size was found
to have a negative and significant effect on the probability of being enrolled in the correct
grade-for-age in Peru (Patrinos and Psacharopoulos 1997) and to have a highly
significant and negative effect on the probability that a child attended school in Brazil
(Emerson and Portela 2002).
4 The value of monthly family income for all households (excluding the income of lodgers, domestic servants and their relatives, and children less than ten years old).
14
with an average of 4.07 residents, compared to children in the third year of high school,
who live in households with an average of 3.87 residents. Again, this is likely due to the
fact that poorer children from larger households are more likely to drop out of school
than richer children from smaller households.
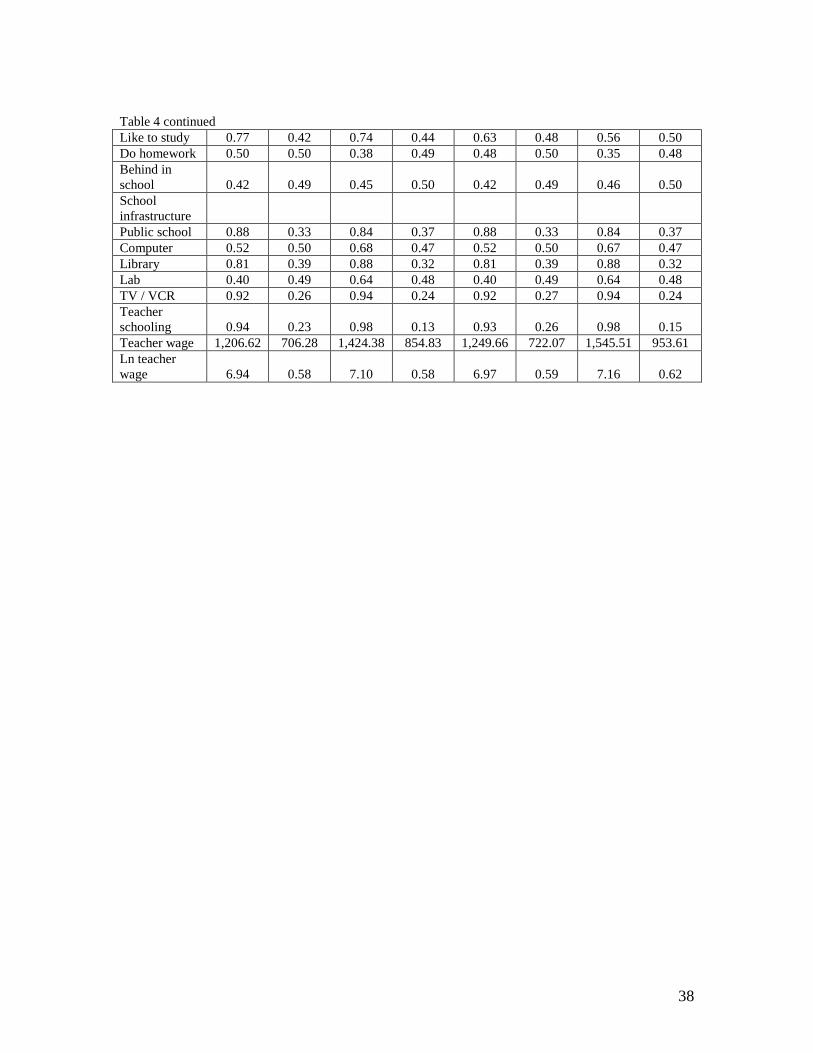
The SAEB data include information about students’ motivation to study. Student
motivation is an important determinant of student achievement, but is not considered in
most studies of the effect of child labor on school performance, leading to a potential
omitted variable bias. Heady (2003) and Gunnarsson et al. (2004) lamented the lack of
variables in their data to control for students’ natural abilities and motivation.
As students advance in grade level, they report lower levels of motivation to
study. Of the students in the eighth grade, 63 percent report that they enjoy studying
Mathematics, compared to 56 percent of the students in the third year of high school. Of
those students who do homework, only 48 percent of students in eighth grade report that
they always do their Mathematics homework, compared to only 35 percent of students in
the third year of high school.
An important issue for school performance is the relationship between students’
motivation and school delays. In eighth grade, about 42 percent of students are behind in
school and in the third year of high school, 46 percent of students are behind in school.
This variable reflects whether the student actually failed at least one grade or not. It
should be considered in combination with the age variable, which reflects whether the
student started late or not (after age 7 in Brazil) and how many times the student failed a
grade.
15
About 88 percent of eighth grade students and 84 percent of students in the third
year of high school who took the Mathematics exam attend public schools. The great
majority of classroom spaces for Brazilian children is found in the public schooling
sector.
Examining the impact of school conditions on children’s school achievement is of
considerable interest in Brazil because of recent policy initiatives designed to increase
school spending. Passed in 1996, Law no. 9.394/96, the Lei de Diretrizes e Bases da
Educação Nacional (LDB) set minimum levels of spending per child in school,
decentralized school decision-making authority, and set minimum teacher training levels.
The Fundo de Manutenção e Desenvolvimento do Ensino Fundamental e de Valorização
do Magistério (FUNDEF) provided special funding for school projects targeted to the
poorest regions of Brazil. The supply of educational resources (libraries, computers,
videocassette players, laboratories, etc.) influences school performance because they are
intended to help students to learn. At the same time, school infrastructure can influence
child labor because if school conditions are poor and discourage studying, children and
adolescents become interested in other activities (Barros et al. 2001, Pontili 2004, Rios-
Neto et al. 2002).
The descriptive statistics for students who took the Portuguese exam, also
presented in Table 4, were similar to those described for students who took the
Mathematics exam. Therefore, they are not discussed here.
Equations for Mathematics and Portuguese achievement: Least-squares estimates
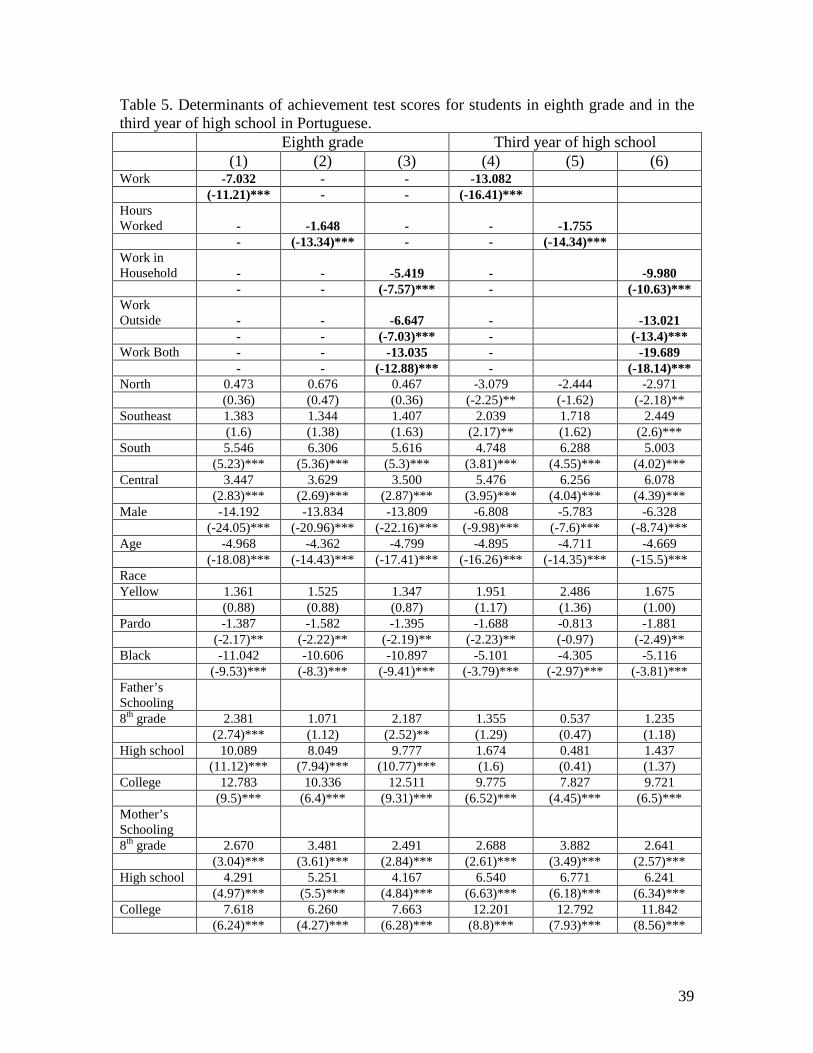
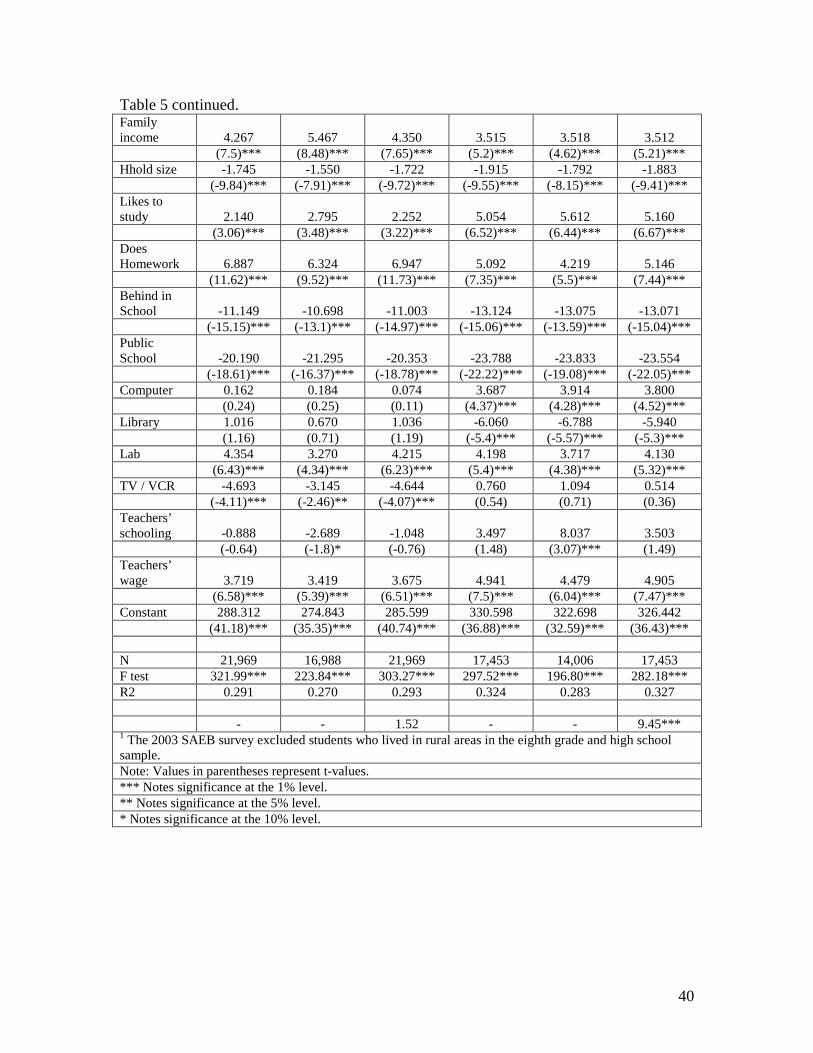
Tables 5 and 6 present the regression results where the outcome variable is school
achievement test scores. Columns (1), (4), (7), and (10) measure child labor with a
16
dummy variable indicating whether the child works or not. Columns (2), (5), (8), and
(11) measure child labor with the number of hours that a child works. Columns (3), (6),
(9), and (12) include variables that indicate whether the student only studies, studies and
works only at home, studies and works only outside the home and studies and works both
at home and outside the home.
The results presented in columns (1), (4), (7), and (10) show that when students
work, they obtain lower achievement test scores and that the effect is statistically
significant at the 1 percent level. In eighth grade, students who work obtain scores that
are 8.5 points lower in Mathematics and 7 points lower in Portuguese compared to
students who do not work. By the third year of high school, the disadvantage
experienced by students who work has widened, with students who work scoring 11.5
points lower in Mathematics and 13 points lower in Portuguese compared to students
who do not work.
As students increase the hours that they work, their achievement test scores
decrease(columns (2), (5), (8), and (11)). An additional hour of working lowers the
Mathematics exam score of students by 1.7 points in the eighth grade and by 1.6 points in
the third year of high school. In Portuguese, each hour worked lowers students’ test
scores by 1.6 points in eighth grade and by 1.8 points in the third year of high school.
Although the marginal effect of an additional hour is approximately equal for students in
the lower and the higher grade, high school students work longer hours (Table 4), so the
total negative effect of working on achievement test scores is greater for high school
students than for eighth grade students.
17
The final set of results presented in columns (3), (6), (9), and (12) show that the
location where children work has differential impacts on children’s achievement test
scores. In all cases, students who do not work have higher exam scores than students
who work, regardless of location. In addition, in all cases, the worst outcomes occur
when students work both outside and inside the home. Students who only work outside
the home tend to experience worse outcomes than those who only work inside the home,
with the exception of students in eighth grade taking the Mathematics exam. For these
students, working outside the household lowered the Mathematics exam score by 4.2
points, compared to a decrease of 8.4 points for students who only worked at home.
Those eighth-grade students who worked both at home and outside the home experienced
a decrease of 15.8 points on the Mathematics exam, representing about 6 percent of the
average score of 246 points (Table 4). All of the work location variables were
statistically significant at the 1 percent level, where the omitted category is not working.
The worst outcomes were found for high school students taking the Portuguese exam,
with those who worked only at home experiencing a decrease of 10 points relative to
those who did not work. Those who worked only outside the home experienced a
decrease of 13 points, and those who worked in both locations experienced a decrease of
20 points. Compared to the average of 267 points on the high school Portuguese exam,
students who worked in both locations scored about 7 percent lower on the exam.
The results for Tables 5 and 6 also include estimates of the impact of individual,
family, school characteristics on school achievement test scores. The individual and
family characteristics include sex, age, color or race, mother’s schooling, father’s
schooling, family income, and household size. Students’ academic motivation is
18
measured by variables indicating whether the student likes to study Portuguese and
Mathematics, whether the student does homework regularly, and whether the student is
behind the appropriate grade-for-age. School characteristics include whether the school
is public or private, school infrastructure, and average schooling levels and wages of
teachers. The regressions also include controls for whether the school is located in an
urban or rural area. The results for these individual, family, and school variables are not
affected by whether child labor is measured with a dummy variable, the number of hours
worked, or dummy variables indicating the location of work.
Looking at individual and family characteristics, female students tend to do better
in Portuguese than male students, and male students tend to do better in Mathematics
than female students. Older students enrolled in a grade have lower test scores than
younger students enrolled in the same grade. These students either started school late, or
failed at least one grade. White students (omitted category) have higher test scores than
students who are “yellow” (Asian), “pardo” (mixed race), or black.5
The estimated effects of the variables that measure student motivation are among
the largest and most statistically significant effects of the included independent variables.
Students who report that they like to study Mathematics and Portuguese and who always
Parents’ schooling,
especially mothers’ schooling, has a positive effect on students’ school achievement.
Children from families with higher family income have higher test scores than children
from poorer families. Family size has a modest, negative, and statistically significant
effect on test scores, with each additional family member lowering test scores by between
1.6 and 1.9 points.
5 These racial terms are the official terms of the Brazilian government.
19
do the homework that their teachers assign have higher test scores than students who are
not similarly motivated. At the same time, students who report that they have been held
back in school at least one year obtain lower test scores than students who have not
experienced any delays in their progress through school and the effect is highly
statistically significant.
Omitting the variables that control for students’ motivation could result in an
overestimate of the negative impact of child labor on school achievement. We ran the
regressions omitting the motivation variables and found that in some cases, the
magnitudes of the negative coefficients on child labor increased and in other cases, the
estimated effects of child labor did not change (results not shown, but available from the
authors upon request).
It is important to recognize that when a student does not perform well in school
and obtains poor grades, that student is likely to become disinterested in school and to
become interested in other occupations. In other words, although we include some
controls for motivation, endogeneity might still be present between child labor variables
and motivation variables omitted from this study.
The estimated coefficients for the region variables indicate that students’
performance is better in the most developed regions of Brazil such as the Southeast and
South, in contrast to the less developed region of the Northeast, which is the omitted
category.
20
Impact of school characteristics on student achievement
The results for school quality presented in Tables 5 and 6 indicate that students in
the third year of high school obtain higher test scores if the school that they attend has a
computer. This result holds for both Portuguese and Mathematics, with students who
attend schools with computers improving their test scores by about 3.8 points in
Portuguese and about 3.1 points in Mathematics. These impacts are modest given the
mean achievement test scores in the sample. The mean of the Mathematics test score
variable is 246 points for eighth grade and 279 points for the third year of secondary
school. For Portuguese, the mean test score for eighth grade is 233 points and for the
third year of secondary school, 267 points (Table 4). For children in eighth grade, there
is no significant effect on test scores of attending a school with computers. Therefore,
computers appear to be more effective for learning in later grades than in earlier grades.
The result suggests an interesting hypothesis that perhaps computers are only beneficial
once students have mastered the basics of reading and writing.
Students who attend schools with laboratories have statistically significantly
higher test scores than students who attend schools without laboratories. This result is
consistent across the two grade levels and the two academic subjects. However, the
effect is modest and ranges from 2.2 points for eighth grade students’ Mathematics scores
to 4.4 points for eighth grade students’ Portuguese scores.
The effects of attending schools with libraries are mixed, with libraries having a
surprising negative and significant impact on students’ Portuguese scores in the third year
of high school, and a modest positive and significant impact on students’ Mathematics
scores in the eighth grade.
21
Attending eighth grade in a school with televisions/VCRs has a negative and
significant effect on Portuguese and Mathematics test scores. For third-year high school
students, there was no significant impact of attending a school with a television on test
scores. This result is interesting in the light of Brazilian educational policy. As part of
FUNDEF, teachers came up with projects for the FUNDEF program, and the projects
often included buying televisions (Carnoy et al. 2004). Teachers may have been
motivated to request televisions because the equipment made their jobs easier, rather than
enhanced student learning. Having a television might be a signal of a poorly performing
school that has been chosen for a government program.
The regressions include variables that control for teachers’ characteristics. The
impact of the average level of teachers’ schooling on children’s achievement test scores
is mixed, except for students in the third year of high school, whose test scores in
Mathematics increase with the educational level of their teachers. In all the regressions,
students’ achievement test scores are positively related to the teachers’ wage. Impacts
are greater at the high school level than at the eighth grade level. We must be cautious
when interpreting the school quality results because the results might reflect
unobservable characteristics of the community, such as the motivation of parents to
invest in their children’s schooling, rather than the effects of specific school investments.
Time spent working and school performance
In Table 7, we analyze whether there are nonlinearities in the effect of the number
of hours spent working on school performance. The number of hours that students work
is transformed into dummy variables representing the following ranges: 0 hours, 1 to 2
hours per day, 3 to 4 hours per day, 5 to 6 hours per day, 7 to 8 hours per day, and more
22
than 8 hours per day. These dummy variables are included in the regressions for both
Mathematics and Portuguese test scores, controlling for the same variables included in
Tables 5 and 6.
Table 7 includes only results for the hours worked variables. As the number of
hours increase, the negative impact on students’ achievement test scores increases. This
result is consistent across grades and across academic subjects. The results indicate that
8th grade students in Mathematics are able to combine working up to two hours per day
with schooling without harming their performance in school. When students start
working 3 hours or more per day, school achievement is harmed. As the number of hours
worked increases to 8 or more hours per day, the negative impacts of work on schooling
increase up to the point that eighth-grade students who work 8 or more hours per day
score about 14 points lower on the Mathematics exam.
High school students show a decrease in their Mathematics achievement test
scores even if they work only 1 to 2 hours a day. Those who work one to two hours a day
score 4 points lower on the achievement test than those who do not work, and those who
work 8 hours or more per day experience a decrease in achievement test scores of about
20 points.
In Portuguese, eighth grade students who work up to 2 hours per day
experienced a decrease of 1.8 points in their test scores, which is quite low. The students
who worked more than 8 hours per day lost about 18 points on the exam. At the high
school level, those students who worked up to two hours a day decreased their test scores
by 7 points. Those who work more than 8 hours scored almost 24 points lower on the
23
exam than those who did not work. The effect of the most intense level of working is to
decrease students’ achievement test scores by about 10 percent.
As expected, students who work 7 or more hours per day show the greatest
disadvantage in their school achievement. High school students experience greater effects
of working on school achievement than the eighth grade students. In addition to these
marginal effects, a higher percentage of high school students work long hours compared
to eighth-grade students. Also, high school students who work are likely to be older than
the appropriate grade for age. An important conclusion to be drawn from Table 7 is that
working up to 2 hours per day, or up to 14 hours per week, has minimal effects or
statistically insignificant effects on school achievement. For eighth graders, for example,
working up to 2 hours per day reduces the Portuguese score by 1 percent. For high
school students in Portuguese, who show the greatest magnitude of effects of working a
minimal number of hours, working up to two hours per day only decreases test scores by
about 2 percent.
Results from two-stage least squares regressions
In Table 8, the equations for student achievement test scores are estimated using
two-stage techniques, treating child labor as an endogenous variable6
6 First-stage regression results are available from the authors by request.
. In columns (1),
(3), (5), and (7), the estimated probability that the child works is included in the second
stage regressions. The predicted probability is estimated based on a first-stage probit
equation. In columns (2), (4), (6), and (8) the predicted hours worked is included in the
second stage regressions, where the first stage equation is OLS. The instrumental
24
variable is the average wage earned by men aged 20 to 30 who have less than primary
schooling and who live in the child’s state.
To be a good instrument, in the first stage, the instrument must have a statistically
significant impact on child labor, as measured by the probability that the child works and
by the number of hours the child worked. The average unskilled wage in the state has a
positive and statistically significant (at least 5%) relationship to the probability that a
child will work in the eighth grade Mathematics, high school Mathematics, eighth grade
Portuguese, and high school Portuguese first-stage regressions. The unskilled wage does
not have a statistically significant effect on hours worked for eighth grade Mathematics
first-stage regression, although it does in the cases of high school mathematics, eighth
grade Portuguese and high school Portuguese.
Comparing the coefficients on the variables “child works or not” and the hours of
work in the two-stage least squares results presented in Table 8 with the OLS results
presented in Tables 5 and 6, controlling for endogeneity changes the results substantively.
The results that control for endogeneity show larger negative impacts of working
on children’s academic performance. For eighth grade students, the results in Table 8
indicate that working results in a decrease in test scores of 43 points in Portuguese and of
66 points in Mathematics compared to a decrease in test scores of 7 points in Portuguese
and 8.5 points in Mathematics estimated using OLS (Table 5, column 1 and Table 6,
column 7). For students in the third year of high school, the two-stage least squares
results (Table 8) indicate a decrease of about 19 points in Portuguese and 32 points in
Mathematics, compared to a decrease of 13 points in Portuguese and 11.5 points in
Mathematics obtained with the OLS results (Table 5, column 4 and Table 6, column 10).
25
In almost all the grades, the negative effect of hours worked increases and
continues to be statistically significant in the two-stage least squares results (Table 8).
The exception is column (6), the equation for eighth grade students’ Mathematics test
scores, in which the predicted hours worked variable was not statistically significant. In
the third year of high school, an increase in the number of hours worked leads to a
decrease in student achievement test scores, with each hour worked leading a decrease in
Portuguese test scores of 13 points and Mathematics test scores of 24 points, compared to
the OLS results of 1.8 points and 1.6 points, respectively, presented in Table 5, column
(5) and Table 6, column (11).
Estimating the equations using the instrumental variable changed the estimated
coefficients for parents’ education levels. Fathers’ education was only statistically
significant for high school students. In some cases (columns 4 and 8, equations with
estimated children’s hours worked), the estimated coefficients for fathers’ education were
negative and significant, contrary to expectations. The impact of mothers’ education on
children’s achievement was also attenuated in the instrumental variable results, with
mothers’ education consistently positive and significant only for children’s high school
Portuguese test scores. These results were puzzling.
The Hausman test results indicate that the OLS results are not statistically
significantly different from the two-stage results. When we consider the parents’
education results with the Hausman test results, we conclude that the OLS results are the
preferred estimates.
26
Conclusions
This study examines whether child labor affects the school achievement of
students. We use data from the 2003 National Basic Education Evaluation System
(Sistema Nacional de Avaliação da Educação Básica – SAEB), which includes
achievement test scores in Portuguese and Mathematics for public and private students in
the eighth grade and in the third year of high school throughout Brazil.
The estimated parameters were, in general, statistically significant and revealed a
negative effect of child labor on school achievement. Students who work inside the
home only experienced a negative impact on their achievement test scores, but the
negative impact was greater for students who only worked outside the house and those
who worked both inside and outside the house. Students who work both outside and
inside the home have a heavy work load, possibly tire themselves physically, and have
less time and energy to devote to their studies than students who do not work or who only
work in one location.
Each additional hour that a student works lowers school achievement. Students
who work 7 hours or more per day experience the most harm to their school performance,
but the harm is modest with at most a 10 percent decrease in their achievement test scores
relative to students who do not work. In addition to being more likely to work and to
work long hours, high school students experience more negative effects of each
additional work hour on their school performance than the eighth-grade students do.
Working up to 2 hours per day (14 hours per week) has a minimal or no impact on school
achievement. This result informs a debate among researchers and policy makers about
how to define child labor. Basu and Tzannatos (2003) criticize using classifications of
27
child labor that might overestimate the incidence of child labor. For example, in the
PNAD in Brazil, children are defined as working if they report working only one hour a
week. Devoting such a minimal amount of time to working is unlikely to harm children’s
school progress.
In this study, we considered two issues that have been noted in the literature. The
first was the use of variables that characterize students’ motivation to study, which have
rarely been included in previous research. The second was the endogeneity of the child
labor variable. When the student motivation variables are included in the regressions, the
estimates on the child labor variables decrease in magnitude, indicating that omitting
variables that control for student motivation might result in overestimates of the harm due
to child labor. To control for the endogeneity problem, we use as an instrumental
variable the average unskilled wage in the child’s state of residence. After examining the
results and conducting Hausman tests, we conclude that the OLS results are preferable.
Our results indicate that domestic work, which is often not counted in social
statistics, should be included in policies designed to combat child labor. Child labor,
whether it occurs inside or outside the home, causes a decrease in school achievement
and the negative effects are stronger for higher academic levels. A difficult issue for
policymakers who would like to eradicate child labor is that families might rely upon the
earnings of children and adolescents to meet basic needs. Our results demonstrate the
possibility that work can be combined with schooling and have minimum impact on
school achievement if work is limited to a maximum of 2 hours per day, or 14 hours per
week. This suggests a new policy in the area of child labor, specifically to try to
distinguish among groups of children who work a small amount of time that is
28
compatible with schooling and those children who work longer hours and are
consequently experiencing lower school achievement.
Our results suggest that Brazilian students might benefit from having access to
computers, especially students in secondary school. Televisions and VCRs do not seem
to help students to learn. Laboratories are modestly associated with higher achievement
test scores. Schools where teachers are more highly paid have students that obtain higher
test scores. Although we control for students’ motivation in the regressions, we cannot
say whether the school infrastructure matters, or whether, for example, schools whose
teachers care about their students’ learning invest in equipment such as computers rather
than televisions. Nevertheless, our results are informative for Brazilian policymakers
who might be considering further investments in school infrastructure.
Additional results in this study shed light on projects to improve education and to
combat child labor. Parents’ schooling, especially mothers’ schooling continues to have
a strong positive impact on children’s school achievement, so investments made now will
have far reaching effects on future generations. The effects of attending a public
compared to a private school underline great disparities in school quality. Delays in
school are responsible for a great deal of the weak performance of students. To solve
these problems requires educational policies that address the issues of school drop out,
late entry into schools, incentives to improve school quality, and the poor school
infrastructure that is found in some regions of the country.
29
References
ASSOCIAÇÃO BRASILEIRA DE EMPRESAS DE PESQUISA – ABEP. Critério de classificação econômica Brasil. Disponível em: <http://www.abep.org.br/codigosguias/ABEP_CCEB.pdf>. Acesso em: 20 mar. 2005.
ALBERNAZ, A.; FERREIRA, F.H.G.; FRANCO, C. Qualidade e equidade no ensino fundamental brasileiro. Pesquisa e Planejamento Econômico, Rio de Janeiro, v. 32, n. 3, p. 453-476, 2002.
AKABAYASHI, H.; PSACHAROPOULOS, G. The trade-off between child labour and human capital formation: a Tanzanian case study. Journal of Development Studies, London, v. 35, n. 5, p. 120-140, June 1999.
Associação Brasileira de Empresas de Pesquisa. 2003. Criterio de classificacao Economica Brasil. Accessed February 12, 2009 at http://www.abep.org/codigosguias/ABEP_CCEB.pdf
BARROS, R.P.; MENDONÇA, R.S.P. Trabalho infantil e evasão escolar. Rio de Janeiro: DIPES/IPEA, 1996. 8 p.
BARROS, R.P.; MENDONÇA, R.S.P.; VELAZCO, T. Is poverty the main cause of child work in urban Brazil? Rio de Janeiro: Instituto de Pesquisa Econômica Aplicada, 1994. 26 p. (IPEA. Texto para Discussão, 351).
BARROS, R.P.; MENDONÇA, R.; SANTOS, D.D.; QUINTAES, G. Determinantes do desempenho educacional no Brasil. Rio de Janeiro: Instituto de Pesquisa Econômica Aplicada, 1994. 38 p. (IPEA. Texto para Discussão, 834).
BARROS, R.P.; HENRIQUES, R.; MENDONÇA, R. Pelo fim das décadas perdidas: educação e desenvolvimento. In: HENRIQUES, R. Desigualdade e pobreza no Brasil. Rio de Janeiro: IPEA, 2000. p. 405-423.
BARROS, R.P.; SANTOS, E.C. Consequências de longo prazo do trabalho precoce. Rio de Janeiro: DIPES/IPEA, 1991. 15 p.
BASU, K. Child labor: cause, consequence, and cure, with remarks on international labor standards. Journal of Economic Literature, Nashville, v. 37, n. 3, p. 1083-1119, Sep. 1999.
BASU, K.; TZANNATOS, Z. The global child labor problem: what do we know and what can we do? The World Bank Economic Review, Washington D.C, v. 17, n. 2. p. 147-174, 2003.
BASU, K.; VAN, P.H. Economics of child labor. The American Economic Review, Nashville v. 88, n. 3, p. 412-427, June 1998.
BECKER, G.S. A treatise on the family. Enlarged edition. Cambridge: Harvard University Press, 1991. 424 p.
BELTRÃO, K.I. Acesso à educação: diferenciais entre os sexos. Rio de Janeiro: Instituto de Pesquisa Econômica Aplicada, 2002. 22 p. (IPEA. Texto para Discussão, 879).
30
BHALOTRA, S. Is child work necessary? Londres: LSE Suntory Toyota, Development Economics Research Programme, 2001. 40 p. (Paper Series, 26).
BHALOTRA, S.; TZANNATOS, Z. Child labor: what have we learnt? Washington D.C: World Bank, Social Protection Unit, Human Development Network, 2003. 76 p. (Social Protection Discussion Paper Series, 317).
BRASIL. Presidência da República. Trabalho infantil no Brasil: questões e políticas. Brasília: Presidência da República, 1998. 78 p.
BRYANT, W.K. The economic organization of the household. 1. ed. New York: Cambridge University Press, 1990. 286 p.
CARNOY, M., GOVE, A.; LOEB, S; MARSHALL, J.; and SOCIAS, M. 2004. “How schools and students respond to school improvement programs: the case of Brazil’s PDE.” Forthcoming, Economics of Education Review.
CASTRO, J.A.; BARRETO, A.R.; CORBUCCI, P.R. A reestruturação das políticas federais para o ensino fundamental: descentralização e novos mecanismos de gestão. Rio de Janeiro: Instituto de Pesquisa Econômica Aplicada, 2000. 31 p. (IPEA. Texto para Discussão, 745).
CASTRO, M.H.G. de. As desigualdades regionais no sistema educacional brasileiro. In: HENRIQUES, R. Desigualdade e pobreza no Brasil. Rio de Janeiro: IPEA, 2000. p. 425-458.
CAVALIERI, C.H. Trabalho infantil e desempenho escolar. In: ENCONTRO BRASILEIRO DE ECONOMETRIA, 22., 2000, Campinas; ENCONTRO NACIONAL DE ECONOMIA, 28., 2000, Campinas. Anais... Campinas: ANPEC, 2000. 1 CD-ROM.
DURYEA, S.; ARENDS-KUENNING, M. School attendance, child labor and local labor markets in urban Brazil. World Development, Washington D.C, v. 31, n. 7, p. 1165-1178, July 2003.
EMERSON, P.M.; PORTELA, A. Bargaining over sons and daughters: child labor, school attendance and intra-household gender bias in Brazil. Nashville: Vanderbilt University, Department of Economics, 2002. 46 p. (Working Paper, 0213).
EMERSON, P.M.; PORTELA, A. Birth order, child labor and school attendance in Brazil. Nashville: Vanderbilt University, Department of Economics, 2002. 33 p. (Working Paper, 0212).
FERNANDES, R. Expansão escolar e qualidade de ensino: o Brasil na década de 1990. Ribeirão Preto: Universidade de São Paulo, Departamento de Economia, 2004. 98 p.
FERNANDES, R.; SOUZA, A.P. A redução do trabalho infantil e o aumento da freqüência a escola: uma análise de decomposição para o Brasil dos anos 90. In: ENCONTRO NACIONAL DE ESTUDOS DO TRABALHO – ABET, 8., 2003, São Paulo. Anais... São Paulo: ABET, 2003. 1 CD-ROM.
FORASTIERI, V. Children at work: Health and safety risks. Genebra: ILO, 1997. 138 p.
31
GALLI, R. The economic impact of child labour. Genebra: ILO Decent Work Research Programme, 2001. 32 p. (Discussion Paper, 128).
GLEWWE, P. Schools and skills in developing countries: education policies and socioeconomic outcomes. Journal of Economics Literature, Nashville, v. 40, n. 2, p. 436-482, June 2002.
GLEWWE, P. An investigation of the determinants of school progress and academic achievement in Vietnam. In: GLEWWE, P.; AGRAWAL, N.; DOLLAR, D. (Ed.). Economic growth, poverty, and household welfare in Vietnam. Washington, D.C.: World Bank, 2004. p. 467-501. (World Bank regional and sectoral studies).
GLEWWE, P.; JACOBY, H.G. Economic growth and the demand for education: is there a wealth effect? Journal of Development Economics, Amsterdam, v. 74, n. 1, p. 33–51, 2004.
GREENE, W. Econometric analysis. 3. ed. New Jersey: Prentice Hall, 1997. 791 p.
GUNNARSSON, V.; ORAZEM, P.F.; SÁNCHEZ, M.A. Child labor and school achievement in Latin America. Iowa State University: Department of Economics, 2004. 37 p. (Working Papers Series, 03023).
HEADY, C. The effect of child labor on learning achievement. World Development, Amsterdam, v. 31, n. 2, p. 385-398, 2003.
HYDE, J.S. The gender similarities hypothesis. American Psychologist, Washington D.C, v. 60, n. 6, p. 581-592, Sep. 2005.
INSTITUTO BRASILEIRO DE GEOGRAFIA E ESTATÍSTICA – IBGE. Pesquisa nacional de amostra por domicílios: 2003. Rio de Janeiro, 2003. 1 CD–ROM.
INSTITUTO BRASILEIRO DE GEOGRAFIA E ESTATÍSTICA – IBGE. Síntese dos indicadores sociais 2004. Rio de Janeiro, 2005. 359 p. (Estudos e Pesquisas, 15).
INSTITUTO BRASILEIRO DE GEOGRAFIA E ESTATÍSTICA – IBGE. Síntese dos indicadores sociais 2002. Rio de Janeiro, 2003. 383 p. (Estudos e Pesquisas, 11).
INSTITUTO NACIONAL DE ESTUDOS E PESQUISAS EDUCACIONAIS ANÍSIO TEIXEIRA – INEP. Microdados do Sistema Nacional de Avaliação da Educação Básica 2003 – SAEB. Brasília: INEP, 2003. 1 CD–ROM.
INSTITUTO NACIONAL DE ESTUDOS E PESQUISAS EDUCACIONAIS ANÍSIO TEIXEIRA – INEP. SAEB: todos pela boa educação. Brasília, 2002. 312 p. (Relatório Nacional 2001).
INSTITUTO NACIONAL DE ESTUDOS E PESQUISAS EDUCACIONAIS ANÍSIO TEIXEIRA – INEP. Resultados do SAEB 2003. Brasília, 2004. 86 p. Versão preliminar.
INSTITUTO NACIONAL DE ESTUDOS E PESQUISAS EDUCACIONAIS ANÍSIO TEIXEIRA – INEP. Qualidade da educação: uma nova leitura do desempenho dos estudantes da 4ª série do ensino fundamental. Brasília, 2003. 32 p.
32
INSTITUTO NACIONAL DE ESTUDOS E PESQUISAS EDUCACIONAIS ANÍSIO TEIXEIRA – INEP. Qualidade da educação: uma nova leitura do desempenho dos estudantes da 8ª série do ensino fundamental. Brasília, 2003. 32 p.
INSTITUTO NACIONAL DE ESTUDOS E PESQUISAS EDUCACIONAIS ANÍSIO TEIXEIRA – INEP. Qualidade da educação: uma nova leitura do desempenho dos estudantes da 3ª série do ensino médio. Brasília, 2004. 46 p.
INSTITUTO NACIONAL DE ESTUDOS E PESQUISAS EDUCACIONAIS ANÍSIO TEIXEIRA – INEP. Sistema Nacional de Avaliação da Educação Básica. Disponível em: <http://www.inep.gov.br/saeb>. Acesso em: 2 fev. 2005.
INSTITUTO NACIONAL DE ESTUDOS E PESQUISAS EDUCACIONAIS ANÍSIO TEIXEIRA – INEP. Sistema de Estatísticas Educacionais: EDUDATABRASIL. Disponível em: <http://www.edudatabrasil.inep.gov.br/>. Acesso em: 18 ago. 2005.
INSTITUTO DE PESQUISA ECONÔMICA APLICADA. IPEADATA: dados macroeconômicos e regionais. Disponível em: <http://www.ipea.gov.br>. Acesso em: 3 ago. 2005.
KASSOUF, A.L. Aspectos socio-econômicos do trabalho infantil no Brasil. Brasília: Ministério da Justiça, 2002. 124 p.
KASSOUF, A.L. Trabalho infantil: escolaridade x emprego. Economia, Campinas, v. 2, n. 2, p. 549-586, jul./dez. 2001.
KASSOUF, A.L.; ALMEIDA, A.N.; BEZERRA, M.E.G. O trabalho de crianças e adolescentes no Nordeste do Brasil. Brasília: Organização Internacional do Trabalho, 2004. 87 p.
KASSOUF, A.L.; ALMEIDA, A.N.; PONTILI, R.M.; FERRO, A.F. Análise de políticas e programas sociais no Brasil. Brasília: Organização Internacional do Trabalho, 2003. 108 p. (Documentos de Trabajos, 182).
KOOREMAN, P.; WUNDERINK, S. The economics of household behaviour. 1. ed. Londres: Macmillan Press LTD, 1997. 236 p.
MADALLA, G.S. Limited dependent and qualitative variables in econometrics. 1. ed. Cambridge: University Press. 1983. 401 p.
MENEZES-FILHO, N.A. A evolução recente da educação no Brasil. 2003. 113 p. Tese (Livre-Docência) – Faculdade de Economia, Administração e contabilidade, Universidade de São Paulo, São Paulo, 2003.
O’DONNELL, O.; ROSATI, F.; VAM DOORSLAER, E. Health effects of children’s work: evidence from rural Vietnam. Florença: ILO/UNICEF/World Bank Group, Apr. 2003. 38 p.
ORAZEM, P.F.; GUNNARSSON, V. Child labour, school attendance and academic performance: a review. Genebra: ILO/IPEC, 2003. 40 p.
ORGANIZAÇÃO ECONÔMICA PARA A COOPERAÇÃO E O DESENVOLVIMENTO - OECD. Programme for International Student Assessment (PISA) 2000. Brasília, 2001. 88 p. (Relatório Nacional).
33
ORGANIZAÇÃO ECONÔMICA PARA A COOPERAÇÃO E O DESENVOLVIMENTO - OECD. Learning for tomorrow: first results from Pisa 2003. Programme for International Student Assessmemnt – PISA. Paris: OECD, 2004. 471 p.
ORGANIZAÇÃO ECONÔMICA PARA A COOPERAÇÃO E O DESENVOLVIMENTO - OECD. Gender differences and similarities in achievement. In: ORGANIZAÇÃO ECONÔMICA PARA A COOPERAÇÃO E O DESENVOLVIMENTO. Literacy skills of the world of tomorrow: further results form PISA 2000. Paris: OECD/UNESCO, 2003. 392 p.
ORGANIZAÇÃO INTERNACIONAL DO TRABALHO - OIT. Every child counts: new global estimates on child labour. Genebra: ILO/IPEC/SIMPOC, 2002. 51 p.
PATRINOS, H.A.; PSACHAROPOULOS, G. Family size, schooling and child labor in Peru: an empirical analysis. Journal of Population Economics, Berlim, v. 10, n. 4, p. 387-405, Feb. 1997.
PONTILI, R.M. A infra-estrutura escolar e as características familiares influenciando a freqüência e o atraso no ensino fundamental. 2004. 131 p. Dissertação (Mestrado em Economia Aplicada) - Escola Superior de Agricultura “Luiz de Queiroz”, Universidade de São Paulo, Piracicaba, 2004.
PSACHAROPOULOS, G. Child labor versus educational attainment: some evidence from Latin America. Journal of Population Economics, Berlim, v. 10, n. 4, p. 377-386, Aug. 1997.
RAY, R.; LANCASTER, G. The impact of children’s work on schooling: multi-country evidence based on SIMPOC data. Hobart: University of Tasmânia, School of Economics, 2004. 105 p.
RIOS-NETO, E.L.G.; CÉSAR, C.C.; RIANI, J.L.R. Estratificação educacional e progressão escolar por série no Brasil. Pesquisa e Planejamento Econômico, Rio de Janeiro, v. 32, n. 3, p.395-415, 2002.
ROSATI, F.; ROSSI, M. Children’s working hours and school enrollment: evidence from Pakistan and Nicarágua. The World Bank Economic Review, Washington D.C, v. 17, n. 2. p. 283-295, 2003.
ROSEN, S. Human capital: a survey of empirical research. In: EHRENBERG, R. (Ed.). Research in labor economics. Amsterdam: JAI Press, 1977. v. 1
SOARES, S. Os fatores que determinam o sucesso educacional. Pesquisa e Planejamento Econômico, Rio de Janeiro, v. 32, n. 3, p. 385-394, 2002.
STINEBRICKNER, R.; STINEBRICKNER, T.R. Working during school and academic
performance. Journal of Labor Economics, Chicago, v. 21, n. 2, p. 449-472, 2003.
34
Table 1. Number and percentage of students in the eighth grade of primary school and the third grade of secondary school by work situation and by subject tested.
Mathematics Eighth Grade Primary School Third Year High School Students’ work situation N % N % Do not work 1,212,595 38.77 553,262 26.50 Work both at home and in the market 366,718 11.73 432,698 20.73 Only work at home 1,105,093 35.34 592,845 28.40 Only work in the market 442,903 14.16 508,883 24.38
Portuguese Eighth Grade Primary School Third Year High School Students’ work situation N % N % Do not work 1,217,745 38.96 572,467 27.44 Work both at home and in the market 382,484 12.24 391,176 18.75 Only work at home 1,103,433 35.30 603,953 28.95 Only work in the market 422,039 13.50 518,416 24.85
Source: INEP 2003.
35
Table 2. Mathematics achievement test score classifications of students in the eighth grade of primary school and the third year of high school by work situation
Classifications of proficiency and
ability of the student
Mathematics—eighth grade of primary school
Do not work
Work in the household and in the market
Work only in the household
Work only in the market
N % N % N % N % Very Critical 54,858 4.52 45,254 12.34 82,955 7.51 33,688 7.61 Critical 483,778 39.90 221,448 60.39 615,970 55.74 226,927 51.24 Intermediate 593,678 48.96 98,270 26.80 391,044 35.39 175,750 39.68 Adequate 74,698 6.16 1,704 0.46 13,284 1.20 6,024 1.36 Advanced 5,583 0.46 42 0.01 1,840 0.17 514 0.12
Total 1,212,595 100 366,718 100 1,105,093 100 442,903 100 Mathematics—third year of secondary school
Very Critical 17,392 3.14 40,999 9.48 36,487 6.15 33,288 6.54 Critical 236,280 42.71 329,438 76.14 401,182 67.67 335,061 65.84 Intermediate 188,146 34.01 59,909 13.85 137,751 23.24 127,071 24.97 Adequate 111,444 20.14 2,351 0.54 17,425 2.94 13,463 2.65 Advanced - - - - - - - -
Total 553,262 100 432,698 100 592,845 100 508,883 100 Source: INEP (2003)
36
Table 3. Portuguese achievement test score classifications of students in the eighth grade of primary school and the third year of high school by work situation
Classifications of proficiency and ability of the student
Portuguese—eighth grade of primary school
Do not work
Work in the household and in the market
Work only in the household
Work only in the market
N % N % N % N % Very Critical 35,726 2.93 31,671 8.28 38,547 3.49 30,834 7.31 Critical 208,873 17.15 124,756 32.62 222,093 20.13 122,612 29.05 Intermediate 779,626 64.02 215,130 56.25 771,965 69.96 246,041 58.30 Adequate 191,676 15.74 10,928 2.86 70,550 6.39 22,552 5.34 Advanced 1,845 0.15 - - 279 0.03 - -
Total 1,217,745 100 382,484 100 1,103,433 100 422,039 100 Portuguese – third year of high school
Very Critical 14,346 2.51 21,695 5.55 16,462 2.73 25,406 4.90 Critical 124,926 21.82 180,817 46.22 197,138 32.64 212,055 40.90 Intermediate 342,164 59.77 184,198 47.09 369,138 61.12 266,021 51.31 Adequate 91,031 15.90 4,467 1.14 21,214 3.51 14,933 2.88 Advanced - - - - - - - -
Total 572,467 100 391,176 100 603,953 100 518,416 100 Source: INEP (2003)
37
Table 4. Mean and standard deviations of variables used in the Portuguese and Mathematics achievement equations Portuguese Mathematics Eighth Grade Third year of high
school Eighth Grade Third year of high
school Mean S.D. Mean S.D. Mean S.D. Mean S.D. Test scores (continuous) 232.91 49.35 267.37 52.20 245.78 50.91 279.34 57.30 Independent Variables
Work (=1 if work) 0.61 0.49 0.73 0.45 0.61 0.49 0.73 0.44 Study (=1 if study) 0.39 0.49 0.27 0.45 0.39 0.49 0.27 0.44 Work in household 0.35 0.48 0.29 0.45 0.35 0.48 0.28 0.45 Work outside household 0.14 0.34 0.25 0.43 0.14 0.35 0.24 0.43 Work in both 0.12 0.33 0.19 0.39 0.12 0.32 0.21 0.41 Hours worked 3.63 2.89 4.94 3.31 3.64 2.87 5.09 3.32 Regions North 0.07 0.26 0.09 0.28 0.07 0.26 0.09 0.28 Northeast 0.27 0.44 0.24 0.43 0.27 0.45 0.24 0.43 Southeast 0.45 0.50 0.49 0.50 0.44 0.50 0.49 0.50 South 0.13 0.34 0.11 0.32 0.13 0.34 0.11 0.32 Central 0.08 0.27 0.07 0.26 0.08 0.27 0.07 0.26 Sex (=1 if F) 0.47 0.50 0.42 0.49 0.49 0.50 0.45 0.50 Age 15.22 1.42 18.32 1.52 15.21 1.40 18.34 1.53 Color White 0.44 0.50 0.49 0.50 0.45 0.50 0.49 0.50 Yellow 0.04 0.19 0.04 0.21 0.04 0.20 0.05 0.22 Pardo 0.43 0.50 0.38 0.49 0.42 0.49 0.38 0.49 Black 0.09 0.28 0.08 0.27 0.09 0.28 0.08 0.28 Father’s schooling
< 8th grade 0.52 0.50 0.52 0.50 0.52 0.50 0.52 0.50 8th grade 0.17 0.37 0.15 0.36 0.16 0.37 0.15 0.36 High school 0.20 0.40 0.21 0.41 0.21 0.40 0.22 0.41 College 0.11 0.31 0.11 0.31 0.11 0.31 0.10 0.30 Mother’s schooling
< 8th grade 0.54 0.50 0.52 0.50 0.54 0.50 0.52 0.50 8th grade 0.16 0.36 0.15 0.36 0.15 0.36 0.14 0.35 High school 0.20 0.40 0.23 0.42 0.21 0.41 0.23 0.42 College 0.10 0.30 0.11 0.31 0.10 0.30 0.10 0.30 Family income 1,316.67 1,299.96 1,406.70 1,297.53 1,312.72 1,276.31 1,418.21 1,318.62 Log income 6.85 0.79 6.94 0.76 6.85 0.79 6.95 0.77 Household size 4.04 1.74 3.82 1.73 4.07 1.74 3.87 1.75
38
Table 4 continued Like to study 0.77 0.42 0.74 0.44 0.63 0.48 0.56 0.50 Do homework 0.50 0.50 0.38 0.49 0.48 0.50 0.35 0.48 Behind in school 0.42 0.49 0.45 0.50 0.42 0.49 0.46 0.50 School infrastructure Public school 0.88 0.33 0.84 0.37 0.88 0.33 0.84 0.37 Computer 0.52 0.50 0.68 0.47 0.52 0.50 0.67 0.47 Library 0.81 0.39 0.88 0.32 0.81 0.39 0.88 0.32 Lab 0.40 0.49 0.64 0.48 0.40 0.49 0.64 0.48 TV / VCR 0.92 0.26 0.94 0.24 0.92 0.27 0.94 0.24 Teacher schooling 0.94 0.23 0.98 0.13 0.93 0.26 0.98 0.15 Teacher wage 1,206.62 706.28 1,424.38 854.83 1,249.66 722.07 1,545.51 953.61 Ln teacher wage 6.94 0.58 7.10 0.58 6.97 0.59 7.16 0.62
39
Table 5. Determinants of achievement test scores for students in eighth grade and in the third year of high school in Portuguese. Eighth grade Third year of high school (1) (2) (3) (4) (5) (6) Work -7.032 - - -13.082 (-11.21)*** - - (-16.41)*** Hours Worked - -1.648 - - -1.755 - (-13.34)*** - - (-14.34)*** Work in Household - - -5.419 - -9.980 - - (-7.57)*** - (-10.63)*** Work Outside - - -6.647 - -13.021 - - (-7.03)*** - (-13.4)*** Work Both - - -13.035 - -19.689 - - (-12.88)*** - (-18.14)*** North 0.473 0.676 0.467 -3.079 -2.444 -2.971 (0.36) (0.47) (0.36) (-2.25)** (-1.62) (-2.18)** Southeast 1.383 1.344 1.407 2.039 1.718 2.449 (1.6) (1.38) (1.63) (2.17)** (1.62) (2.6)*** South 5.546 6.306 5.616 4.748 6.288 5.003 (5.23)*** (5.36)*** (5.3)*** (3.81)*** (4.55)*** (4.02)*** Central 3.447 3.629 3.500 5.476 6.256 6.078 (2.83)*** (2.69)*** (2.87)*** (3.95)*** (4.04)*** (4.39)*** Male -14.192 -13.834 -13.809 -6.808 -5.783 -6.328 (-24.05)*** (-20.96)*** (-22.16)*** (-9.98)*** (-7.6)*** (-8.74)*** Age -4.968 -4.362 -4.799 -4.895 -4.711 -4.669 (-18.08)*** (-14.43)*** (-17.41)*** (-16.26)*** (-14.35)*** (-15.5)*** Race Yellow 1.361 1.525 1.347 1.951 2.486 1.675 (0.88) (0.88) (0.87) (1.17) (1.36) (1.00) Pardo -1.387 -1.582 -1.395 -1.688 -0.813 -1.881 (-2.17)** (-2.22)** (-2.19)** (-2.23)** (-0.97) (-2.49)** Black -11.042 -10.606 -10.897 -5.101 -4.305 -5.116 (-9.53)*** (-8.3)*** (-9.41)*** (-3.79)*** (-2.97)*** (-3.81)*** Father’s Schooling 8th grade 2.381 1.071 2.187 1.355 0.537 1.235 (2.74)*** (1.12) (2.52)** (1.29) (0.47) (1.18) High school 10.089 8.049 9.777 1.674 0.481 1.437 (11.12)*** (7.94)*** (10.77)*** (1.6) (0.41) (1.37) College 12.783 10.336 12.511 9.775 7.827 9.721 (9.5)*** (6.4)*** (9.31)*** (6.52)*** (4.45)*** (6.5)*** Mother’s Schooling 8th grade 2.670 3.481 2.491 2.688 3.882 2.641 (3.04)*** (3.61)*** (2.84)*** (2.61)*** (3.49)*** (2.57)*** High school 4.291 5.251 4.167 6.540 6.771 6.241 (4.97)*** (5.5)*** (4.84)*** (6.63)*** (6.18)*** (6.34)*** College 7.618 6.260 7.663 12.201 12.792 11.842 (6.24)*** (4.27)*** (6.28)*** (8.8)*** (7.93)*** (8.56)***
40
Table 5 continued. Family income 4.267 5.467 4.350 3.515 3.518 3.512 (7.5)*** (8.48)*** (7.65)*** (5.2)*** (4.62)*** (5.21)*** Hhold size -1.745 -1.550 -1.722 -1.915 -1.792 -1.883 (-9.84)*** (-7.91)*** (-9.72)*** (-9.55)*** (-8.15)*** (-9.41)*** Likes to study 2.140 2.795 2.252 5.054 5.612 5.160 (3.06)*** (3.48)*** (3.22)*** (6.52)*** (6.44)*** (6.67)*** Does Homework 6.887 6.324 6.947 5.092 4.219 5.146 (11.62)*** (9.52)*** (11.73)*** (7.35)*** (5.5)*** (7.44)*** Behind in School -11.149 -10.698 -11.003 -13.124 -13.075 -13.071 (-15.15)*** (-13.1)*** (-14.97)*** (-15.06)*** (-13.59)*** (-15.04)*** Public School -20.190 -21.295 -20.353 -23.788 -23.833 -23.554 (-18.61)*** (-16.37)*** (-18.78)*** (-22.22)*** (-19.08)*** (-22.05)*** Computer 0.162 0.184 0.074 3.687 3.914 3.800 (0.24) (0.25) (0.11) (4.37)*** (4.28)*** (4.52)*** Library 1.016 0.670 1.036 -6.060 -6.788 -5.940 (1.16) (0.71) (1.19) (-5.4)*** (-5.57)*** (-5.3)*** Lab 4.354 3.270 4.215 4.198 3.717 4.130 (6.43)*** (4.34)*** (6.23)*** (5.4)*** (4.38)*** (5.32)*** TV / VCR -4.693 -3.145 -4.644 0.760 1.094 0.514 (-4.11)*** (-2.46)** (-4.07)*** (0.54) (0.71) (0.36) Teachers’ schooling -0.888 -2.689 -1.048 3.497 8.037 3.503 (-0.64) (-1.8)* (-0.76) (1.48) (3.07)*** (1.49) Teachers’ wage 3.719 3.419 3.675 4.941 4.479 4.905 (6.58)*** (5.39)*** (6.51)*** (7.5)*** (6.04)*** (7.47)*** Constant 288.312 274.843 285.599 330.598 322.698 326.442 (41.18)*** (35.35)*** (40.74)*** (36.88)*** (32.59)*** (36.43)*** N 21,969 16,988 21,969 17,453 14,006 17,453 F test 321.99*** 223.84*** 303.27*** 297.52*** 196.80*** 282.18*** R2 0.291 0.270 0.293 0.324 0.283 0.327 - - 1.52 - - 9.45*** 1 The 2003 SAEB survey excluded students who lived in rural areas in the eighth grade and high school sample. Note: Values in parentheses represent t-values. *** Notes significance at the 1% level. ** Notes significance at the 5% level. * Notes significance at the 10% level.

41
Table 6. Determinants of achievement test scores for students in eighth grade and in the third year of high school in Mathematics. Eighth grade Third year of high school (7) (8) (9) (10) (11) (12) Work -8.468 - - -11.460 - - (-13.73)*** - - (-13.91)*** - - Hours Worked - -1.695 - - -1.644 - - (-13.8)*** - - (-13.62)*** - Work in Household - - -8.433 - - -9.156 - - (-11.88)*** - - (-9.49)** Work Outside - - -4.174 - - -10.865 - - (-4.62)*** - - (-10.93)*** Work Both - - -15.815 - - -16.960 - - (-15.52)*** - - (-15.78)*** North -5.999 -5.426 -6.078 -10.122 -9.047 -9.951 (-3.73)*** (-4.6)*** (-7.34)*** (-5.97)*** (-7.23)*** Southeast 7.753 7.229 7.624 1.865 3.774 2.403 (9.17)*** (7.59)*** (9.03)*** (1.95)* (3.5)*** (2.5)** South 9.957 10.515 9.969 12.183 15.216 12.636 (9.57)*** (9.11)*** (9.6)*** (9.77)*** (11.04)*** (10.13)*** Central 6.139 7.332 6.027 3.513 4.420 3.792 (5.17)*** (5.54)*** (5.08)*** (2.54)** (2.89)*** (2.75)*** Male 6.530 9.033 5.858 11.537 12.250 11.597 (11.19)*** (13.9)*** (9.41)*** (17.08)*** (16.43)*** (16.11)*** Age -4.064 -3.676 -3.991 -4.739 -4.661 -4.551 (-14.45)*** (-11.9)*** (-14.16)*** (-16.46)*** (-15.09)*** (-15.78)*** Race Yellow -2.368 -3.166 -2.331 0.151 1.282 0.018 (-1.63) (-1.9)* (-1.61) (0.1) (0.76) (0.01) Pardo -1.932 -1.915 -1.948 -3.169 -3.293 -3.312 (-3.04)*** (-2.71)*** (-3.07)*** (-4.21)*** (-3.99)*** (-4.41)*** Black -11.161 -13.682 -11.539 0.073 1.283 0.099 (-9.78)*** (-10.99)*** (-10.13)*** (0.05) (0.88) (0.07) Father’s Schooling 8th grade 1.478 -0.400 1.349 -1.556 -1.938 -1.691 (1.71)* (-0.42) (1.56) (-1.54) (-1.8)* (-1.7)* High school 5.015 4.824 5.112 5.292 5.061 5.215 (5.63)*** (4.85)*** (5.75)*** (5.1)*** (4.43)*** (5.03)*** College 6.625 7.338 6.822 18.007 19.221 18.092 (5.0)*** (4.72)*** (5.16)*** (11.67)*** (10.66)*** (11.74)*** Mother’s Schooling 8th grade 3.439 4.178 3.325 4.930 5.400 4.922 (3.99)*** (4.43)*** (3.86)*** (4.77)*** (4.84)*** (4.77)*** High school 6.386 5.934 6.269 6.935 6.406 6.751 (7.5)*** (6.26)*** (7.38)*** (7.21)*** (6.07)*** (7.03)*** College 16.715 17.339 16.486 17.893 17.098 17.538 (13.84)*** (12.29)*** (13.68)*** (13.05)*** (10.76)*** (12.81)***
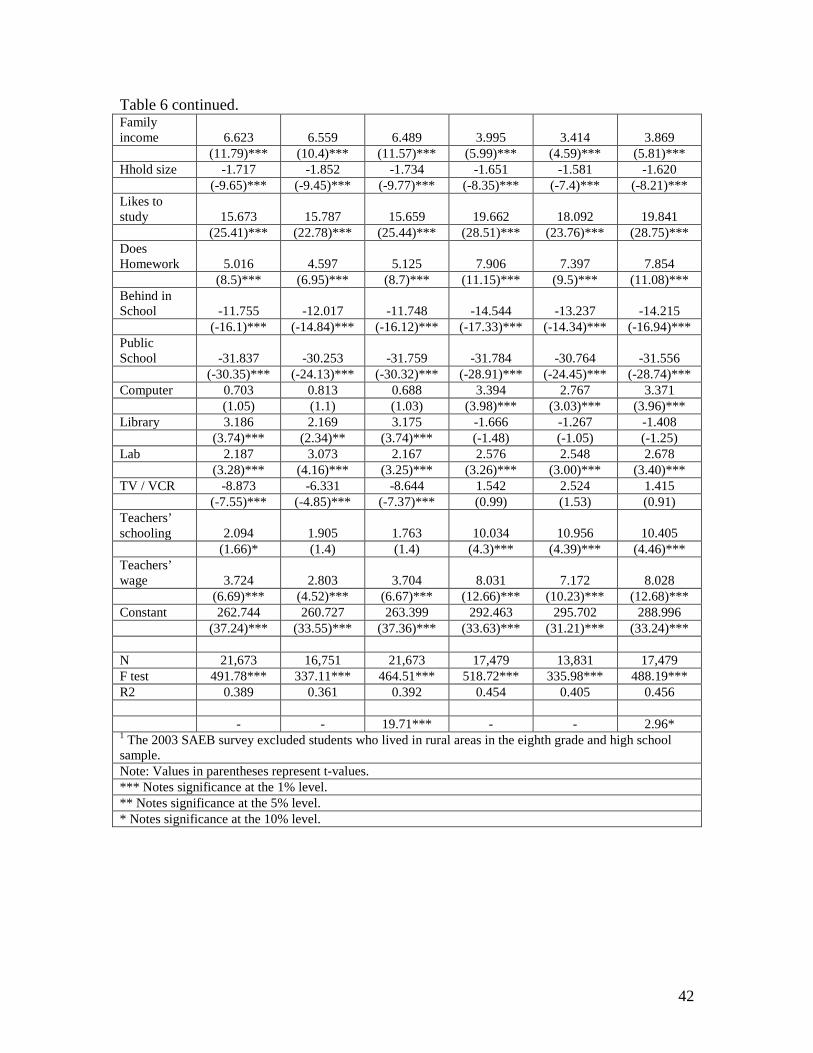
42
Table 6 continued. Family income 6.623 6.559 6.489 3.995 3.414 3.869 (11.79)*** (10.4)*** (11.57)*** (5.99)*** (4.59)*** (5.81)*** Hhold size -1.717 -1.852 -1.734 -1.651 -1.581 -1.620 (-9.65)*** (-9.45)*** (-9.77)*** (-8.35)*** (-7.4)*** (-8.21)*** Likes to study 15.673 15.787 15.659 19.662 18.092 19.841 (25.41)*** (22.78)*** (25.44)*** (28.51)*** (23.76)*** (28.75)*** Does Homework 5.016 4.597 5.125 7.906 7.397 7.854 (8.5)*** (6.95)*** (8.7)*** (11.15)*** (9.5)*** (11.08)*** Behind in School -11.755 -12.017 -11.748 -14.544 -13.237 -14.215 (-16.1)*** (-14.84)*** (-16.12)*** (-17.33)*** (-14.34)*** (-16.94)*** Public School -31.837 -30.253 -31.759 -31.784 -30.764 -31.556 (-30.35)*** (-24.13)*** (-30.32)*** (-28.91)*** (-24.45)*** (-28.74)*** Computer 0.703 0.813 0.688 3.394 2.767 3.371 (1.05) (1.1) (1.03) (3.98)*** (3.03)*** (3.96)*** Library 3.186 2.169 3.175 -1.666 -1.267 -1.408 (3.74)*** (2.34)** (3.74)*** (-1.48) (-1.05) (-1.25) Lab 2.187 3.073 2.167 2.576 2.548 2.678 (3.28)*** (4.16)*** (3.25)*** (3.26)*** (3.00)*** (3.40)*** TV / VCR -8.873 -6.331 -8.644 1.542 2.524 1.415 (-7.55)*** (-4.85)*** (-7.37)*** (0.99) (1.53) (0.91) Teachers’ schooling 2.094 1.905 1.763 10.034 10.956 10.405 (1.66)* (1.4) (1.4) (4.3)*** (4.39)*** (4.46)*** Teachers’ wage 3.724 2.803 3.704 8.031 7.172 8.028 (6.69)*** (4.52)*** (6.67)*** (12.66)*** (10.23)*** (12.68)*** Constant 262.744 260.727 263.399 292.463 295.702 288.996 (37.24)*** (33.55)*** (37.36)*** (33.63)*** (31.21)*** (33.24)*** N 21,673 16,751 21,673 17,479 13,831 17,479 F test 491.78*** 337.11*** 464.51*** 518.72*** 335.98*** 488.19*** R2 0.389 0.361 0.392 0.454 0.405 0.456 - - 19.71*** - - 2.96* 1 The 2003 SAEB survey excluded students who lived in rural areas in the eighth grade and high school sample. Note: Values in parentheses represent t-values. *** Notes significance at the 1% level. ** Notes significance at the 5% level. * Notes significance at the 10% level.
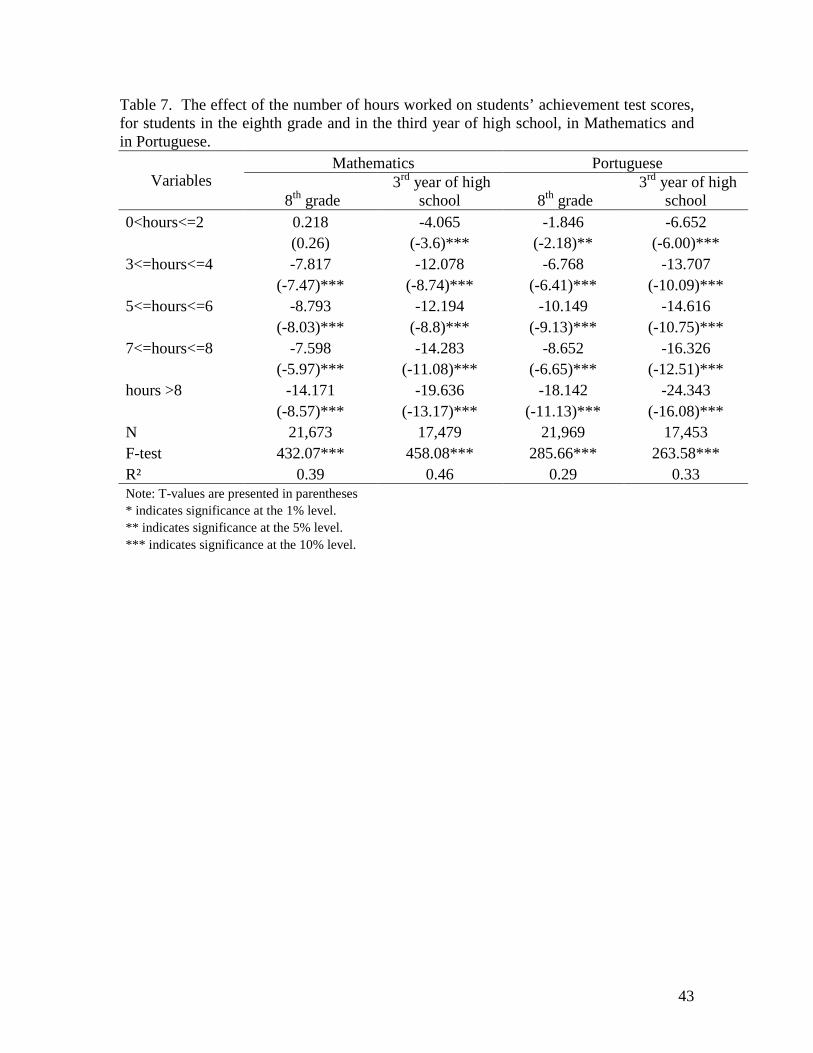
43
Table 7. The effect of the number of hours worked on students’ achievement test scores, for students in the eighth grade and in the third year of high school, in Mathematics and in Portuguese.
Variables Mathematics Portuguese
8th grade 3rd year of high
school 8th grade 3rd year of high
school 0<hours<=2 0.218 -4.065 -1.846 -6.652 (0.26) (-3.6)*** (-2.18)** (-6.00)*** 3<=hours<=4 -7.817 -12.078 -6.768 -13.707 (-7.47)*** (-8.74)*** (-6.41)*** (-10.09)*** 5<=hours<=6 -8.793 -12.194 -10.149 -14.616 (-8.03)*** (-8.8)*** (-9.13)*** (-10.75)*** 7<=hours<=8 -7.598 -14.283 -8.652 -16.326 (-5.97)*** (-11.08)*** (-6.65)*** (-12.51)*** hours >8 -14.171 -19.636 -18.142 -24.343 (-8.57)*** (-13.17)*** (-11.13)*** (-16.08)*** N 21,673 17,479 21,969 17,453 F-test 432.07*** 458.08*** 285.66*** 263.58*** R² 0.39 0.46 0.29 0.33 Note: T-values are presented in parentheses * indicates significance at the 1% level. ** indicates significance at the 5% level. *** indicates significance at the 10% level.
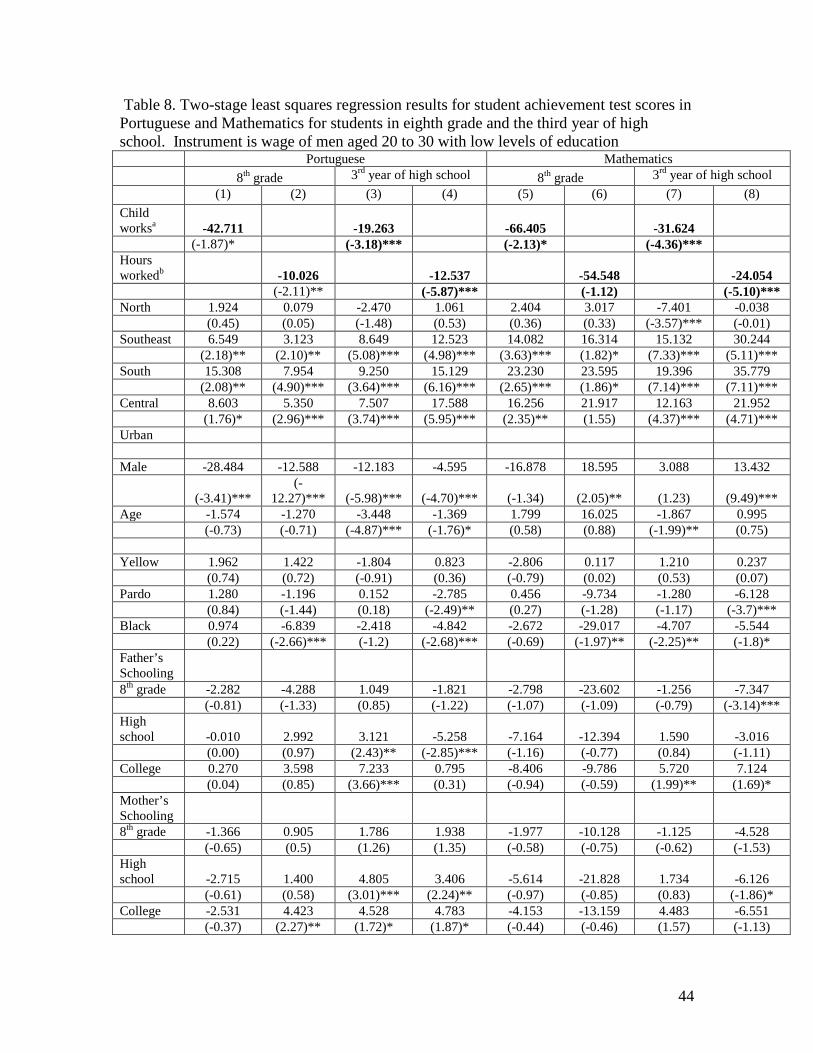
44
Table 8. Two-stage least squares regression results for student achievement test scores in Portuguese and Mathematics for students in eighth grade and the third year of high school. Instrument is wage of men aged 20 to 30 with low levels of education Portuguese Mathematics 8th grade 3rd year of high school 8th grade 3rd year of high school (1) (2) (3) (4) (5) (6) (7) (8) Child worksa -42.711 -19.263 -66.405 -31.624 (-1.87)* (-3.18)*** (-2.13)* (-4.36)*** Hours workedb -10.026 -12.537 -54.548 -24.054 (-2.11)** (-5.87)*** (-1.12) (-5.10)*** North 1.924 0.079 -2.470 1.061 2.404 3.017 -7.401 -0.038 (0.45) (0.05) (-1.48) (0.53) (0.36) (0.33) (-3.57)*** (-0.01) Southeast 6.549 3.123 8.649 12.523 14.082 16.314 15.132 30.244 (2.18)** (2.10)** (5.08)*** (4.98)*** (3.63)*** (1.82)* (7.33)*** (5.11)*** South 15.308 7.954 9.250 15.129 23.230 23.595 19.396 35.779 (2.08)** (4.90)*** (3.64)*** (6.16)*** (2.65)*** (1.86)* (7.14)*** (7.11)*** Central 8.603 5.350 7.507 17.588 16.256 21.917 12.163 21.952 (1.76)* (2.96)*** (3.74)*** (5.95)*** (2.35)** (1.55) (4.37)*** (4.71)*** Urban Male -28.484 -12.588 -12.183 -4.595 -16.878 18.595 3.088 13.432
(-3.41)*** (-
12.27)*** (-5.98)*** (-4.70)*** (-1.34) (2.05)** (1.23) (9.49)*** Age -1.574 -1.270 -3.448 -1.369 1.799 16.025 -1.867 0.995 (-0.73) (-0.71) (-4.87)*** (-1.76)* (0.58) (0.88) (-1.99)** (0.75) Yellow 1.962 1.422 -1.804 0.823 -2.806 0.117 1.210 0.237 (0.74) (0.72) (-0.91) (0.36) (-0.79) (0.02) (0.53) (0.07) Pardo 1.280 -1.196 0.152 -2.785 0.456 -9.734 -1.280 -6.128 (0.84) (-1.44) (0.18) (-2.49)** (0.27) (-1.28) (-1.17) (-3.7)*** Black 0.974 -6.839 -2.418 -4.842 -2.672 -29.017 -4.707 -5.544 (0.22) (-2.66)*** (-1.2) (-2.68)*** (-0.69) (-1.97)** (-2.25)** (-1.8)* Father’s Schooling 8th grade -2.282 -4.288 1.049 -1.821 -2.798 -23.602 -1.256 -7.347 (-0.81) (-1.33) (0.85) (-1.22) (-1.07) (-1.09) (-0.79) (-3.14)*** High school -0.010 2.992 3.121 -5.258 -7.164 -12.394 1.590 -3.016 (0.00) (0.97) (2.43)** (-2.85)*** (-1.16) (-0.77) (0.84) (-1.11) College 0.270 3.598 7.233 0.795 -8.406 -9.786 5.720 7.124 (0.04) (0.85) (3.66)*** (0.31) (-0.94) (-0.59) (1.99)** (1.69)* Mother’s Schooling 8th grade -1.366 0.905 1.786 1.938 -1.977 -10.128 -1.125 -4.528 (-0.65) (0.5) (1.26) (1.35) (-0.58) (-0.75) (-0.62) (-1.53) High school -2.715 1.400 4.805 3.406 -5.614 -21.828 1.734 -6.126 (-0.61) (0.58) (3.01)*** (2.24)** (-0.97) (-0.85) (0.83) (-1.86)* College -2.531 4.423 4.528 4.783 -4.153 -13.159 4.483 -6.551 (-0.37) (2.27)** (1.72)* (1.87)* (-0.44) (-0.46) (1.57) (-1.13)
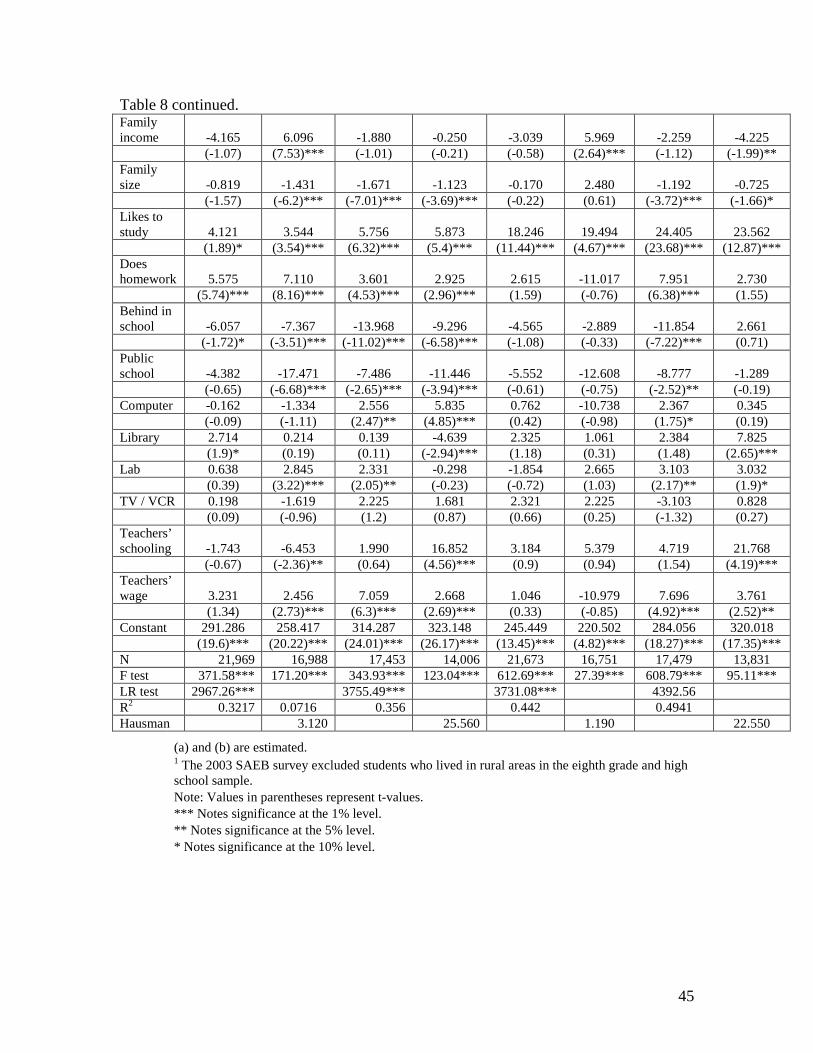
45
Table 8 continued. Family income -4.165 6.096 -1.880 -0.250 -3.039 5.969 -2.259 -4.225 (-1.07) (7.53)*** (-1.01) (-0.21) (-0.58) (2.64)*** (-1.12) (-1.99)** Family size -0.819 -1.431 -1.671 -1.123 -0.170 2.480 -1.192 -0.725 (-1.57) (-6.2)*** (-7.01)*** (-3.69)*** (-0.22) (0.61) (-3.72)*** (-1.66)* Likes to study 4.121 3.544 5.756 5.873 18.246 19.494 24.405 23.562 (1.89)* (3.54)*** (6.32)*** (5.4)*** (11.44)*** (4.67)*** (23.68)*** (12.87)*** Does homework 5.575 7.110 3.601 2.925 2.615 -11.017 7.951 2.730 (5.74)*** (8.16)*** (4.53)*** (2.96)*** (1.59) (-0.76) (6.38)*** (1.55) Behind in school -6.057 -7.367 -13.968 -9.296 -4.565 -2.889 -11.854 2.661 (-1.72)* (-3.51)*** (-11.02)*** (-6.58)*** (-1.08) (-0.33) (-7.22)*** (0.71) Public school -4.382 -17.471 -7.486 -11.446 -5.552 -12.608 -8.777 -1.289 (-0.65) (-6.68)*** (-2.65)*** (-3.94)*** (-0.61) (-0.75) (-2.52)** (-0.19) Computer -0.162 -1.334 2.556 5.835 0.762 -10.738 2.367 0.345 (-0.09) (-1.11) (2.47)** (4.85)*** (0.42) (-0.98) (1.75)* (0.19) Library 2.714 0.214 0.139 -4.639 2.325 1.061 2.384 7.825 (1.9)* (0.19) (0.11) (-2.94)*** (1.18) (0.31) (1.48) (2.65)*** Lab 0.638 2.845 2.331 -0.298 -1.854 2.665 3.103 3.032 (0.39) (3.22)*** (2.05)** (-0.23) (-0.72) (1.03) (2.17)** (1.9)* TV / VCR 0.198 -1.619 2.225 1.681 2.321 2.225 -3.103 0.828 (0.09) (-0.96) (1.2) (0.87) (0.66) (0.25) (-1.32) (0.27) Teachers’ schooling -1.743 -6.453 1.990 16.852 3.184 5.379 4.719 21.768 (-0.67) (-2.36)** (0.64) (4.56)*** (0.9) (0.94) (1.54) (4.19)*** Teachers’ wage 3.231 2.456 7.059 2.668 1.046 -10.979 7.696 3.761 (1.34) (2.73)*** (6.3)*** (2.69)*** (0.33) (-0.85) (4.92)*** (2.52)** Constant 291.286 258.417 314.287 323.148 245.449 220.502 284.056 320.018 (19.6)*** (20.22)*** (24.01)*** (26.17)*** (13.45)*** (4.82)*** (18.27)*** (17.35)*** N 21,969 16,988 17,453 14,006 21,673 16,751 17,479 13,831 F test 371.58*** 171.20*** 343.93*** 123.04*** 612.69*** 27.39*** 608.79*** 95.11*** LR test 2967.26*** 3755.49*** 3731.08*** 4392.56 R2 0.3217 0.0716 0.356 0.442 0.4941 Hausman 3.120 25.560 1.190 22.550
(a) and (b) are estimated. 1 The 2003 SAEB survey excluded students who lived in rural areas in the eighth grade and high school sample. Note: Values in parentheses represent t-values. *** Notes significance at the 1% level. ** Notes significance at the 5% level. * Notes significance at the 10% level.