the impact of biochar addition on nutrient leaching and soil properties from tillage soil amended...
TRANSCRIPT

The Impact of Biochar Addition on Nutrient Leaching and SoilProperties from Tillage Soil Amended with Pig Manure
Shane M. Troy & Peadar G. Lawlor &
Cornelius J. O’ Flynn & Mark G. Healy
Received: 24 September 2013 /Accepted: 5 February 2014# Springer International Publishing Switzerland 2014
Abstract The application of pig manure to a tillage soilcan result in pollution of surface and groundwater bod-ies. Countries in the European Union are required tocomply with the Water Framework Directive, whichstates that all countries should attain at least “goodstatus” surface and ground water quality by 2015.Amendment of soil with biochar has previously beenshown to reduce nutrient leaching and improve soilproperties. The objectives of this laboratory study wereto investigate if the application of two types of biochar ata rate of 18 t ha−1 (a) reduced leaching of carbon (C),nitrogen (N) and phosphorus (P) from a low P Indextillage soil amended with pig manure and (b) affectedthe soil properties before and after pig manure applica-tion. Three treatments were examined as follows: (a)non-amended soil (the study control), (b) soil mixedwith biochar from the separated solid fraction of anaer-obically digested pig manure, and (c) of soil mixed withbiochar from Sitka Spruce. Columns, filled with sieved
soil (<2 mm) and biochar (<2 mm), were incubated for30weeks at 10 °C and 75% relative humidity and leachedwith 160 mL distilled water per week. Pig manure, equiv-alent to 170 kg N ha−1 and 36 kg P ha−1, was applied tohalf of the columns in each treatment after 10 weeks ofincubation. Amendment with pig manure biochar in-creased the Morgan’s P content of the soil, while leachingof P and C also increased, indicating the unsuitability ofpig manure biochar as an amendment to soils which maybe used as pig manure spreadlands. However, the additionof wood biochar increased soil water, C and organicmatter contents, while reducing nitrate and organic Cleaching. The addition of wood-derived biochar to tillagesoil which will receive pig manure may be justifiable, as itreduces nutrient leaching from the soil, sequesters C andmay allow for higher application rates of pig manure.
Keywords Black carbon .Water framework directive .
Nitrate . Landspreading . Phosphorus . Carbon
1 Introduction
The European Union (EU) Water Framework Directive(WFD; 2000/60/EC; EC 2000) aims to achieve at least‘good status’ of all surface and groundwater by 2015. Tomeet this objective, Programmes of Measures (POM)must be implemented in all EU member states. InIreland, POM are enacted by the Nitrates Directive(91/676/EEC; EEC 1991), which limits the magnitudeand timing of inorganic fertilizer and organic manureapplications to land. To address the requirements of the
Water Air Soil Pollut (2014) 225:1900DOI 10.1007/s11270-014-1900-6
S. M. Troy (*) : P. G. LawlorTeagasc, Pig Development Department, Animal & GrasslandResearch & Innovation Centre,Moorepark, Fermoy, Co. Cork, Irelande-mail: [email protected]
S. M. Troy : C. J. O’ Flynn :M. G. HealyDepartment of Civil Engineering, NationalUniversity of Ireland, Galway,Co. Galway, Ireland
S. M. TroyScotland’s Rural College, Future Farming Systems,Roslin Institute Building,Easter Bush, Edinburgh EH25 9RG, UK

WFD, the quantity of livestock manure which can beapplied to land cannot exceed 170 kg ha−1 year−1 fornitrogen (N) and 49 kg ha−1 year−1 for phosphorus (P).This limit is dependent on soil test phosphorus (STP;based on plant available Morgan’s P (Pm)) concentra-tion in the soil. The Soil P Index is used to categoriseSTP concentrations, with a range from Soil P Index 1(deficient in STP) to 4 (excessive STP; Schulte et al.2010). The amount by which these application limitscan be exceeded will be reduced gradually to zero byJanuary 1, 2017. Many grassland soils which have pre-viously been used as spreadlands for pig manure arelikely to have become high in STP, and therefore, beunsuitable for this purpose in the future (Hackett 2007).The implication of this will be that pig farmers mayrequire additional spreadlands than is currently the case,thereby increasing the need for pig slurry export, thusincreasing costs. The addition of biochar to soil mayprovide an answer to this problem. Previous studieshave shown that biochar can increase the nutrient reten-tion capacity of soil, reducing leaching, sequesteringcarbon (C), improving soil properties, and allowing forhigher application rates of organic manures (Laird et al.2010a, b; Singh et al. 2010).
Biochar is produced from the pyrolysis of organicfeedstocks such as wood and crop residues, sludge,digestate and manures (Troy et al. 2013a). During thepyrolysis process, the organic portion of the feedstocksis converted to solid (char), liquid (pyrolysis oil), andgaseous fractions. When applied to soil as a soil condi-tioner, the char is known as biochar. Biochar addition tosoil has been shown to influence soil physico-chemicalproperties, such as pH, porosity, bulk density, pore-sizedistribution, water holding capacity, soil surface area,drainage, and aeration (Glaser et al. 2002; Chan et al.2007; Downie et al. 2009; Laird et al. 2010b). Theresponse of soils to biochar amendment depends onthe biochar properties, soil properties, and on furthernutrient addition to soil (Lehmann and Rondon 2006).The feedstock and pyrolysis conditions used to producethe biochar can also have a significant impact on theeffects of the biochar when applied to soils; differencesin feedstock nutrient concentrations can persist evenafter pyrolysis (DeLuca et al. 2009), while the pyrolysistemperature can also affect the concentrations of thesenutrients (Chan et al. 2008; Gaskin et al. 2008).
Previous studies have documented reduced leachingfrom soil amended with biochar (Lehmann et al. 2003,Novak et al. 2009; Laird et al. 2010a; Singh et al. 2010).
The retention of nutrients in the soil has been attributedto the higher sorption capacity of biochar (Novak et al.2009; Singh et al. 2010), increased water retention,which reduces leaching of mobile nutrients, increasedgrowth rate of microorganisms (Ishii and Kadoya 1994;Steiner et al. 2008b), and alterations to the N cyclingprocess within the soil (Steiner et al. 2008a; DeLucaet al. 2009; Clough et al. 2010; Laird et al. 2010a;Clough et al. 2013). However, these studies mostlyoccurred in tropical and subtropical areas. Research onbiochar application to soils in temperate regions is se-verely lacking (Verhejien et al. 2010). There is also apaucity of data concerning biochar from feedstocksother than wood, and future research needs to focus onbiochar production from crop residues, manures, sew-age, and green wastes (Verhejien et al. 2010). The use ofmanure biochars may have additional benefits tofarmers. The addition of biochar from chicken manurehas been shown to increase N availability in soil (Chanet al. 2008). The P and potassium (K) contents ofmanure are almost completely recovered in the biochar,leading to higher concentrations in the biochar than inthe original manure (Ro et al. 2010). Due to its higher N,P and K concentrations, biochar from manure may offeradditional benefits as a low-grade fertilizer, even whenused without other forms of fertilization.
Therefore, the objectives of this laboratory studywere to investigate if biochar derived from both pigmanure and wood (Sitka Spruce): (a) reduced nutrientleaching from a low P Index tillage soil amended withpig manure and (b) affected the soil properties beforeand after pig manure application.
2 Materials and Methods
2.1 Soil and Biochar
Surface soil to a depth of 0.2 m was collected from atillage farm near Fermoy, County Cork. The soil wasfree-draining and classified as an Acid Brown Earth(Regan et al. 2010). A low P Index tillage soil waschosen as this type of soil will be the most likelyrecipient of pig manure, once the new fertiliser applica-tion limits are in force. The soil was air dried, passedthrough a 2-mm sieve, and mixed to ensure homogene-ity. This unstructured soil consisted of 57 % sand, 29 %silt, and 14 % clay, giving it a sandy loam texture.
1900, Page 2 of 15 Water Air Soil Pollut (2014) 225:1900

Two types of biochar were used for this study: pigmanure biochar and wood biochar. Pig manure biocharwas produced from the solid fraction of separated pigmanure after anaerobic digestion, which was thenmixedwith Sitka Spruce sawdust (at a 4:1 ratio by wet weight),and subjected to slow pyrolysis in a laboratory pyrolysisreactor operated at 600 °C, similar to the methods de-scribed in Troy et al. (2013a). Wood biochar was pro-duced by slow pyrolysis of Sitka Spruce wood in alarge-scale pyrolysis reactor at 600 °C. Both biocharswere ground to pass through a 2-mm sieve. The charac-teristics of the biochars are given in Table 1.
2.2 Preparation of Soil Columns
The experiment was conducted in 0.3-m-deep and0.104-m internal diameter PVC columns, which werepacked with soil to a depth of 0.2 m. The PVC columnswere sealed at the base with perforated PVC end-caps toallow for the outflow of leachate, ensuring the soilremained free-draining. The three mixtures, examinedover a study duration of 30 weeks, were as follows: (a)non-amended soil (the study control), (b) soil mixedwith pig manure biochar (PM600), and (c) of soil mixedwith wood biochar (W600). Half of the columns fromeachmixture received pigmanure after 10weeks, givinga total of six treatments. Twelve replicates of eachtreatment were set up to allow for destructive testing atthree time periods during the trial. Batches of air-driedsieved soil (<2 mm) were mixed by hand with sievedbiochar (<2 mm) at biochar application rates equivalentto 18 t ha−1 to a soil depth of 0.2 m. Prior to placing thesoil in the columns, distilled water was added to bringthe mixtures to a water content (WC) of approximately
26 % (the WC of the soil in the field at the time ofsampling) and the mixture was thoroughly mixed byhand. The field water holding capacity of the soil equat-ed to a WC of 53 %. Pea gravel, 5–10 mm in size, wasplaced at the base of each column to a depth of 0.05 mand was overlain by soil mixtures (with a dry bulkdensity of 1.1 g cm−1) to a depth of 0.2 m. The soilwas packed in 0.05-m-deep increments to ensure uni-form packing of soil. The characteristics of the soil andthe soil and biochar mixes before leaching are given inTable 2.
2.3 Soil Column Incubation and Leaching
The temperature (10 °C) and relative humidity (75 %) atwhich the columns were stored were based on climaticconditions in Ireland (Walsh 2012). All columns wereleached with 160 mL of distilled water, applied twiceweekly in two 80-mL doses over two hours, each weekfor 30 weeks. The rate of water addition was designed tosimulate a weekly total rainfall of 19 mm per week;980 mm per year, which is in the mid-range of averageyearly precipitation in Ireland (Walsh 2012). On week10 of the study, pig manure, collected from an integratedpig farm in Fermoy, Co. Cork, was applied to the surfaceof half of the columns of each mixture at a rate equiv-alent to 170 kg N ha−1 and 36 kg P ha−1. The columnswhich received pig manure were then known asControl+PM, PM600+PM and W600+PM. The pigmanure had a dry matter content of 3.0±0.2 % and totalN (TN), ammonium (NH4-N) and total P (TP) contentsof 2.94±0.16, 1.74±0.01 and 0.62±0.03 kg m−3, re-spectively. The carbon content of the pig manure was5.86±0.08 kg m−3, while its pH was 7.5±0.1 %.
2.4 Leachate Analyses
A sample of leached water was collected from the baseof each column once per week for analysis. Unfilteredleachate samples were analyzed for total organic C(TOC) and TN using a BioTector TOC TN TPAnalyzer (BioTector Analytical Systems Limited,Cork, Ireland). Sub-samples of leachate were passedthrough a 0.45-μm filter to remove particulates andanalyzed colorimetrically for total oxidised N, NH4,nitrite (NO2), and dissolved reactive P (DRP) using anutrient analyser (Konelab 20, Thermo ClinicalLabsystems, Finland). Nitrate was calculated bysubtracting NO2 from total oxidised N. Filtered and
Table 1 Characteristics of the biochars used in the column exper-iment (mean±SD)
Pig manure biochar Wood biochar
Water content (%) 0.39±0.044 0.45±0.039
Organic matter (%) 72.5±0.78 97.0±1.24
Bulk density (g cm−3) 0.19±0.020 0.18±0.016
Total N (%) 2.67±0.042 0.42±0.024
Total C (%) 62.7±1.30 82.0±1.15
Total H (%) 2.60±0.184 1.82±0.165
WEP (mg kg−1) 112.8±5.36 3.6±0.20
pH 9.6±0.34 9.3±0.19
WEP water extractable phosphorus
Water Air Soil Pollut (2014) 225:1900 Page 3 of 15, 1900
unfiltered samples were tested for total dissolved P(TDP) and TP using acid persulfate digestion.Particulate P (PP) was calculated by subtracting TDPfrom TP. Dissolved unreactive P (DUP) was calculatedby subtracting DRP from TDP.
2.5 Analysis of Soil and Biochar Properties
Columns (n=4) from each treatment were destructivelysampled at time increments of 10, 20, and 30 weeks.Analyses were conducted at depth increments of 0–0.05,0.05–0.1, and 0.1–0.2 m below the soil surface. The soilfrom each depth increment was air-dried and sieved to aparticle size of 2 mm, or less, before analyses. Theorganic matter (OM) content of the soil was determinedusing the loss on ignition test (B.S.1377-3; BSI 1990).Bulk density (ρb) and total porosity (n) were calculatedaccording to Haney and Haney (2010).Water-filled porespace (WFPS) was estimated from WC, bulk density,and total porosity in accordance with Haney and Haney(2010):
WFPS ¼ WC � ρbn
Water extractable P (WEP) was measured by shaking5 g of soil in 25 mL of distilled water for 30 min,filtering (0.45 μm) the supernatant water and determin-ing P colorimetrically (McDowell and Sharpley 2001).Morgan’s P was determined using Morgan’s extractingsolution (Morgan 1941). Soil total C and TN were
determined by high temperature combustion using aLECO Truspec CN analyser (LECO Corporation, St.Joseph, MI, USA). Water soluble organic C (WSOC)was determined by shaking a 1:10 extract ofsoil/biochar-to-deionised water (w/v) for 30 min (Yanaiet al. 2007), filtering (0.45 μm) the supernatant waterand determining TOC using a BioTector TOC TN TPAnalyzer (BioTector Analytical Systems Limited, Cork,Ireland).
The ability of the biochar and soil to adsorb P wasassessed using a batch experiment (Fenton et al. 2009;O’Flynn et al. 2013). In graduated containers, 90 ml ofortho-phosphorus (PO4-P) solutions, prepared using dis-solved potassium phosphate (KH2PO4) in distilled wa-ter, ranging in concentration from 3 to 30 mg P L−1,were added to 5 g samples of biochar or soil. Themixtures were shaken using an end-over-end shakerfor 24 hours. Sub-samples of the supernatant werepassed through 0.45 μm filters and analysed colorimet-rically for DRP using a nutrient analyser. A Langmuirisotherm was used to estimate the mass of P adsorbedper mass of the soil or biochar (Fenton et al. 2009):
Cex=m
¼ 1
abþ Ce
b
where Ce is the concentration of P in solution at equi-librium (mg L−1), x/m is the mass of P adsorbed per unitdry weight of soil or biochar (g kg−1), a is a constantrelated to the binding strength of molecules onto soil or
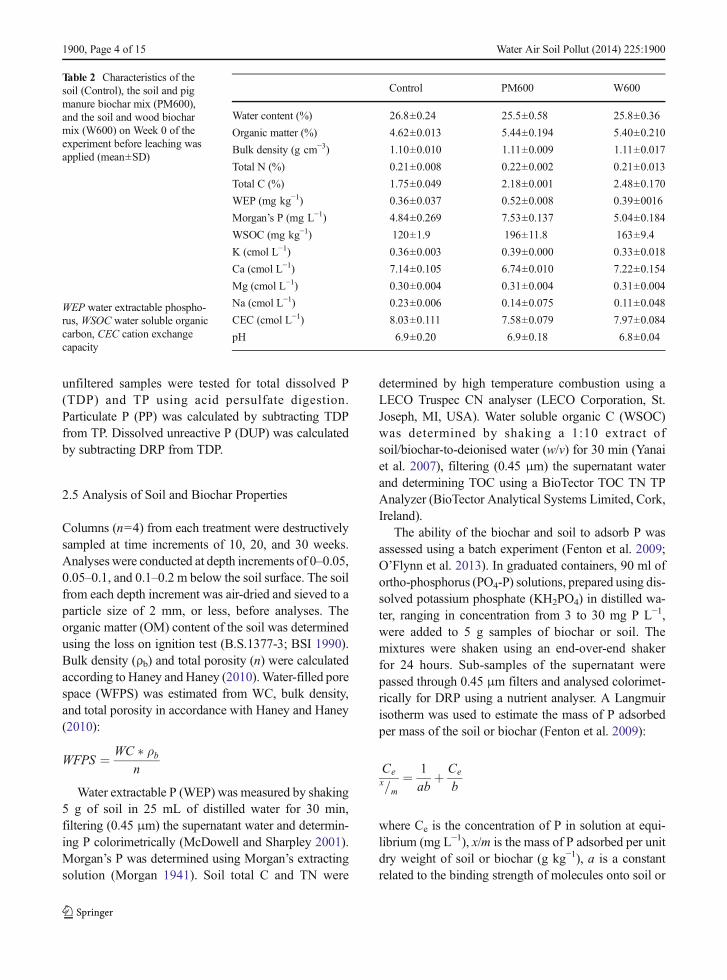
Table 2 Characteristics of thesoil (Control), the soil and pigmanure biochar mix (PM600),and the soil and wood biocharmix (W600) on Week 0 of theexperiment before leaching wasapplied (mean±SD)
WEP water extractable phospho-rus, WSOC water soluble organiccarbon, CEC cation exchangecapacity
Control PM600 W600
Water content (%) 26.8±0.24 25.5±0.58 25.8±0.36
Organic matter (%) 4.62±0.013 5.44±0.194 5.40±0.210
Bulk density (g cm−3) 1.10±0.010 1.11±0.009 1.11±0.017
Total N (%) 0.21±0.008 0.22±0.002 0.21±0.013
Total C (%) 1.75±0.049 2.18±0.001 2.48±0.170
WEP (mg kg−1) 0.36±0.037 0.52±0.008 0.39±0016
Morgan’s P (mg L−1) 4.84±0.269 7.53±0.137 5.04±0.184
WSOC (mg kg−1) 120±1.9 196±11.8 163±9.4
K (cmol L−1) 0.36±0.003 0.39±0.000 0.33±0.018
Ca (cmol L−1) 7.14±0.105 6.74±0.010 7.22±0.154
Mg (cmol L−1) 0.30±0.004 0.31±0.004 0.31±0.004
Na (cmol L−1) 0.23±0.006 0.14±0.075 0.11±0.048
CEC (cmol L−1) 8.03±0.111 7.58±0.079 7.97±0.084
pH 6.9±0.20 6.9±0.18 6.8±0.04
1900, Page 4 of 15 Water Air Soil Pollut (2014) 225:1900

biochar, and b is the maximum adsorption capacity(g kg−1).
2.6 Statistical Analysis
Soil and leachate data were analyzed using theStatistical Analyses System (SAS Institute 2004) witheach column as the experimental unit. For all analyses,statistical significance was given as p<0.05.Water con-tent, OM, Morgan’s P, WEP, N and C contents, and C:Nratio were analysed as repeated measures using theMIXED procedure of SAS with Tukey-Kramer adjust-ment for multiple comparisons. The dependent variableswere: WC, OM, Morgan’s P, WEP, N and C contents,and C:N ratio. For all the above analyses, the fixedeffects were: treatment, week, depth, and column.Comparison of cumulative leaching of TN, NO3, NO2,NH4, TP, TDP, DRP, DUP, PP, and TOC (between bothweek 1 and 30, and week 11 and 30) was performedusing the MIXED procedure in SAS. Total nitrogen,NO3, NO2, NH4, TP, TDP, DRP, DUP, PP, and TOCwere the dependent variables. Treatment was includedas a fixed effect. Total organic C and NO3 were analysedas repeated measures using the MIXED procedure ofSAS with Tukey–Kramer adjustment for multiple com-parisons. The dependent variables were as follows: TOC
and NO3. The fixed effects were: treatment, week andcolumn.
3 Results and Discussions
3.1 Water Content and Organic Matter
The columns remained free draining throughout theexperiment. No leachate passed through the columnson the first week of leaching. On week 2, the leachatevolume collected was 133±15.7, 89±9.0, and 75±6.2 mL for Control, PM600, and W600 columns, re-spectively. From week 5 onwards, except for week 11when the manure was added, the average leachate vol-ume was greater than 147 mL for all columns. Theaverage leachate volume collected from week 12 to 30was 151±2.2, 152±2.4, and 154±1.8 mL for Control,PM600, and W600, respectively; while the averagesfrom week 12 to 30 were 151±1.6, 152±1.5, and 153±1.9 for Control+PM, PM600+PM, and W600+PM,respectively.
The WC of all treatments increased significantlybetween week 0 and week 10 (p<0.01; Fig. 1). TheWC on week 0 was between 25.5 % and 26.7 %, butby week 10, the WC had risen to >31 % for all
WC (%) WC (%)
Soil
dept
h (c
m)
Soil
dept
h (c
m)
0
5
10
15
20
20 25 30 35 40 45
Week 0
20 25 30 35 40 45
Week 10
0
5
10
15
20
20 25 30 35 40 45
Week 20
20 25 30 35 40 45
Week 30
Control PM600 W600
Control + PM PM600 + PM W600 + PM
Fig. 1 Soil water content (WC) atdifferent sampling events anddepths. Control=soil only.PM600=soil+pig manurebiochar. W600=soil+woodbiochar. Treatments amendedwith the pig manure betweenweek 10 and 11 are shown with(+PM)
Water Air Soil Pollut (2014) 225:1900 Page 5 of 15, 1900
treatments at all sampling depths. After week 10, therewas no further significant increase in WC (p>0.05).There was an increase in WC with sampling depth: soilsampled at the 0.1–0.2 m depth had a significantlyhigher WC than soil at the 0–0.05 m depth for alltreatments on every sampling week (p<0.0001). Therewas an increase in the WC of the biochar-amendedtreatments when compared with the Control on mostsampling weeks. On week 30, the WC of biochar-amended treatments at each sampling depth was 7.2–13.6 % greater than that at the corresponding samplingdepth of the Control. Previous studies have shown thatbiochar-amended soil can have a higher water holdingcapacity than unamended soil due blockages of soilpores by the smallest sized fraction of biochar, increasednet surface area with biochar addition, or the increasedOM content of biochar-amended soils (Downie et al.2009; Laird et al. 2010b; Streubel et al. 2011). Soil WCcan impact many soil processes, including mineraliza-tion, plant uptake, leaching and denitrification(Porporato et al. 2003). The addition of pig manurehad no effect on soil WC (p>0.05).
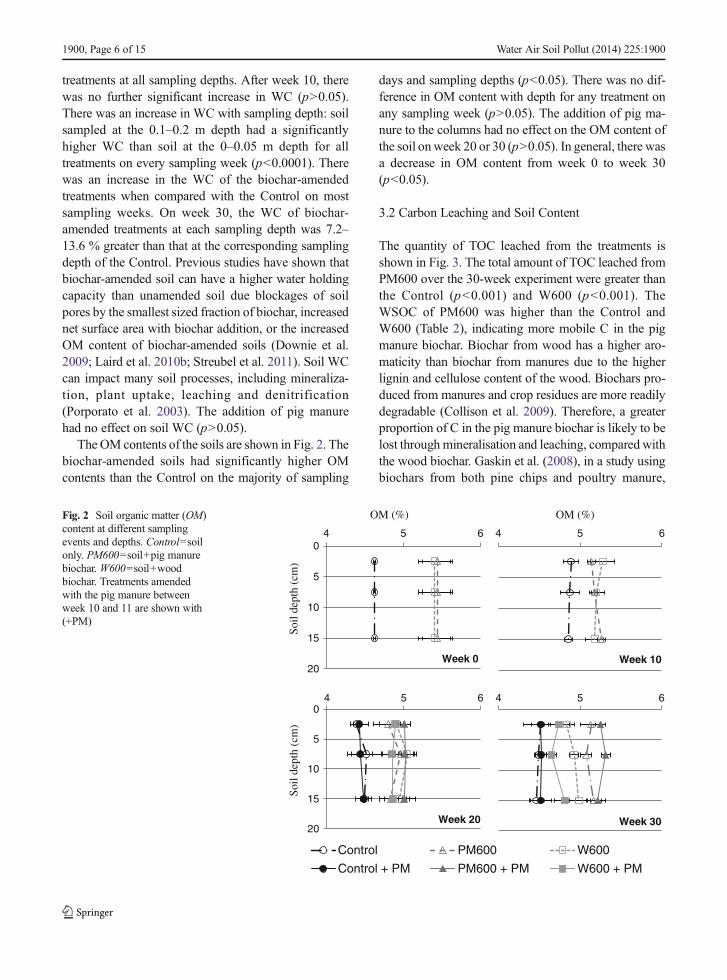
The OM contents of the soils are shown in Fig. 2. Thebiochar-amended soils had significantly higher OMcontents than the Control on the majority of sampling
days and sampling depths (p<0.05). There was no dif-ference in OM content with depth for any treatment onany sampling week (p>0.05). The addition of pig ma-nure to the columns had no effect on the OM content ofthe soil on week 20 or 30 (p>0.05). In general, there wasa decrease in OM content from week 0 to week 30(p<0.05).
3.2 Carbon Leaching and Soil Content
The quantity of TOC leached from the treatments isshown in Fig. 3. The total amount of TOC leached fromPM600 over the 30-week experiment were greater thanthe Control (p<0.001) and W600 (p<0.001). TheWSOC of PM600 was higher than the Control andW600 (Table 2), indicating more mobile C in the pigmanure biochar. Biochar from wood has a higher aro-maticity than biochar from manures due to the higherlignin and cellulose content of the wood. Biochars pro-duced from manures and crop residues are more readilydegradable (Collison et al. 2009). Therefore, a greaterproportion of C in the pig manure biochar is likely to belost throughmineralisation and leaching, compared withthe wood biochar. Gaskin et al. (2008), in a study usingbiochars from both pine chips and poultry manure,
OM (%) OM (%)
Soil
dept
h (c
m)
Soil
dept
h (c
m)
0
5
10
15
20
4 5 6
Week 0
4 5 6
Week 10
0
5
10
15
20
4 5 6
Week 20
4 5 6
Week 30
Control PM600 W600
Control + PM PM600 + PM W600 + PM
Fig. 2 Soil organic matter (OM)content at different samplingevents and depths. Control=soilonly. PM600=soil+pig manurebiochar. W600=soil+woodbiochar. Treatments amendedwith the pig manure betweenweek 10 and 11 are shown with(+PM)
1900, Page 6 of 15 Water Air Soil Pollut (2014) 225:1900

produced at 500 °C, found that leaching of total dis-solved C from the manure-based biochar was seventimes higher than that leached from the wood-basedbiochar (0.85 and 0.12 g kg−1, respectively).
There was significantly less TOC being leached fromW600, compared with the Control (p<0.001), on weeks2-18. This occurred despite the fact that W600 had ahigher WSOC content than the Control at the beginningof the experiment (Table 2). The reduction in TOCleaching in this study is likely to be due to enhancedmineralisation in the wood-biochar-amended treat-ments. Some of the organic C may also be used as anelectron donor for denitrification. This reduction in TOCleaching is not seen in the PM600 treatment comparedwith the Control, due to the high WSOC of this treat-ment (Table 2). Laird et al. (2010a) also found reducedTOC leaching through the addition of wood-based bio-char to soil compared with unamended soil. They sug-gested that TOC leaching was reduced through theability of wood biochar to adsorb organic C. However,this was not the case in the current study, as the cationexchange capacity (CEC) of the biochar-amended treat-ments was similar to that of the Control (Table 2). Theanion exchange capacity (AEC) of the biochar is alsounlike to have had an effect on nutrient leaching as theAEC of biochar has been found to be limited and todecrease rapidly with oxidation within the soil (Chenget al., 2008). Pig manure addition did not result inincreased TOC leaching (p>0.05) in the manure-amended treatments.
The C content of the biochar-amended soils washigher than the Control soil on every sampling week
(Table 3). The addition of pig manure did not increasethe soil C content (p>0.05). In a companion study usingthe same soil columns, Troy et al. (2013b) found thatbetween 44 % and 54 % of the total applied manure Cwas mineralised to CO2 in the 28 days after manureapplication. The soil C:N ratio in the W600 treatmentwas generally greater than that of the Control on allsampling weeks and depths (p<0.05; Table 3). The soilC:N ratio of the PM600 soil was also greater than that ofthe Control on the majority of sampling days anddepths. The addition of pig manure did not increasethe soil C:N ratio in the manure-amended treatments,except for the 0–5 cm depth in W600+PM on week 20(Table 3).
3.3 Nitrogen Leaching and Soil Content
Generally, there were no significant differences in soil Ncontent between the treatments at any time of destruc-tive sampling (Table 3). The addition of pig manure didnot increase the soil N content in the manure-amendedtreatments (p>0.05).
The total amount of N leached from the soil columnsover the 30-week experiment is shown in Fig. 4. Nitrateaccounts for 90 % of leached TN over the entire studyduration. Following pig manure application, betweenweeks 10 and 11, there was a significant increase inthe total amount of TN leached from the manure-amended columns compared with the other columns(p<0.001 for all three treatments). Of the 144 mg ofpig TN added as pig manure, 66–70 mg (46–49 %) had
mg/column
Week
0
1
2
3
4
5
6
7
8
0 5 10 15 20 25 30
Control PM600 W600
Control + PM PM600 + PM W600 + PM
Fig. 3 Weekly total of TOCleached from soil columns.Control=soil only. PM600=soil+pig manure biochar.W600=soil+wood biochar. Treatmentsamended with the pig manurebetween week 10 and 11 areshown with (+PM)
Water Air Soil Pollut (2014) 225:1900 Page 7 of 15, 1900

leached by week 30, with no significant differencesbetween treatments.
The amount of NO3 and NO2 in the leachate exitingthe soil columns each week is shown in Figs. 5 (a) and(b). High concentrations of NO3 were leached from alltreatments for the first number of weeks, peaking at
>110 mg L−1 for all treatments on week 3. There wasa swift decline in the concentration of NO3 in the leach-ate after week 4, and by week 9, the concentration ofNO3 in the leachate had decreased to <35 mg L−1
(<5.3 mg week−1) for all treatments and remained belowthis value for all the non-manure-amended columns for
Table 3 Carbon, nitrogen (%), and C:N ratio for the soil (Control), the soil and pig manure biochar mix (PM600), and the soil and woodbiochar mix (W600) at 3 depths (cm below surface) over 4 events
Week Depth Control PM600 W600 Pig manure added week 10 s.e. p
Control PM600 W600
Carbon
0 1.75a 2.18b 2.48b 0.072 <0.05
10 0–5 1.81a 2.25b 2.42b 0.035 <0.001
5–10 1.80a 2.30b 2.45b 0.035 <0.001
10–20 1.81a 2.29b 2.39b 0.035 <0.001
20 0–5 1.67a 2.14b 2.29b 1.79a 2.17b 2.28b 0.039 <0.001
5–10 1.72a 2.17b 2.26b 1.66a 2.19b 2.16b 0.039 <0.001
10–20 1.71a 2.23b 2.35b 1.70a 2.27b 2.26b 0.039 <0.001
30 0–5 1.74a 2.25b 2.11b 1.76a 2.22b 2.29b 0.036 <0.001
5–10 1.68a 2.19b 2.14b 1.67a 2.25b 2.30b 0.036 <0.001
10–20 1.70a 2.23b 2.23b 1.66a 2.13b 2.27b 0.036 <0.001
Nitrogen
0 0.214 0.220 0.210 0.0064 0.6176
10 0–5 0.217ab 0.227b 0.206a 0.0020 <0.001
5–10 0.181a 0.203b 0.176a 0.0020 <0.001
10–20 0.172a 0.194b 0.170a 0.0020 <0.001
20 0–5 0.162a 0.179a 0.204b 0.172a 0.185ab 0.174a 0.0029 <0.001
5–10 0.203ab 0.226b 0.203ab 0.197a 0.211ab 0.200a 0.0029 <0.001
10–20 0.196 0.219 0.208 0.198 0.218 0.207 0.0029 <0.001
30 0–5 0.204ab 0.216b 0.194a 0.211ab 0.219b 0.203ab 0.0021 <0.001
5–10 0.190a 0.218b 0.195a 0.187a 0.216b 0.194a 0.0021 <0.001
10–20 0.191a 0.203ab 0.196ab 0.188a 0.210b 0.196ab 0.0021 <0.001
C:N ratio
0 8.18a 9.93b 11.84c 0.052 <0.001
10 0–5 8.34a 9.90ab 11.75b 0.338 <0.001
5–10 9.92a 11.31ab 13.91b 0.338 <0.001
10–20 10.52a 11.81b 14.08c 0.338 <0.001
20 0–5 10.34a 11.92ab 11.25a 10.40a 11.72ab 13.13b 0.233 <0.001
5–10 8.48ab 9.66abc 11.15c 8.43a 10.36bc 10.82c 0.233 <0.001
10–20 8.71a 10.19b 11.30c 8.58a 10.43bc 10.90bc 0.233 <0.001
30 0–5 8.53a 10.43b 10.91b 8.35a 10.12b 11.24b 0.161 <0.001
5–10 8.84a 10.06ab 10.96bc 8.93a 10.43b 11.86c 0.161 <0.001
10–20 8.90a 10.04bc 11.37bc 8.83a 10.11ab 11.61c 0.161 <0.001
abcMeans were separated using the Tukey–Kramer adjustment for multiple comparisons. Means, in a row, without a common superscript aresignificantly different (p<0.05)
1900, Page 8 of 15 Water Air Soil Pollut (2014) 225:1900

the duration of the experiment. Drying and re-wetting ofsoil during the construction of the columns may havecaused a burst in microbial activity and a sharp increasein C and N mineralisation (Van Gestel et al. 1991;Bengtsson et al. 2003; Borken and Matzner 2009),resulting in surplus available NH4 and high levels ofnitrification. The soil used in this experiment also had alow C:N ratio of 8.2. Soil with C:N ratios below 20 can
be characterised as having a surplus of available NH4 fornitrification (Bengtsson et al. 2003).
Biochar amendment of the soil reduced the amountof NO3 leached from the columns by 24 and 26 %,respectively, for PM600 and W600, compared with theControl. The reduction in NO3 leached per week fromthe biochar-amended soils was only significant(p<0.05) in the first 12 weeks of the study. The
0
50
100
150
200
250
300
Control PM600 W600 Control + PM PM600 + PM W600 + PM
Treatment
mg
/co
lum
n
Fig. 4 Total amount of nitrogenleached over the 30-weekexperiment. Control=soil only.PM600=soil+pig manurebiochar. W600=soil+woodbiochar. Treatments amendedwith pigmanure betweenweek 10and week 11 are shownwith (+PM)
mg/column
Week
0
2
4
6
8
10
12
14
16
18
0 5 10 15 20 25 30
(a)
0.00
0.02
0.04
0.06
0.08
0.10
0 5 10 15 20 25 30
(b)
Control PM600 W600
Control + PM PM600 + PM W600 + PM
Fig. 5 Weekly total of NO3 (a)and NO2 (b) leached from soilcolumns. Control=soil only.PM600=soil+pig manurebiochar. W600=soil+woodbiochar. Treatments amendedwith the pig manure betweenweek 10 and 11 are shown with(+PM)
Water Air Soil Pollut (2014) 225:1900 Page 9 of 15, 1900

application of pig manure resulted in a peak in theleaching of NO3 (Fig. 5a), which reached maximumvalues for all treatments on weeks 17–18. For 4 weeksafter pig manure application, PM600+PM and W600+PM leached significantly less NO3 than the Control+PM. The amount of NO2 leaching was small whencompared with NO3. The concentration of NO2 in theleachate was <0.1 mg L−1 from week 2 to 9. Thiscorresponds with the peak in NO3 leaching (Fig. 5a).This low amount of NO2 leached from all treatment mayalso be due to the drying and re-wetting effect describedearlier. The burst of microbial activity caused by re-wetting may have ensured that almost complete nitrifi-cation to NO3 occurred for the first 9 weeks. The quan-tity of the NO2 leached increased significantly fromweek 9 to week 18 across all treatments, irrespectiveof whether soil was amended with biochar or pig ma-nure. This temporary build-up of NO2 in the soil may bedue to a time lag between NO3 reduction and NO2
reduction during the denitrification process, due to thepreference of denitrifiers to NO3, even when both NO2
and NO3 are present (Rivett et al. 2008).The amount of NH4 leached was low compared with
NO3. This indicates high nitrification across all treat-ments and the high CEC of the soil. Throughout theleaching experiment, the quantity of NH4 leached fromeach column on most sampling weeks remained be-tween 0.005 and 0.015 mg. There was no significantdifference between the amount of NH4 leached from thecolumns which received manure and those which didnot. There was also no difference between amount ofNH4 leached from the biochar-amended columns andthe Control (p>0.05).
Many different reasons have been given for reduc-tions in N leaching due to biochar addition to soil,including adsorption of NH4 or NO3 onto biochar, andenhanced immobilisation and denitrification of N(Clough et al. 2013). Many studies have also shownthe ability of biochar to adsorb NH4 (Dempster et al.2012; Yao et al. 2012). Laird et al. (2010a) foundsignificantly reduced NO3 leaching from pig manure-amended soil+biochar treatments compared withmanure-amended soil-only treatments. They attributedthis reduction in NO3 leaching to the adsorption of NH4
and soluble organic compounds within the soil, thusinhibiting mineralisation of organic N and/or nitrifica-tion of NH4. However, Laird et al. also found that thereductions in NO3 leaching were not immediate; onlyafter 23 weeks of biochar weathering was there any
reduction (Laird et al., 2010a). The rationale given forthe ability of biochar to enhance NH4 adsorption in soilis due to its higher CEC (Clough et al. 2013). However,the CEC of the biochar-amended soils in the currentstudy was found to be similar to that of the Control(Table 2), and therefore, a reduction in NO3 leachingwas unlikely, initially at least, to be caused by NH4
adsorption. The CEC of fresh biochar has previouslybeen shown to be low (Busscher et al. 2010; Cloughet al. 2010), with only weathered biochar being shownto have a high CEC due to oxidation and adsorption ofother OM in the soil over time (Liang et al. 2006). TheCEC of the biochar-amended treatments in the currentstudy may have increased over time. However, biocharoxidation, which results in CEC increases, is tempera-ture dependant (Cheng et al. 2006), and incubation at 10oC is unlikely to have caused a dramatic increase inbiochar CEC.
The reduction in NO3 leaching in this study was mostlikely caused by the impact of biochar on the rates ofnitrification and denitrification within the soil due to (a)nitrification inhibitors present on unweathered biochar and(b) denitrification loss of NO3 due to being stimulated byhigher WFPS and organic C contents in the biochar-amended treatments. In an incubation study using freshlymade biochar, Clough et al. (2010) measured higher soilNH4 concentrations in biochar-amended soil after the ap-plication of urine, compared with soil amended with urineonly. This increase was attributed to nitrification inhibitorswhich slowed the rate of NH4 depletion. Unweatheredbiochar has been shown to contain microbially toxic com-pounds (e.g. polyaromatic hydrocarbons), some of whichmay inhibit the Nitrosomonas bacteria responsible fornitrification (Kim et al. 2003; Clough and Condron2010). This inhibition of nitrification, due to toxic com-pounds is likely to be short-term: Clough et al. (2010)found that signs of nitrification inhibition had stopped55 days after soil incubation, as weathering of the biochardecreased its ability to inhibit nitrification.
In general, the presence of anaerobic conditions andorganic C as an electron donor facilitates denitrification(Rivett et al. 2008). In a companion study using the samesoil columns, Troy et al. (2013b) found that nitrous oxide(N2O) emissions over a 28-period following manure ad-dition were 79 % and 68 % higher from PM600+PM andW600+PM, respectively, when compared with Control+PM. The increased WFPS in the biochar-amended col-umns may have caused the development of anaerobiczones within the soil, reducing nitrification and increasing
1900, Page 10 of 15 Water Air Soil Pollut (2014) 225:1900

denitrification. The WFPS measured at the 10–20 cmdepth on weeks 20 and 30 was 69–72 % for the Control.The WFPS was 78 % and 77–79 %, respectively, forPM600 and W600. Increasing the WFPS beyond 60 %causes anaerobic conditions, resulting in reduced aerobicmicrobial activity and nitrification, and increased denitri-fication (Dobbie and Smith 2001; Porporato et al. 2003;Bateman and Baggs 2005; Yanai et al. 2007; Troy et al.2013b). In an incubation study, using arable soil fertilisedwith ammonium nitrate, Dobbie and Smith (2001) found a30-fold increase in N2O emissions by increasing theWFPS from 60% to 80%, due to denitrification attributedto the development of anaerobic zones within the soil. Inaddition to a higher WFPS, the WSOC content of thebiochar-amended treatments was higher than that of theControl (Table 2), indicating higher organic C availabilityfor denitrification. In a study measuring N2O lossesthrough denitrification from intact soil cores fertilised withNO3, Jahangir et al. (2012) found N2O emissions weresignificantly increased with the addition of dissolved or-ganic C to the soil. They suggested that adding C sourcesto the subsoil could increase NO3 depletion via denitrifi-cation (Jahangir et al. 2012). Despite the increasedWSOCof the biochar amended soils in the current study, leachingof TOCwas lower in theW600 treatment than the Control,an indication that the organic C may have been used as anelectron donor for denitrification, or adsorbed to thebiochar.
3.4 Phosphorus Leaching and Soil Content
The amount of DRP, DUP, and PP leached from the soilcolumns over the 30-week study period is shown inFig. 6. The trend for each treatment is similar with most
of the TP leached from the columns being the dissolvedfraction; for most of the weeks, the amount of PPleached from the columns was less than 0.004 mg percolumn. The concentration of P leached from the col-umns was low, indicating that the soil was P deficient.The maximum adsorption capacity of the soil was highat 0.194 g P kg−1, whereas the maximum adsorptioncapacity of the wood biochar was 0.134 g P kg−1.Therefore, the addition of the wood biochar to the soilwas unlikely to impact the P absorbency.
The pig manure biochar had no capacity to adsorb P,and it had a higher WEP than the wood biochar(Table 1). Over the 30-week study period, there wassignificantly more TP (p<0.001) and TDP (p<0.001)leached from PM600 than the Control or W600. Theincrease in P leaching from PM600 was primarily due toincreased DRP leaching (p<0.001). This reflects thehigher WEP in the PM600 treatments when comparedwith the Control and W600 treatments on all samplingweeks and depths (p<0.001; Table 4). The PM600treatments also had significantly higher Morgan’s Pvalues when compared with the Control and W600treatments on all sampling weeks and depths (p<0.05;Table 5). The addition of PM600 caused the soil tochange from a P Index 2 soil (low in STP) to a P index4 (high STP) soil by week 10. The limit for the amountof pig manure which can be applied to a field is depen-dent the soil P index, with the application limits loweron soils with higher P indices. This indicates the unsuit-ability of this pig manure-derived biochar as an amend-ment of soil in receipt of animal manure. By increasingthe P Index of the soil, the addition of the pig manure-derived biochar has reduced the amount of manurewhich can be applied to the soil, thereby further
0.0
0.1
0.2
0.3
0.4
0.5
0.6
Control PM600 W600 Control + PM PM600 + PM W600 + PM
Treatment
mg
/co
lum
n
PP
DUP
DRP
Fig. 6 Cumulative amounts ofdissolved reactive phosphorus(DRP), dissolved unreactivephosphorus (DUP), andparticulate phosphorus (PP)leached over the 30-weekexperiment. Control=soil only.PM600=soil+pig manurebiochar. W600=soil+woodbiochar. Treatments amendedwith the pig manure betweenweek 10 and 11 are shown with(+PM)
Water Air Soil Pollut (2014) 225:1900 Page 11 of 15, 1900

increasing the amount of land required and the costs ofpig manure application. The amount of DRP leachedfrom PM600 was between 0.004 mg and 0.01 mg percolumn from week 5 to 30. In contrast, the amount ofDRP leached from both the Control andW600 peaked atbetween 0.002 and 0.004 mg per column per weekbetween weeks 4 and 14. From week 14 until the endof the experiment, less than 0.002 mg was leached fromthe Control and W600 on most sampling weeks.
Laird et al. (2010a) found a large reduction in TDP inthe leachate from hardwood biochar-amended columnsafter pig manure addition, compared with control col-umns after manure addition. They attributed this effectto adsorption of ortho-phosphate and organic P com-pound by the biochar. Laird et al. (2010b) found in-creased available P in the soil from the biochar-amendedtreatments. However, in the current study, there was nosignificant difference between the total quantities of P
Table 5 Morgan’s phosphorus (mg L−1) contents for the soil (Control), the soil and pig manure biochar mix (PM600), and the soil and woodbiochar mix (W600) at 3 sampling depths (cm below surface) over 4 sampling events
Week Depth Control PM600 W600 Pig manure added week 10 s.e. p
Control PM600 W600
0 4.84a 7.53b 5.04a 0.143 <0.01
10 0–5 5.66a 10.14b 5.06a 0.183 <0.0001
5–10 5.68a 10.72b 5.28a 0.183 <0.0001
10–20 5.73a 11.03b 5.44a 0.183 <0.0001
20 0–5 3.88a 29.18b 4.54a 9.03a 36.20b 8.89a 1.445 <0.0001
5–10 4.28a 32.20b 5.19a 4.36a 35.00b 5.65a 1.445 <0.0001
10–20 4.67a 32.50b 5.37a 4.24a 36.73b 4.80a 1.445 <0.0001
30 0–5 5.05a 11.63b 5.47a 7.06a 16.05c 8.61ab 0.040 <0.0001
5–10 5.52a 12.07b 6.08a 5.33a 12.98b 5.89a 0.040 <0.0001
10–20 5.73a 12.65b 6.38a 5.40a 13.33b 6.16a 0.040 <0.0001
abcMeans were separated using the Tukey–Kramer adjustment for multiple comparisons. Means, in a row, without a common superscript aresignificantly different (p<0.05)
Table 4 Water extractable phosphorus (WEP,mg kg−1) contents for the soil (Control), the soil and pigmanure biochar mix (PM600), and thesoil and wood biochar mix (W600) at 3 sampling depths (cm below surface) over 4 sampling events
Week Depth Control PM600 W600 Pig manure added week 10 s.e. p
Control PM600 W600
0 0.364a 0.524b 0.391a 0.0167 <0.05
10 0–5 0.500a 1.774b 0.533a 0.1861 <0.01
10 5–10 0.506a 1.532b 0.515a 0.1861 <0.01
10 10–20 0.576a 1.131b 0.525a 0.1861 <0.01
20 0–5 0.403a 1.670b 0.284a 0.965ab 2.923c 0.682a 0.1371 <0.001
20 5–10 0.398a 1.682b 0.263a 0.387a 1.974b 0.425a 0.1371 <0.001
20 10–20 0.413a 1.861b 0.312a 0.440a 1.942b 0.249a 0.1371 <0.001
30 0–5 0.518a 1.106b 0.482a 0.969b 1.921c 0.881ab 0.4708 <0.001
30 5–10 0.473a 1.213b 0.479a 0.525a 1.333b 0.402a 0.4708 <0.001
30 10–20 0.520a 1.276b 0.509a 0.458a 1.299b 0.475a 0.4708 <0.001
abcMeans were separated using the Tukey–Kramer adjustment for multiple comparisons. Means, in a row, without a common superscript aresignificantly different (p<0.05)
1900, Page 12 of 15 Water Air Soil Pollut (2014) 225:1900

leached from W600 compared with the Control, irre-spective of whether they were amended with pig manureor not. There was also no difference between the soilWEP (Table 4) or Morgan’s P (Table 5) for the Controland W600 treatments. The soil in this study was low inWSP and the adsorption capacity of the soil was shownto be higher than that of the wood biochar. Therefore, noincrease in P adsorption was expected. Approximately30 mg of P was added with the pig manure per columnand the vast majority of this P remained in the soil; therewas no increase in DRP and DUP leaching when ma-nure was added to the treatments (p>0.05). The additionof manure did increase WEP values for PM600+PM onweek 20, and Control+PM and PM600+PM on week30, compared with the treatments which did not receivemanure (Table.4). The only effect pig manure additionhad on Morgan’s P was on PM600+PM on week 30(Table 5). However, the addition of pig manure didresult in the soil in the 0-5 cm top section of theControl+PM and W600+PM being classed as P Index3, compared with P Index 2 in the Control and W600treatments.
4 Conclusions
The addition of both pig manure biochar and woodbiochar to the low P Index tillage soil had significanteffects on soil properties and nutrient leaching. Biocharaddition increased the soil WFPS, OM and C contents,while reducing NO3 leaching, compared with unamend-ed soil. Amendment with pig manure biochar increasedMorgan’s P and WEP contents in the soil due to thehigher concentration of readily Extractable P (WEP) inthe manure-derived biochar. Leaching of P and C in-creased with the addition of pig manure biochar due tothe higher concentrations of water soluble P and C in thepig manure biochar. Leaching of organic C was reducedin the wood biochar-amended treatments compared withthe unamended soil.
The addition of wood-derived biochar to tillage soilwhich will receive pig manure may be justifiable, as itreduces nutrient leaching from the soil, while also se-questering C. This may allow for higher applicationrates of pig manure, reducing transports distances andcosts of pig manure application. However, the applica-tion of pig manure biochar was not deemed appropriate,as the easily Extractable P in this biochar increased
Morgan’s P, increasing the soil P Index, and thus reduc-ing the amount of pig manure which can be applied.
Acknowledgments This research was funded by the Irish De-partment of Agriculture, Food and Fisheries’ Research StimulusFund Programme under the National Development Plan 2007-2013. Shane Troy’s PhD was funded by the Teagasc Walsh Fel-lowship Scheme.
References
Bateman, E. J., & Baggs, E. M. (2005). Contributions of nitrifica-tion and denitrification to N2O emissions from soils at differ-ent water-filled pore space. Biology and Fertility of Soils, 41,379–388.
Bengtsson, G., Bengtson, P., & Mansson, K. F. (2003). Grossnitrogen mineralization, immobilization, and nitrificationrates as a function of soil C/N ratio and microbial activity.Soil Biology and Biochemistry, 35, 143–154.
Borken, W., & Matzner, E. (2009). Reappraisal of drying andwetting effects on C and N mineralization and fluxes in soils.Global Change Biology, 15, 808–824.
BSI. (1990). BS 1377-3:1990. Method of tests for soils for civilengineering purposes – part 3: chemical and electro-chemical tests. London: British Standards Institution.
Busscher, W. J., Novak, J. M., Evans, D. E., Watts, D. W.,Niandou, M. A. S., & Ahmedna, M. (2010). Influence ofpecan biochar on physical properties of a Norfolk loamysand. Soil Science, 175, 10–14.
Chan, K. Y., Van Zwieten, L.,Meszaros, I., Downie, A., & Joseph, S.(2007). Agronomic values of greenwaste biochar as a soilamendment. Australian Journal of Soil Research, 45, 629–634.
Chan, K. Y., Van Zwieten, L., Meszaros, I., Downie, A., & Joseph,S. (2008). Using poultry litter biochars as soil amendments.Australian Journal of Soil Research, 46, 437–444.
Cheng, C. H., Lehmann, J., & Thies, J. E. (2006). Oxidation ofblack carbon by biotic and abiotic processes. OrganicGeochemistry, 37, 1477–1488.
Cheng, C. H., Lehmann, J., & Engelhard, M. H. (2008). Naturaloxidation of black carbon in soils: changes in molecular formand surface charge along a climosequence. Geochiica etCosmochimica Acta, 72, 1598–1610.
Clough, T. J., & Condron, L. M. (2010). Biochar and the nitrogencycle: Introduction. Journal of Environmental Quality, 39,1218–1223.
Clough, T. J., Bertram, J. L., Ray, J. L., Condron, L. M.,O’Callaghan, M., Sherlock, R. R., et al. (2010).Unweathered biochar impact on nitrous oxide emissionsfrom a bovine-urine-amended pasture soil. Soil ScienceSociety of America Journal, 74, 852–860.
Clough, T. J., Condron, L.M., Kammann, C., &Müller, C. (2013).A review of biochar and soil nitrogen dynamics. Agronomy,3, 275–293.
Collison, M., Collison, L., Sakrabani, R., Tofield, B., Wallage, Z.(2009). Biochar and carbon sequestration: a regional per-spective. Low Carbon Innovation Centre Report for EEDA.Norwich, UK: University of East Anglia.
Water Air Soil Pollut (2014) 225:1900 Page 13 of 15, 1900

DeLuca, T. H., MacKenzie, M. D., & Gundale, M. J. (2009).Biochar affects soil nutrient transformations. In J. Lehmann& S. Joseph (Eds.), Biochar for Environmental Management:Science and Technology (pp. 251–270). London: Earthscan.
Dempster, D. N., Jones, D. L., & Murphy, D. M. (2012). Clay andbiochar amendments decreased inorganic but not dissolvedorganic nitrogen leaching in soil. Soil Research, 50, 216–221.
Dobbie, K. E., & Smith, K. A. (2001). The effects of temperature,water-filled pore space and land use on N2O emissions froman imperfectly drained gleysol. European Journal of SoilScience, 52, 667–673.
Downie, A., Crosky, A., & Munroe, P. (2009). Physical propertiesof biochar. In J. Lehmann & S. Joseph (Eds.), Biochar forEnvironmental Management: Science and Technology (pp.13–32). London: Earthscan.
EC (2000). Directive 2000/60/EC of the European Parliament andof the Council of 23 October 2000 establishing a frameworkfor the Community action in the field of water policy.
EEC (1991). Council Directive 91/676/EEC of 12 December 1991concerning the protection of waters against pollution bynitrates from agricultural sources.
Fenton, O., Healy, M. G., Rodgers, M., & O’ Huallachain, D.(2009). Site-specific P absorbency of ochre from acid mine-drainage near an abandoned Cu-S mine in the Avoca-Avonmore catchment, Ireland. Clay Minerals, 44, 113–123.
Gaskin, J. W., Steiner, C., Harris, K., Das, K. C., & Bibens, B.(2008). Effect of low-temperature pyrolysis conditions onbiochar for agricultural use. Transactions of the AmericanSociety of Agricultural and Biological Engineers, 51, 2061–2069.
Glaser, B., Lehmann, J., & Zech, W. (2002). Ameliorating phys-ical and chemical properties of highly weathered soils in thetropics with charcoal – a review. Biology and Fertility ofSoils, 35, 219–230.
Hackett, R. (2007). Exploiting pig manure as a nutrient source forcereals in Ireland. Oak Park, Carlow, Ireland: NationalTillage Conference, Teagasc, Crop Reserach Centre.
Haney, R. L., & Haney, E. B. (2010). Simple and rapid laboratorymethod for rewetting dry soil for incubations. Comms. SoilScience and Plant Analysis, 41, 1493–1501.
Ishii, T., & Kadoya, K. (1994). Effects of charcoal as a soilconditioner on citrus growth and vesicular arbuscular mycor-rhizal development. Journal of the Japanese Society ofHorticultural Science, 63, 529–535.
Jahangir, M. M. R., Khalil, M. I., Johnston, P., Cardenas, L. M.,Hatch, D. J., Butler, M., et al. (2012). Denitrification potentialin subsoils: A mechanism to reduce nitrate leaching togroundwater. Agriculture, Ecosystems & Environment, 147,13–23.
Kim, E. J., Oh, J. E., & Chang, Y. S. (2003). Effects of forest fireon the level and distribution of PCDD/Fs and PAHs in soil.Science of the Total Environment, 311, 177–189.
Laird, D. A., Fleming, P., Wang, B., Horton, R., & Karlen, D. L.(2010a). Biochar impact on nutrient leaching from aMidwestern agricultural soil. Geoderma, 158, 436–442.
Laird, D. A., Fleming, P., Davis, D. D., Horton, R., Wang, B., &Karlen, D. L. (2010b). Impact of biochar amendments on thequality of a typical Midwestern agricultural soil. Geoderma,158, 443–449.
Lehmann, J., & Rondon, M. (2006). Biochar soil management onhighly weathered soils in the humid tropics. In N. Uphoff
(Ed.), Biological approaches to sustainable soil systems (pp.517–530). Florida: CRC Press.
Lehmann, J., da Silva, J. P., Jr., Steiner, C., Nehls, T., Zech, W., &Glaser, B. (2003). Nutrient availability and leaching in anarchaeological Anthrosol and a Ferrasol of the CentralAmazon basin: fertilizer, manure and charcoal amendments.Plant and Soil, 249, 343–357.
Liang, B., Lehmann, J., Solomon, D., Kinyangi, J., Grossman, J.,O’Neill, B., et al. (2006). Black carbon increases cationexchange capacity in soils. Soil Science Society of AmericaJournal, 70, 1719–1730.
McDowell, R. W., & Sharpley, A. N. (2001). Soil phosphorusfractions in solution: influence of fertiliser and manure, filtra-tion and method of determination.Chemosphere, 45, 737–748.
Morgan, M.F. (1941). Chemical soil diagnosis by the UniversalSoil Testing System. Connecticut Agricultural ExperimentalStation Bulletin 450, Connecticut.
Novak, J. M., Busscher, W. J., Laird, D. A., Ahmedna, M., Watts,D. W., & Niandou, M. A. S. (2009). Impact of biocharamendment on fertility of a south-eastern coastal plain soil.Soil Science, 174, 105–112.
O’Flynn, C. J., Healy, M. G., Lanigan, G. J., Troy, S. M., Somers,C., & Fenton, O. (2013). Impact of chemically amended pigslurry on greenhouse gas emissions, soil properties and leach-ate. Journal of Environmental Management, 128, 690–698.
Porporato, A., Odorico, P. D., Laio, F., & Rodriguez-Iturbe, I.(2003). Hydrologic controls on soil carbon and nitrogencycles. I. Modelling scheme. Water Resources, 26, 45–58.
Regan, J. T., Rodgers, M., Kirwan, L., Fenton, O., & Healy, M. G.(2010). Determining phosphorus and sediment release ratesfrom five Irish tillage soils. Journal of EnvironmentalQuality, 39, 185–192.
Rivett, M. O., Buss, S. R., Morgan, P., Smith, J. W. N., &Bemment, C. D. (2008). Nitrate attenuation in groundwater:A review of biogeochemical controlling processes. WaterResources, 42, 4215–4232.
Ro, K. S., Cantrell, K. B., & Hunt, P. G. (2010). High-temperaturepyrolysis of blended animal manures for producing renew-able energy and value-added biochar. Industrial &Engineering Chemistry Research, 49, 10125–10131.
SAS Institute. (2004). 9.1.3 Service Pack 4 Copyright (c) 2002-2003. North Carolina: SAS Institute Inc.
Schulte, R. P. O., Melland, A. R., Fenton, O., Herlihy, M.,Richards, K. G., & Jordan, P. (2010). Modelling soil phos-phorus decline: expectations of Water Framework Directivepolicies. Environmental Science Policy, 13, 472–484.
Singh, B. P., Hatton, B. J., Singh, B., Cowiw, A. L., &Kathuria, A.(2010). Influence of biochars on nitrous oxide emission andnitrogen leaching from two contrasting soils. Journal ofEnvironmental Quality, 39, 1224–1235.
Steiner, C., Glaser, B., Teixeira, W. G., Lehmann, J., Blum, W. E.H., & Zech, W. (2008a). Nitrogen retention and plant uptakeon a highly weathered central Amazonian Ferralsol amendedwith compost and charcoal. Journal of Plant Nutrition andSoil Science, 171, 893–899.
Steiner, C., de Arruda,M. R., Teixeira,W. G., & Zech,W. (2008b).Soil respiration curves as soil fertility indicators in perennialcentral Amazonian plantations treated with charcoal, andmineral or organic fertilisers. Tropical Science, 47, 218–30.
Streubel, J. D., Collins, H. P., Garcia-Perez, M., Tarara, J.,Granatstein, D., & Kruger, C. E. (2011). Influence of
1900, Page 14 of 15 Water Air Soil Pollut (2014) 225:1900

contrasting biochar types on five soils at increasing rates ofapplication. Soil Biology and Biochemistry, 75, 1402–1413.
Troy, S. M., Nolan, T., Leahy, J. J., Lawlor, P. G., Healy, M. G., &Kwapinski, W. (2013a). Effect of sawdust addition andcomposting of feedstock on renewable energy and biocharproduction from pyrolysis of anaerobically digested pig ma-nure. Biomass and Bioenergy, 49, 1–9.
Troy, S. M., Lawlor, P. G., O’ Flynn, C. J., & Healy, M. G.(2013b). Impact of biochar addition to soil on greenhousegas emissions following pig manure application. Soil Biologyand Biochemistry, 60, 173–181.
Van Gestel, M., Ladd, J. N., & Amato, M. (1991). Carbon andnitrogen mineralization from two soils of contrasting textureand micro-aggregate stability: influence of sequential fumi-gation, drying and storage. Soil Biology and Biochemistry,23, 313–322.
Verhejien, F., Jeddery, S., Bastos, A., van der Velde, C.M., Diafas,I. (2010). Biochar Application to Soils. A Critical ScientificReview of Effects on Soil Properties, Processes andFunctions. Luxembourg: European Commission JointResearch Centre Scientific and Technical Reports, Institutefor Environment and Sustainability.
Walsh, S. (2012). A summary of climate averages for Ireland1981-2010. Dublin: Met Eireann.
Yanai, Y., Toyota, K., & Okazaki, M. (2007). Effects of charcoaladdition on N2O emissions from soil resulting from rewettingair-dried soil in short-term laboratory experiments. Journal ofSoil Science and Plant Nutrition, 53, 181–188.
Yao, Y., Gao, B., Zhang, M., Inyang, M., & Zimmerman, A. R.(2012). Effect of biochar amendment on sorption andleaching of nitrate, ammonium, and phosphate in a sandysoil. Chemosphere, 89, 1467–1471.
Water Air Soil Pollut (2014) 225:1900 Page 15 of 15, 1900