the heliospheric magnetic flux, solar wind proton flux, and cosmic ray intensity during the coming...
TRANSCRIPT
Space Weather
RESEARCH ARTICLE10.1002/2014SW001067
Key Points:• The coming solar minimum is likely to
resemble the Dalton Minimum• This will result in the lowest HMF flux
during the space age• Lowest solar wind flux and highest
cosmic ray intensity for the space age
Correspondence to:C. W. Smith,[email protected]
Citation:Smith, C. W., K. G. McCracken, N.A. Schwadron, and M. L. Goelzer(2014), The heliospheric magneticflux, solar wind proton flux, and cos-mic ray intensity during the comingsolar minimum, Space Weather, 12,499–507, doi:10.1002/2014SW001067.
Received 14 MAR 2014
Accepted 7 JUL 2014
Accepted article online 12 JUL 2014
Published online 29 JUL 2014
The heliospheric magnetic flux, solar wind proton flux,and cosmic ray intensity during the comingsolar minimumCharles W. Smith1,2, K. G. McCracken3, Nathan A. Schwadron1,2, and Molly L. Goelzer2,4
1Physics Department, Space Science Center, University of New Hampshire, Durham, New Hampshire, USA, 2Institute forthe Study of Earth, Oceans and Space, University of New Hampshire, Durham, New Hampshire, USA, 3Institute of PhysicalScience and Technology, University of Maryland, College Park, Maryland, USA, 4Department of Chemical Engineering,University of New Hampshire, Durham, New Hampshire, USA
Abstract Recent papers have linked the heliospheric magnetic flux to the sunspot cycle with goodcorrelation observed between prediction and observation. Other papers have shown a strong correlationbetween magnetic flux and solar wind proton flux from coronal holes. We combine these efforts withan expectation that the sunspot activity of the approaching solar minimum will resemble the Dalton orGleissberg Minimum and predict that the magnetic flux and solar wind proton flux over the coming decadewill be lower than at any time during the space age. Using these predictions and established theory, wealso predict record high galactic cosmic ray intensities over the same years. The analysis shown here is aprediction of global space climate change within which space weather operates. It predicts a new parameterregime for the transient space weather behavior that can be expected during the coming decade.
1. Introduction
The past 10 years of solar and solar wind observations have shown a trend that is unique in the space age.After a relatively normal level of solar activity during the solar maximum of 1998 through 2004, approxi-mately, the Sun entered a protracted solar minimum phase with greatly reduced activity lasting longer thanrecent solar minima of the past 50 years. Smith and Balogh [2008] showed that the heliospheric magneticfield (HMF) reached record low values at both high and low latitudes. Connick et al. [2009, 2011] confirmedthat the injection of magnetic flux in the form of helical fields was nearly zero during this time and showedthat the HMF flux fell steadily during the years 2005 to 2010 until solar activity resumed. McComas et al.[2008, 2013] showed that the solar wind proton flux was also greatly reduced during the solar minimumyears. While both the solar wind speed and proton density experienced a significant reduction during therecent solar minimum, it was the reduction of the density that dominates the reduced proton flux results.At the same time neutron monitor counting rates hit record levels [Oh et al., 2013]. The resumption of solaractivity in the form of coronal mass ejections (CMEs) from 2010 to 2013 was relatively weak, as was thesunspot number, resulting in the weakest solar maximum of the space age. HMF intensities failed to reachthe levels of the previous solar maximum.
Barnard et al. [2011] have previously provided an “analogue” prediction for future solar activity and itsimpacts on space weather. Their approach was to use the paleo-cosmic radiation (10Be and 14C) data of thepast to estimate the probability of various levels of solar activity in the future. By way of contrast, this paperprovides a “real-time” prediction methodology. Throughout the space age, the observed data have beenused to develop several models of the interdependence of solar and heliospheric quantities. Our method-ology uses those models to predict three important features of space weather using data inputs up to thepresent date, together with projected sunspot numbers for the next 10 years. This methodology has theadvantage that it yields quantitative estimates of the space weather in the immediate future and that it canbe updated on a year-to-year basis.
We contend that the pattern seen in the past 10 years of sunspot and HMF intensity strongly resembles theDalton (Grand) and Gleissberg Minima [Clilverd et al., 2006; Watari, 2008; Turner, 2011; Kamide and Kusano,2013; Goelzer et al., 2013; McCracken and Beer, 2014]. We compare the recent protracted solar minimumand the relatively weak solar maximum that followed to past epochs of low solar activity levels and use the
SMITH ET AL. ©2014. American Geophysical Union. All Rights Reserved. 499
Space Weather 10.1002/2014SW001067
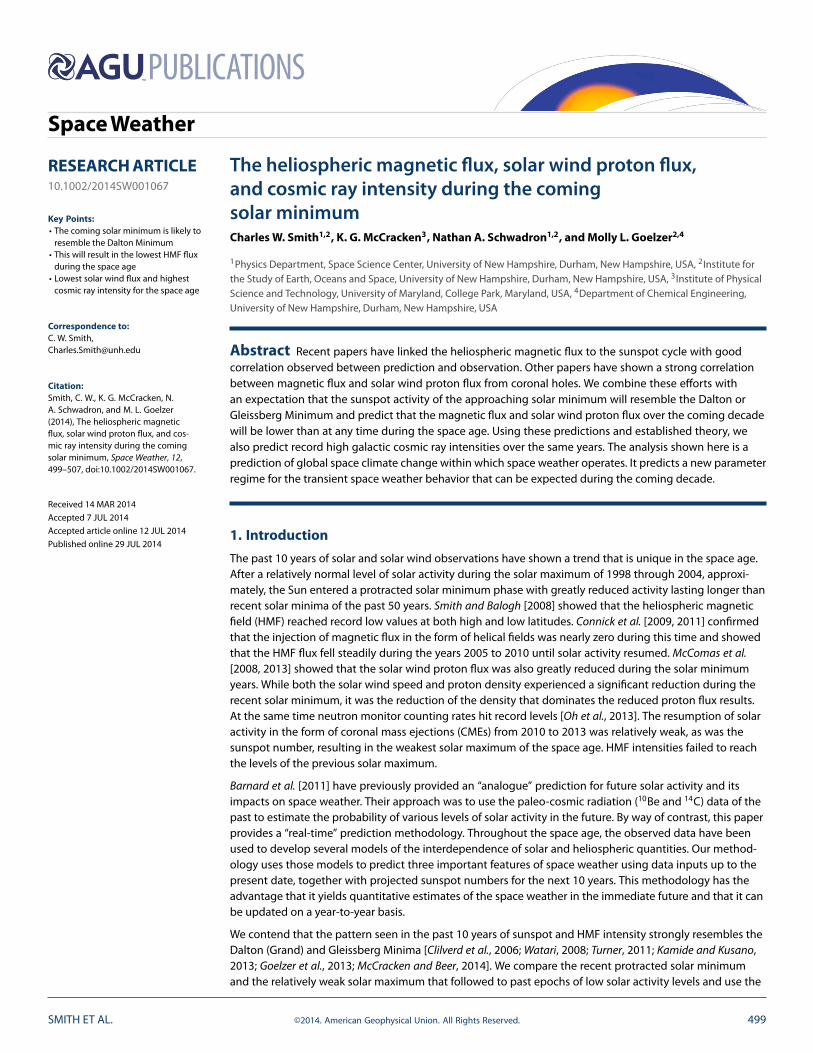
Figure 1. Monthly average sunspot numbers as compiled by the SolarInfluences Data Analysis Center (SIDC).
Dalton and Gleissberg Minima aslikely proxies for the solar activity thatis to come in the next decade. Withthis assertion and three publishedtheories we can predict the averageHMF flux and solar wind proton fluxfor the coming decade, and fromthose predictions we can predict thegalactic cosmic ray intensity. The firsttheory [Schwadron et al., 2010] linksheliospheric magnetic flux to sunspot
number. The Dalton and Gleissberg Minima sunspot numbers then give us the HMF flux. The second theory[Schwadron and McComas, 2008] then provides a prediction for the solar wind proton flux in terms of theHMF flux. From these we can use the third theory [Caballero-Lopez et al., 2004; McCracken, 2007] to derive aprediction for the galactic cosmic ray intensity over the same period. In the interest of brevity, we presentonly the results of our methodology as the theories and their tests are already published elsewhere.
2. The Dalton and Gleissberg Minima
We begin with a direct comparison of the sunspot numbers during the recent solar cycles and those ofthe Dalton and Gleissberg Minima. Figure 1 shows the monthly average sunspot numbers from 1749 toNovember 2013. There are several intervals when the sunspot numbers associated with solar maximum arelower than is otherwise typical. One such interval is the Dalton Grand Minimum that runs from 1790 to 1830.The solar maximum associated with the start of this interval is typical of other maxima, but the followingsolar maxima show a series of three maxima with reduced sunspot numbers. The critical point is that suchlow maxima tend not to occur in isolation but are generally seen as a series of about three such cycles withreduced activity levels. Another period of reduced activity is the Gleissberg Minimum (not usually called a“Grand” Minimum) that runs from 1890 to 1920. Again we see a series of maxima showing reduced activ-ity levels. These intervals form the basis for our prediction of the coming decade of solar activity and itsassociated HMF flux, solar wind proton flux, and galactic cosmic ray intensity.
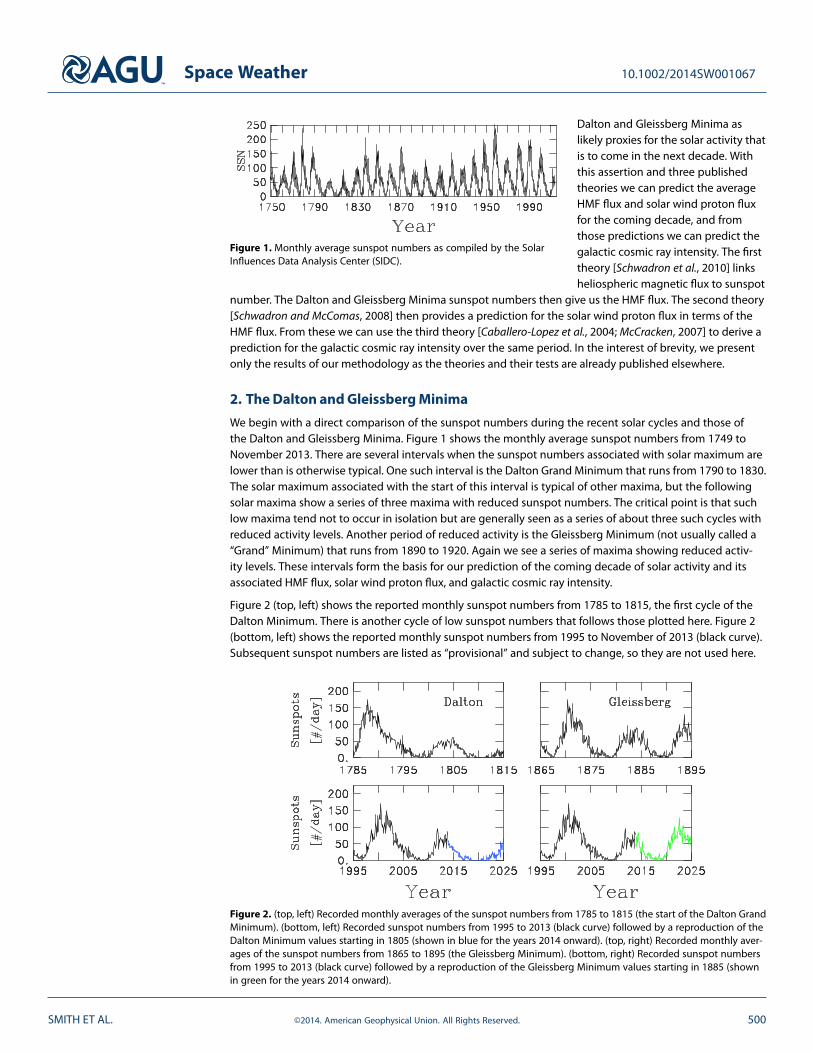
Figure 2 (top, left) shows the reported monthly sunspot numbers from 1785 to 1815, the first cycle of theDalton Minimum. There is another cycle of low sunspot numbers that follows those plotted here. Figure 2(bottom, left) shows the reported monthly sunspot numbers from 1995 to November of 2013 (black curve).Subsequent sunspot numbers are listed as “provisional” and subject to change, so they are not used here.
Figure 2. (top, left) Recorded monthly averages of the sunspot numbers from 1785 to 1815 (the start of the Dalton GrandMinimum). (bottom, left) Recorded sunspot numbers from 1995 to 2013 (black curve) followed by a reproduction of theDalton Minimum values starting in 1805 (shown in blue for the years 2014 onward). (top, right) Recorded monthly aver-ages of the sunspot numbers from 1865 to 1895 (the Gleissberg Minimum). (bottom, right) Recorded sunspot numbersfrom 1995 to 2013 (black curve) followed by a reproduction of the Gleissberg Minimum values starting in 1885 (shownin green for the years 2014 onward).
SMITH ET AL. ©2014. American Geophysical Union. All Rights Reserved. 500
Space Weather 10.1002/2014SW001067
Note the “typical” solar maximum from 1998 to 2003 that resembles the maximum from 1785 to 1790.Although slightly different in shape, the two reach comparable levels of intensity with the 1788 valuesslightly exceeding the 2001 values and both are similar to maxima throughout the space age (1965 onward).When we compare the unusually low sunspot numbers of the maxima for 1804 and 2013, we find that the1804 values are slightly lower than the 2013 values. Both are uncommonly low for maxima throughout thespace age.
Solar maxima peaking at sunspot numbers of 50 are uncommon but are recorded in the sunspot recordfrom 1749 onward. They fall into groupings of two or more and are not seen as isolated events [Kamideand Kusano, 2013; Goelzer et al., 2013]. It is therefore likely that we will again see another weak solar maxi-mum after the coming solar minimum. With this in mind, we use the sunspot numbers from December 1804onward as a prediction for what is coming from December 2013 onward (Figure 2, bottom, left, blue curve).Provisional sunspot numbers in 2014 show a second peak rising to ∼100. This is very much uncharacteris-tic of the last 2 years of sunspot numbers. If these numbers are validated and persist for about a year, it islikely that a better model for the coming solar minimum will be the minimum we experienced most recently.If they are validated but do not persist beyond a few months, they are unlikely to significantly change thepredictions shown here as it takes time to accumulate the additional flux that such high sunspot numberswould suggest. Only time will tell if this is true.
Figure 2 (top, right) shows the reported monthly sunspot numbers marking the start of the Gleissberg Mini-mum from 1865 to 1895. As with Figure 2 (top, left), this represents only the first half of the cycle of reducedsunspot numbers. The solar maximum of 1870 was marginally higher than the maximum of 2001, while themaximum of 1883 is also slightly higher than the maximum of 2013. The Gleissberg Minimum represents asomewhat less extreme reduction in sunspot number relative to the space age than does the Dalton Mini-mum. As with the Dalton Minimum, we can use the sunspot numbers from 1885 onward as a proxy for thecoming solar minimum (2014 onward) which we show in Figure 2 (bottom, right, green curve). The sunspotminima of the Gleissberg Minimum are shorter in duration than those of the Dalton Minimum, but bothachieve unusually low sunspot numbers when compared with the space age.
3. Heliospheric Magnetic Field
The first theory that we employ here is an extension of the idea that CMEs inject magnetic field lines intointerplanetary space and then magnetic reconnection in the low solar atmosphere releases those field lines[McComas et al., 1992; Solanki et al., 2000; Low, 2001; Owens and Crooker, 2006, 2007; Owens et al., 2008,2011a; Lockwood et al., 2009; Schwadron et al., 2010; Owens and Lockwood, 2012]. While attached to theSun these newly injected field lines are drawn out to match the spiral configuration predicted by Parker[1958, 1963]. Once released, presumably by reconnection low in the solar atmosphere, they are free to beejected from heliospheric space by the solar wind. We use the theory of Schwadron et al. [2010] to predictthe HMF flux based on sunspot number. Smith et al. [2013] applied this theory to the Omni2 data set [Kingand Papitashvili, 2005] with favorable results. Goelzer et al. [2013] employed the same parameter choicesin a comparison with HMF analyses derived from 10Be observations going back to 1749 and also obtainedfavorable results. We employ the exact same formulation of the theory here.
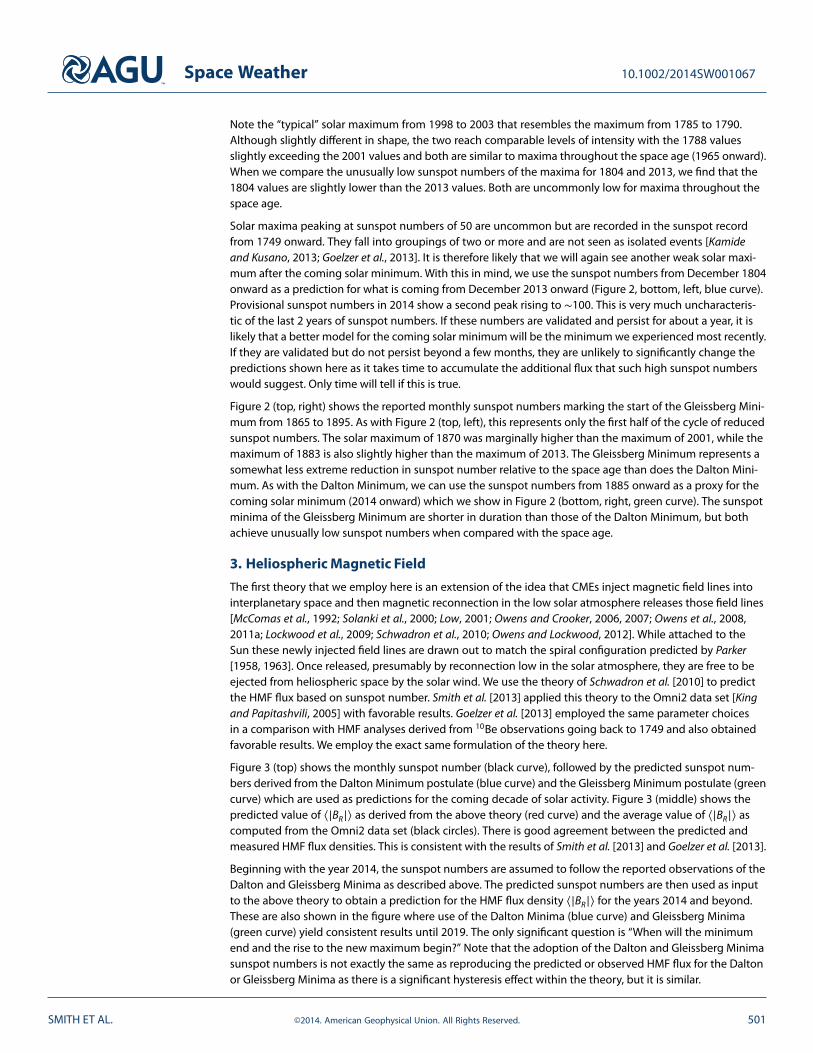
Figure 3 (top) shows the monthly sunspot number (black curve), followed by the predicted sunspot num-bers derived from the Dalton Minimum postulate (blue curve) and the Gleissberg Minimum postulate (greencurve) which are used as predictions for the coming decade of solar activity. Figure 3 (middle) shows thepredicted value of ⟨|BR|⟩ as derived from the above theory (red curve) and the average value of ⟨|BR|⟩ ascomputed from the Omni2 data set (black circles). There is good agreement between the predicted andmeasured HMF flux densities. This is consistent with the results of Smith et al. [2013] and Goelzer et al. [2013].
Beginning with the year 2014, the sunspot numbers are assumed to follow the reported observations of theDalton and Gleissberg Minima as described above. The predicted sunspot numbers are then used as inputto the above theory to obtain a prediction for the HMF flux density ⟨|BR|⟩ for the years 2014 and beyond.These are also shown in the figure where use of the Dalton Minima (blue curve) and Gleissberg Minima(green curve) yield consistent results until 2019. The only significant question is “When will the minimumend and the rise to the new maximum begin?” Note that the adoption of the Dalton and Gleissberg Minimasunspot numbers is not exactly the same as reproducing the predicted or observed HMF flux for the Daltonor Gleissberg Minima as there is a significant hysteresis effect within the theory, but it is similar.
SMITH ET AL. ©2014. American Geophysical Union. All Rights Reserved. 501
Space Weather 10.1002/2014SW001067
Figure 3. (top) Monthly averaged sunspot number leading toDecember 2013 (black curve) with extension using Dalton GrandMinimum (blue curve) and Gleissberg Minimum extension (greencurve). (middle) Predicted value of HMF flux density ⟨|BR|⟩ usingthe observed sunspot numbers (red curve) leading up to the startof 2014 with the predicted level derived from the Dalton Mini-mum extension and the Schwadron and McComas [2008] theory asapplied by Smith et al. [2013] and Goelzer et al. [2013] (blue curve)and Gleissberg Minimum extension (green curve), as well as themeasured value of ⟨|BR|⟩ obtained from Omni2 data set (black cir-cles). (bottom) Predicted value of FSW as obtained by the theoryof Schwadron and McComas [2008] and related papers using theobserved sunspot numbers (red curve) followed by the predictionusing the Dalton postulate (blue curve) and Gleissberg postulate(green curve).
Our calculations predict that if the comingsolar cycle follows the form of the DaltonMinimum the HMF flux density circa 2020will decrease to ∼60% of that during 2009.The cosmogenic radionuclide 10Be pro-vides a record of the cosmic ray intensityin the past, and McCracken [2007] used itto estimate the annual HMF intensity atEarth since 1420. Those estimates decreasedby a factor of 70% between the solar min-ima of 1798 and 1810 [see Goelzer et al.,2013, Figure 1], these being the analogousminima to 2009 and 2020. The annual aver-age of the HMF intensity near Earth was∼3.9 nT in 2009. Our predictions, based onsunspot number during the Dalton Mini-mum, indicate that ⟨|BR|⟩ will reach downto almost 0.7 nT. If in situ comparisons holdwith regard to the component of the HMFperpendicular to the Parker field, which isall that is predicted by the Schwadron etal. [2010] theory, the HMF near Earth willdecline to ∼2.5 nT in 2021 if the comingsolar minimum follows the Dalton Mini-mum. If the coming solar minimum followsthe Gleissberg Minimum, then ⟨|BR|⟩ falls to∼1 nT in 2019 and then begins to recoverearlier than in the Dalton Minimum postu-late. This suggests a minimum HMF intensityof ∼3 nT. Note that in either instance thenext solar minimum will be weak comparedwith any minimum of the space age.
4. Solar Wind Proton Flux
We now use this prediction for the HMF fluxto obtain a prediction for the solar wind pro-ton flux during the same years. Schwadronand McComas [2008] derive a prediction forthe solar wind proton flux based on a linear
scaling with the HMF flux and demonstrate that it holds for high-speed winds (> 750 km s−1) observed bythe Ulysses spacecraft. In an attempt to simplify the expressions used by Schwadron and McComas [2008]we make the following assertion:
FThSW = 1.15 × 10¹²⟨|BR|⟩. (1)
This proportionality constant will be justified below by the results, but it is approximately equivalent to theanalysis of Schwadron and McComas [2008].
Returning to Figure 3 (bottom), we take the predicted value of ⟨|BR|⟩ derived from the theory of Schwadronet al. [2010] and the recorded sunspot numbers and predict the solar wind proton flux (red curve) usingthe above scaling. We also reproduce the observed solar wind proton flux from the Omni2 data set (blackcircles). As seen in the figure, the agreement is poor before 2005 but good from 2005 onward. The predictionalso works well during the solar maximum of 2013 when solar activity was relatively low.
There are good reasons why this simple scaling may not work well in times of high solar activity, but we areunprepared at the present time to provide a defensible explanation. Efforts to understand this and modify
SMITH ET AL. ©2014. American Geophysical Union. All Rights Reserved. 502
Space Weather 10.1002/2014SW001067
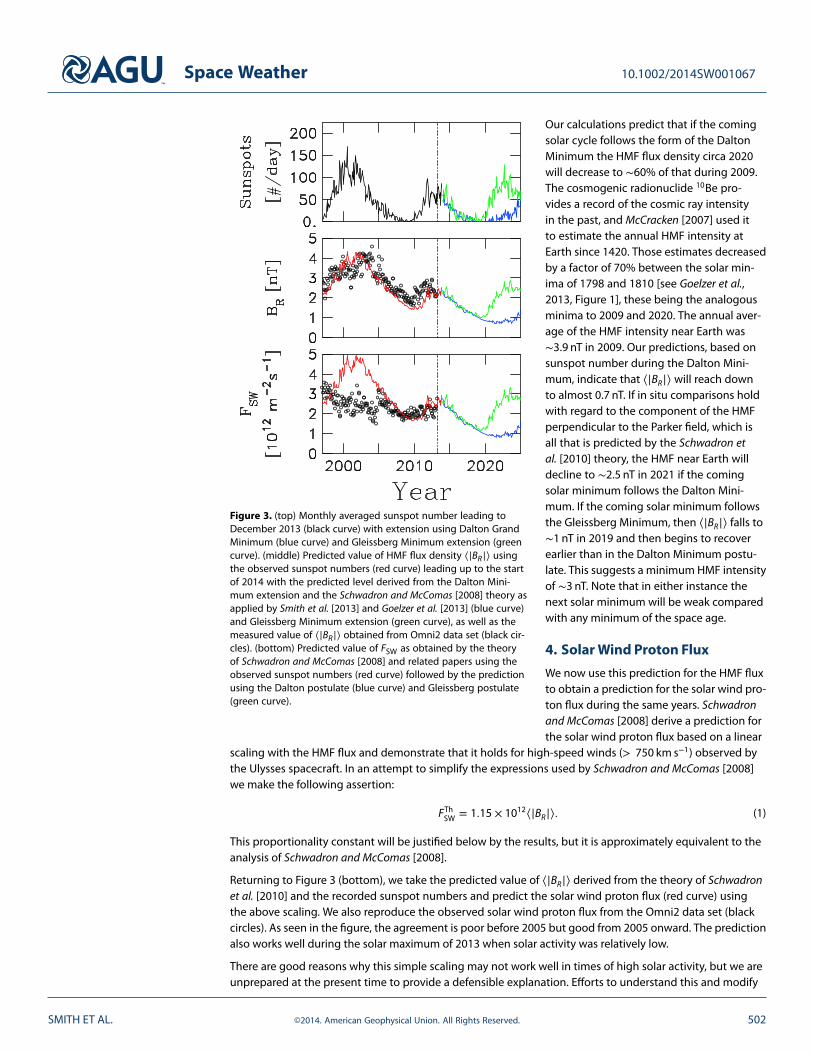
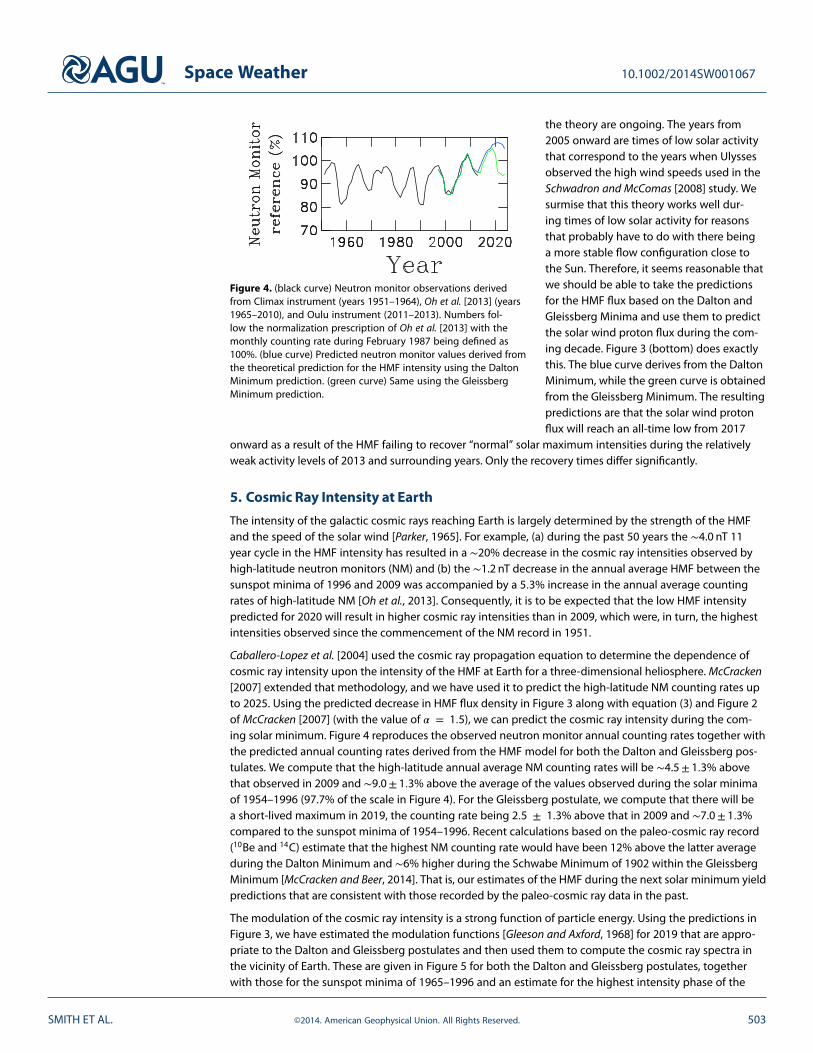
Figure 4. (black curve) Neutron monitor observations derivedfrom Climax instrument (years 1951–1964), Oh et al. [2013] (years1965–2010), and Oulu instrument (2011–2013). Numbers fol-low the normalization prescription of Oh et al. [2013] with themonthly counting rate during February 1987 being defined as100%. (blue curve) Predicted neutron monitor values derived fromthe theoretical prediction for the HMF intensity using the DaltonMinimum prediction. (green curve) Same using the GleissbergMinimum prediction.
the theory are ongoing. The years from2005 onward are times of low solar activitythat correspond to the years when Ulyssesobserved the high wind speeds used in theSchwadron and McComas [2008] study. Wesurmise that this theory works well dur-ing times of low solar activity for reasonsthat probably have to do with there beinga more stable flow configuration close tothe Sun. Therefore, it seems reasonable thatwe should be able to take the predictionsfor the HMF flux based on the Dalton andGleissberg Minima and use them to predictthe solar wind proton flux during the com-ing decade. Figure 3 (bottom) does exactlythis. The blue curve derives from the DaltonMinimum, while the green curve is obtainedfrom the Gleissberg Minimum. The resultingpredictions are that the solar wind protonflux will reach an all-time low from 2017
onward as a result of the HMF failing to recover “normal” solar maximum intensities during the relativelyweak activity levels of 2013 and surrounding years. Only the recovery times differ significantly.
5. Cosmic Ray Intensity at Earth
The intensity of the galactic cosmic rays reaching Earth is largely determined by the strength of the HMFand the speed of the solar wind [Parker, 1965]. For example, (a) during the past 50 years the ∼4.0 nT 11year cycle in the HMF intensity has resulted in a ∼20% decrease in the cosmic ray intensities observed byhigh-latitude neutron monitors (NM) and (b) the ∼1.2 nT decrease in the annual average HMF between thesunspot minima of 1996 and 2009 was accompanied by a 5.3% increase in the annual average countingrates of high-latitude NM [Oh et al., 2013]. Consequently, it is to be expected that the low HMF intensitypredicted for 2020 will result in higher cosmic ray intensities than in 2009, which were, in turn, the highestintensities observed since the commencement of the NM record in 1951.
Caballero-Lopez et al. [2004] used the cosmic ray propagation equation to determine the dependence ofcosmic ray intensity upon the intensity of the HMF at Earth for a three-dimensional heliosphere. McCracken[2007] extended that methodology, and we have used it to predict the high-latitude NM counting rates upto 2025. Using the predicted decrease in HMF flux density in Figure 3 along with equation (3) and Figure 2of McCracken [2007] (with the value of 𝛼 = 1.5), we can predict the cosmic ray intensity during the com-ing solar minimum. Figure 4 reproduces the observed neutron monitor annual counting rates together withthe predicted annual counting rates derived from the HMF model for both the Dalton and Gleissberg pos-tulates. We compute that the high-latitude annual average NM counting rates will be ∼4.5± 1.3% abovethat observed in 2009 and ∼9.0± 1.3% above the average of the values observed during the solar minimaof 1954–1996 (97.7% of the scale in Figure 4). For the Gleissberg postulate, we compute that there will bea short-lived maximum in 2019, the counting rate being 2.5 ± 1.3% above that in 2009 and ∼7.0± 1.3%compared to the sunspot minima of 1954–1996. Recent calculations based on the paleo-cosmic ray record(10Be and 14C) estimate that the highest NM counting rate would have been 12% above the latter averageduring the Dalton Minimum and ∼6% higher during the Schwabe Minimum of 1902 within the GleissbergMinimum [McCracken and Beer, 2014]. That is, our estimates of the HMF during the next solar minimum yieldpredictions that are consistent with those recorded by the paleo-cosmic ray data in the past.
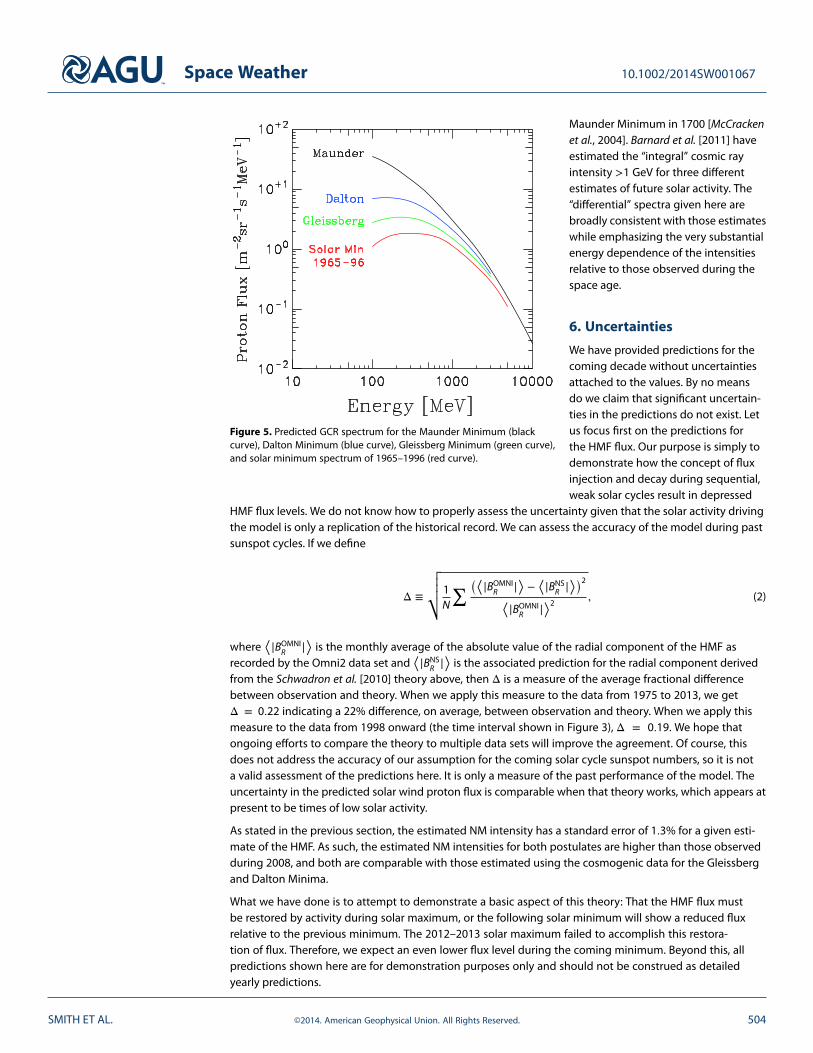
The modulation of the cosmic ray intensity is a strong function of particle energy. Using the predictions inFigure 3, we have estimated the modulation functions [Gleeson and Axford, 1968] for 2019 that are appro-priate to the Dalton and Gleissberg postulates and then used them to compute the cosmic ray spectra inthe vicinity of Earth. These are given in Figure 5 for both the Dalton and Gleissberg postulates, togetherwith those for the sunspot minima of 1965–1996 and an estimate for the highest intensity phase of the
SMITH ET AL. ©2014. American Geophysical Union. All Rights Reserved. 503
Space Weather 10.1002/2014SW001067
Figure 5. Predicted GCR spectrum for the Maunder Minimum (blackcurve), Dalton Minimum (blue curve), Gleissberg Minimum (green curve),and solar minimum spectrum of 1965–1996 (red curve).
Maunder Minimum in 1700 [McCrackenet al., 2004]. Barnard et al. [2011] haveestimated the “integral” cosmic rayintensity >1 GeV for three differentestimates of future solar activity. The“differential” spectra given here arebroadly consistent with those estimateswhile emphasizing the very substantialenergy dependence of the intensitiesrelative to those observed during thespace age.
6. Uncertainties
We have provided predictions for thecoming decade without uncertaintiesattached to the values. By no meansdo we claim that significant uncertain-ties in the predictions do not exist. Letus focus first on the predictions forthe HMF flux. Our purpose is simply todemonstrate how the concept of fluxinjection and decay during sequential,weak solar cycles result in depressed
HMF flux levels. We do not know how to properly assess the uncertainty given that the solar activity drivingthe model is only a replication of the historical record. We can assess the accuracy of the model during pastsunspot cycles. If we define
Δ ≡
√√√√√ 1N
∑ (⟨|BOMNIR |⟩ −
⟨|BNSR |⟩)2
⟨|BOMNIR |⟩2
, (2)
where⟨|BOMNI
R |⟩ is the monthly average of the absolute value of the radial component of the HMF asrecorded by the Omni2 data set and
⟨|BNSR |⟩ is the associated prediction for the radial component derived
from the Schwadron et al. [2010] theory above, then Δ is a measure of the average fractional differencebetween observation and theory. When we apply this measure to the data from 1975 to 2013, we getΔ = 0.22 indicating a 22% difference, on average, between observation and theory. When we apply thismeasure to the data from 1998 onward (the time interval shown in Figure 3), Δ = 0.19. We hope thatongoing efforts to compare the theory to multiple data sets will improve the agreement. Of course, thisdoes not address the accuracy of our assumption for the coming solar cycle sunspot numbers, so it is nota valid assessment of the predictions here. It is only a measure of the past performance of the model. Theuncertainty in the predicted solar wind proton flux is comparable when that theory works, which appears atpresent to be times of low solar activity.
As stated in the previous section, the estimated NM intensity has a standard error of 1.3% for a given esti-mate of the HMF. As such, the estimated NM intensities for both postulates are higher than those observedduring 2008, and both are comparable with those estimated using the cosmogenic data for the Gleissbergand Dalton Minima.
What we have done is to attempt to demonstrate a basic aspect of this theory: That the HMF flux mustbe restored by activity during solar maximum, or the following solar minimum will show a reduced fluxrelative to the previous minimum. The 2012–2013 solar maximum failed to accomplish this restora-tion of flux. Therefore, we expect an even lower flux level during the coming minimum. Beyond this, allpredictions shown here are for demonstration purposes only and should not be construed as detailedyearly predictions.
SMITH ET AL. ©2014. American Geophysical Union. All Rights Reserved. 504
Space Weather 10.1002/2014SW001067
7. Discussion
Other authors have made roughly similar predictions to these with different assumptions for the comingsolar minimum and different theories for the HMF flux [Barnard et al., 2011; Owens et al., 2011b]. We havetaken the relatively conservative association of recent observations with the Dalton and Gleissberg Minima,but at least one paper [Lockwood et al., 2011] has argued that the Sun may be entering conditions similarto the Maunder Minimum. If true, the resulting HMF flux and solar wind proton flux will fall to even lowervalues than those shown here, while the galactic cosmic ray intensities will reach still higher values.
The consequences of the reduced solar wind pressure will be an expansion of the magnetosphere and con-traction of the heliosphere. The absence of typical solar wind transients will reduce magnetospheric stormactivity and the relativistic electron intensity in the magnetosphere [Kataoka and Miyoshi, 2010]. The radi-ation belts will be diminished, and the atmosphere will be less effective at removing orbital debris [Turner,2011]. All of these conditions are aligned with a less active space weather environment. However, it has beenobserved that extreme Carrington-like events can occur during times of low solar activity [Turner, 2011; Riley,2012; Kataoka et al., 2012; Kataoka, 2013].
At the same time that the magnetosphere will become less active the galactic cosmic ray intensity willincrease to record levels for the space age. This means a greater hazard for astronauts and electronics out-side the Earth’s atmosphere and magnetosphere. Transient events (Forbush decreases and globally mergedinteraction regions) will become less frequent and perhaps less severe, and the constant bath of galacticcosmic radiation will exceed any past measurements during solar minima.
In this analysis we have omitted the possibility of a floor, or minimum value, in the HMF intensity. TheSchwadron et al. [2010] theory allows for a floor, but to date we find little if any theoretical or observationalmotivation for its existence. Should it exist, the predicted HMF flux and associated intensity may be greaterduring the coming solar minimum, the associated prediction for the solar wind proton flux will increaseaccordingly, and the predicted cosmic ray intensity will decrease. The coming solar minimum is likely to bean interesting test of the floor concept. We should also note that the standard sunspot numbers used hereare now under review. Various estimates place the revised values prior to 1947 at 7% to 20% higher thanthe values used here (M. Lockwood and L. Svalgaard, private communication, 2014). Since the prediction forthe HMF flux scales with sunspot number, the resulting effect on our prediction for 2014 through 2020 is aminimal absolute increase should those revisions hold true.
It appears that the assertion of Schwadron and McComas [2008] that the solar wind proton flux scales linearlywith the HMF flux is presently limited to times of low solar activity, both solar minimum and weak solar max-imum conditions. We do not, as yet, understand how to extend this theory to times of greater solar activity.We have shown that the linear scaling works well at low latitudes during solar minimum and weak solarmaximum conditions as a complement to the high-latitude results previously found. Using the Schwadronet al. [2010] formulation whereupon HMF flux depends upon CME injection rates and linking this to sunspotnumber has permitted us to predict solar wind proton flux over the coming decade under the assumptionthat the present solar cycle will follow the weak and possibly protracted behavior seen in the Dalton andGleissberg Minima. The period of low CME activity will result in low HMF flux levels which, in turn, lead to aprediction for record low solar wind proton flux levels in the coming years.
As emphasized previously, the Schwadron and McComas [2008] scaling appears to be restricted to coronalhole wind at present. The fact that activity has been light in the current “mini” cycle 24 and the apparentfact from past cycles that such mini cycles do not appear in isolation suggests that this scaling will continueto apply through the coming solar minimum. However, even in its most conservative form, the predictionis that in the next minimum between cycles 24 and 25, we should observe a continued decline of the solarwind proton flux to levels never before observed directly. This is because the last solar maximum failed torestore the HMF intensity to typical solar maximum levels and the coming solar minimum activity level islikely to be inadequate to compensate for ongoing flux loss mechanisms.
8. Summary
We have postulated, based on a 264 year history of sunspot activity, that the coming solar minimum willresemble the lows of the Dalton or Gleissberg Minima. Others have suggested the same [Clilverd et al., 2006;Watari, 2008; Turner, 2011; Kamide and Kusano, 2013; Goelzer et al., 2013; McCracken and Beer, 2014]. Using
SMITH ET AL. ©2014. American Geophysical Union. All Rights Reserved. 505
Space Weather 10.1002/2014SW001067
the sunspot number as a measure of CME activity [Owens, 2008], together with the theory of Schwadron etal. [2010] that predicts the HMF flux based on CME rates, we have made predictions for the HMF during thecoming solar minimum. We predict a record low HMF flux for the space age. In turn, we use the theory ofSchwadron and McComas [2008] that shows a strong correlation between HMF flux and solar wind protonflux to predict the solar wind proton flux for the same years. We also show that the theory works well whenusing 1 AU data when the sunspot number is lower than traditional solar maximum values. This predictsa record low solar wind proton flux during the coming solar minimum regardless of whether one uses theDalton or Gleissberg Minima as a model for the coming years. Lastly, we use the predictions for the HMFflux, together with the theories of Caballero-Lopez et al. [2004] and McCracken [2007], to predict the galacticcosmic ray intensity for the same years. The predicted radiation levels attain record highs beginning ∼2017and lasting through the coming solar minimum. The Gleissberg postulate results in a short-lived intensitymaximum, while the Dalton model implies a maximum of duration ∼5 years. These increased cosmic rayintensities represent a clear threat to satellites and astronauts, especially those outside the protection ofthe Earth’s magnetosphere. We note that one prescription for a manned mission to Mars uses transients atsolar maximum to sweep the galactic cosmic rays from interplanetary space followed by a duck-and-coverapproach to solar cosmic radiation [Turner, 2006]. The coming decade will be a particularly poor time toattempt this method of survival.
While these predictions suggest coming years of relatively low activity levels for space weather, it shouldbe kept in mind that a single, isolated transient can still do great damage to our increasingly technical soci-ety. During the last protracted solar minimum we heard colleagues complain that there was little to study inthe way of solar transients (interplanetary shocks, CMEs, solar energetic particles, etc.), while we found greatopportunities to better understand the fundamental physics behind the solar wind and HMF. We respect-fully suggest that times of quiet solar wind conditions may provide interesting insights into the underlyingdynamics of the Sun, solar wind, and magnetosphere that will make us better able to predict space weatherevents in the future.
ReferencesBarnard, L., M. Lockwood, M. A. Hapgood, M. J. Owens, C. J. Davis, and F. Steinhilber (2011), Predicting space climate change, Geophys.
Res. Lett., 38, L16103, doi:10.1029/2011GL048489.Caballero-Lopez, R. A., H. Moraal, K. G. McCracken, and F. B. McDonald (2004), The heliospheric magnetic field from 850 to 2000 AD
inferred from 10Be records, J. Geophys. Res., 109, A12102, doi:10.1029/2004JA010633.Clilverd, M. A., E. Clarke, T. Ulich, H. Rishbeth, and M. J. Jarvis (2006), Predicting solar cycle 24 and beyond, Space Weather, 4, S09005,
doi:10.1029/2005SW000207.Connick, D. E., C. W. Smith, and N. A. Schwadron (2009), The flux of open and toroidal interplanetary magnetic field as a function of
heliolatitude and solar cycle, Astrophys. J., 695, 357–362.Connick, D. E., C. W. Smith, and N. A. Schwadron (2011), Interplanetary magnetic flux depletion during protracted solar minima,
Astrophys. J., 727, 8, doi:10.1088/0004-637X/727/1/8.Gleeson, L. J., and W. I. Axford (1968), Solar modulation of galactic cosmic rays, Astrophys. J., 154, 1011–1026.Goelzer, M. L., C. W. Smith, N. A. Schwadron, and K. G. McCracken (2013), An analysis of heliospheric magnetic field flux based on
sunspot number from 1749 to today and prediction for the coming solar minimum, J. Geophys. Res. Space Physics, 118, 7525–7531,doi:10.1002/2013JA019404.
Kamide, Y., and K. Kusano (2013), Is something wrong with the present solar maximum?, Space Weather, 11, 140–141,doi:10.1002/swe.20045.
Kataoka, R., and Y. Miyoshi (2010), Why are relativistic electrons persistently quiet at geosynchronous orbit in 2009?, Space Weather, 8,S08002, doi:10.1029/2010SW000571.
Kataoka, R., H. Miyahara, and F. Steinhilber (2012), Anomalous 10Be spikes during the Maunder Minimum: Possible evidence for extremespace weather in the heliosphere, Space Weather, 10, S11001, doi:10.1029/2012SW000835.
Kataoka, R. (2013), Possibility of occurrence of extreme magnetic storms, Space Weather, 11, 214–218, doi:10.1002/swe.20044.King, J. H., and N. E. Papitashvili (2005), Solar wind spatial scales in and comparisons of hourly Wind and ACE plasma and magnetic field
data, J. Geophys. Res., 110, A02104, doi:10.1029/2004JA010649.Lockwood, M., A. P. Rouillard, and I. D. Finch (2009), The rise and fall of open solar flux during the current grand solar maximum,
Astrophys. J., 700, 937–944.Lockwood, M., M. J. Owens, L. Barnard, C. J. Davis, and F. Steinhilber (2011), The persistence of solar activity indicators and the descent
of the Sun into Maunder Minimum conditions, Geophys. Res. Lett., 38, L22105, doi:10.1029/2011GL049811.Low, B. C. (2001), Coronal mass ejections, magnetic flux ropes, and solar magnetism, J. Geophys. Res., 106, 25,141–25,163,
doi:10.1029/2000JA004015.McComas, D. J., J. T. Gosling, and J. L. Phillips (1992), Interplanetary magnetic flux: Measurement and balance, J. Geophys. Res., 97,
171–177.McComas, D. J., R. W. Ebert, H. A. Elliott, B. E. Goldstein, J. T. Gosling, N. A. Schwadron, and R. M. Skoug (2008), Weaker solar wind from
the polar coronal holes and the whole Sun, Geophys. Res. Lett., 35, L18103, doi:10.1029/2008GL034896.McComas, D. J., N. Angold, H. A. Elliott, G. Livadiotis, N. A. Schwadron, R. M. Skoag, and C. W. Smith (2013), Weakest solar wind of the
space age and the current “mini” solar maximum, Astrophys. J., 779, 2, doi:10.1088/0004-637X/779/1/2.McCracken, K. G. (2007), The heliomagnetic field near Earth, 1428–2005, J. Geophys. Res., 112, A09106, doi:10.1029/2006JA012119.
AcknowledgmentsThe authors thank the National SpaceScience Data Center for providing dataused in this study. We thank the SIDCfor sunspot data used in this study(http://sidc.oma.be/sunspot-data/).C.W.S. is funded by Caltech subcon-tract 44A-1062037 to the Universityof New Hampshire in support of theACE/MAG instrument. N.A.S. is fundedby EMMREM (grant NNX07AC14G),C-SWEPA (NASA grant NNX07AC14G),and Sun-2-Ice (NSF grant AGS1135432)projects. K.G.McC. is funded by NSFgrant 1050002. M.L.G. is an under-graduate student at the University ofNew Hampshire.
SMITH ET AL. ©2014. American Geophysical Union. All Rights Reserved. 506
Space Weather 10.1002/2014SW001067
McCracken, K. G., and J. Beer (2014), Comparison of the extended solar minimum of 2006–2009 with the Spoerer, Maunder, and DaltonGrand Minima in solar activity in the past, J. Geophys. Res. Space Physics, 119, 2379–2387, doi:10.1002/2013JA019504.
McCracken, K. G., J. Beer, and F. B. McDonald (2004), Variations in the cosmic radiation, 1890–1986, and the solar and terrestrialimplications, Adv. Space Sci., 34, 397–406.
Oh, S., J. W. Bieber, P. Evenson, J. Clem, Y. Yi, and Y. Kim (2013), Record neutron monitor counting rates from galactic cosmic rays, J.Geophys. Res. Space Physics, 118, 5431–5436, doi:10.1002/jgra.50544.
Owens, M. J. (2008), Combining remote and in situ observations of coronal mass ejections to better constrain magnetic cloudreconstruction, J. Geophys. Res., 113, A12102, doi:10.1029/2008JA013589.
Owens, M. J., and N. U. Crooker (2006), Coronal mass ejections and magnetic flux buildup in the heliosphere, J. Geophys. Res., 111,A10104, doi:10.1029/2006JA011641.
Owens, M. J., and N. U. Crooker (2007), Reconciling the electron counterstreaming and dropout occurrence rates with the heliosphericflux budget, J. Geophys. Res., 112, A06106, doi:10.1029/2006JA012159.
Owens, M. J., N. U. Crooker, N. A. Schwadron, T. S. Horbury, S. Yashiro, H. Xie, O. C. St. Cyr, and N. Gopalswamy (2008), Conservation ofopen solar magnetic flux and the floor in the heliospheric magnetic field, Geophys. Res. Lett., 35, L20108, doi:10.1029/2008GL035813.
Owens, M. J., N. U. Crooker, and M. Lockwood (2011a), How is open solar magnetic flux lost over the solar cycle?, J. Geophys. Res., 116,A04111, doi:10.1029/2010JA016039.
Owens, M. J., M. Lockwood, L. Barnard, and C. J. Davis (2011b), Solar cycle 24: Implications for energetic particles and long-term spaceclimate change, Geophys. Res. Lett., 38, L19106, doi:10.1029/2011GL049328.
Owens, M. J., and M. Lockwood (2012), Cyclic loss of open solar flux since 1868: The link to heliospheric current sheet tilt and implicationsfor the Maunder Minimum, J. Geophys. Res., 117, A04102, doi:10.1029/2011JA017193.
Parker, E. N. (1958), Dynamics of the interplanetary gas and magnetic fields, Astrophys. J., 128, 664–676.Parker, E. N. (1963), Interplanetary Dynamical Processes, Wiley-Interscience, New York.Parker, E. N. (1965), The passage of energetic particles through interplanetary space, Planet. Space Sci., 13, 9–13.Riley, P. (2012), On the probability of occurrence of extreme space weather events, Space Weather, 10, S02012,
doi:10.1029/2011SW000734.Schwadron, N. A., and D. J. McComas (2008), The solar wind power from magnetic flux, Astrophys. J., 686, L33–L36.Schwadron, N. A., D. E. Connick, and C. W. Smith (2010), Magnetic flux balance in the heliosphere, Astrophys. J., 722, L132–L136.Smith, C. W., N. A. Schwadron, and C. E. DeForest (2013), Decline and recovery of the interplanetary magnetic field during the protracted
solar minimum, Astrophys. J., 775, 59, doi:10.1088/0004-637X/775/1/59.Smith, E. J., and A. Balogh (2008), Decrease in heliospheric magnetic flux in this solar minimum: Recent Ulysses magnetic field
observations, Geophys. Res. Lett., 35, L22103, doi:10.1029/2008GL035345.Solanki, S. K., M. Schüssler, and M. Fligge (2000), Evolution of the Sun’s large-scale magnetic field since the Maunder Minimum, Nature,
408, 445–447, doi:10.1038/35044027.Turner, R. (2006), Space weather challenges intrinsic to the human exploration of space, in Solar Eruptions and Energetic Particles, vol. 165,
edited by N. Gopalswamy, R. A. Mewaldt, and J. Torsti, pp. 367–374, AGU, Washington, D. C.Turner, R. (2011), Solar cycle slow to get going: What does it mean for space weather?, Space Weather, 9, S04004,
doi:10.1029/2011SW000671.Watari, S. (2008), Forecasting solar cycle 24 using the relationship between cycle length and maximum sunspot number, Space Weather,
6, S12003, doi:10.1029/2008SW000397.
SMITH ET AL. ©2014. American Geophysical Union. All Rights Reserved. 507