the healthcare improvement - isqua · the healthcare improvement leaders’ essential toolkit an...
TRANSCRIPT

OXYJENNC O N S U L T I N G
The healthcare improvement leaders’ essential toolkit
An ISQua webinar presented by Mark Jennings,Oxyjenn Consulting Ltd
30th June 2017

OXYJENNC O N S U L T I N G
Introduction
Mark JenningsMBA. BSc. CEng.
Managing DirectorOxyjenn Consulting
No interests to declare

OXYJENNC O N S U L T I N G

OXYJENNC O N S U L T I N G
Webinar Objectives
For participants to:
1. Understand the key approaches critical to making successful change
2. Be familiar with the essential tools in the improvement leaders toolkit
3. Be ready to apply the tools to your next project

OXYJENNC O N S U L T I N G
The four key approaches critical to making successful change
and improvement in healthcare;
▪ Getting started: the three fundamental questions for all
improvement initiatives
▪ Generating solutions: collaborative strategy development
▪ Selecting opportunities: prioritisation by impact and ease
of implementation
▪ Knowing how you are doing: measuring progress and
impact
Followed by
▪ Questions and discussion
Outline

OXYJENNC O N S U L T I N G
Who are you?

OXYJENNC O N S U L T I N G
1.Getting Started
OXYJENNC O N S U L T I N G
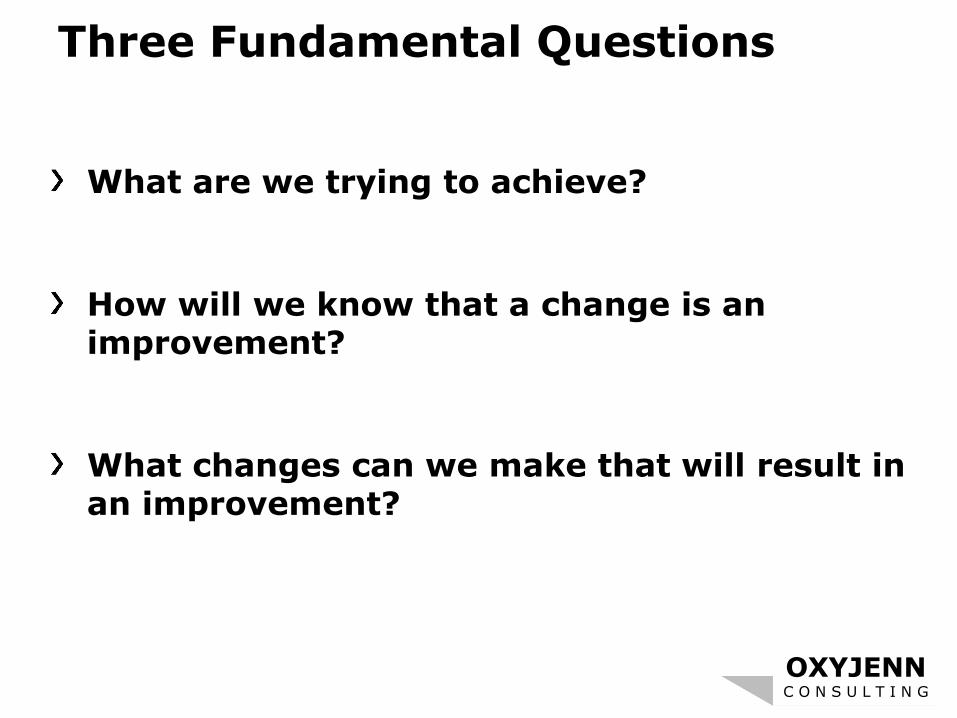
Three Fundamental Questions
What are we trying to achieve?
How will we know that a change is an improvement?
What changes can we make that will result in an improvement?

OXYJENNC O N S U L T I N G
Model for Improvement
Langley, G., Nolan, K., and Nolan, T., 1994. The Foundation of Improvement, Quality Progress, June 1994

OXYJENNC O N S U L T I N G
Model for Improvement
Set AIMS that are measurable, time-specific, and apply to a defined population
Langley, G., Nolan, K., and Nolan, T., 1994. The Foundation of Improvement, Quality Progress, June 1994

OXYJENNC O N S U L T I N G
Model for Improvement
Set AIMS that are measurable, time-specific, and apply to a defined population
Establish MEASURES to determine if a specific change leads to improvement
Select INTERVENTIONS most likely to result in improvement
Langley, G., Nolan, K., and Nolan, T., 1994. The Foundation of Improvement, Quality Progress, June 1994

OXYJENNC O N S U L T I N G
Model for Improvement
Set AIMS that are measurable, time-specific, and apply to a defined population
Langley, G., Nolan, K., and Nolan, T., 1994. The Foundation of Improvement, Quality Progress, June 1994

OXYJENNC O N S U L T I N G
“If you don't know where you are going, any road will get you there”

OXYJENNC O N S U L T I N G
The Aim Statement
Helps you focus on what your project needs to accomplish. It provides a specific, measurable statement of intent. The aim should be:
• Clear and unambiguous, deliverableS - Specific• Observable outcomes of performance
Quantity, Quality, Cost, TimeM - Measurable• Realistic within the capabilities and
contraintsA – Achieveable
• Address a significant needR - Relevant• You have a target date for completion
• Now is an opportune time to undertake the project
T – Timebound• Project will stimulate all concerned to
actionE – Engaging• Written down for clarity, communication
and reviewR - Recorded

OXYJENNC O N S U L T I N G
Clear and measurable aims?
Ensure timely completion of the assessment processAll patients to have a complete medication listManage the readmission rateLower staff sickness rateImprove the care of frequently admitted patients Fewer medication errorsImprove staff turnoverReduce patient fallsProvision of timely and appropriate care for stroke patients

OXYJENNC O N S U L T I N G
“Some is not a number, soon is not a
time”
Don Berwick IHI, Boston
How good?
By when?

OXYJENNC O N S U L T I N G
Clear and measurable aims?
Ensure timely completion of the assessment processAll patients to have a complete medication listManage the readmission rateLower staff sickness rateImprove the care of frequently admitted patients Fewer medication errorsImprove staff turnoverReduce patient fallsProvision of timely and appropriate care for stroke patients
How good?
By when?

OXYJENNC O N S U L T I N G
For your project
Define a measurable aim
Set AIMS that are measurable, time-specific, and apply to a defined population

OXYJENNC O N S U L T I N G
The PDSA Cycle

OXYJENNC O N S U L T I N G
Model for Improvement
Set AIMS that are measurable, time-specific, and apply to a defined population
Establish MEASURES to determine if a specific change leads to improvement
Select INTERVENTIONS most likely to result in improvement
TEST the changes

OXYJENNC O N S U L T I N G
Meeting rooms
Real world
Approve
Design Design Design Design
Implement !
Opinion
[Patient Safety First]

OXYJENNC O N S U L T I N G
Meeting rooms
Real world
[Patient Safety First]
Implement
Approve
Test &
refine
Test &
refineTest &
refine
Design
Observation
data

OXYJENNC O N S U L T I N G
Plan-Do-Study-Act
disciplined framework ensures every part is done every time
facilitates rapid prototyping and rolling out of new ideas

OXYJENNC O N S U L T I N G
The usual approach

OXYJENNC O N S U L T I N G
Change through small steps
Change ...with a clear purposeyou can learn from (without fear of failure)which is less exhaustingwith fewer unintended consequenceswhich builds engagement and optimism
Always ask.. What is the smallest test of change you can try?

OXYJENNC O N S U L T I N G
Plan-Do-Study-Act

OXYJENNC O N S U L T I N G
Plan-Do-Study-Act

OXYJENNC O N S U L T I N G
Model for Improvement
Set AIMS that are measurable, time-specific, and apply to a defined population
Establish MEASURES to determine if a specific change leads to improvement
Select INTERVENTIONS most likely to result in improvement
TEST the changes

OXYJENNC O N S U L T I N G

OXYJENNC O N S U L T I N G
2. Generating solutions

OXYJENNC O N S U L T I N G
Model for Improvement
Set AIMS that are measurable, time-specific, and apply to a defined population
Establish MEASURES to determine if a specific change leads to improvement
Select INTERVENTIONS most likely to result in improvement
Langley, G., Nolan, K., and Nolan, T., 1994. The Foundation of Improvement, Quality Progress, June 1994

OXYJENNC O N S U L T I N G
Driver Diagrams: Collaborative solution development

OXYJENNC O N S U L T I N G
Most solutions /interventions ….

Aim: An improved
system
PrimaryDriver
PrimaryDriver
Change
Change
Change
SecondaryDriver
SecondaryDriver
SecondaryDriver
SecondaryDriver
SecondaryDriver
Driver Diagrams
CauseEffect
Drives
Change
Change

Driver DiagramWeight loss example
Pedometer
Gym work out 3
days
Squash weekends
No pub weekdays
Take packed
lunch
Low fat meals
Buy only 1
sandwich
Water bottle for
work bag
Fruit for dessert
Put away the
large glasses
Put cycling days
in diary
Cycling kit out
night before
Get rid of Oyster
card
Be more active
during the day
Do sport
Drink less alcohol
Substitute lower
calorie foods
Eat lessReduce
calories in
Increase
calories out
Take stairs
2 stone weight
loss in 6/12

20 % REDUCTION IN ADMISSIONS
FOR THE OVER 75s BY 2016
Reduce attendanceat A&E
Reduce conversion to admission
Utilise alternative options
Clinician education
Increase efficiency / streamlining
Best practice clinical management
Data focused plans
Patient education
SPA inreachto A&E / MAU
Utilise SPA
Make more use of paramedics
Work with third sector
Social services input
Better population health
Link to HWB priorities
Proactive mental health care
Optimise LTC management
Rapid discharge options from A&E
Home discharge
Non-home discharge
All GP referrals to be triaged by SPA
Medical team support on phone for paramedics
Extended scope paramedic roles
Increase community hospital beds
Social worker on call in A&E
Funding for volunteer home visitor training
Engagement meeting with local charitiesCauseEffect
Urgent care

Pedometer
Gym work out 3
days
Squash weekends
No pub weekdays
Take packed
lunch
Low fat meals
Buy only 1
sandwich
Water bottle for
work bag
Fruit for dessert
Put away large
wine glasses
Put cycling days
in diary
Cycling kit out
night before
Get rid of Oyster
card
Take stairs2 stone weight
loss in 6/12
Generate Change Ideas

Pedometer
Gym work out 3
days
Squash weekends
No pub weekdays
Take packed
lunch
Low fat meals
Buy only 1
sandwich
Water bottle for
work bag
Fruit for dessert
Put away large
wine glasses
Put cycling days
in diary
Cycling kit out
night before
Get rid of Oyster
card
Take stairs2 stone weight
loss in 6/12
Look for patterns

Pedometer
Gym work out 3
days
Squash weekends
No pub weekdays
Take packed
lunch
Low fat mealsBuy only 1
sandwich
Water bottle for
work bag
Fruit for dessertPut away large
wine glasses
Put cycling days
in diary
Cycling kit out
night before
Get rid of Oyster
card
Take stairs
Be more active during
the dayDo sport
Drink less alcohol
Substitute lower calorie
foods
Eat less
Marshall a mass of ideas
2 stone weight
loss in 6/12

Pedometer
Gym work out 3
days
Squash weekends
No pub weekdays
Take packed
lunch
Low fat meals
Buy only 1
sandwich
Water bottle for
work bag
Fruit for dessert
Put away large
wine glasses
Put cycling days
in diary
Cycling kit out
night before
Get rid of Oyster
card
Be more active
during the day
Do sport
Drink less alcohol
Substitute lower
calorie foods
Eat lessReduce
calories in
Increase
calories out
Take stairs
2 stone weight loss
in 6/12
Marshall amass of ideas
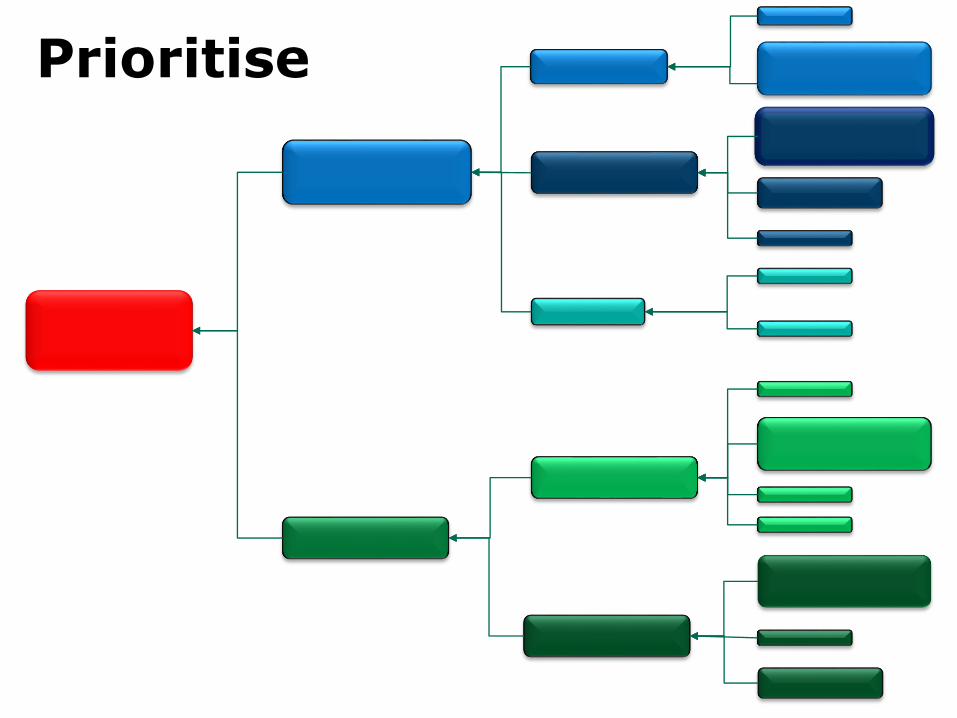
Prioritise

Surviving failure
We tend to plan assuming this
When all the evidence and our experience says it is like this

Gym workout 3
days per week
Buy only one sandwich
Take stairs
Survive failure:Try something else

Gym workout 3
days per week
Buy only one sandwich
Fruit for dessert
Take stairs
Take packed
lunch
Consolidate success:Try something else

Aim: An improved
system
PrimaryDriver
PrimaryDriver
Change
Change
Change
SecondaryDriver
SecondaryDriver
SecondaryDriver
SecondaryDriver
SecondaryDriver
Driver Diagrams
CauseEffect
Drives
Change
Change

OXYJENNC O N S U L T I N G
Driver diagram
Patient Safety First campaign
Aim
Specific
interventions
Measures
bundle
M1


Designing quality improvement initiatives: The Action Effect Method, a structured approach identifying and articulating programme theory NWL CLARHC
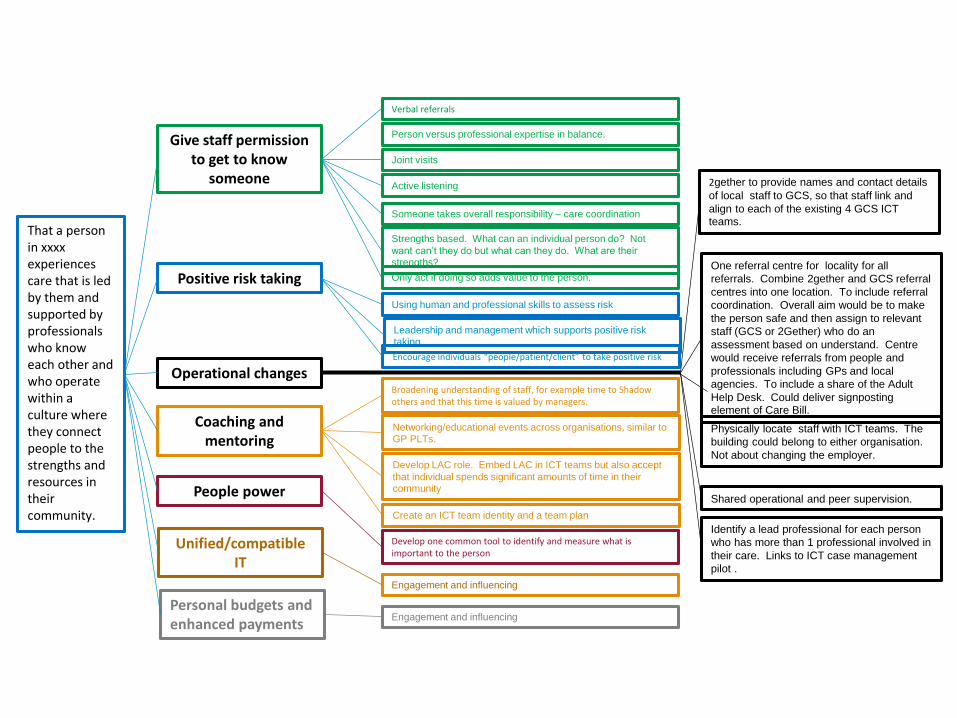
That a person in xxxxexperiences care that is led by them and supported by professionals who know each other and who operate within a culture where they connect people to the strengths and resources in their community.
Give staff permission to get to know
someone
Positive risk taking
Operational changes
Coaching and mentoring
People power
Verbal referrals
Joint visits
Active listening
Someone takes overall responsibility – care coordination
Strengths based. What can an individual person do? Not
want can’t they do but what can they do. What are their strengths?
Using human and professional skills to assess risk
Only act if doing so adds value to the person.
Broadening understanding of staff, for example time to Shadow others and that this time is valued by managers.
Develop one common tool to identify and measure what is important to the person
Person versus professional expertise in balance.
Leadership and management which supports positive risk taking
Encourage individuals “people/patient/client” to take positive risk
Networking/educational events across organisations, similar to GP PLTs.
Develop LAC role. Embed LAC in ICT teams but also accept
that individual spends significant amounts of time in their community
Create an ICT team identity and a team plan
2gether to provide names and contact details
of local staff to GCS, so that staff link and
align to each of the existing 4 GCS ICT teams.
Shared operational and peer supervision.
Identify a lead professional for each person
who has more than 1 professional involved in
their care. Links to ICT case management
pilot .
Physically locate staff with ICT teams. The
building could belong to either organisation.
Not about changing the employer.
One referral centre for locality for all
referrals. Combine 2gether and GCS referral
centres into one location. To include referral
coordination. Overall aim would be to make
the person safe and then assign to relevant
staff (GCS or 2Gether) who do an
assessment based on understand. Centre
would receive referrals from people and
professionals including GPs and local
agencies. To include a share of the Adult
Help Desk. Could deliver signposting element of Care Bill.
Unified/compatible IT
Personal budgets and enhanced payments
Engagement and influencing
Engagement and influencing

Aim Best Possible
outcomes for mother and child
OutcomesImprove life outcomes:• Pre term• Still birth• LBW• Mortality• Morbidity
Improve experience:• Measures
from experience surveys
Best use of £ resources
Safe and Effective Care
PRIMARY DRIVERSAIM SECONDARY TERTIARY CHANGE IDEAS
Agreed pathways - midwifery led care[pre-conception to post-natal]
Define roles & responsibilities
Enhanced roles for MSWs
Reduce unwarranted variations in clinical behaviour
Risk assessment at least each trimester and post partum
Appropriate high risk pathways
Low risk pathways
Case loading
Review perinatal mental health practice & agree high risk pathways
Risk assessment tool
Service Specs & SDIPComplex case management protocol
& out of hospital care
High impact pre-conception advice
Effefctive & timely screening (ante & post)
Discuss with secondary/primary care
Refine pre-conception & intervention training with staff
Pharmacy referrals for booking
Skilled & available workforce. Learning as system. Quality improvement skills
Recruitment & Retention
Top Quality Clinical Governance
Glucose tolerance screening
Safe reportingSafe Culture
Effective staff supervision
Develop culture of excellence
Workforce capacity review
CNST action plan
Redefine quality metrics

AIM GENERIC PRIMARY DRIVERS
ANY AIM
Premises
Leadership and culture
Workforce
Collaboration and integration
Alternative provision
Local leadership and culture demonstrate support for aim and quality improvement
Care delivered in premises that are appropriate, safe and efficient
Alternatives to conventional care delivery (including self-care) have been
considered
System partners collaborate to improve care and integrate delivery
Workforce planning and development to ensure services delivered by an appropriately skilled workforce
Methods to manage demand (including stratification and segmentation) have
been considered
Information Accurate information available to support timely clinical decision-making
Demand management
PROMPTS
Driver Diagram Checklist

OXYJENNC O N S U L T I N G
Driver Diagrams
Benefits ...
✓ build complex strategy
✓ immediate
✓ visual
✓ collaborative
Different scenarios ...
1. Helps generate change ideas
2. Marshall a mass of change ideas
3. Survive failure / the unexpected
✓ hypothesis
✓ avoid “silver bullet” thinking
✓ highlights overlooked ideas

OXYJENNC O N S U L T I N G
For your project
Draw a driver diagram
Primary
DriversOutcome
Secondary
Drivers
Process
Changes
Aim: An
improved
system
P. Driver
S. Driver 1Change 1
P. Driver
S. Driver 2
S. Driver 3
S. Driver 1
S. Driver 2
Change 2
Change 3
EFFECT CAUSE

OXYJENNC O N S U L T I N G
3. Selecting Opportunities
OXYJENNC O N S U L T I N G
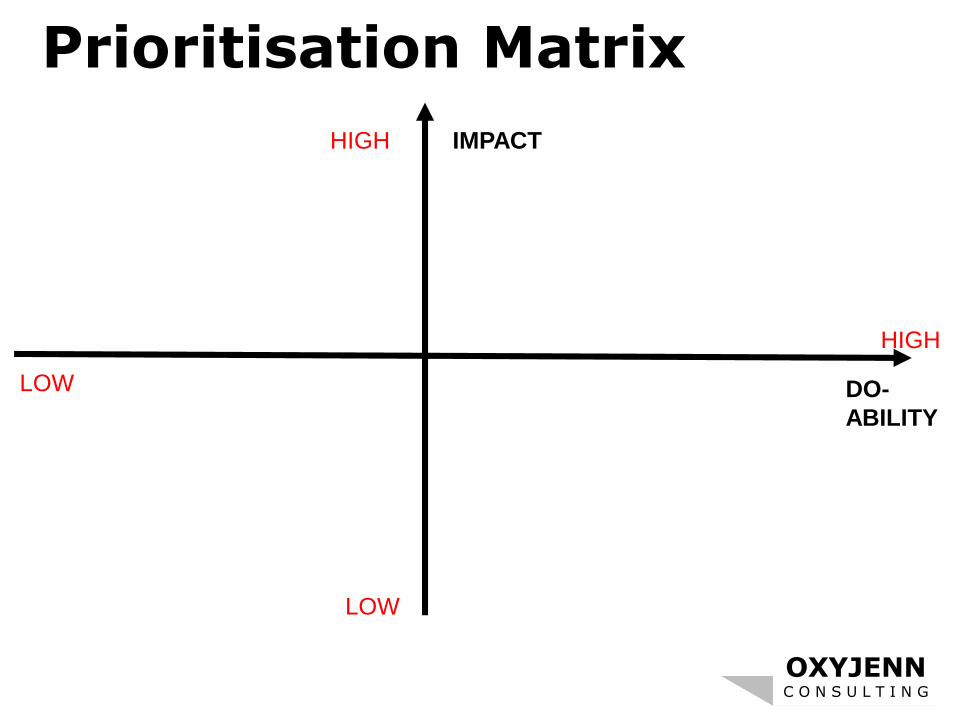
IMPACT
DO-
ABILITY
HIGH
HIGH
LOW
LOW
Prioritisation Matrix

OXYJENNC O N S U L T I N G
IMPACT
DO-
ABILITY
HIGH
HIGH
LOW
LOW

OXYJENNC O N S U L T I N G

OXYJENNC O N S U L T I N G

OXYJENNC O N S U L T I N G
© 2011 Oxyjenn Consulting D R A F T
IMPACT
IMP
LEM
ENTA
TIO
N
HIGHER
LOWER
HARDER EASIER
Converting emergency admissions for particular
presentations to ‘day cases’
Comprehensive ambulatory emergency care service for a wide
range of emergency presentations
Proactive outreach case management by district nurses and community
matrons
Integrated health and social care via a Care Trust
Integrated urgent care in general practice
Community Virtual wards
Acute visiting scheme in general practice
Extended access hours intermediate care response
teams
Care bundles /pathways for all emergency and
elective careIntegrated intermediate
care within general support for older people
GPs in A&E
Focus on managing LoSand expediting discharge
Improved clinical decision-making in A&E (use of
senior staff earlier in the process )
Emergency care practitioners/paramedics
on 999 ambulances
Classifying potential interventions

OXYJENNC O N S U L T I N G

OXYJENNC O N S U L T I N G
4. Knowing how you are doing

OXYJENNC O N S U L T I N G
“We’re pressed for time, so we’ll be jumping to conclusions”

OXYJENNC O N S U L T I N G
Meeting rooms
Real world
[Patient Safety First]
Implement
Approve
Test &
refine
Test &
refineTest &
refine
Design
Observation
data

OXYJENNC O N S U L T I N G
Meeting rooms
Real world
[Patient Safety First]
Implement
Approve
Test &
refine
Test &
refineTest &
refine
Design
Measurement

OXYJENNC O N S U L T I N G
▪ Why measure ?
▪ What to measure?
▪ How to use measures?
Dimensions of measurement

OXYJENNC O N S U L T I N G
The three purposes of measurement
• eg A-B comparison, average, huge dataset
Research
• eg one-to-many benchmarking comparison, average, large dataset
Judgement
• eg continual analysis of single changing process over time
Improvement
Why measure ?

OXYJENNC O N S U L T I N G
Mindsets
Research
Improvement
Judgement

OXYJENNC O N S U L T I N G
Research Judgement Improvement
GoalNew knowledge (not its applicability)
ComparisonReward / punishmentSpur for change
Processunderstanding
Evaluating a change
Hypothesis Fixed None Multiple and flexible
Measures Many Very few Few
Time period Long, past Long/medium, past Short, current
Sample Large Large Small
Confounders
Measure or control Describe and try to measure
Consider but rarely measured
Risks in improvemen
t settings
Ignores time based variation
Over-engineers data collection
Ignores time based variation
Over-reaction to natural variation
Incorrectlyperceived as ‘inferior statistics’
Measurement mindsets
Based on L Solberg, G Mosser and S McDonald (1997) The Three Faces of Performance Measurement: Improvement,
Accountability and Research, Journal on Quality Improvement, 23 (3): 135 - 147.

OXYJENNC O N S U L T I N G
Primary
DriversOutcome
Secondary
Drivers
Ideas for Process
Changes
AIM:
A New
ME!
Calories In
Limit daily
intake
Track
Calories
Calories
Out
Substitute
low calorie
foods
Avoid
alcohol
Work out 5
days
Bike to
work
Plan
Meals
Drink H2O
Not Soda
drives
drives
drives
drives
drives
drives
drives
drives
• Weight
• BMI
• Body Fat
• Waist size
• Daily calorie
count
• Exercise
calorie count
• Days between
workouts
• Avg drinks/
week
• Running
calorie total
• % of
opportunities
used
• Sodas/
week
• Meals off-
plan/week
• Avg cal/day
Exercise
Fidgiting
Hacky
Sack in
office
Percent of days
on bike
Etc...
Measures –plotted on driver diagram

OXYJENNC O N S U L T I N G
What to measure

OXYJENNC O N S U L T I N G
What to measure?
Structure Process Outcome
Avedis Donabedian
‘Outcomes remain the ultimate validators of the
effectiveness and quality of medical care’ but they
‘must be used with discrimination’
The environment
in which care
occurs
What care is
delivered, and
how
The impact on
patients and the
population

OXYJENNC O N S U L T I N G
What to measure?
Structure Process Outcome
eg Structure indicators…
• patients treated on a specialist stroke unit
• attributes relating to clinicians (such as certification,
training)
• staffing ratios
• surgical volumes
• access to equipment eg, MRI scanners.
OXYJENNC O N S U L T I N G
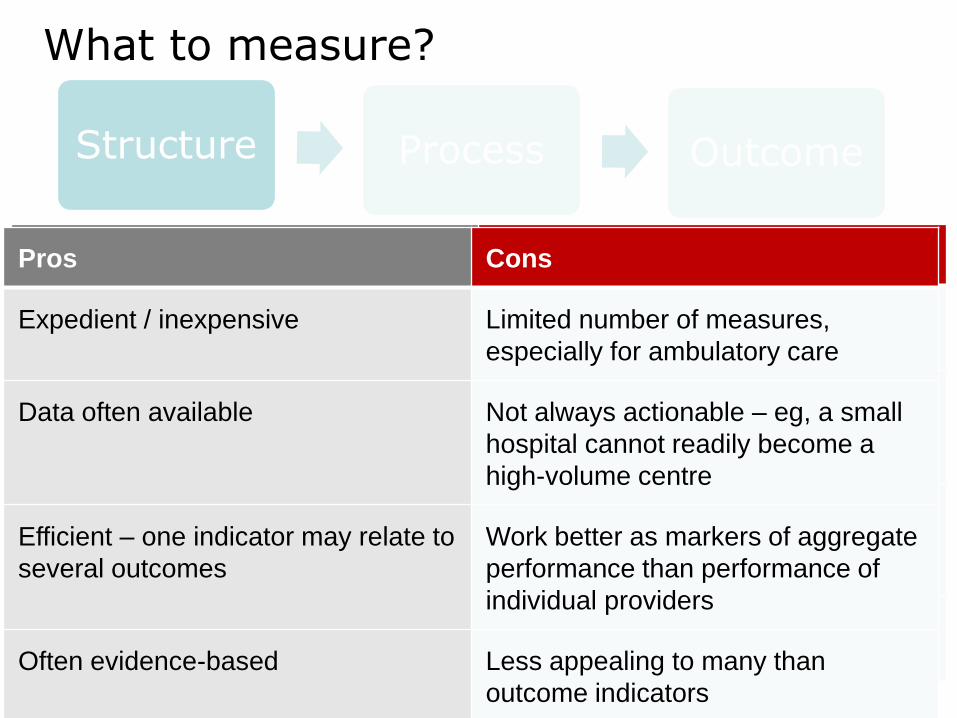
What to measure?
Structure Process Outcome
Pros ConsPros Cons
Expedient / inexpensive
Data often available
Efficient – one indicator may relate to
several outcomes
Often evidence-based
Pros Cons
Expedient / inexpensive Limited number of measures,
especially for ambulatory care
Data often available Not always actionable – eg, a small
hospital cannot readily become a
high-volume centre
Efficient – one indicator may relate to
several outcomes
Work better as markers of aggregate
performance than performance of
individual providers
Often evidence-based Less appealing to many than
outcome indicators

OXYJENNC O N S U L T I N G
Structure Process Outcome
What to measure?
eg Process indicators…
• antenatal assessment <13 weeks
• physical checks in people with serious mental
illness
• structured education for people with diabetes
• people with stroke reviewed <6 months of
leaving hospital
• psychological support after stroke

OXYJENNC O N S U L T I N G
What to measure?
Structure Process Outcome
Pros ConsPros Cons
Most evidence-based indicators are
process related
Direct measure of quality
Reflect care that patients receive
Easily measured, data collection easier
Easy to interpret
Not subject to time lags
Don’t require risk adjustment
Actionable, therefore useful for quality
improvement, performance
assessment
Pros Cons
Most evidence-based indicators are
process related
Often too specific, narrow
Direct measure of quality Links with outcomes variable/unclear
Reflect care that patients receive Can become tick box exercise
Easily measured, data collection easier Potentially subject to manipulation
Easy to interpret May have little appeal for patients
Not subject to time lags
Don’t require risk adjustment
Actionable, therefore useful for quality
improvement, performance
assessment

OXYJENNC O N S U L T I N G
What to measure?
eg Outcome indicators…
• recovery following talking therapies
• under 75 mortality rate from cancer
• hospital admissions for ambulatory care-sensitive
conditions
• mortality within 30 days of hospital admission for stroke
• emergency re-admissions within 30 days of discharge
from hospital
• health-related quality of life for people with long-term
conditions
• patient experience of GP out-of-hours services
• Patient Reported Outcome Measures
Structure Process Outcome

OXYJENNC O N S U L T I N G
What to measure?
Pros ConsPros Cons
Face validity
Reflect all processes of care
Effective where close causal link exists
between intervention & outcome
Measurement and feedback can drive
improvement
Not easily manipulated
Effectively applied in surgery – eg,
cardiac surgery
Structure Process Outcome
Pros Cons
Face validity Link to care quality variable / unclear –
modern medicine can’t cure everything
Reflect all processes of care Affected by factors unrelated to care
quality
Effective where close causal link exists
between intervention & outcome
Attribution often difficult/uncertain
Measurement and feedback can drive
improvement
Measurement challenges: - risk
adjustment - good-quality clinical data -
outcomes often low-frequency events
Not easily manipulated Potential for risk avoidance
Effectively applied in surgery – eg,
cardiac surgery
Limited use in primary, medical,
ambulatory care
Time lag between care & outcome

OXYJENNC O N S U L T I N G
Explaining outcomes…
Structure Process Outcome
Category of explanation
Sources of variation
Differences in patient types
Patient characteristics – eg, co-morbidity, severity, socio-economic status
Impact of external factors
eg quality of primary, community, ambulance care, local availability of hospices
Measurement challenges
Ascertaining risk factors, availability of data, method of analysis – eg, method of risk adjustment
Chance Random variation, influenced by numbers of cases and frequency of

OXYJENNC O N S U L T I N G
What to measure?
Structure Process Outcome
“Intermediate outcomes”
• a common solution
• properties of both process & outcome
• but be careful to acknowledge it’s
not ‘the ultimate outcome’

OXYJENNC O N S U L T I N G
OU
TP
UT
S
HUMAN
FACTORS
HUMAN
FACTORS
INTERNAL PROCESSES & PROCECEDURES
INP
UT
S
EXTERNAL
FACTORS
Process Measure
Ou
tco
me
Measu
re
What to measure?
Is it being done?
Is it working?
Is it in place?
Structure
Measure
OXYJENNC O N S U L T I N G
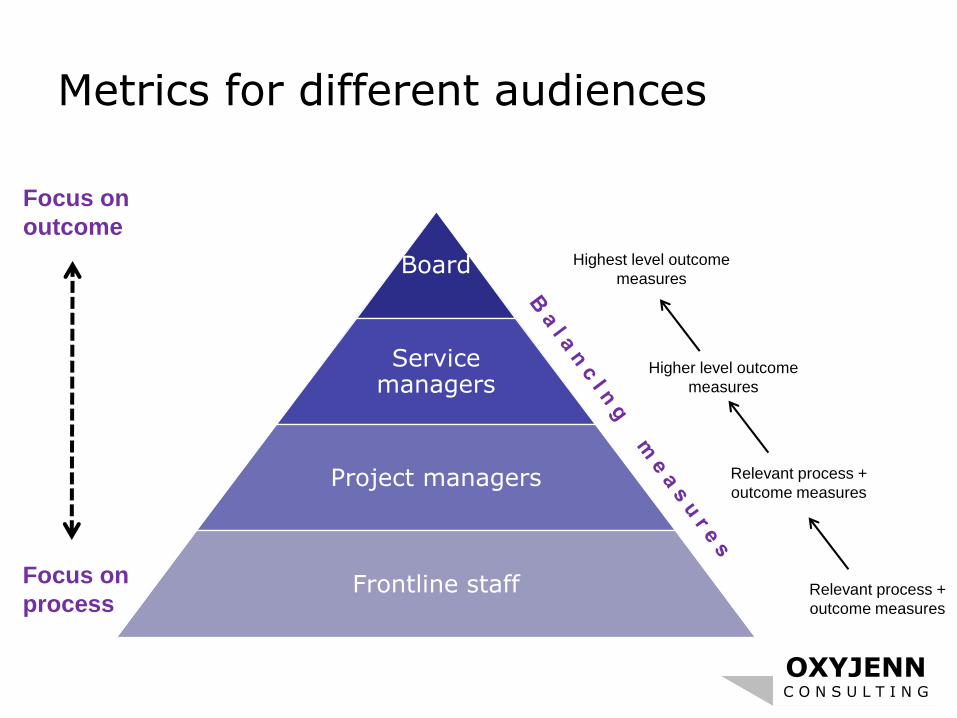
Metrics for different audiences
Board
Service managers
Project managers
Frontline staff
Focus on
outcome
Focus on
processRelevant process +
outcome measures
Relevant process +
outcome measures
Higher level outcome
measures
Highest level outcome
measures

OXYJENNC O N S U L T I N G
Balancing measures

OXYJENNC O N S U L T I N G
OU
TP
UT
S
HUMAN
FACTORS
HUMAN
FACTORS
INTERNAL PROCESSES & PROCECEDURES
INP
UT
S
EXTERNAL
FACTORS
Process Measure(s)
Ou
tco
me
Measu
re(s)
Balancing Measure(s)
What to measure?
Is it being done?
Is it working?
Unintended consequences?
Is it in place?
Structure
Measure(s)

OXYJENNC O N S U L T I N G
How to use measures

OXYJENNC O N S U L T I N G

OXYJENNC O N S U L T I N G
How do you look at your data ?
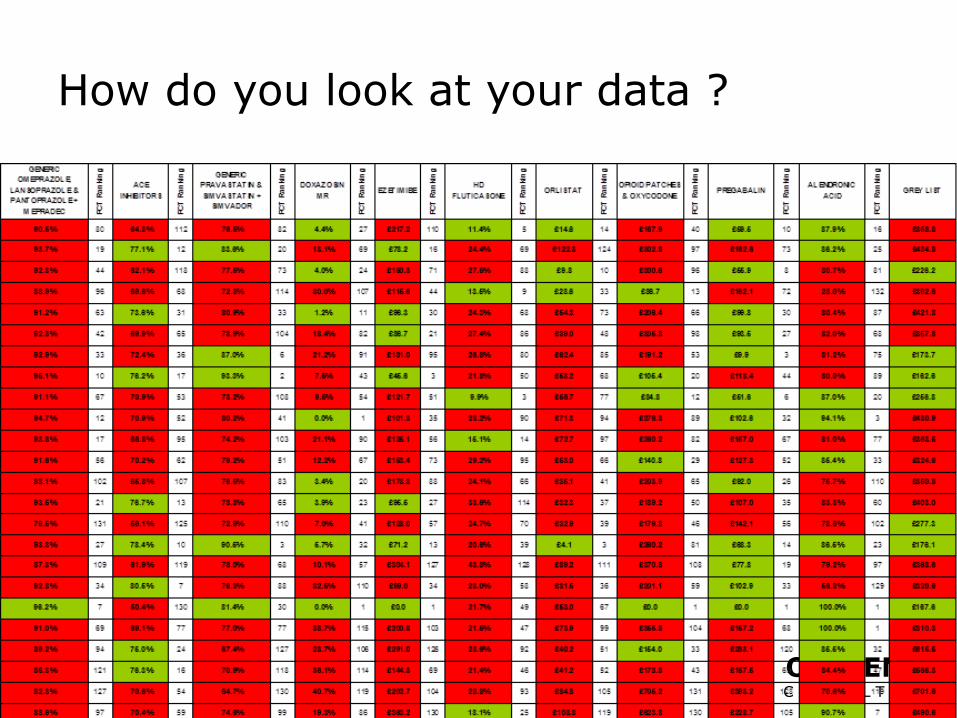
OXYJENNC O N S U L T I N G
How do you look at your data ?

OXYJENNC O N S U L T I N G
The Problem
Aggregated data presented in
tabular formats or with summary
statistics, will not help you measure
the impact of improvement efforts.
Aggregated data can only lead to
judgment, not to improvement.

OXYJENNC O N S U L T I N G
Waiting time results
70
35
0
10
20
30
40
50
60
70
80
Avg
Before
Change
Avg After
Change
Wa
it T
ime
(m
in.)

OXYJENNC O N S U L T I N G
Waiting time results0
10
20304050
607080
90100
date Jan
Feb
Mar Apr
May Jun
Jul
Aug
Sep
Oct
Nov Dec
Change
Made
Cycl
e Ti
me
(min
.)
010
20304050
607080
90100
dat
e
Jan
Feb
Mar
Ap
r
May
Jun
Jul
Au
g
Sep Oct
No
v
Dec
Change
Made
Cyc
le T
ime
(min
.)
Unit 1
Unit 3
010
20304050
607080
90100
dat
e
Jan
Feb
Mar
Ap
r
May Jun
Jul
Au
g
Sep Oct
No
v
Dec
Change
MadeCyc
le T
ime
(min
.)
Unit 270
35
0
10
20
30
40
50
60
70
80
Avg
Before
Change
Avg After
Change
Wa
it T
ime
(m
in.)

OXYJENNC O N S U L T I N G
Why Time Is Important for Measurement
Aggregate measures alone do not lead to predictions about future performance or insights to explain past variations
Displaying data over time allows us to make informed predictions, and thus manage effectively
© Richard Scoville & I.H.I.

OXYJENNC O N S U L T I N G
Enumerative Dynamic

OXYJENNC O N S U L T I N G
Protocol
introduced
Pre op
briefingsLetter
from
Clinical
Director
Pharmacy
included
% surgical patients receiving Prophylactic Antibiotics
0
10
20
30
40
50
60
70
80
90
100
Ap
r-07
Ma
y-0
7
Jun-0
7
Ju
l-07
Au
g-0
7
Sep-0
7
Oct-
07
No
v-0
7
De
c-0
7
Ja
n-0
8
Feb
-08
Ma
r-08
Ap
r-08
Ma
y-0
8
% r
eco
nciled
Run Chart

OXYJENNC O N S U L T I N G
Model for Improvement
Set AIMS that are measurable, time-specific, and apply to a defined population
Establish MEASURES to determine if a specific change leads to improvement
Select INTERVENTIONS most likely to result in improvement
TEST the changes

OXYJENNC O N S U L T I N G

OXYJENNC O N S U L T I N G
Questions and
Discussion

OXYJENNC O N S U L T I N G
Mark Jennings
+44 (0)777 1996410