the hawaii ocean time-series (()hot): highlights and ... · the hawaii ocean time-seri(hot)ies...
TRANSCRIPT
The Hawaii Ocean Time-series (HOT): ( )Highlights and perspectives from two
decades of ocean observations
M A T T H E W C H U R C HU N I V E R S I T Y O F H A W A I I
O C B S C O P I N G W O R K S H O PS E P T E M B E R 2 0 1 0

A Dedicated HOT Team
NSFNSFNSFNSF

What’s HOT?
Program objectives:
Quantify time-dependent variability in key physical, biogeochemical and ecological properties and processesbiogeochemical, and ecological properties and processes
Define relationships between plankton community structure and biogeochemical dynamicsstructure and biogeochemical dynamics
Quantify physical and biological processes controlling i b k f i d ioceanic carbon uptake, transformation, and sequestration

The Hawaii Ocean Ti i (HOT)Time-series (HOT)
Near monthly cruises to
Station ALOHA since
October 1988
Deep ocean (~4800 m)
observatory
Shipboard and remote Shipboard and remote
measurements of ocean
biogeochemistry, physics,
and plankton ecology
4-day cruises, intensive
sampling to 1000 m

Time, water, and change
The value of HOT observations continues to increase with timecontinues to increase with time.
HOT provides some of the best and only records of
ALOHA
and only records of biogeochemical and physical variability in the open ocean waters of the Pacific across multiple time scales: episodic, seasonal, interannual, and multi-decadal.
Knowledge gained from HOT furthers our understanding of global-scale ocean change.g g

Ongoing projects supported by HOT: If you build it they will comeIf you build it, they will come…
Ocean Carbon System Variability, NSF; A. Dickson (P.I.), 1988-present WHOI Hawaii Ocean Time Series Station (WHOTS), NOAA-NSF; R. Weller WHOI Hawaii Ocean Time Series Station (WHOTS), NOAA NSF; R. Weller
(P.I.), 2004-present CFC and SF6 Water Mass Tracers, NOAA; J. Bullister (P.I.), 2004-present Microbial Oceanography: Genomes to Biomes – Summer training course,
NSF-Agouron Institute-Gordon and Betty Moore Foundation; D. Karl (P.I.), 2006-presentpresent
Marine Microbiology Initiative, Gordon and Betty Moore Foundation; D. Karl (P.I.), 2005-present
Center for Microbial Oceanography: Research and Education (C-MORE) NSF; D Karl (P I ) 2006-present(C-MORE), NSF; D. Karl (P.I.), 2006 present
Si Cycling and Dynamics, NSF; M. Brzezinski (P.I.), 2007-present ALOHA Cabled Observatory, NSF; B. Howe (P.I.), 2007-present Diazotrophy in a High CO2 World, NSF; M. Church (P.I.),2009-present Profiling Floats for Ocean Biogeochemistry NSF-NOPP; K Johnson 2007- Profiling Floats for Ocean Biogeochemistry, NSF NOPP; K. Johnson, 2007
present Subsurface Moored Profiler, NSF; M. Alford (P.I.), 2009-present Taxon-specific Variability of Organic Matter Production and
Remineralization, NSF; A. White (P.I.), 2009-present Primary Productivity as a Function of Absorption, Pigment-based
Phytoplankton Diversity, and Particle Size Distributions, NASA; A. White (P.I.), 2009-present

From the Predictable to the Unexpected:Highlights on 3 interlinked themes in ocean biogeochemistry
Ocean carbon cycling
Plankton productivity and the importance of community structure
New production and export
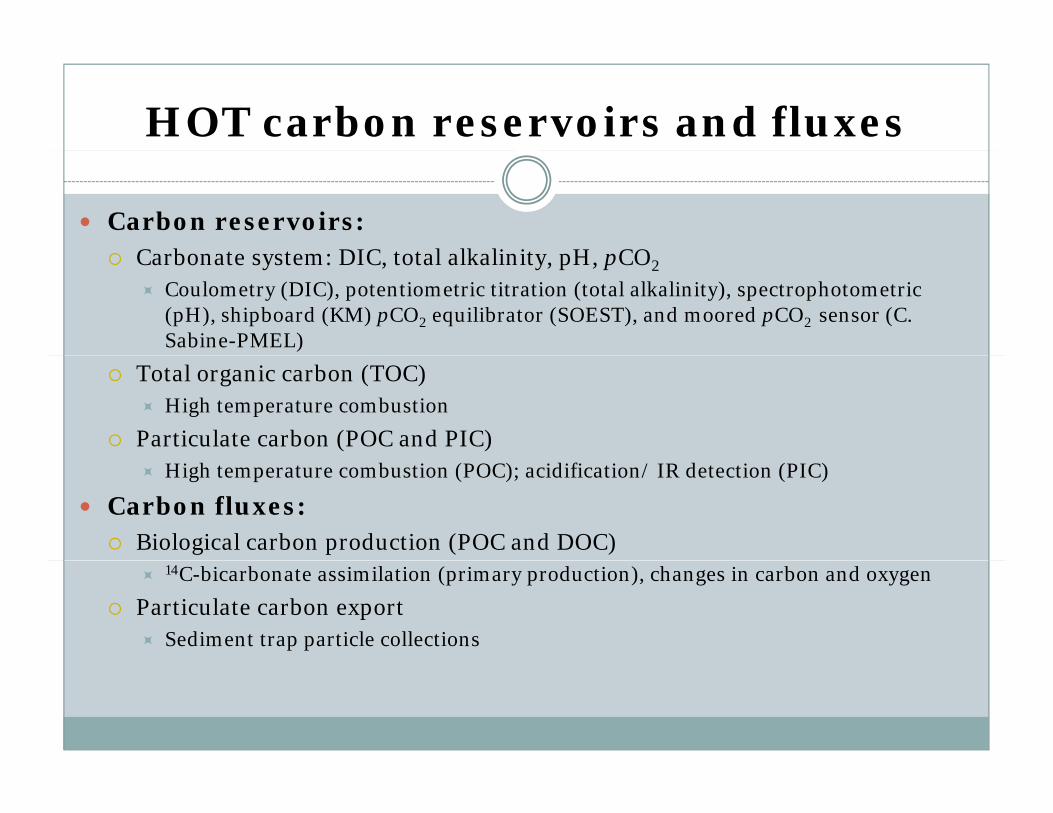
HOT carbon reservoirs and fluxes
Carbon reservoirs: C b t t DIC t t l lk li it H CO Carbonate system: DIC, total alkalinity, pH, pCO2
Coulometry (DIC), potentiometric titration (total alkalinity), spectrophotometric (pH), shipboard (KM) pCO2 equilibrator (SOEST), and moored pCO2 sensor (C. Sabine-PMEL)
Total organic carbon (TOC) High temperature combustion
Particulate carbon (POC and PIC) High temperature combustion (POC); acidification/ IR detection (PIC)
Carbon fluxes: Biological carbon production (POC and DOC)
14C-bicarbonate assimilation (primary production), changes in carbon and oxygen
Particulate carbon export Sediment trap particle collections

Air trend: +1.70 atm yr-1
Rising COCO2,
Falling pHOcean trend:+1.92 atm yr-1
pH trend -0.0018 yr-1
Dore et al. (2009)
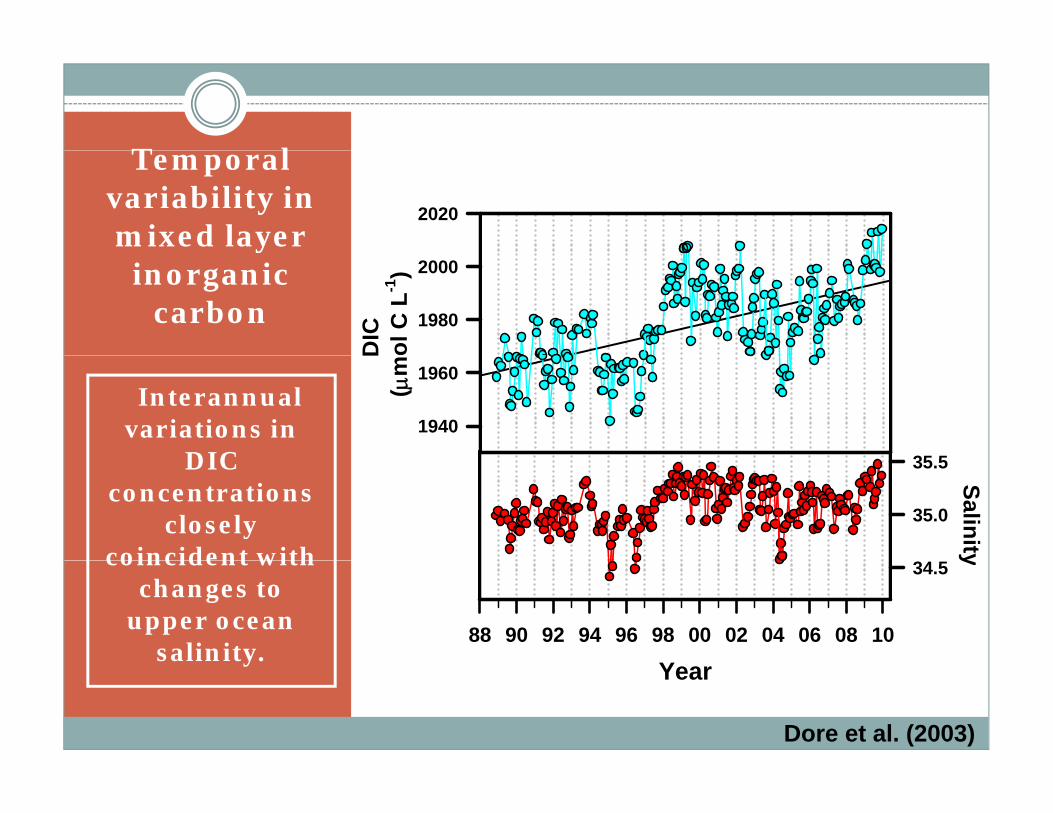
T l Temporal variability in mixed layer
2020y
inorganic carbon
DIC
ol
C L
-1)
1980
2000
Interannual variations in
DIC
D(
m1940
1960
35 5DIC concentrations
closely coincident with
Salinity
35.0
35.5
coincident with changes to
upper ocean salinity.
Y88 90 92 94 96 98 00 02 04 06 08 10
y
34.5
yYear
Dore et al. (2003)

Interannual Interannual variability
in inorganic b lcarbon pools
Annual accumulation (0-150 m) of nDIC ~ 0.1 mol C m-2 yr-1
Interannual variations in the E-P balance and E P balance and mixing important controls on carbon inventories
Winn et al. 1994, Dore et al. 2003, 2009
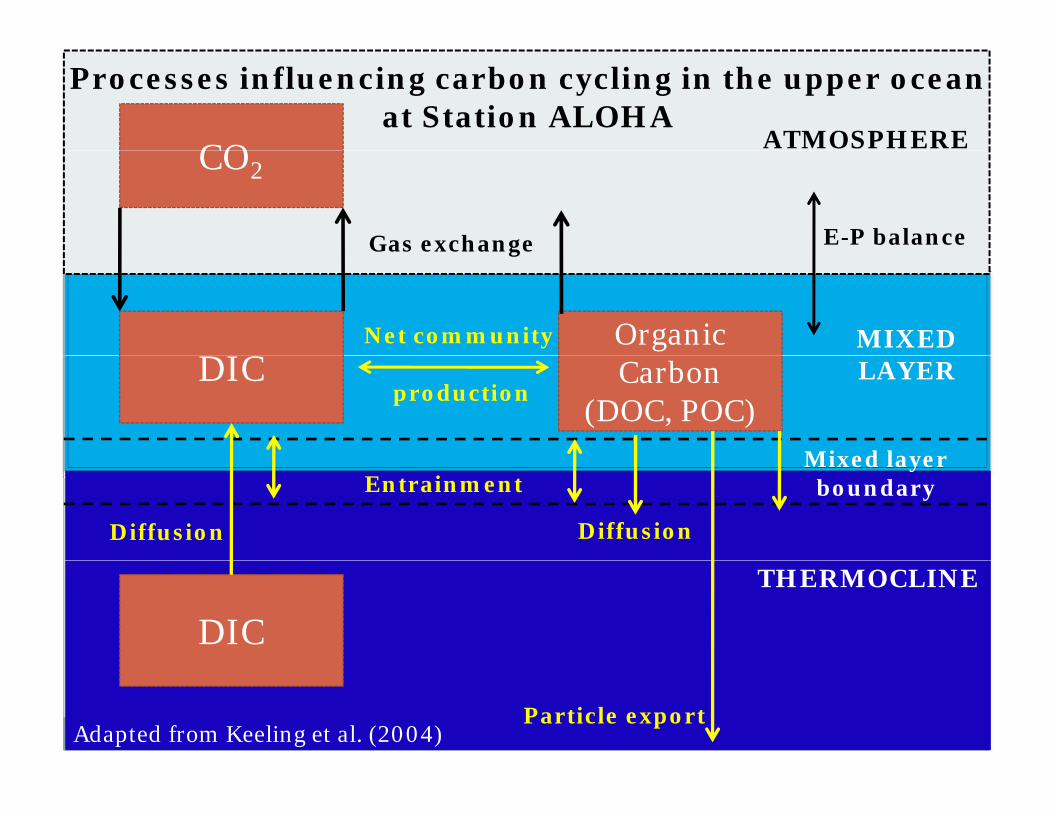
ATMOSPHERECO
Processes influencing carbon cycling in the upper ocean at Station ALOHA
CO2
Gas exchange E-P balance
Net community MIXED DIC
Organic
g
productionLAYER
Mixed layer
DIC Carbon(DOC, POC)
Mixed layer boundary
Diffusion
Entrainment
Diffusion
THERMOCLINE
DIC
Particle exportAdapted from Keeling et al. (2004)

PhotosynthesisWhat is the biological contribution to ocean carbon flux at ALOHA?
+ O + O2, - CO2
RespirationRespiration
-O2 , + CO2

PAR ( l t -2 -1) 14
The upper ocean habitat
PAR (mol quanta m-2 s-1)100 101 102 103
0 0
14C-PP (mol C L-1 d-1)0.0 0.1 0.2 0.3 0.4 0.5 0.6
14C-PP
50 MLD 50
14C-PPPAR
epth
(m)
100 1001%
De
150 150 0.1%Chl a
N+N
200
0 1 2 3 4 5 0 0 0 2 0 4 0 6 0 8
200
Nitrate + Nitrite (mol N L-1)0 1 2 3 4 5
Chlorophyll a (g L-1)
0.0 0.2 0.4 0.6 0.8
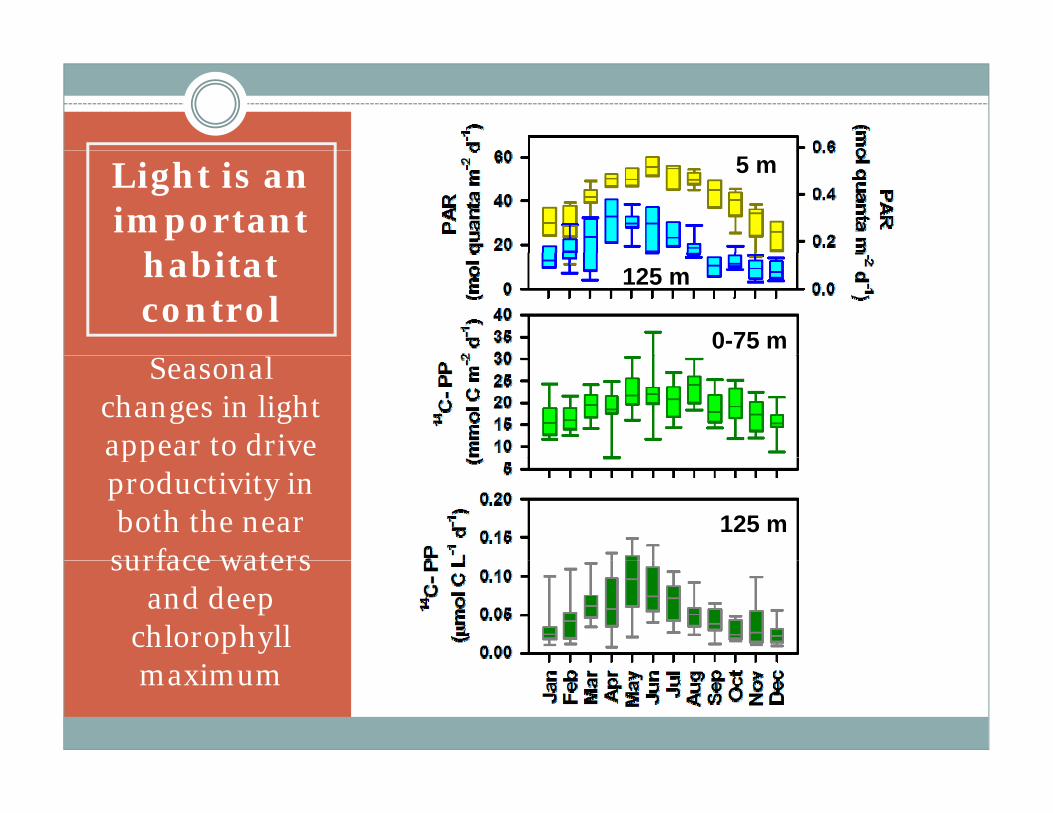
Light is an important
h bi
5 m
habitat control
l
125 m
0-75 mSeasonal
changes in light appear to drive ppproductivity in both the near surface waters
125 msurface waters
and deep chlorophyll
imaximum

08)
vina
et a
l. (2
00
-2) 30
35Boyce et al. (2010)Po
lov
HOT Chl a increasing 0.22 mg m-2 yr-1
Chl
a (m
g m
-
10152025 observations
indicate both chlorophyll and
primary
14C-PP (80
100
C
510 primary
production are increasing. Prominent i
14C-PP increasing 0.33 mmol C m-2 yr-10-125 m
(mm
ol C m
-2
20
40
60increases occurring below the depth of
Year89 91 93 95 97 99 01 03 05 07 09
d-1)
20 depth of satellite
detection.Corno et al. (2007), Saba et al. (2010), Luo et al.

Material transfer through the food web
y w
eigh
t
2.5
3.0
plan
kton
dry
(g m
-2)
1.5
2.0
Mes
ozoo
p
0.5
1.0
Year94 95 97 99 01 03 05 07 09
0.0
Zooplankton dry weight (0-150 m) increasing at 37 mg m-2 per year
Sheridan and Landry (2004)

Measurements and models of primary production at Station ALOHAp
Carbon production 14C-bicarbonate assimilation (daylight
incubation period ~12 hours) DIC, TOC, and PC variability
Oxygen production In vitro O2 bottle incubations
I it O d i lid fl t In situ O2 dynamics: gliders, floats, moorings, and ships
18O2 production from H218O
16O, 17O, 18O Triple O2 isotopes
Bio-optics and satellites Bio optical approaches Bio-optical approaches Satellite remote sensing

In vitro O GPP, NCP, and RIn vitro O2dynamics at
Station ALOHA
, ,(mol O2 L
-1 d-1)
-0.4 -0.2 0.0 0.2 0.4 0.6 0.8 1.00
4 years of measurements (2001, 2005-2007)
N t C it pth
(m)
25
50
75
GPPR
Net Community Production:-4.2 to -7.4 mol C m-2 yr-1
Gross Primary
Dep 100
125
150
NCP
Gross Primary Production: 11.9-14.0 mol C m-2 yr-1
Respiration: 17-21 mol , NC
Pm
-2 d
-1)
0
50
100
p 7C m-2 yr-1
Conclusion: Net heterotrophy due to
GPP
, R,
(mm
ol O
2
-100
-50
0
incubation conditions and/or under sampling
e.g. Williams et al. (2004)
Day of year100 200 300

Mixed layer O2 is in equilibrium with the atmosphereatmosphere
Rate of subsurface O2Rate of subsurface O2accumulation provides information on NCP

In situ OIn situ O2dynamics at
Station ALOHAALOHA
6 f i i
75 m
>6+ years of in situ measurements (2003-05, 2008-present) p )
Net Community Production: 1.1-1.7 mol C m-2 yr-1mol C m yr
Riser and Johnson (2008)

Net Community Production at Station ALOHA
MethodRate
mol C m-2 yr-1Period of
measurements ReferencesMixed Layer O A b d
1.4 - 3.7 (± 1.0) 1992–2008 Emerson et al. (1997); Hamme and Emerson O2 + Ar budgets Hamme and Emerson (2006); Juanek and Quay (2005); Quay et al. (2010)
DIC + DI13C budgets 2.7 - 2.8 (± 1.4) 1988–2002 Quay and Stutsman (2003); Keeling et al (2004)Keeling et al. (2004)
Mooring O2 4.1 (± 1.8) 2005 Emerson et al. (2008)
Sub-mixed layer float profiles
1.1 - 1.7 (±0.2) 2003-2010 Riser and Johnson (2008)p
Sub-mixed layer glider surveys
0.9 (± 0.1) 2005 Nicholson et al. (2008)
Sediment traps 0.9 (± 0.3) 1989–2009 HOT core data
In vitro O2incubations
-6.1 (± 4.6) 2001, 2005-2007 Williams et al. (2004)
NCP appears constrained to ~2 fold variabilityNCP appears constrained to ~2-fold variabilityGPP estimated ~20-fold greater than NCP

What controls variability innutrient supply supporting
N2 fixation
net community production?
Organic matterNH4
+
2
NH4+Organic
matter
OO NO2-NO3
-
NO3- NH4
+NO2-
Organic matter
603 5
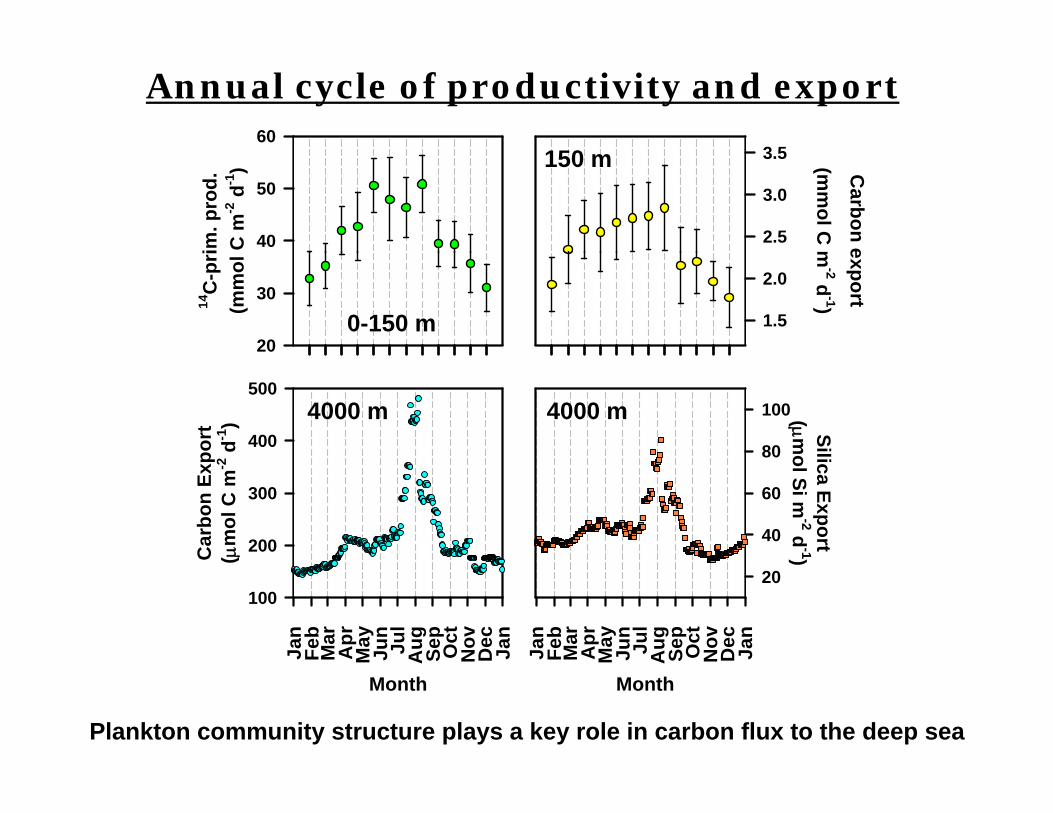
Annual cycle of productivity and export
150
im. p
rod.
C m
-2 d
-1)
40
50C
arbon e(m
mol C
m2.5
3.0
3.5150 m14
C-p
ri(m
mol
20
30
exportm
-2 d-1)
1.5
2.0
0-150 m
port
d-1
)
400
500
Sil( m
o80
1004000 m 4000 m
Car
bon
Exp
( m
ol C
m-2
200
300
ica Exportol Si m
-2 d-1)
40
60
Jan
Fe
b
Mar
A
pr
May
Ju
n
Jul
Aug
Se
p
Oct
N
ov
Dec
Ja
n
(
100
Jan
Fe
b
Mar
A
pr
May
Ju
n
Jul
Aug
Se
p
Oct
N
ov
Dec
Ja
n
)
20
Month
A
MonthA
Plankton community structure plays a key role in carbon flux to the deep sea

Controls on nitrogen supply t th to the upper ocean
Physical: Mixing, upwelling, diffusion, advection
NO3- supported new production
Bi l i lBiological: N2 fixation (N2 → NH3)
N supported new production N2 supported new production
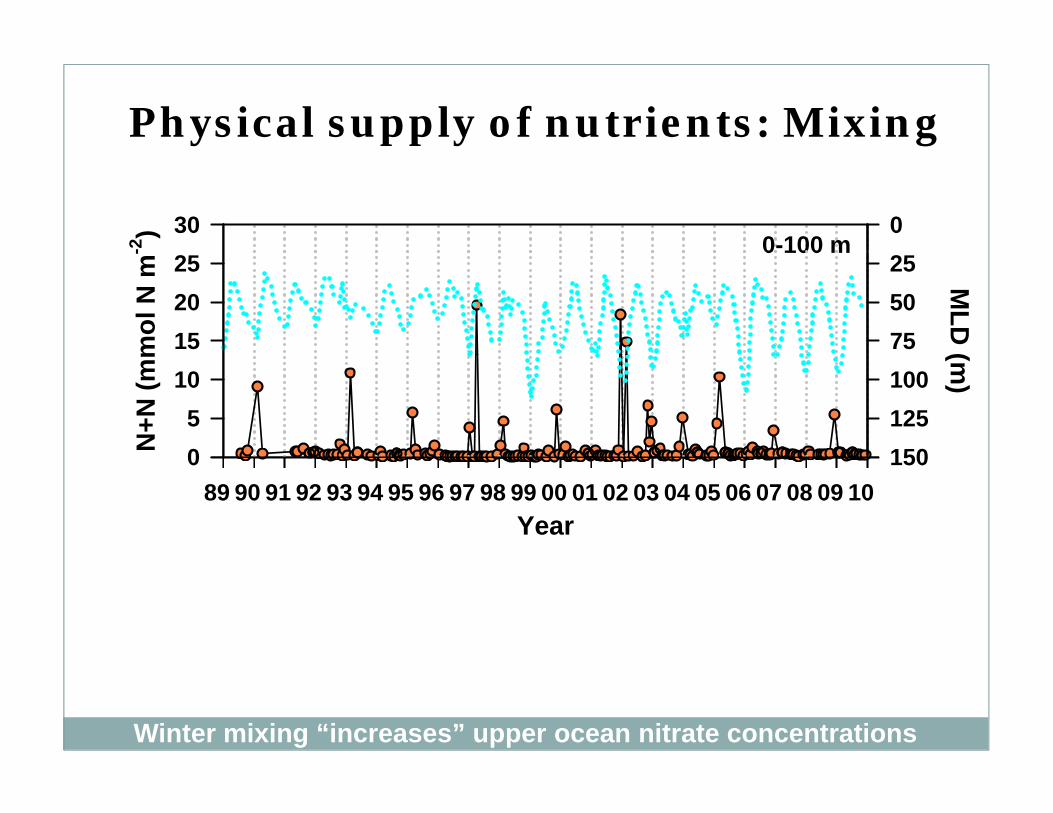
Physical supply of nutrients: Mixing-2
) 30 00-100 m
mol
N m
-
152025 M
LD (
255075
0 00
N+N
(mm
05
10
(m)100
125150
Year89 90 91 92 93 94 95 96 97 98 99 00 01 02 03 04 05 06 07 08 09 10
0 150
Winter mixing “increases” upper ocean nitrate concentrations

Mesoscale variability at Station ALOHA
202475
24.6 kg m-3
SSHa (0
10
ratu
re (o C
)
22
pth
(m)
100
125
150(cm)
-20
-10
Tem
per
18
20
140 m
Dep 150
175
200 Y = 2.2 + 136, R2 = 0.47
SSHa (cm)1/05 1/06 1/07
SSHa (cm)-20 -10 0 10 20
,
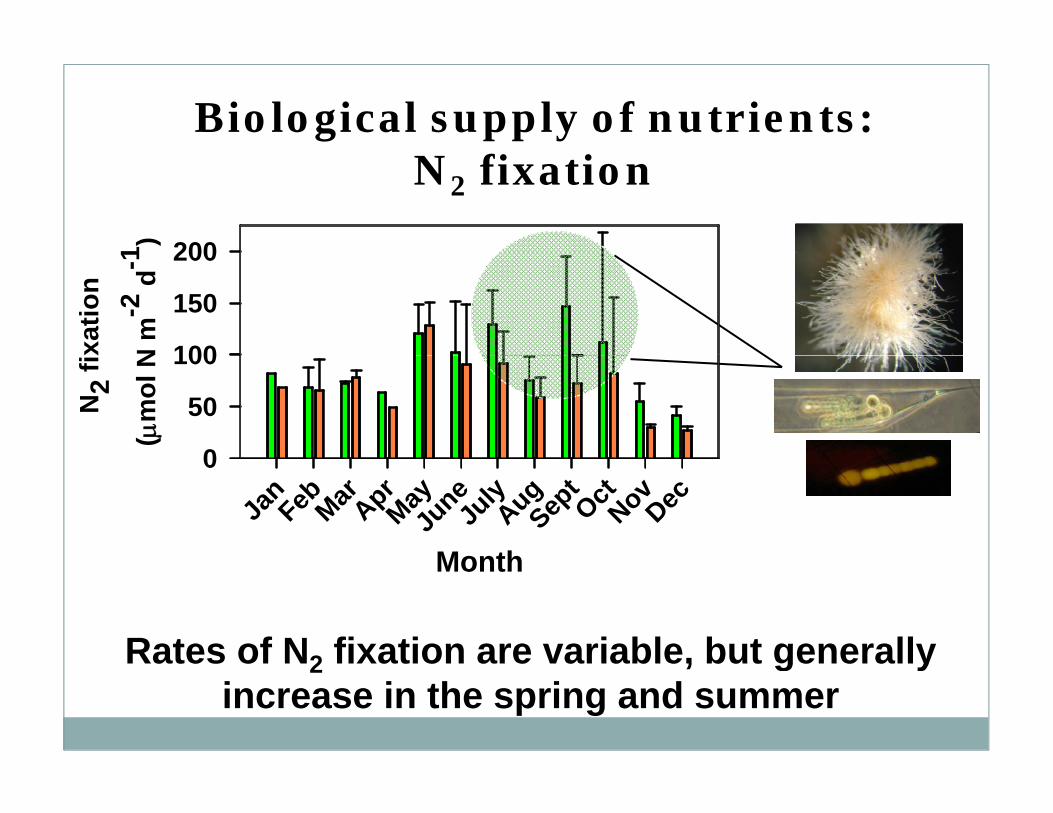
Biological supply of nutrients: 1 ) 200
N2 fixation
xatio
n
N m
-2 d
-1
100
150
200
N2
fix
( m
ol N
0
50
100
Month
Jan
FebMar AprMayJu
neJu
lyAugSep
tOctNovDec
0
Month
Rates of N2 fixation are variable, but generallyRates of N2 fixation are variable, but generally increase in the spring and summer
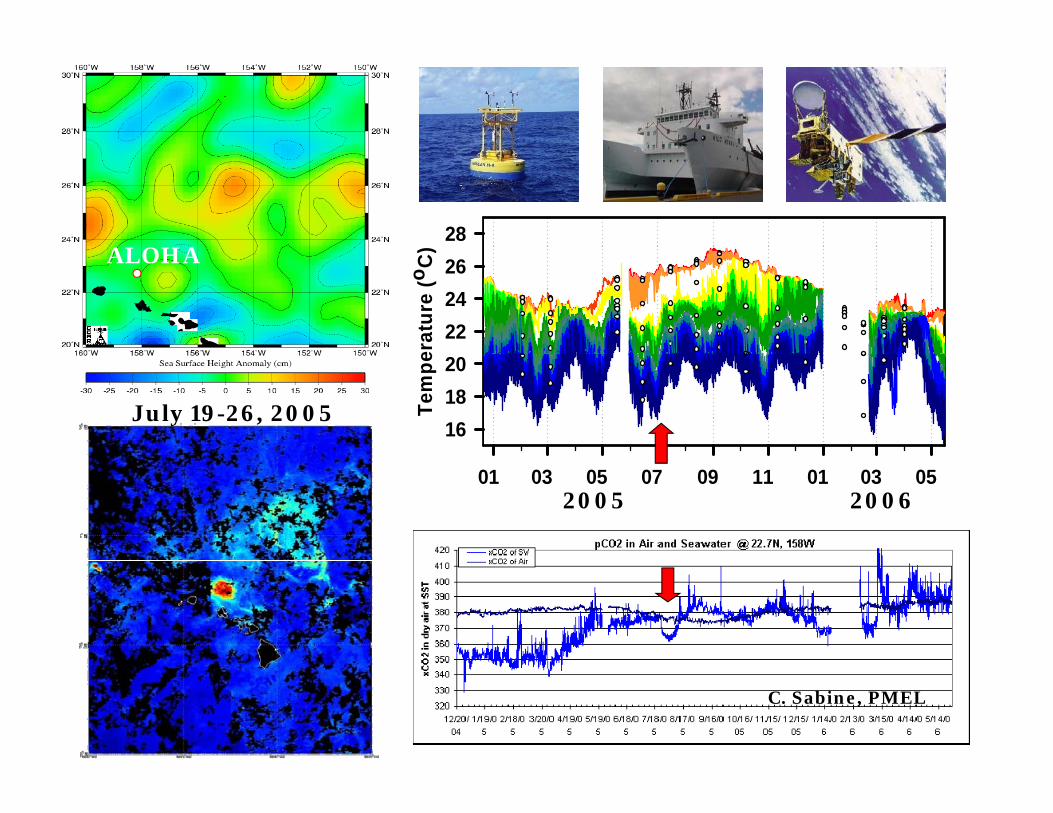
) 28ALOHA
erat
ure
(oC
222426ALOHA
Tem
pe161820
July 19-26, 2005
01 03 05 07 09 11 01 03 05 2005 2006
ALOHA
C. Sabine, PMEL

July 2005April 2005January 2005
J l 20050
July 2005
(m)
50
“typical profile”
Dep
th (
100
150 p150
200
Chloropigment (g L-1)
0.0 0.2 0.4 0.6 0.8 1.0
Fong et al. (2007)
C)
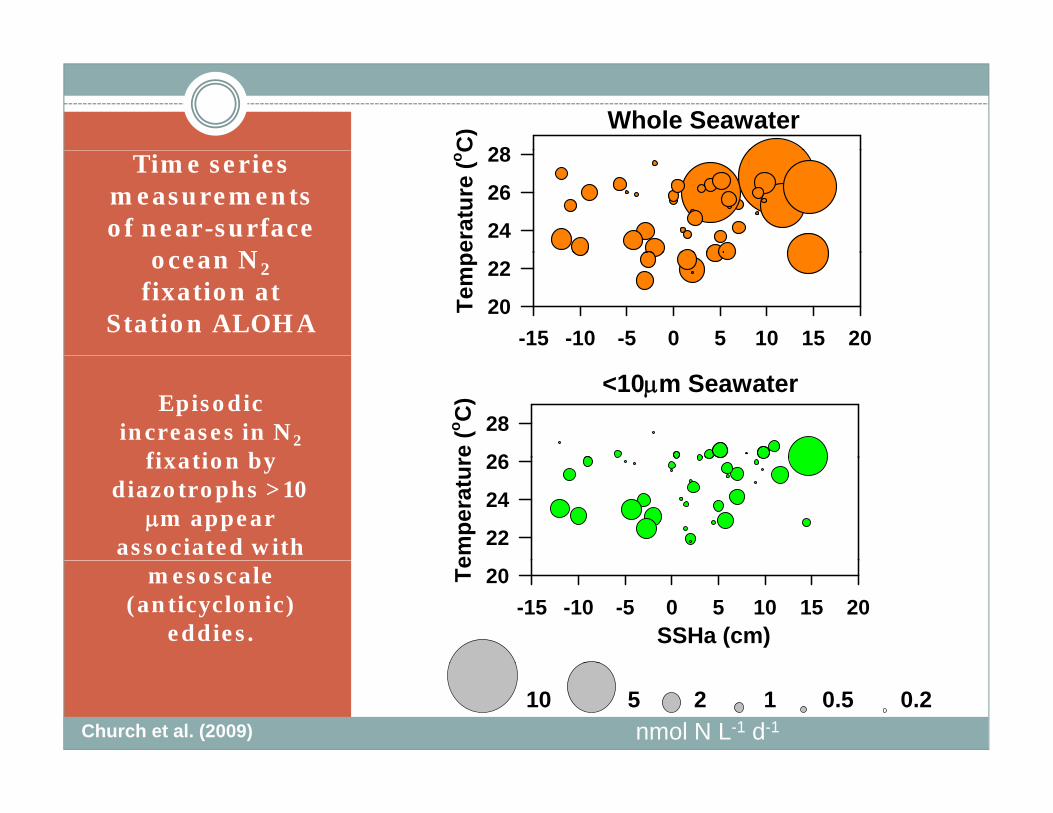
28Whole Seawater
Time series measurements of near-surface
N erat
ure
(o C
24
26
28
ocean N2fixation at
Station ALOHA -15 -10 -5 0 5 10 15 20
Tem
p
20
22
Episodic increases in N2
fixation by re (o C
)26
28
<10m Seawater
fixation by diazotrophs >10
m appear associated with em
pera
tur
22
24
26
mesoscale (anticyclonic)
eddies. SSHa (cm)-15 -10 -5 0 5 10 15 20
Te 20
0.20.512510nmol N L-1 d-1Church et al. (2009)

N2 fixation based new production
NO3- based new
production
1
2
3
1
NO3-, PO4
3-, Si, CO2
1
22
NO3-, PO4
3-, Si, CO2
Both appear to support new production, but for different reasons

HOT insights
Biological and physical processes interact to control time-variability in ocean carbon inventories and fluxes.
The complexity of ocean ecosystem change demands The complexity of ocean ecosystem change demands interdisciplinary studies.
i di d d b HOT measurements indicate we need to study carbon cycle processes at a range of scales, from decadal to seasonal to episodic.
The value of HOT continues to increase with time.

Facing Future
The complexity of ecosystem dynamics, even in this “stable” ecosystem, demands sustained observations.
The shipboard time series program continues to enrich The shipboard time series program continues to enrich our understanding of the NPSG, and help direct application of remote and autonomous sensing technologiestechnologies.
These multi-decadal time series programs are some of our best (and only) barometers of ocean ecosystem change.