the guessing game
DESCRIPTION
The Guessing Game. The entire business of Statistics is dedicated to the purpose of trying to guess the value of some population parameter. In what follows the population parameter (the target parameter ) will be either a mean or a proportion p . - PowerPoint PPT PresentationTRANSCRIPT
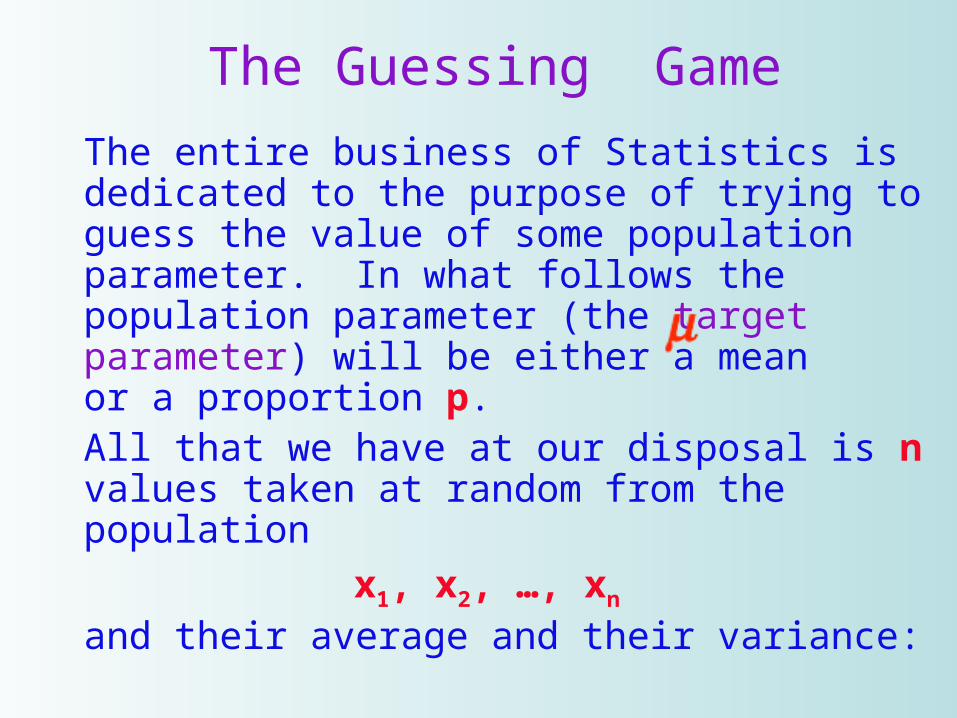
The Guessing GameThe entire business of Statistics is dedicated to the purpose of trying to guess the value of some population parameter. In what follows the population parameter (the target parameter) will be either a mean or a proportion p.All that we have at our disposal is n values taken at random from the population
x1, x2, …, xn
and their average and their variance:
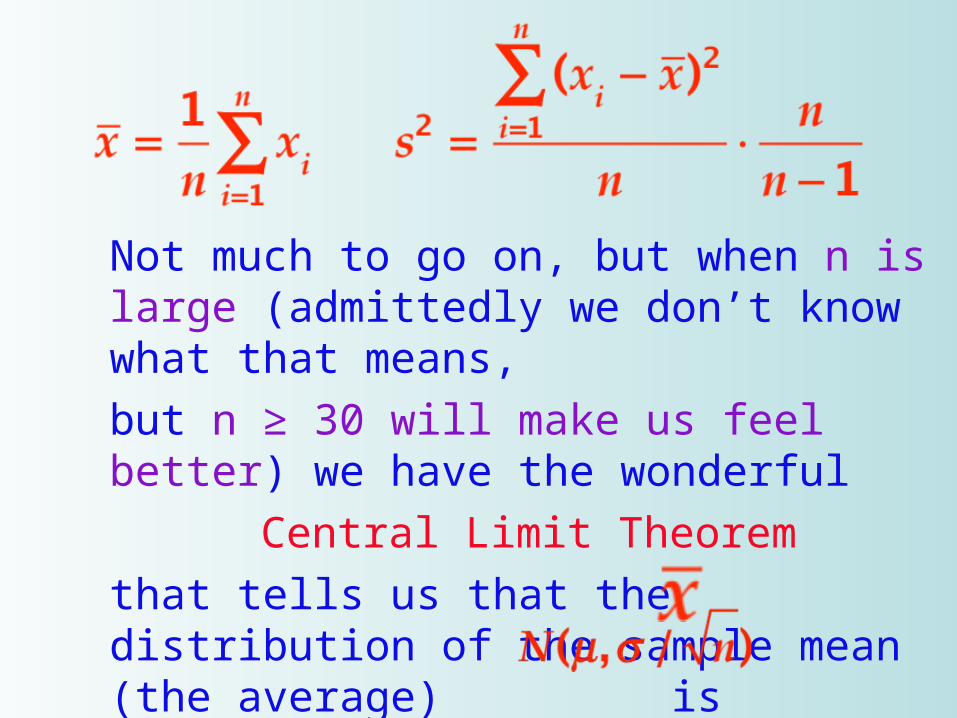
Not much to go on, but when n is large (admittedly we don’t know what that means,but n ≥ 30 will make us feel better) we have the wonderful
Central Limit Theoremthat tells us that the distribution of the sample mean (the average) is approximately normal
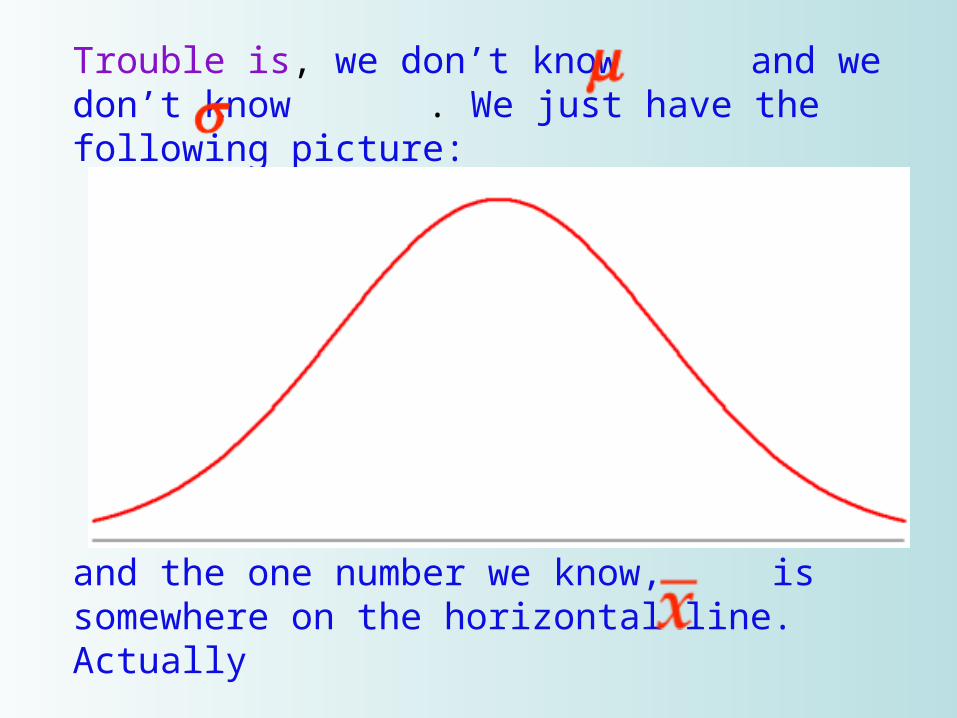
Trouble is, we don’t know and we don’t know . We just have the following picture:
and the one number we know, is somewhere on the horizontal line. Actually
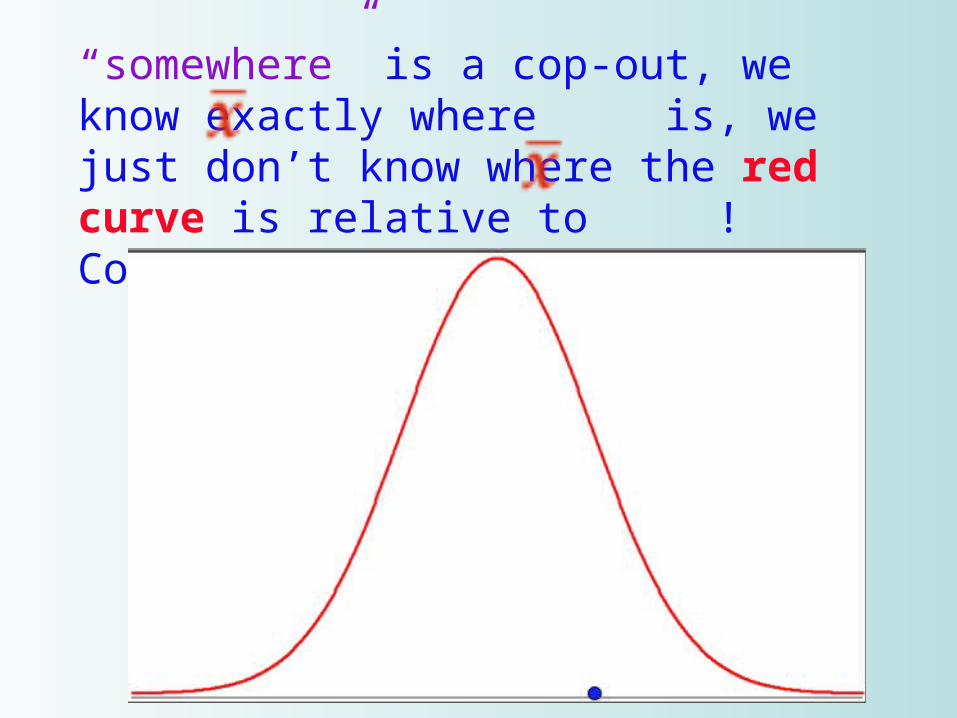
“somewhere” is a cop-out, we know exactly where is, we just don’t know where the red curve is relative to ! Could be like this
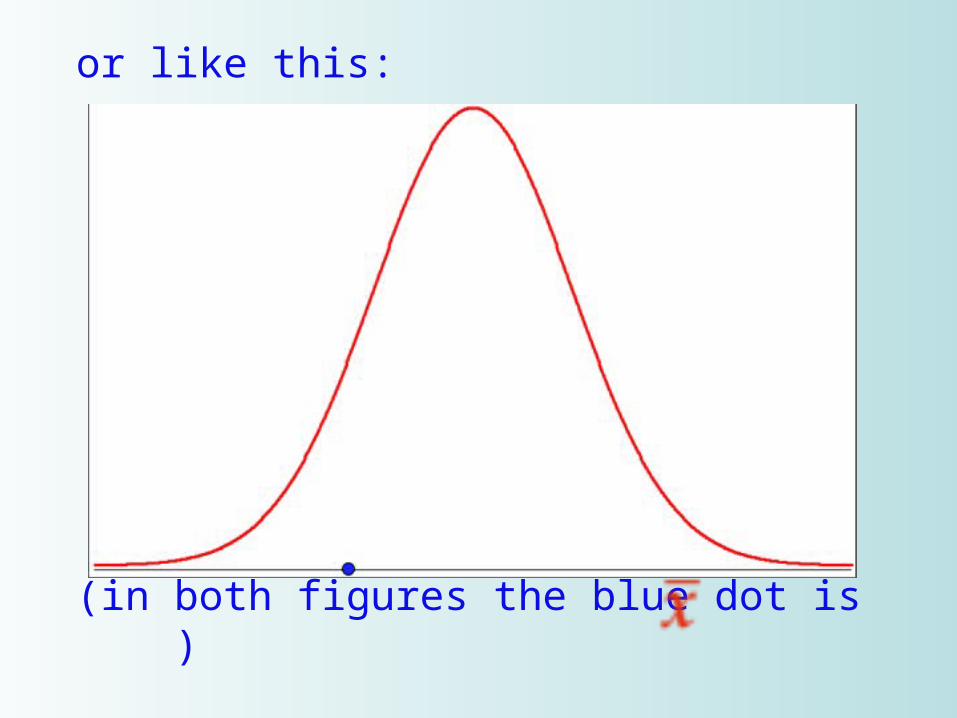
or like this:
(in both figures the blue dot is )
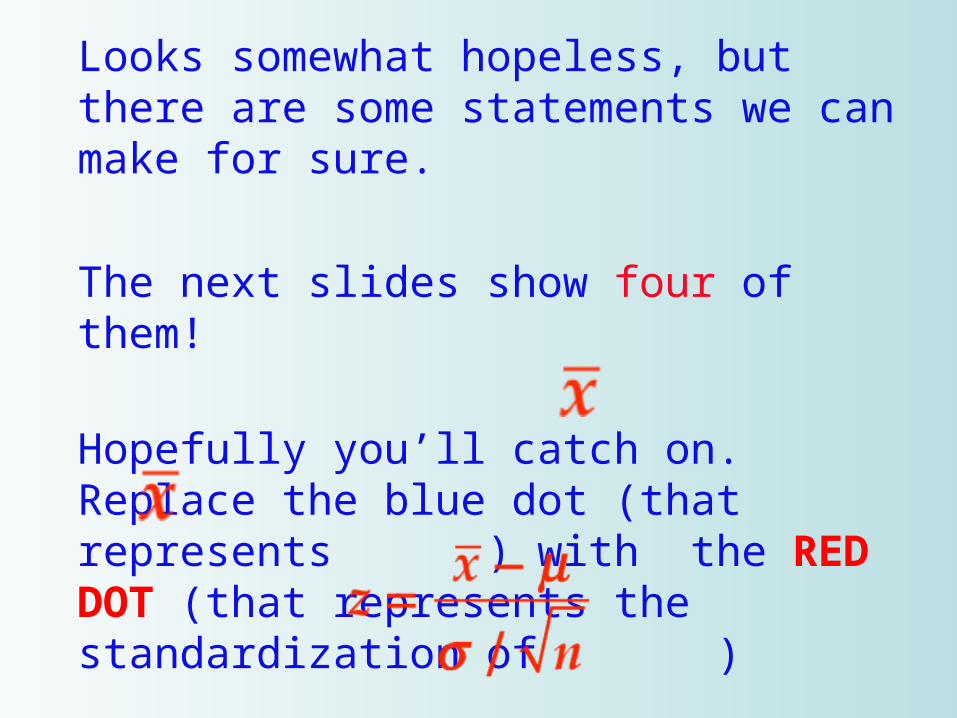
Looks somewhat hopeless, but there are some statements we can make for sure.
The next slides show four of them!
Hopefully you’ll catch on. Replace the blue dot (that represents ) with the RED DOT (that represents the standardization of )
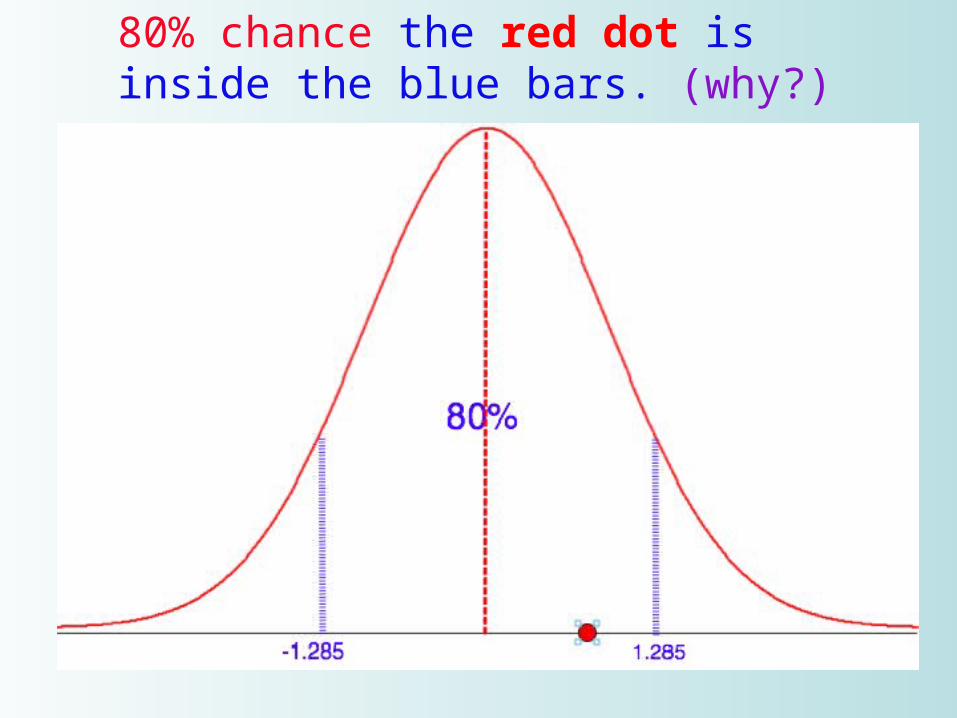
80% chance the red dot is inside the blue bars. (why?)
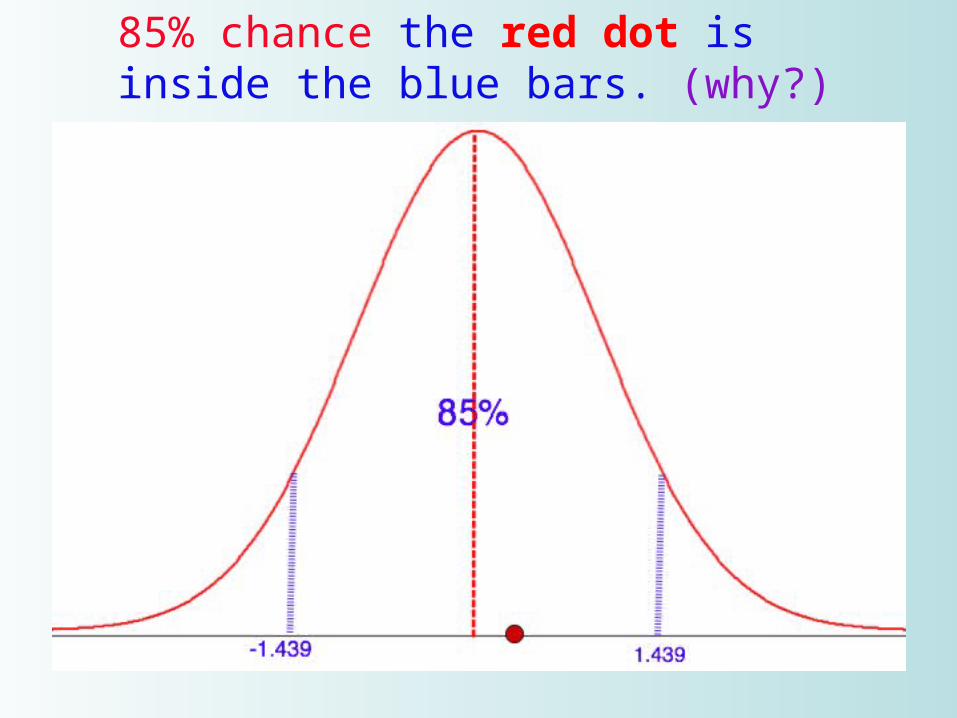
85% chance the red dot is inside the blue bars. (why?)
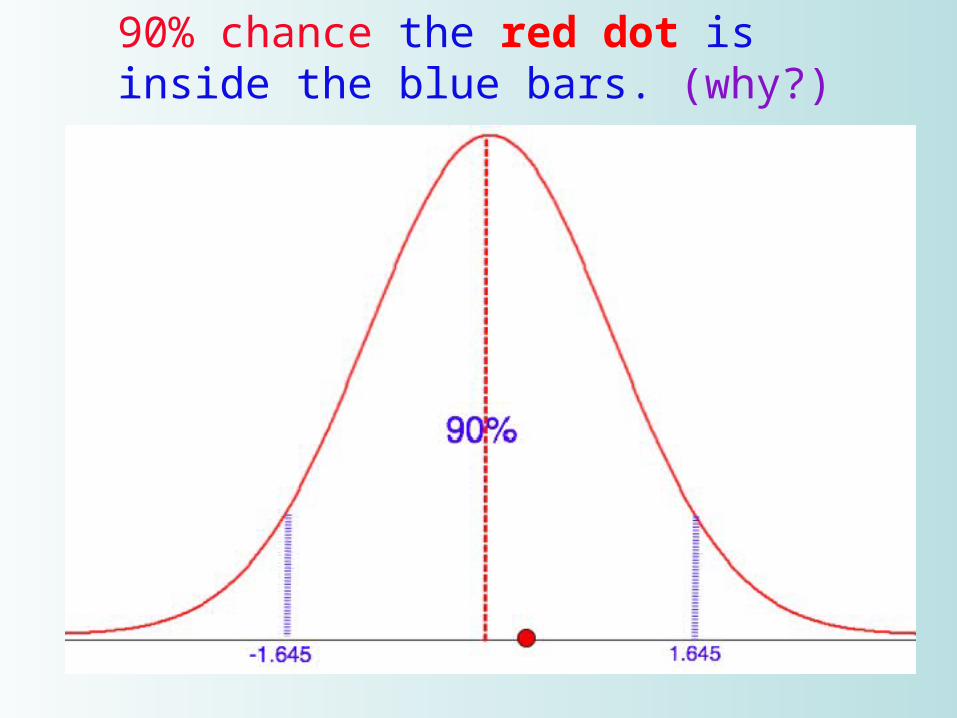
90% chance the red dot is inside the blue bars. (why?)
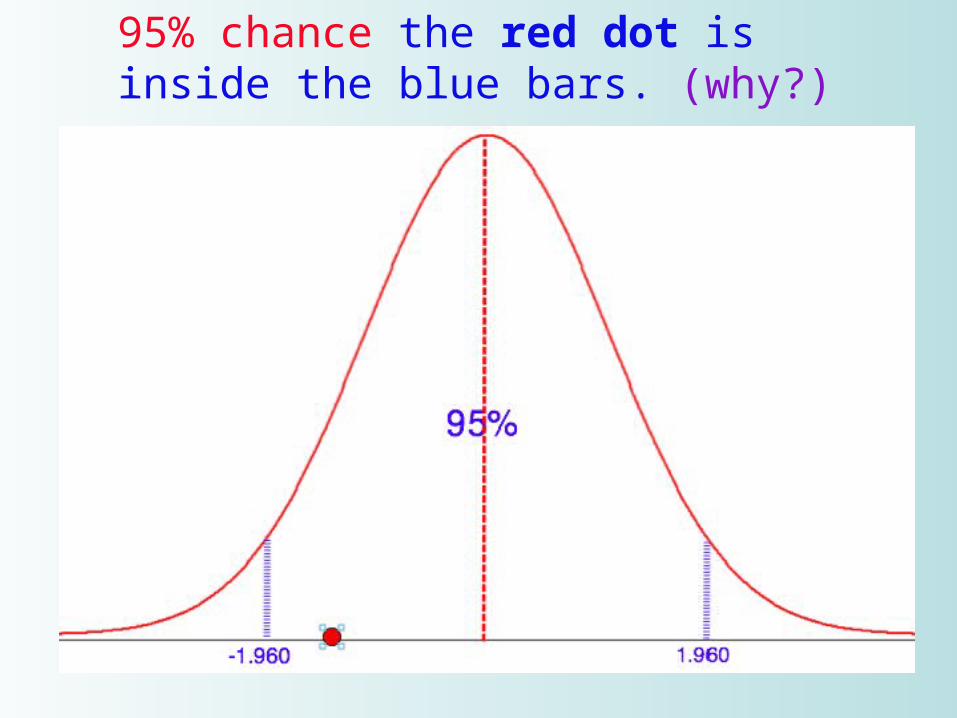
95% chance the red dot is inside the blue bars. (why?)
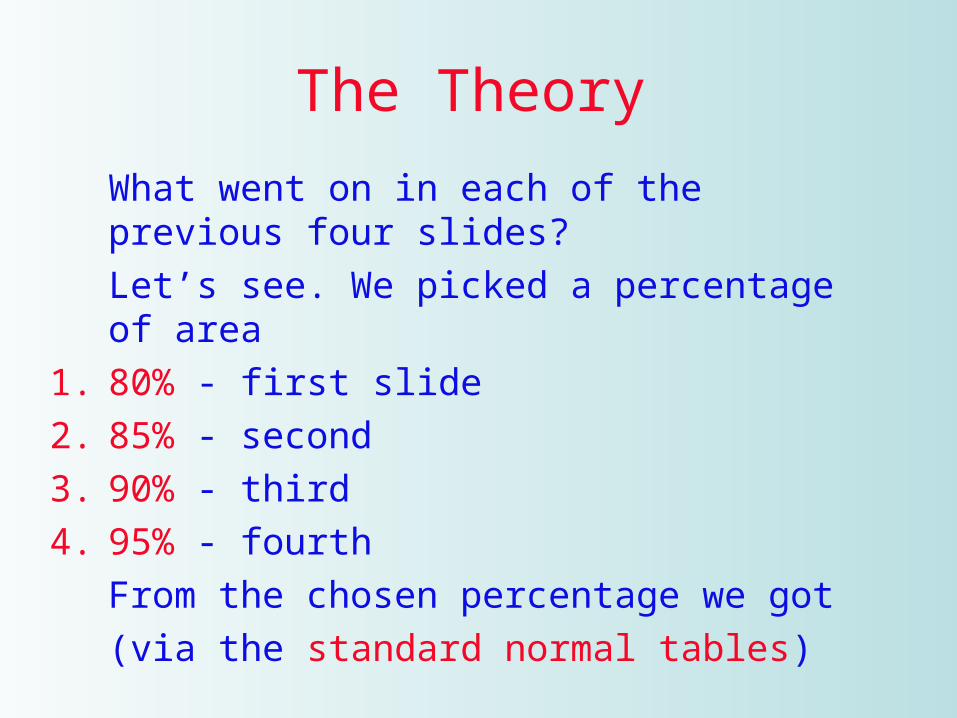
The TheoryWhat went on in each of the previous four slides?Let’s see. We picked a percentage of area
1. 80% - first slide2. 85% - second3. 90% - third4. 95% - fourth
From the chosen percentage we got(via the standard normal tables)
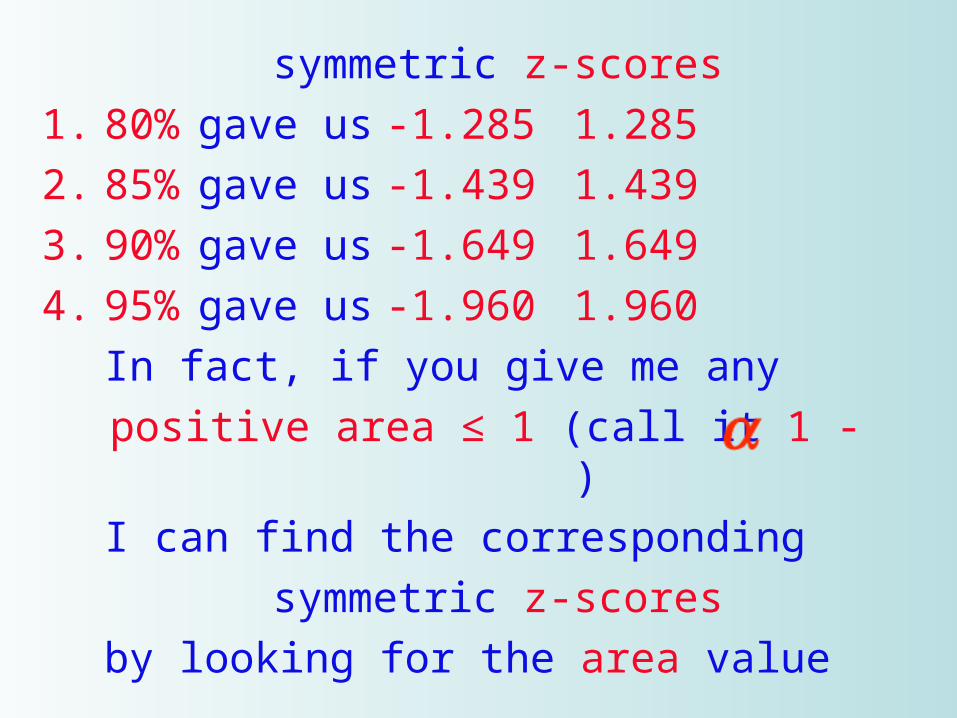
symmetric z-scores1. 80% gave us -1.285 1.2852. 85% gave us -1.439 1.4393. 90% gave us -1.649 1.6494. 95% gave us -1.960 1.960
In fact, if you give me any positive area ≤ 1 (call it 1 - )
I can find the corresponding symmetric z-scores
by looking for the area value
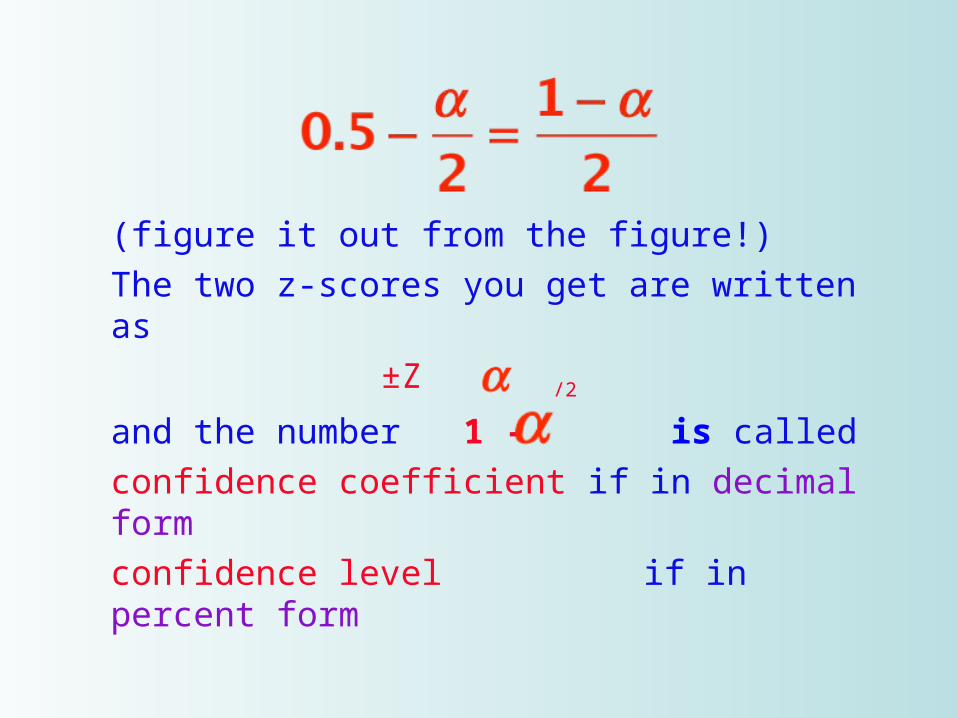
(figure it out from the figure!)The two z-scores you get are written as
±Z/2
and the number 1 - is calledconfidence coefficient if in decimal formconfidence level if in percent form
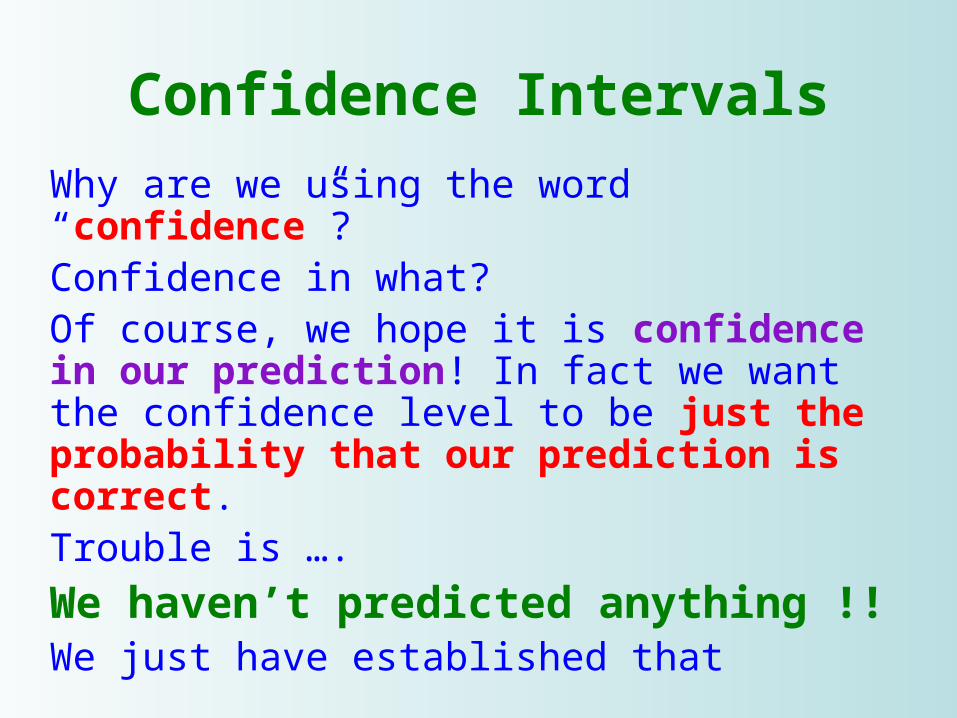
Confidence IntervalsWhy are we using the word “confidence”?Confidence in what? Of course, we hope it is confidence in our prediction! In fact we want the confidence level to be just the probability that our prediction is correct.Trouble is ….We haven’t predicted anything !!We just have established that
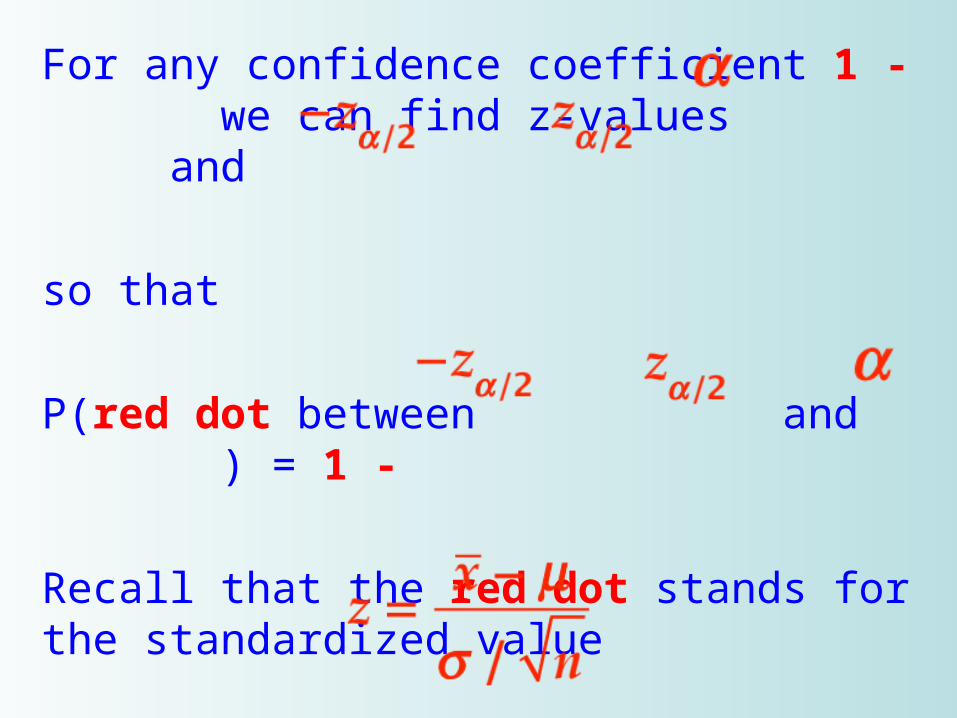
For any confidence coefficient 1 - we can find z-values and
so that
P(red dot between and ) = 1 -
Recall that the red dot stands for the standardized value
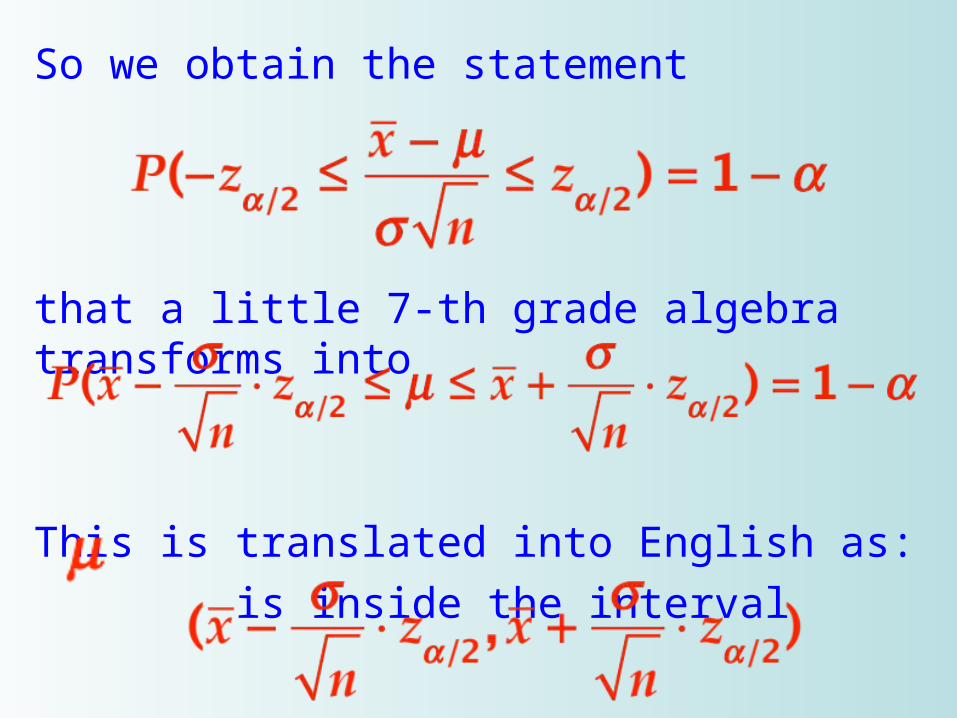
So we obtain the statement
that a little 7-th grade algebra transforms into
This is translated into English as: is inside the interval
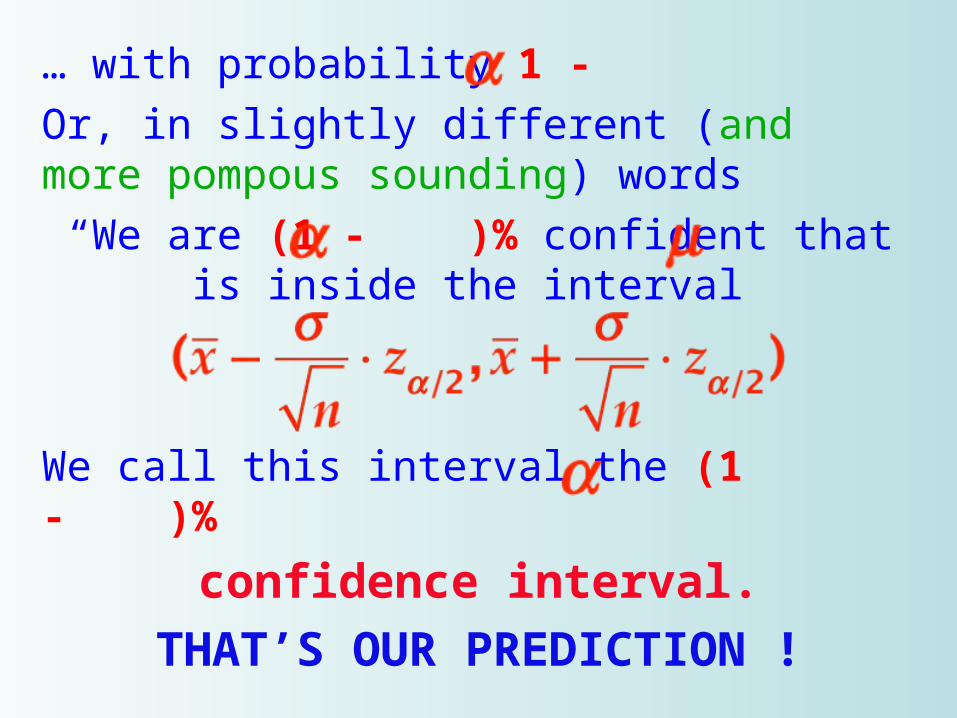
… with probability 1 - Or, in slightly different (and more pompous sounding) words “We are (1 - )% confident that is inside the interval
We call this interval the (1 - )% confidence interval.
THAT’S OUR PREDICTION !
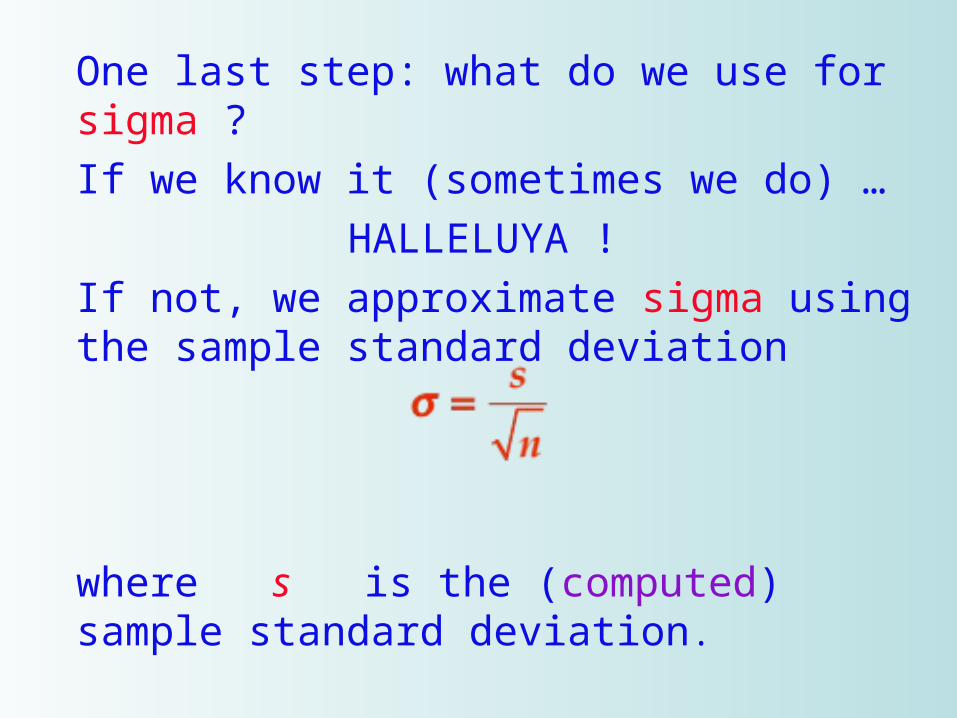
One last step: what do we use for sigma ?If we know it (sometimes we do) …
HALLELUYA !If not, we approximate sigma using the sample standard deviation
where s is the (computed) sample standard deviation.
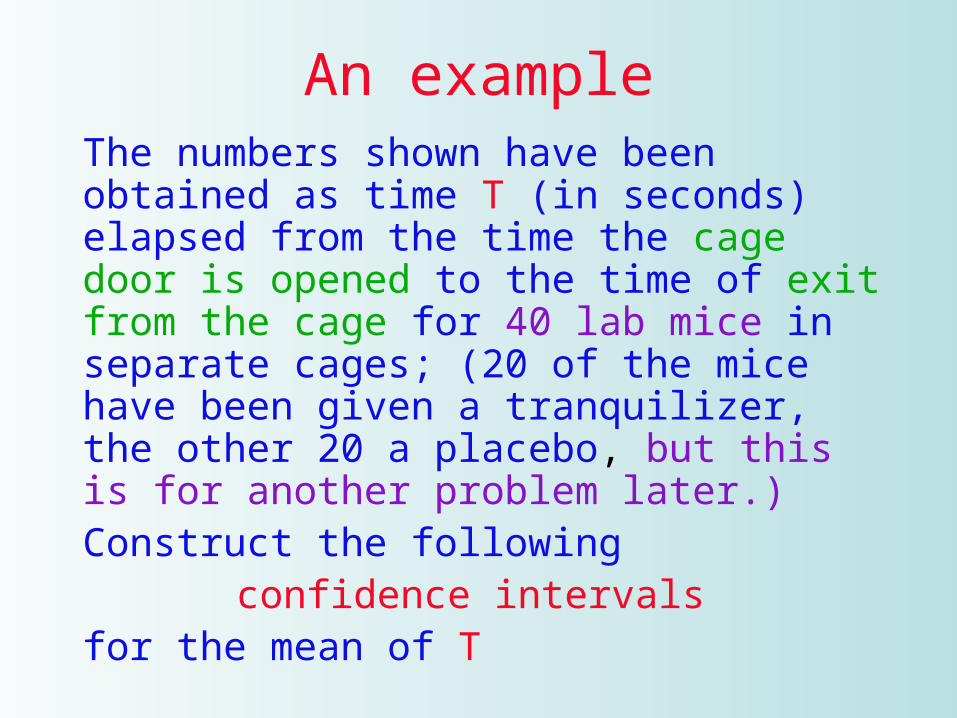
An exampleThe numbers shown have been obtained as time T (in seconds) elapsed from the time the cage door is opened to the time of exit from the cage for 40 lab mice in separate cages; (20 of the mice have been given a tranquilizer, the other 20 a placebo, but this is for another problem later.)Construct the following
confidence intervalsfor the mean of T
The Question:
1. 90% confidence interval
2. 95% confidence interval
3. 99% confidence interval
4. 30% confidence interval
5. 10% confidence interval
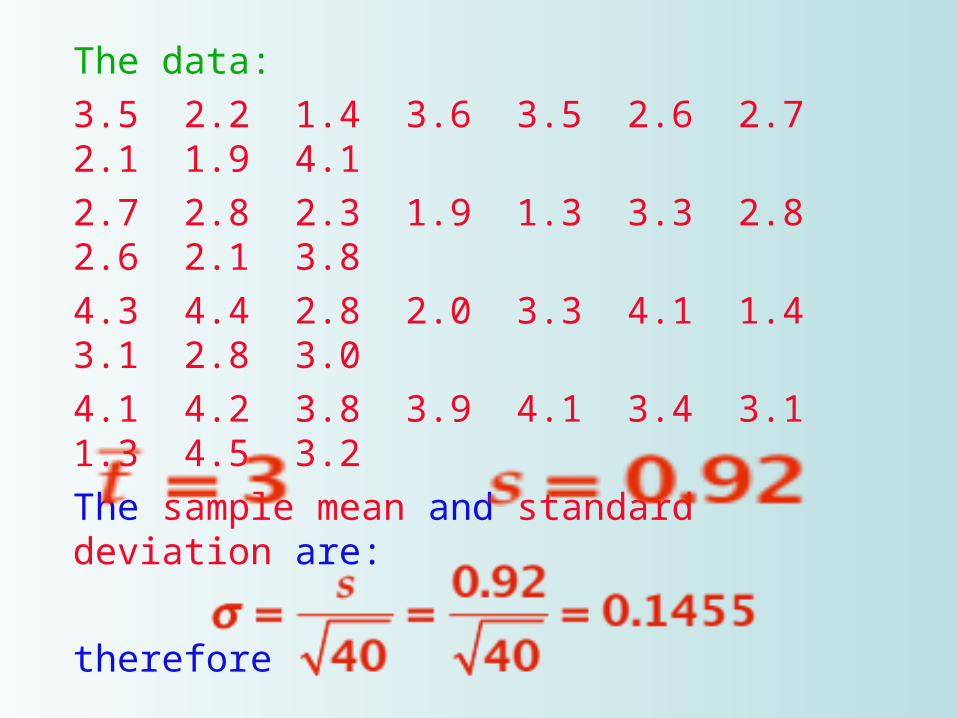
The data:3.5 2.2 1.4 3.6 3.5 2.6 2.7 2.1 1.9 4.12.7 2.8 2.3 1.9 1.3 3.3 2.8 2.6 2.1 3.84.3 4.4 2.8 2.0 3.3 4.1 1.4 3.1 2.8 3.04.1 4.2 3.8 3.9 4.1 3.4 3.1 1.3 4.5 3.2The sample mean and standard deviation are:
therefore
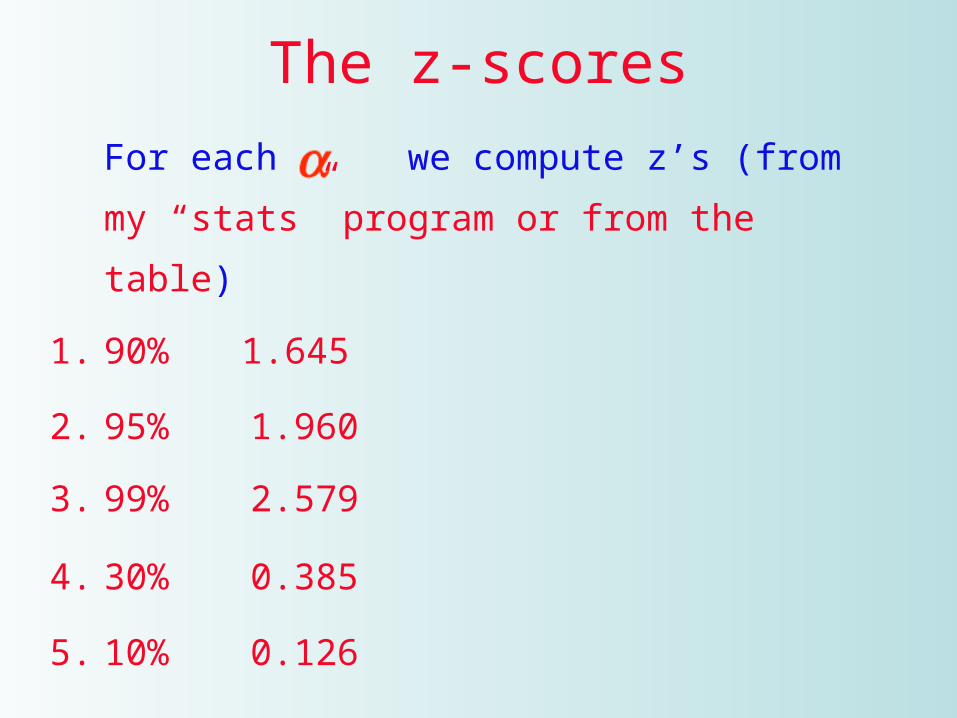
The z-scoresFor each we compute z’s (from my
“stats” program or from the table)
1. 90% 1.645
2. 95% 1.960
3. 99% 2.579
4. 30% 0.385
5. 10% 0.126
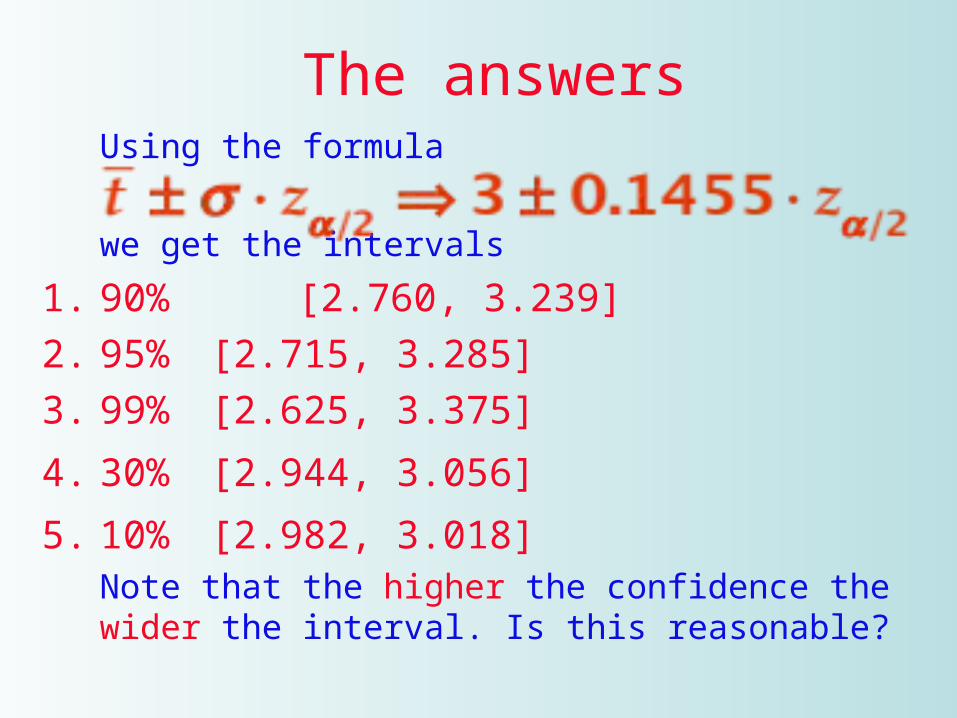
The answersUsing the formula
we get the intervals
1. 90% [2.760, 3.239]2. 95% [2.715, 3.285]3. 99% [2.625, 3.375]
4. 30% [2.944, 3.056]
5. 10% [2.982, 3.018]Note that the higher the confidence the wider the interval. Is this reasonable?
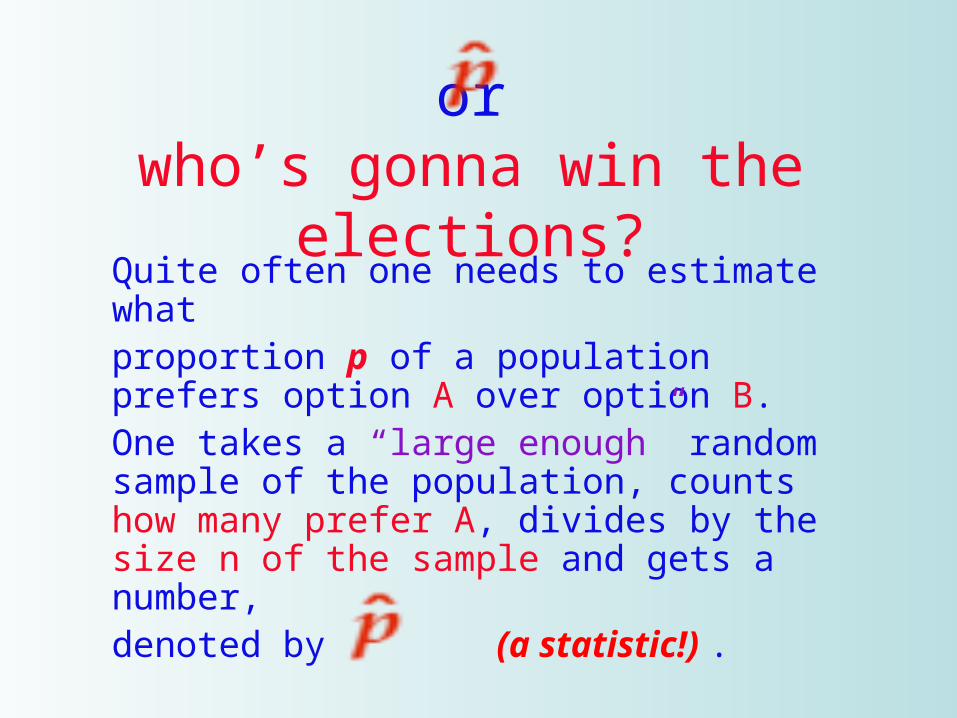
orwho’s gonna win the elections?
Quite often one needs to estimate whatproportion p of a population prefers option A over option B.One takes a “large enough” random sample of the population, counts how many prefer A, divides by the size n of the sample and gets a number, denoted by (a statistic!) .
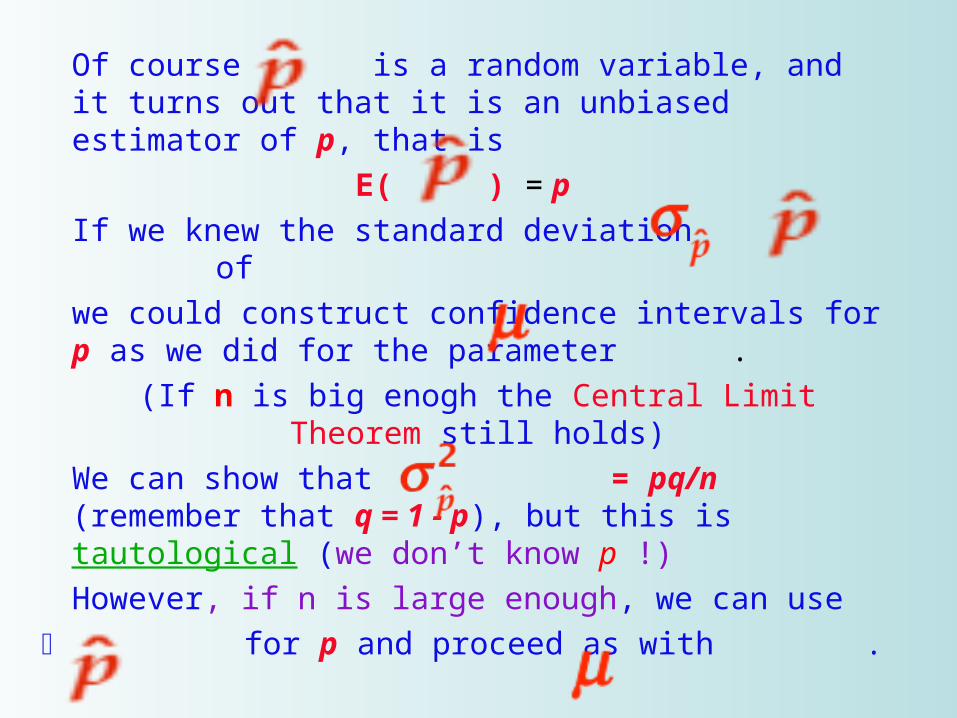
Of course is a random variable, and it turns out that it is an unbiased estimator of p, that is
E( ) = pIf we knew the standard deviation of we could construct confidence intervals for p as we did for the parameter .
(If n is big enogh the Central Limit Theorem still holds)
We can show that = pq/n (remember that q = 1 - p), but this is tautological (we don’t know p !)However, if n is large enough, we can use
for p and proceed as with .
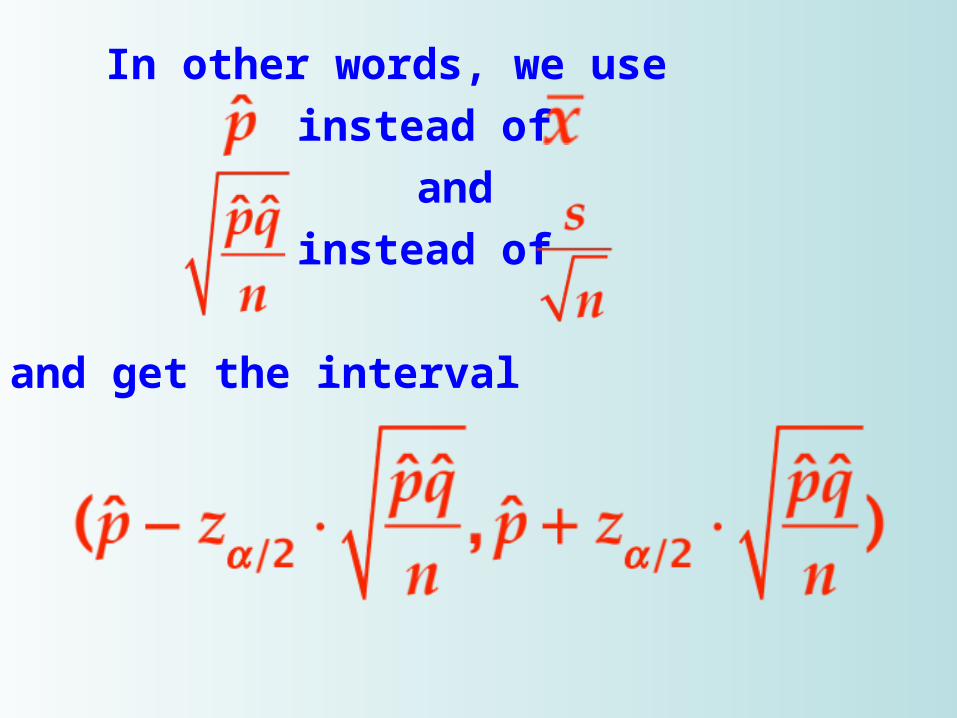
In other words, we useinstead of
andinstead of
and get the interval
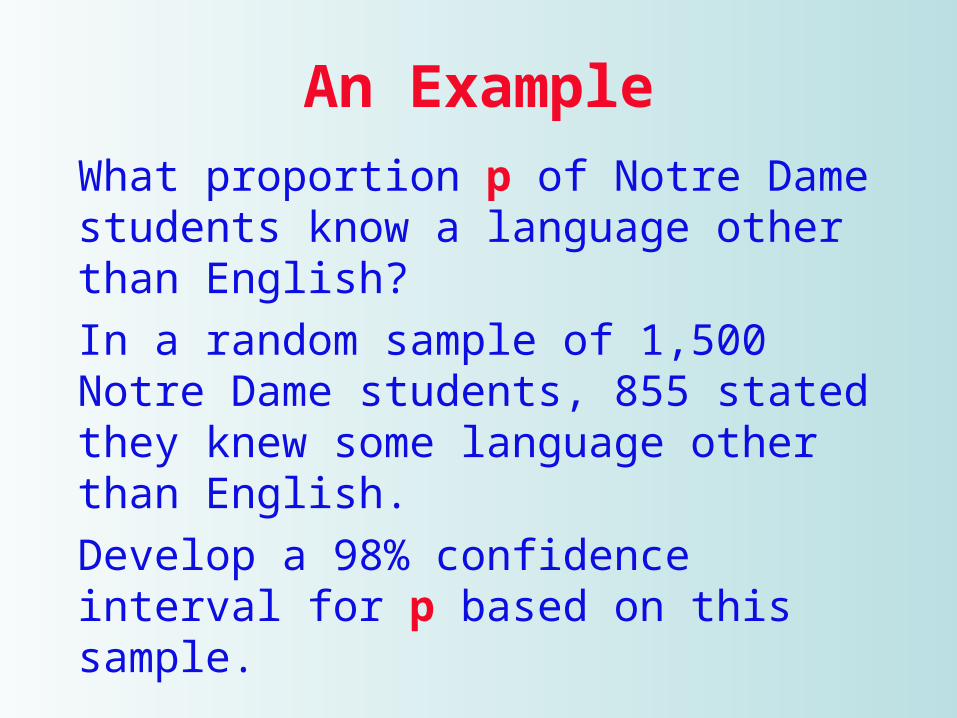
An ExampleWhat proportion p of Notre Dame students know a language other than English?In a random sample of 1,500 Notre Dame students, 855 stated they knew some language other than English.Develop a 98% confidence interval for p based on this sample.
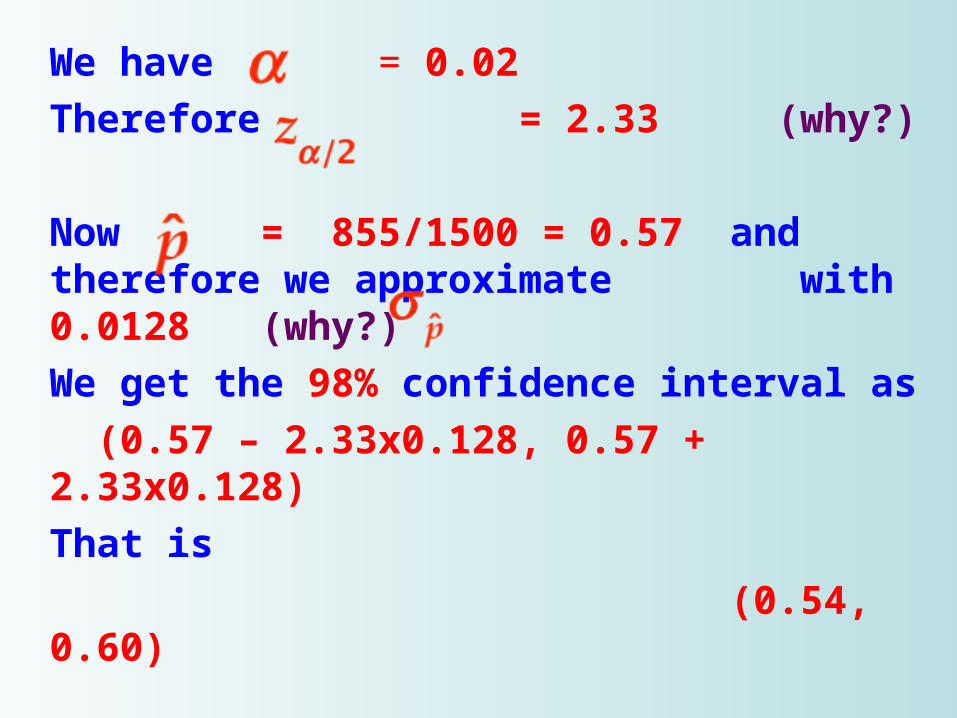
We have = 0.02 Therefore = 2.33 (why?)
Now = 855/1500 = 0.57 and therefore we approximate with 0.0128 (why?)We get the 98% confidence interval as (0.57 – 2.33x0.128, 0.57 + 2.33x0.128)That is (0.54, 0.60)
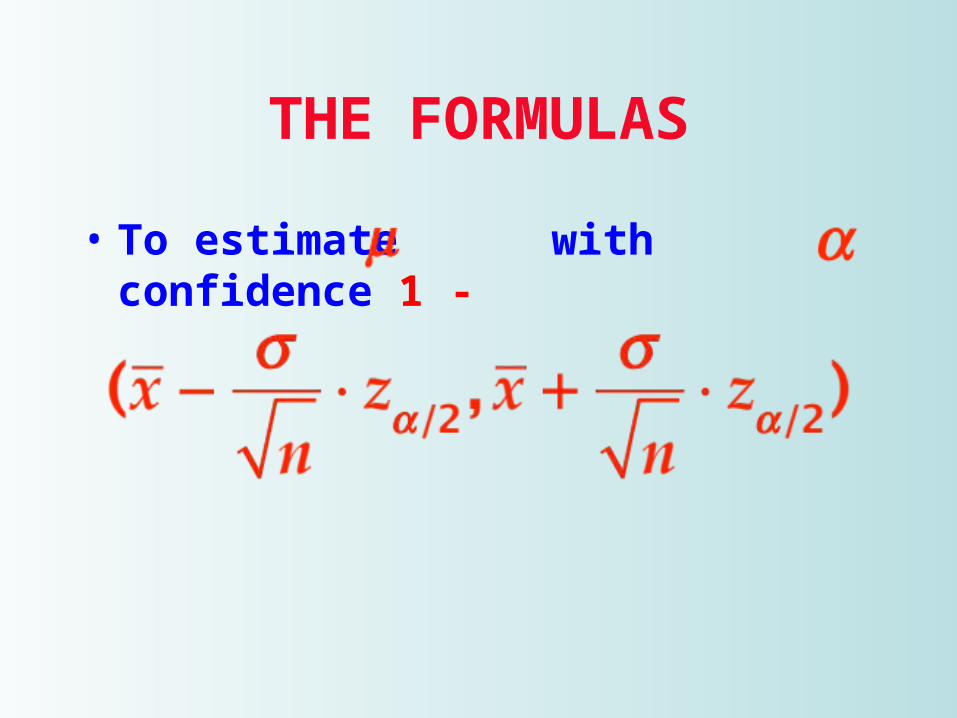
THE FORMULAS
• To estimate with confidence 1 -
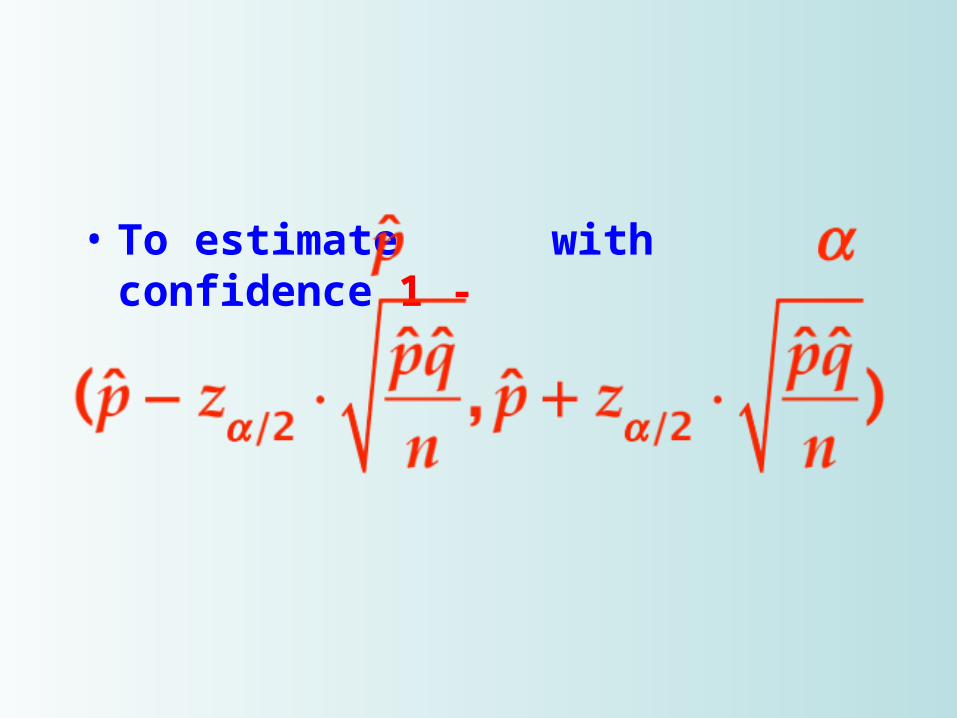
• To estimate with confidence 1 -