the future - the implications of demographic change for transportation in texas the future - the...
TRANSCRIPT
The Future -
The Implications of Demographic Change for Transportation in Texas
Michael E. Cline, Ph.D.Associate Director,
Hobby Center for the Study of TexasRice University
May 21, 2014Austin, TX
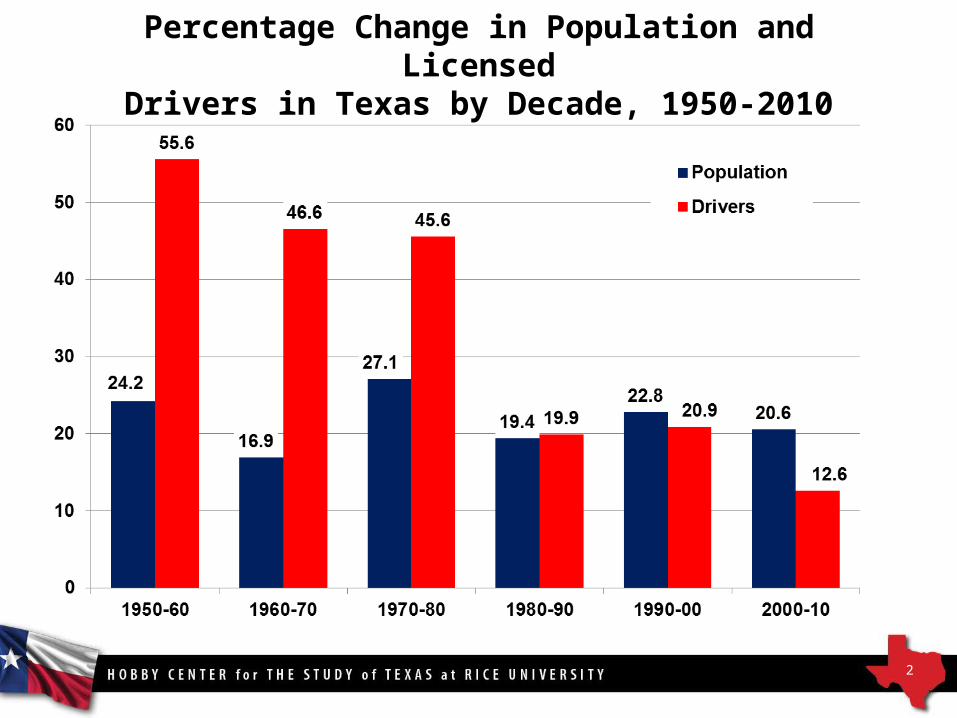
Percentage Change in Population and LicensedDrivers in Texas by Decade, 1950-2010
2
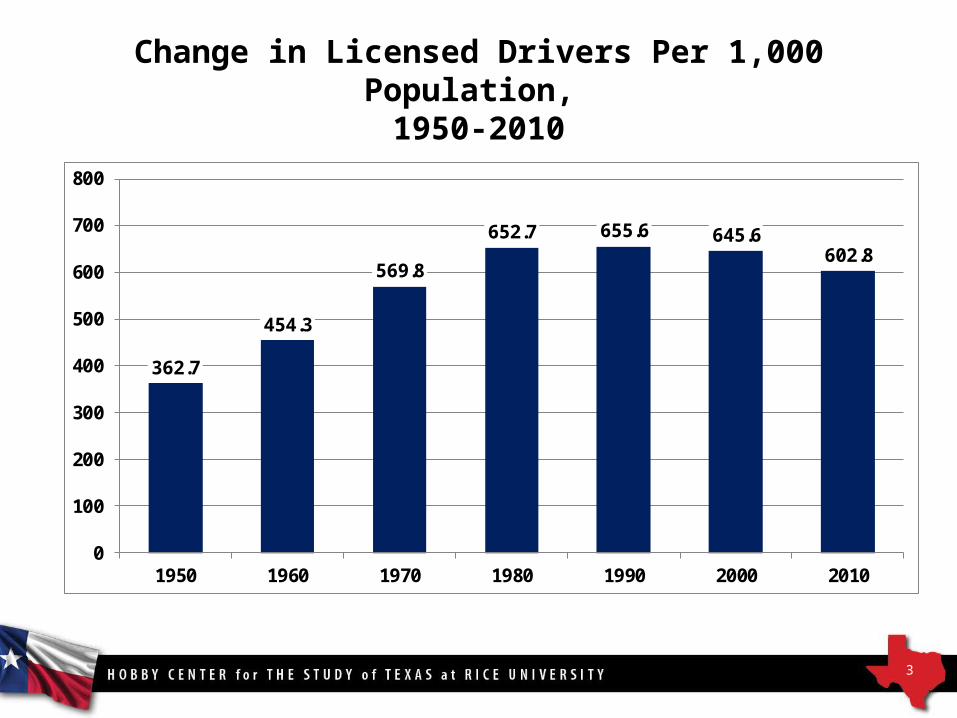
Change in Licensed Drivers Per 1,000 Population, 1950-2010
3
362.7
454.3
569.8
652.7 655.6 645.6602.8
0
100
200
300
400
500
600
700
800
1950 1960 1970 1980 1990 2000 2010
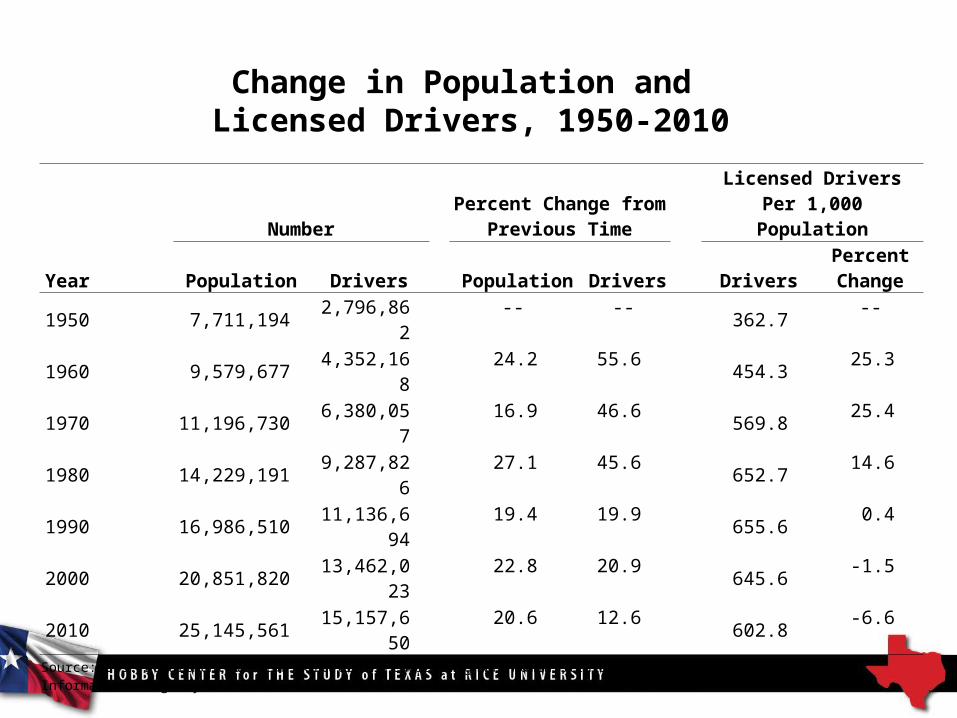
Change in Population and Licensed Drivers, 1950-2010
Year
Number Percent Change from
Previous Time Licensed Drivers Per
1,000 Population
Population Drivers Population Drivers DriversPercent Change
1950 7,711,194 2,796,862 -- -- 362.7 --1960 9,579,677 4,352,168 24.2 55.6 454.3 25.31970 11,196,730 6,380,057 16.9 46.6 569.8 25.41980 14,229,191 9,287,826 27.1 45.6 652.7 14.61990 16,986,510 11,136,694 19.4 19.9 655.6 0.42000 20,851,820 13,462,023 22.8 20.9 645.6 -1.52010 25,145,561 15,157,650 20.6 12.6 602.8 -6.6
Source: U.S. Department of Transportation, Federal Highway Administration, Office of Highway Policy Information, Highway Statistics Series; and U.S. Census Bureau, Decennial Censuses.
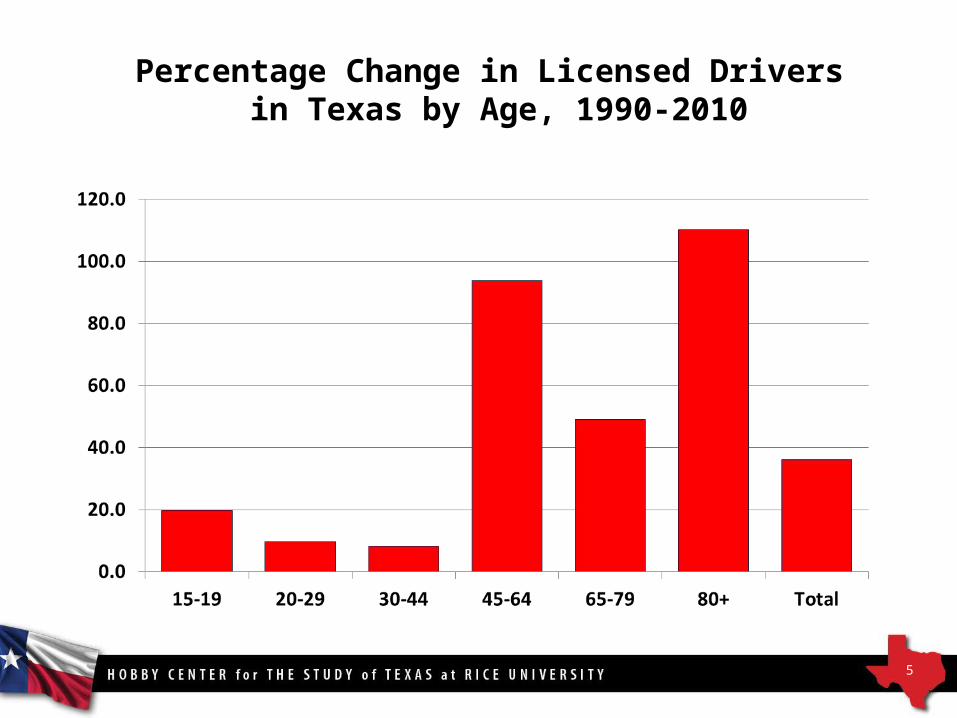
Percentage Change in Licensed Drivers in Texas by Age, 1990-2010
5
6
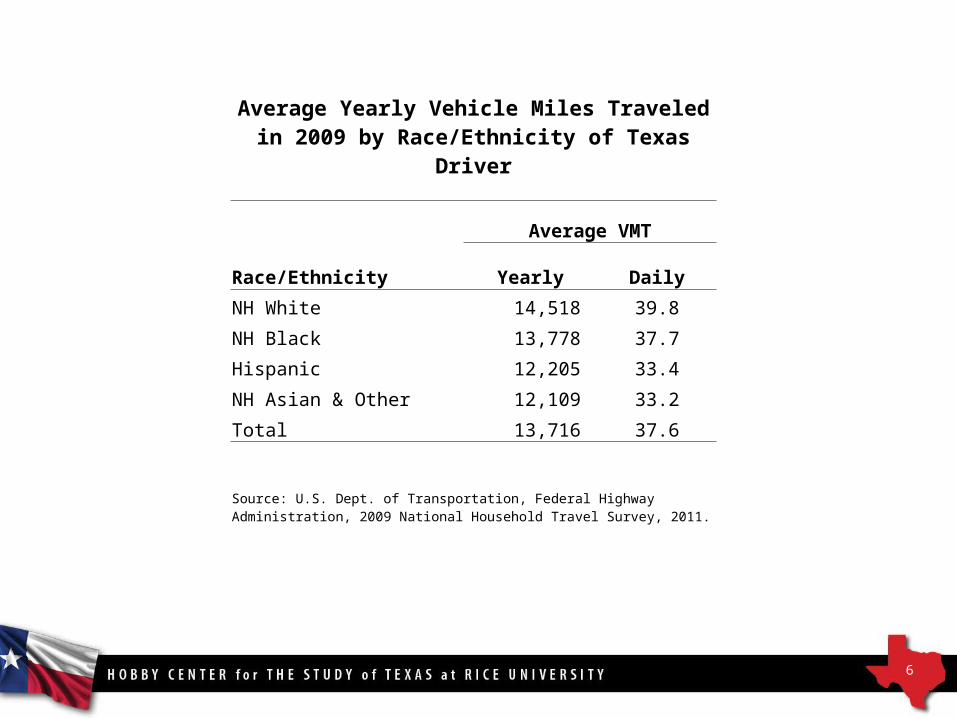
Average Yearly Vehicle Miles Traveled in 2009 by Race/Ethnicity of Texas Driver
Average VMT
Race/Ethnicity Yearly Daily
NH White 14,518 39.8
NH Black 13,778 37.7
Hispanic 12,205 33.4
NH Asian & Other 12,109 33.2
Total 13,716 37.6
Source: U.S. Dept. of Transportation, Federal Highway Administration, 2009 National Household Travel Survey, 2011.
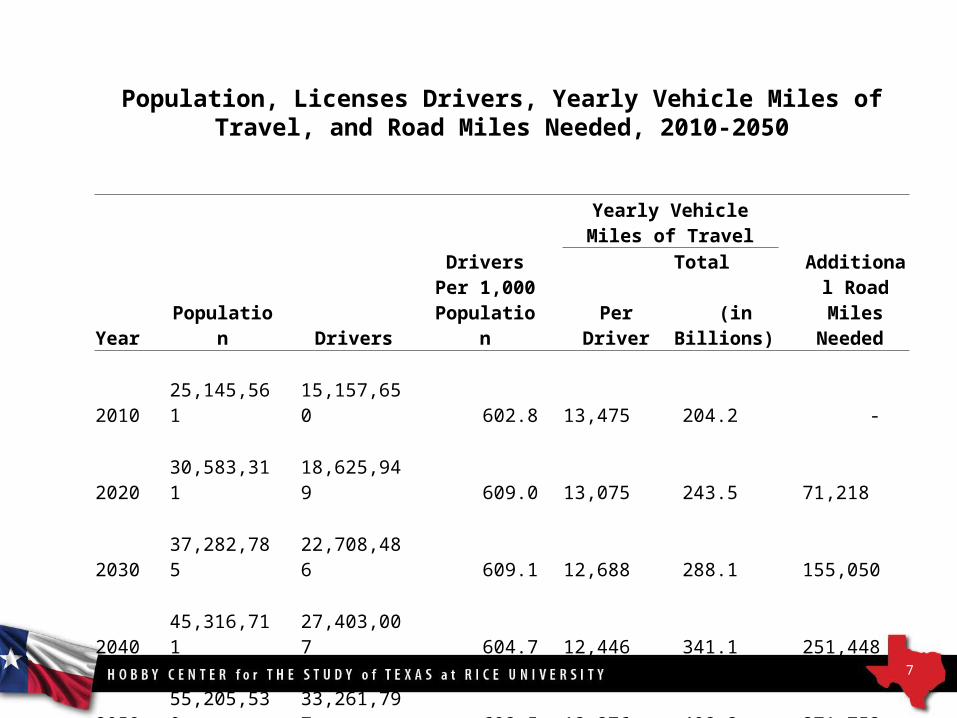
Population, Licenses Drivers, Yearly Vehicle Miles of Travel, and Road Miles Needed, 2010-2050
7
Drivers Per
1,000 Population
Yearly Vehicle Miles of
Travel Additional Road Miles
Needed Year Population Drivers Per Driver
Total (in
Billions) 2010 25,145,561 15,157,650 602.8 13,475 204.2 - 2020 30,583,311 18,625,949 609.0 13,075 243.5 71,218 2030 37,282,785 22,708,486 609.1 12,688 288.1 155,050 2040 45,316,711 27,403,007 604.7 12,446 341.1 251,448 2050 55,205,530 33,261,797 602.5 12,276 408.3 371,753 Source: Projections by the authors; and 2010 driver estimates and rates derived from U.S. Department of Transportation, Federal Highway Administration, Highway Statistics Series, 2009, 2010, and 2011; and U.S. Department of Transportation, Federal Highway Administration, National Household Travel Survey 2009; U.S. Department of Transportation, Federal Highway Administration, Office of Highway Policy Information, Highway Statistics Series, Highway Statistics 2011.
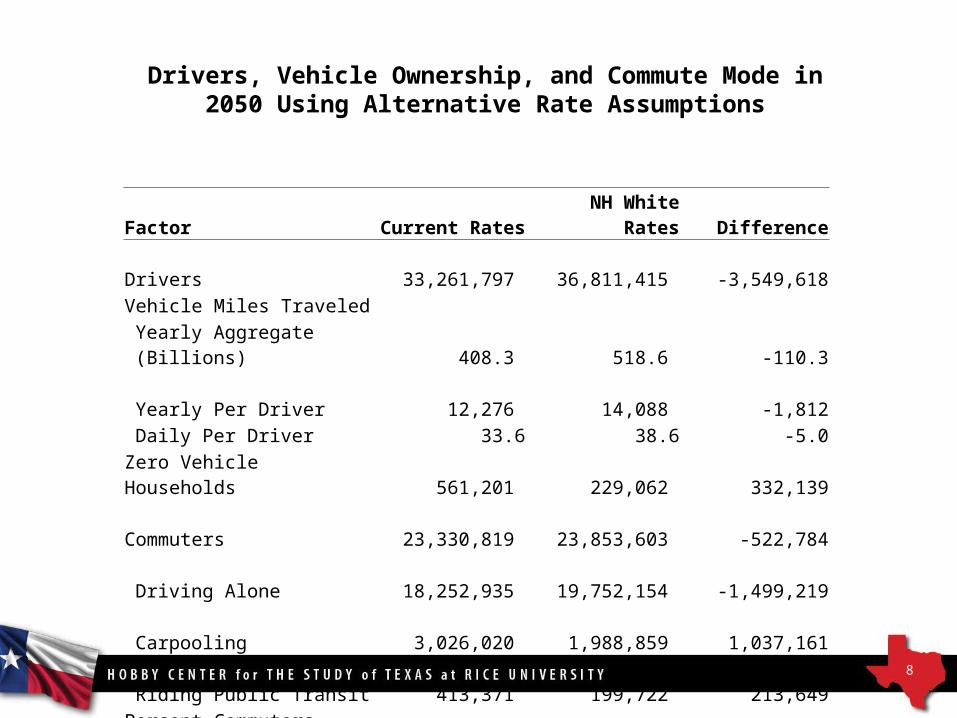
Drivers, Vehicle Ownership, and Commute Mode in 2050 Using Alternative Rate Assumptions
8
Factor Current Rates NH White Rates DifferenceDrivers 33,261,797 36,811,415 -3,549,618Vehicle Miles Traveled
Yearly Aggregate (Billions) 408.3 518.6 -110.3Yearly Per Driver 12,276 14,088 -1,812Daily Per Driver 33.6 38.6 -5.0
Zero Vehicle Households 561,201 229,062 332,139Commuters 23,330,819 23,853,603 -522,784
Driving Alone 18,252,935 19,752,154 -1,499,219Carpooling 3,026,020 1,988,859 1,037,161Riding Public Transit 413,371 199,722 213,649
Percent Commuters Using:Driving Alone 78.2 82.8 -4.6Carpooling 13.0 8.3 4.7Riding Public Transit 1.8 0.8 1.0
FOR MORE INFORMATION INCLUDING
PURCHASE INFORMATION, CONTACT:
TEXAS A&M PRESS800-826-8911
FAX: 888-617-2421WWW.TAMUPRESS.COM
OR GO TO:HTTP
://THETEXASCHALLENGE.COM/9

Happy Trails to You!Mike Cline
Associate Director,Hobby Center for the Study of Texas
For copies of the presentation and additional data for your area go to:
http://hobbycenter.rice.edu
Phone: 713-348-5396E-mail: [email protected]