the future refinancing crisis in cre
DESCRIPTION
Report from Deutsch Bank's Richard ParkusTRANSCRIPT

North America United States
23 April 2009
CMBS Research The Future Refinancing Crisis in Commercial Real Estate*
Deutsche Bank Securities Inc.
All prices are those current at the end of the previous trading session unless otherwise indicated. Prices are sourced from local exchanges via Reuters, Bloomberg and other vendors. Data is sourced from Deutsche Bank and subject companies. Deutsche Bank does and seeks to do business with companies covered in its research reports. Thus, investors should be aware that the firm may have a conflict of interest that could affect the objectivity of this report. Investors should consider this report as only a single factor in making their investment decision. Independent, third-party research (IR) on certain companies covered by DBSI's research is available to customers of DBSI in the United States at no cost. Customers can access IR at http://gm.db.com/IndependentResearch or by calling 1-877-208-6300. DISCLOSURES AND ANALYST CERTIFICATIONS ARE LOCATED IN APPENDIX 1.
Special Report
Research Team
Richard Parkus Research Analyst (+1) 212 250-6724 [email protected]
Jing An, CFA Research Analyst (+1 ) 212 250-5893 [email protected]
Sec
uri
tiza
tio
n
Glo
bal
Mar
kets
Res
earc
h
Sec
uri
tiza
tio
n
Estimates of the Magnitude of Refinancing Risk, Equity Deficiency and Losses from Maturity Defaults
*This is a revised version of a report originally published on 22 April 2009. It contains minor corrections to the text on page 21.

23 April 2009 CMBS Research
Page 2 Deutsche Bank Securities Inc.
Table of Contents I. Introduction............................................................................................................................3 II. The Magnitude of the Problem .............................................................................................5 III. Description of the Analysis and Assumptions......................................................................9 IV. Estimating the Amount of Non-Refinanceable Loans ........................................................ 11 V. Equity Deficiency and Losses from Maturity Defaults ........................................................ 15 VI. Concluding Remarks .......................................................................................................... 21
23 April 2009 CMBS Research
Deutsche Bank Securities Inc. Page 3
I. Introduction
The lesson that was learned (or re-learned) in the commercial real estate (CRE) crash of the early 1990s was that problems associated with massive over-supply can plague the industry for many years. The lesson that will be learned in the current crash (with CRE prices declining by 40-50%, or more, from their peaks, the term crash is, once again, appropriate) is that problems emanating from the financing side—in particular, a massive deterioration in underwriting standards and a concurrent rise of excessive leverage—can lead to problems of a similar (or greater) magnitude, even without supply problems.
While most attention in commercial real estate today is focused on the dramatic deterioration in term loan performance (i.e. the performance of loans prior to maturity), we believe that a potentially even more troublesome issue is the extent to which loans originated during the 2005-2007 period will encounter problems refinancing at maturity. To date, this issue has largely been dismissed with the vague and, in our view, naive observation that lenders will simply extend the maturity dates of loans that fail to qualify for refinancing. However, the scale of this problem is virtually unprecedented in commercial real estate, and its impact is likely to dominate the industry for the better part a decade.
At its core, the issue is fairly straightforward: The dramatic weakening in underwriting quality that began in 2005, along with compressing cap rates and ballooning leverage, led to rapidly rising commercial real estate prices. In 2007 the commercial real estate bubble burst, along with most other credit bubbles. Since that time underwriting standards have tightened back to their original levels, and perhaps further, as allowable leverage has plummeted and cap rates have skyrocketed. Purely as a result of the enormous changes in the available financing terms (e.g. lower leverage, higher cap rates and credit spreads), we estimate that commercial real estate prices have declined 25-30% from their 2007 peak. On top of this, the impact of the worst economic recession in decades on property cash flows will likely push them down additional 15-20% over and above the declines due to financing market changes. We argue in this report that, as a result, there are hundreds of billions of dollars, perhaps more than a trillion dollars, of commercial mortgages scheduled to mature over the next decade that are unlikely to qualify for refinancing without substantial equity infusions from the borrowers.
There are, in fact, two very different sources of refinancing problems, both of which are currently at play to varying degrees. The first source reflects the fact that most credit markets are currently either shut or operating at dramatically reduced levels. The problem here is not that maturing loans do not qualify for refinancing, but rather scarcity of credit makes it difficult for all loans to find refinancing, even those that would normally qualify under the new, tighter underwriting standards. Thus, in the current environment, the percentage of maturing loans that are able to refinance has been declining significantly since late 2008, despite the fact that the great majority of maturing loans is from the 1999 and 2000 vintages, have experienced enormous price appreciation and easily qualify for refinancing. As credit markets begin to heal, this source of refinancing problems will diminish.
The second source of refinancing problems, as previously noted, relates to the fact that a vast swath of the commercial mortgages originated during the bubble years (2005-2007) will not qualify for refinancing under the new standards. It is this source of refinancing problems that we focus in this report, and this problem will not go away as credit market rebound.
The focus of this report is on the refinancing problem for commercial mortgages in CMBS transactions. But CMBS is only 25% of the entire commercial real estate debt market, and the same processes that created a vast refinancing problem here were at work, to varying degrees, in other segments of the commercial real estate financing market as well. In particular, we expect that the same type of refinancing problems will be present in both bank
23 April 2009 CMBS Research
Page 4 Deutsche Bank Securities Inc.
and insurance company loan portfolios, and that they will likely be of a similar magnitude, at least in the case of banks.
The goal of this analysis is to quantify the scale of the refinancing problem in commercial real estate. In particular, by making conservative assumptions, we attempt to determine the minimum size of the problem. The quantitative analysis is carried out only on commercial mortgages in CMBS because only here do we have extremely detailed and complete data about every individual loan, including exact cash flow models. It is then possible, however, to extrapolate the findings on CMBS to the broader commercial real estate debt market.
Our findings with respect to CMBS are as follows:
1. At least two thirds of the loans maturing between 2009 and 2018 ($410 billion) are unlikely to qualify for refinancing at maturity without significant equity infusions from borrowers. For the 2007 vintage, well in excess of 80% of the loans are unlikely to qualify.
2. The aggregate equity deficiency (i.e. the additional amount of equity that borrowers would have to put up in order to qualify to refinance) is at least on the order of $100 billion.
3. Our (conservative) estimate of maturity default-related losses for fixed rate CMBS is $50 billion, 6.5% of the aggregate outstanding balance.
4. We estimate that maturity default-related losses will be at least 4.6% for the 2005 vintage, 5.8% for the 2006 vintage and 12.5% for the 2007 vintage.
It must be emphasized that this report considers the likely percentage of CMBS loans that would not qualify for refinancing and the associated maturity default-related losses assuming that loans do not default prior to maturity. In reality, a large percentage of these loans are likely to default prior to maturity. Thus, a significant part of what we calculate as maturity default-related losses will actually end up as term default losses. Total losses—the sum of term and maturity-related losses, are likely to be well in excess of the losses shown in this report. We will, in the near future, publish additional results using a combination of our term and maturity default analyses. The purpose of this report, however, was to focus on refinancing and maturity default related issues.
The report is structured as follows: Section II explores the scale of the refinancing problem, including the bank and insurance company components of the commercial real estate financing market. Section III discusses the quantitative analysis upon which our results are based, and presents the underlying assumptions. Section IV examines in some detail the amount of debt that is unlikely to qualify for refinancing without equity infusions from the borrower. In Section VI we provide estimates of the magnitude of the equity deficiency and maturity default-related losses. Average loss estimates are provided for each vintage, and for the 2005, 2006, 2007 and 2008 vintages losses are provided for each CMBS deal. The report concludes with Section VII, which discusses why we do not think that maturity extensions provide a solution to the refinancing problem outlined here.
23 April 2009 CMBS Research
Deutsche Bank Securities Inc. Page 5
II. The Magnitude of the Problem
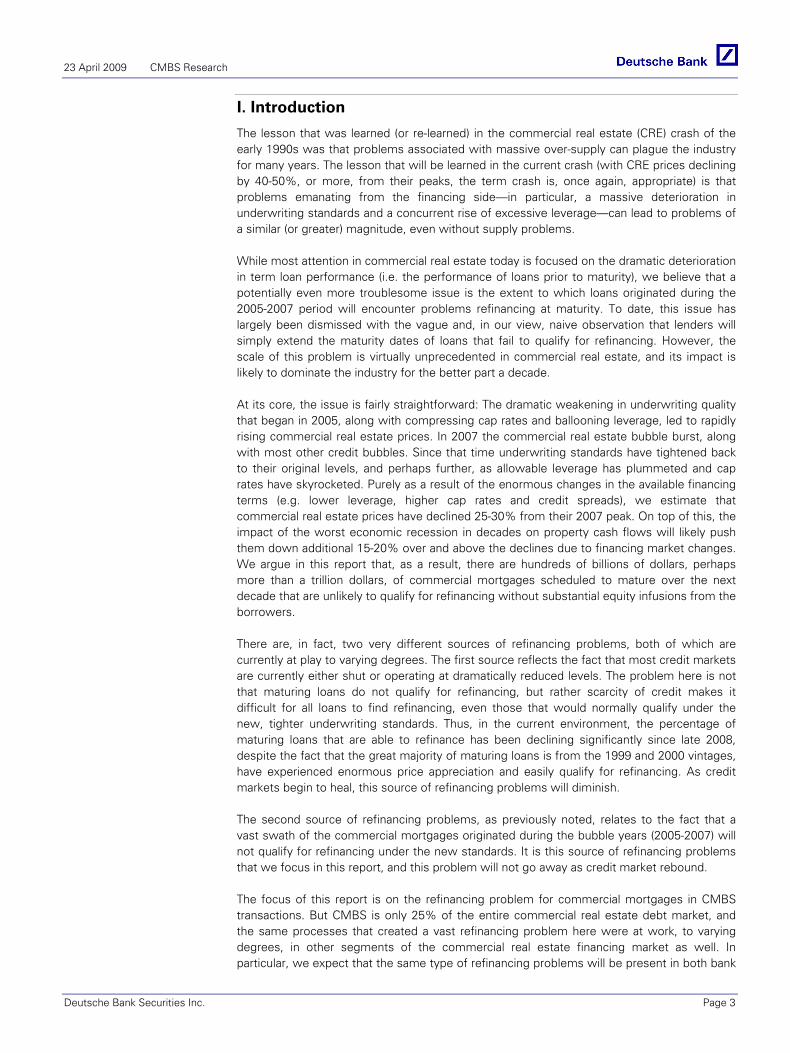
In order to convey the scale of the future refinancing problem, we start by noting that there are approximately $685 billion of non-defeased commercial mortgages in CMBS maturing between now and 2018, of which $640 billion is fixed rate conduit and about $45 billion is floating rate.1 Of this, approximately $236 billion matures by the end of 2013. Figure 1 provides a breakdown of the maturity profile of fixed rate loans by origination vintage. We include the origination vintage because maturing loans from older vintages clearly pose less of a refinancing problem.
Figure 1: Maturity profile of fixed rate commercial mortgages in CMBS transactions
Loan Vintage
0102030405060708090
100110120130140150160
2009 2010 2011 2012 2013 2014 2015 2016 2017 2018
Bal
ance
of M
atur
ing
Loan
s ($
bn)
1998 1999 2000 2001 2002 2003 2004 2005 2006 2007 2008
Source: Deutsche Bank, Intex, Trepp
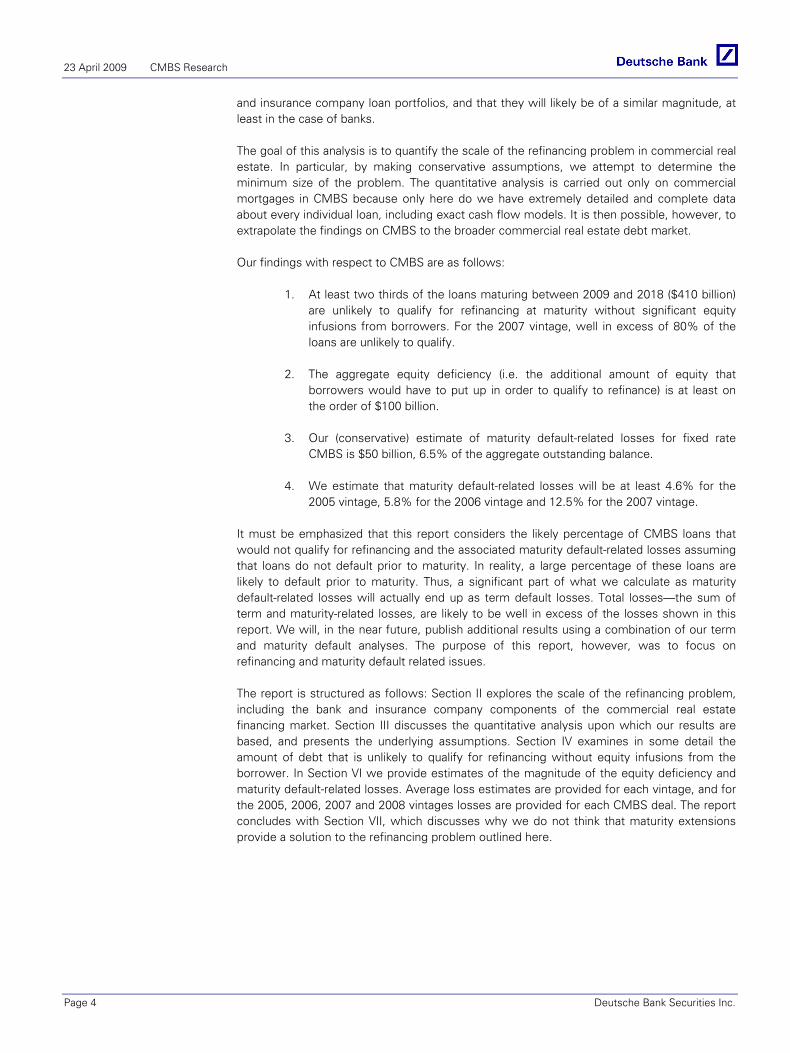
By far the most problematic of the fixed rate CMBS loans are the $67 billion of short-term loans that were originated during the 2005-2007 period and mature in 2010-2013. See Figure 2. These loans were originated at the top of the market, and the subsequent 35-50% price declines will leave a large percentage of them with negative equity just as they approach maturity, making refinancing all but impossible without very significant equity infusions by borrowers, as we will show in the analysis that follows. On top of the shortage of equity issue, these loans also exhibited the worst deterioration in underwriting standards. We argue in a later section that only a small percentage of these loans are likely to be able to qualify for refinancing when they mature.
1 This excludes whole loans in CRE CDOs, as well as small sectors such as seasoned loan deals.
23 April 2009 CMBS Research
Page 6 Deutsche Bank Securities Inc.
Figure 2: Short term fixed rate CMBS loans maturing through 2013
0
5
10
15
20
25
30
2009 2010 2011 2012 2013
Bal
ance
of M
atur
ing
Loan
s ($
bn)
Amortizing Full IO Partial IO
Source: Deutsche Bank, Intex, Trepp
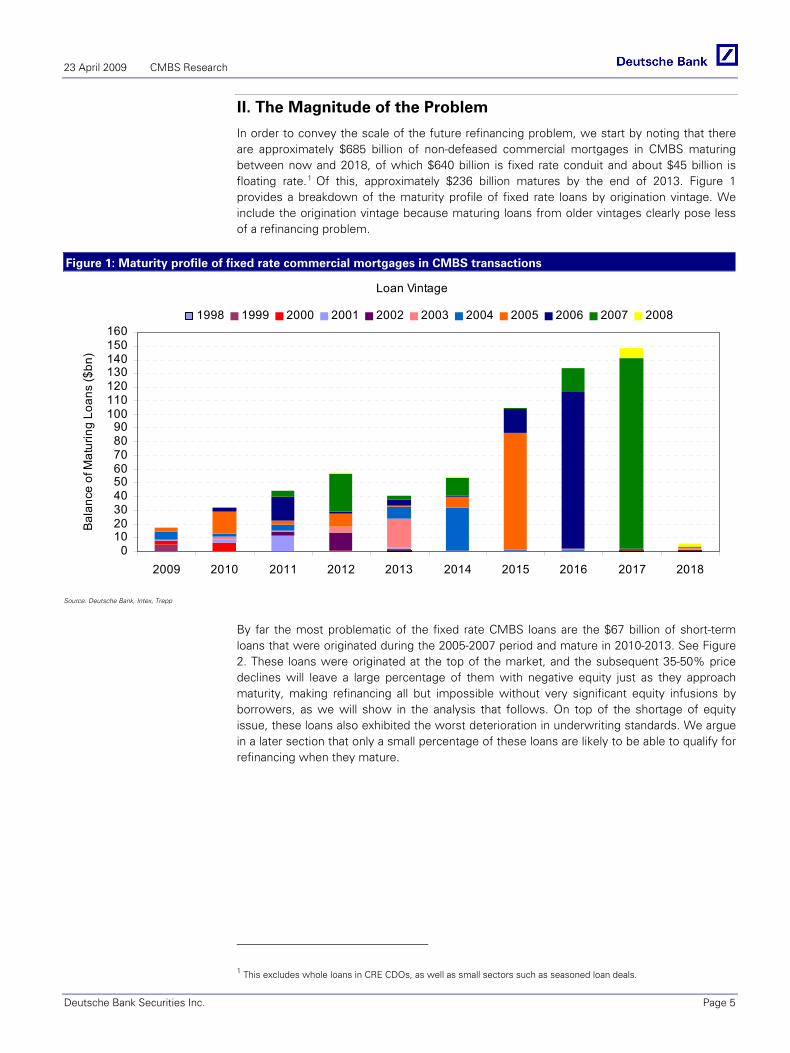
The $45 billion of floating rate loans (see Figure 3) mentioned above, plus the billions of dollars worth of floating rate whole loans in CRE CDOs that we have not accounted for, are even more problematic than the short-term fixed rate loans. The reason is that these are nearly all short-term loans (five to six year terms) on transitional properties. The properties being transitional, this is where pro forma underwriting was most widespread. In addition, these loans were usually the most highly levered with various types of subordinate debt—B-notes and mezzanine loans. We expect that the vast majority of these loans will not qualify for refinancing without extremely large infusions of borrower equity—imagine the required equity infusion to refinance a loan with an original LTV of 90, where the new minimum LTV is 65 and the value of the securing property has declined by 50%. Needless to say, not many borrowers will be willing to make put this amount of additional equity into an underwater loan.
Figure 3: Maturity profile of floating rate CMBS loans
02468
101214161820
2009 2010 2011 2012 2013
Mat
urin
g Lo
ans
($bn
)
Floating Rate Loans
Source: Deutsche Bank, Intex, Trepp
The quantitative analysis in this report focuses only on commercial mortgages in CMBS transactions because only here do we have sufficient data available. However, CMBS represents only about 25% of the $3.4 trillion commercial real estate market. Banks and life companies, which make up approximately 50% and 10% of the market, respectively, must
23 April 2009 CMBS Research
Deutsche Bank Securities Inc. Page 7
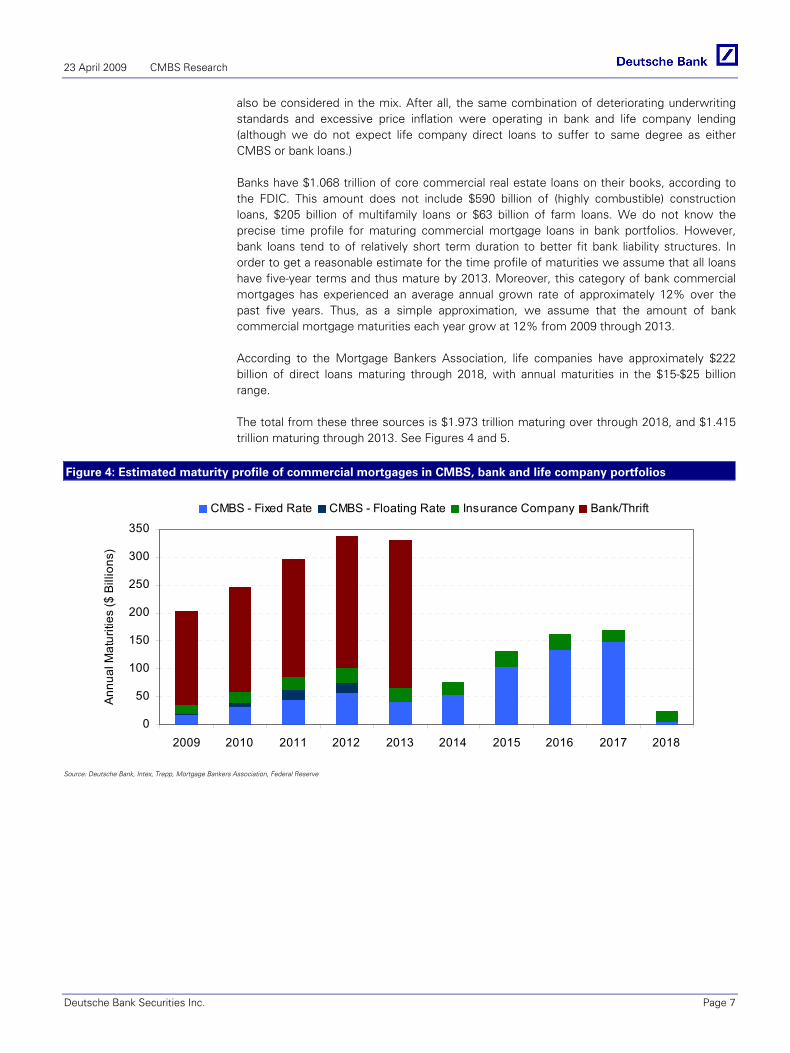
also be considered in the mix. After all, the same combination of deteriorating underwriting standards and excessive price inflation were operating in bank and life company lending (although we do not expect life company direct loans to suffer to same degree as either CMBS or bank loans.)
Banks have $1.068 trillion of core commercial real estate loans on their books, according to the FDIC. This amount does not include $590 billion of (highly combustible) construction loans, $205 billion of multifamily loans or $63 billion of farm loans. We do not know the precise time profile for maturing commercial mortgage loans in bank portfolios. However, bank loans tend to of relatively short term duration to better fit bank liability structures. In order to get a reasonable estimate for the time profile of maturities we assume that all loans have five-year terms and thus mature by 2013. Moreover, this category of bank commercial mortgages has experienced an average annual grown rate of approximately 12% over the past five years. Thus, as a simple approximation, we assume that the amount of bank commercial mortgage maturities each year grow at 12% from 2009 through 2013.
According to the Mortgage Bankers Association, life companies have approximately $222 billion of direct loans maturing through 2018, with annual maturities in the $15-$25 billion range.
The total from these three sources is $1.973 trillion maturing over through 2018, and $1.415 trillion maturing through 2013. See Figures 4 and 5.
Figure 4: Estimated maturity profile of commercial mortgages in CMBS, bank and life company portfolios
0
50
100
150
200
250
300
350
2009 2010 2011 2012 2013 2014 2015 2016 2017 2018
Ann
ual M
atur
ities
($ B
illio
ns)
CMBS - Fixed Rate CMBS - Floating Rate Insurance Company Bank/Thrift
Source: Deutsche Bank, Intex, Trepp, Mortgage Bankers Association, Federal Reserve
23 April 2009 CMBS Research
Page 8 Deutsche Bank Securities Inc.
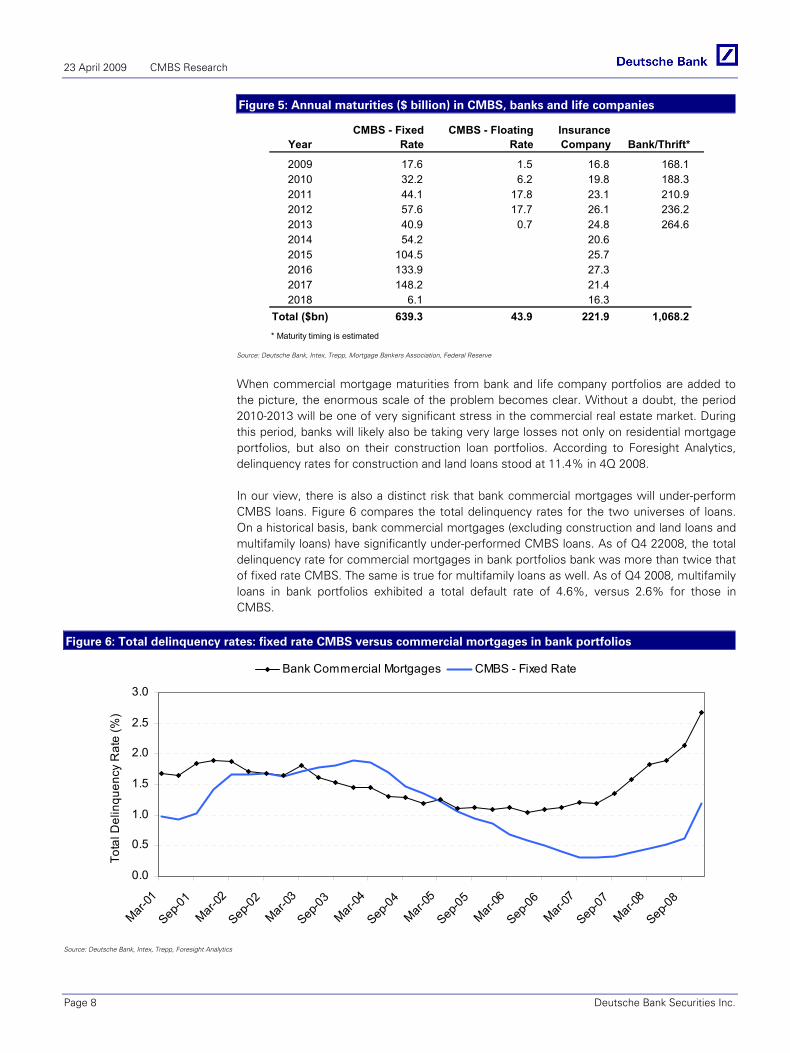
Figure 5: Annual maturities ($ billion) in CMBS, banks and life companies
YearCMBS - Fixed
RateCMBS - Floating
RateInsurance Company Bank/Thrift*
2009 17.6 1.5 16.8 168.12010 32.2 6.2 19.8 188.32011 44.1 17.8 23.1 210.92012 57.6 17.7 26.1 236.22013 40.9 0.7 24.8 264.62014 54.2 20.62015 104.5 25.72016 133.9 27.32017 148.2 21.42018 6.1 16.3
Total ($bn) 639.3 43.9 221.9 1,068.2* Maturity timing is estimated
Source: Deutsche Bank, Intex, Trepp, Mortgage Bankers Association, Federal Reserve
When commercial mortgage maturities from bank and life company portfolios are added to the picture, the enormous scale of the problem becomes clear. Without a doubt, the period 2010-2013 will be one of very significant stress in the commercial real estate market. During this period, banks will likely also be taking very large losses not only on residential mortgage portfolios, but also on their construction loan portfolios. According to Foresight Analytics, delinquency rates for construction and land loans stood at 11.4% in 4Q 2008.
In our view, there is also a distinct risk that bank commercial mortgages will under-perform CMBS loans. Figure 6 compares the total delinquency rates for the two universes of loans. On a historical basis, bank commercial mortgages (excluding construction and land loans and multifamily loans) have significantly under-performed CMBS loans. As of Q4 22008, the total delinquency rate for commercial mortgages in bank portfolios bank was more than twice that of fixed rate CMBS. The same is true for multifamily loans as well. As of Q4 2008, multifamily loans in bank portfolios exhibited a total default rate of 4.6%, versus 2.6% for those in CMBS.
Figure 6: Total delinquency rates: fixed rate CMBS versus commercial mortgages in bank portfolios
0.0
0.5
1.0
1.5
2.0
2.5
3.0
Mar-01
Sep-01
Mar-02
Sep-02
Mar-03
Sep-03
Mar-04
Sep-04
Mar-05
Sep-05
Mar-06
Sep-06
Mar-07
Sep-07
Mar-08
Sep-08
Tota
l Del
inqu
ency
Rat
e (%
)
Bank Commercial Mortgages CMBS - Fixed Rate
Source: Deutsche Bank, Intex, Trepp, Foresight Analytics
23 April 2009 CMBS Research
Deutsche Bank Securities Inc. Page 9
Our main point is that the amount of commercial mortgages maturing over the next five to seven years that will face formidable refinancing problems could be well in excess of $1 trillion dollars.
Of course, all of this begs the question of precisely where the future financing for commercial real estate will come from. At the moment, the CMBS market is moribund. We speculate
III. Description of the Analysis and Assumptions
The quantitative analysis presented in this report is based entirely on 54,079 currently outstanding and non-defeased fixed rate commercial mortgages in CMBS transactions with an aggregate balance of $601.9 billion.
The analysis begins with the Intex cash flow model for each of the 54,079 loans. Portfolio and Property Research (PPR), an independent commercial real estate research firm, produces 5-year rent, vacancy and NOI projections for each major property segment in the 54 largest commercial real estate markets in the US. For each loan in our sample, we project the NOI of the underlying property five years forward (thorough 2013) using the PPR projections for the appropriate property type and market. After 2013, we assume that NOI returns (linearly) to its peak level at the end of 2007 by 2018. This NOI projection is then run through the Intex cash flow model for the loan until its maturity date. At this point, the property’s approximate value is calculated by applying the appropriate cap rate to the property’s projected NOI. By making specific assumptions about maximum LTV, minimum DSCR and the future cost of financing (i.e. mortgage rates), we are able to estimate whether the loan would qualify for refinancing at the new tighter underwriting standards, the amount, if any, of the equity deficiency (i.e. the amount of new equity the borrower would need to put into the loan in order to refinance) and an estimate of the maturity default-related loss.
At each stage of the analysis, we have attempted to make assumptions that are reasonable, but conservative in the sense of giving rise to the least stress or the lowest losses. The exception is the NOI scenarios, which we simply take from PPR.
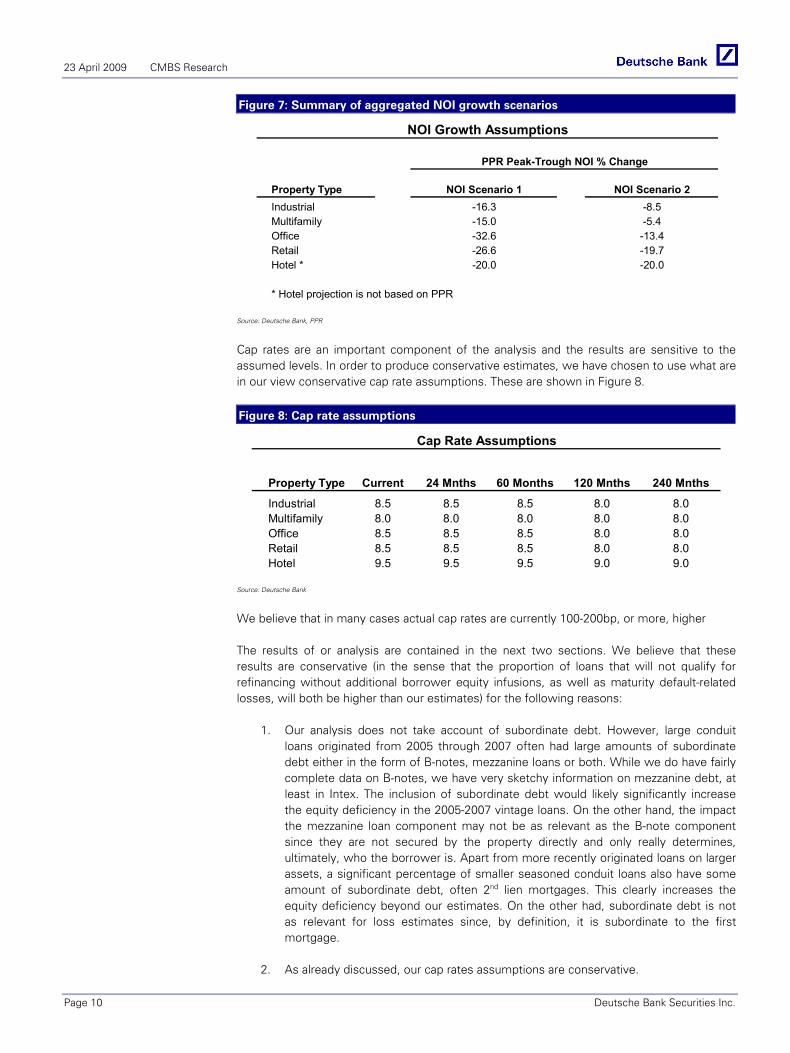
The PPR NOI scenarios are summarized at an aggregated level in Figure 7 by taking, for each property segment, the weighted average of NOI projections across markets, where the weights represent the size of the property sector in that market.
Scenario 1 is the current PPR severe recession scenario. Scenario 2 is the previous PPR severe recession scenario, which now looks relatively mild. Scenario 1 clearly entails extreme cash flow stress for properties. In our view, the magnitudes of these projections are reasonable.
23 April 2009 CMBS Research
Page 10 Deutsche Bank Securities Inc.
Figure 7: Summary of aggregated NOI growth scenarios
Property Type NOI Scenario 1 NOI Scenario 2Industrial -16.3 -8.5Multifamily -15.0 -5.4Office -32.6 -13.4Retail -26.6 -19.7Hotel * -20.0 -20.0
* Hotel projection is not based on PPR
NOI Growth Assumptions
PPR Peak-Trough NOI % Change
Source: Deutsche Bank, PPR
Cap rates are an important component of the analysis and the results are sensitive to the assumed levels. In order to produce conservative estimates, we have chosen to use what are in our view conservative cap rate assumptions. These are shown in Figure 8.
Figure 8: Cap rate assumptions
Property Type Current 24 Mnths 60 Months 120 Mnths 240 Mnths
Industrial 8.5 8.5 8.5 8.0 8.0Multifamily 8.0 8.0 8.0 8.0 8.0Office 8.5 8.5 8.5 8.0 8.0Retail 8.5 8.5 8.5 8.0 8.0Hotel 9.5 9.5 9.5 9.0 9.0
Cap Rate Assumptions
Source: Deutsche Bank
We believe that in many cases actual cap rates are currently 100-200bp, or more, higher
The results of or analysis are contained in the next two sections. We believe that these results are conservative (in the sense that the proportion of loans that will not qualify for refinancing without additional borrower equity infusions, as well as maturity default-related losses, will both be higher than our estimates) for the following reasons:
1. Our analysis does not take account of subordinate debt. However, large conduit loans originated from 2005 through 2007 often had large amounts of subordinate debt either in the form of B-notes, mezzanine loans or both. While we do have fairly complete data on B-notes, we have very sketchy information on mezzanine debt, at least in Intex. The inclusion of subordinate debt would likely significantly increase the equity deficiency in the 2005-2007 vintage loans. On the other hand, the impact the mezzanine loan component may not be as relevant as the B-note component since they are not secured by the property directly and only really determines, ultimately, who the borrower is. Apart from more recently originated loans on larger assets, a significant percentage of smaller seasoned conduit loans also have some amount of subordinate debt, often 2nd lien mortgages. This clearly increases the equity deficiency beyond our estimates. On the other had, subordinate debt is not as relevant for loss estimates since, by definition, it is subordinate to the first mortgage.
2. As already discussed, our cap rates assumptions are conservative.
23 April 2009 CMBS Research
Deutsche Bank Securities Inc. Page 11
3. As will be discussed in the next two sections, our underwriting assumptions--maximum LTVs (70%), minimum DSCRs (1.3x) and future mortgage rates (8%)--are conservative.
IV. Estimating the Amount of Non-Refinanceable Loans
To be clear, by not qualifying for refinancing, we mean that when the existing loan matures the borrower will not be able to qualify for a new loan with sufficient proceeds to payoff the existing loan. In particular, the borrower will need to put additional equity to payoff the existing loan.
The amount of refinanceable loans is particularly important because, in our view, commercial real estate borrowers will, for the most part, either be unable or unwilling (or both) to put additional equity into these properties. Instead, borrowers will be faced either with negotiating for maturity extensions from their lenders or walking away from the property. As we argue in the final section, we do not believe that loan extensions offer a way out of this problem and expect that both routes will ultimately lead to losses.
This section provides a variety of results meant to shed light on the nature and scope of the refinancing problem. In order to qualify to refinance an existing loan, the property must satisfy three criteria:
1. The new loan balance must be at least as large as the existing loan balance.
2. The LTV of the loan must be no greater than 70 (current maximum LTVs are between 60 and 65).
3. The DSCR, based on a 10-year fixed rate loan with a 25-year amortization schedule and an 8% mortgage rate, must be no less than 1.3x.
We provide results over two different horizons, the shorter-term horizon consisting of loans maturing between 2009 and 2012 and the full term horizon consisting of all loans. The reason we look at the shorter-term results separately is that our projections have more accuracy over this shorter period. The further out in time we go, the less sure we are that the actual future environment will match up to our projections.
We begin with the shorter-term results. Unless otherwise noted, all results correspond to the more severe NOI Scenario 1.
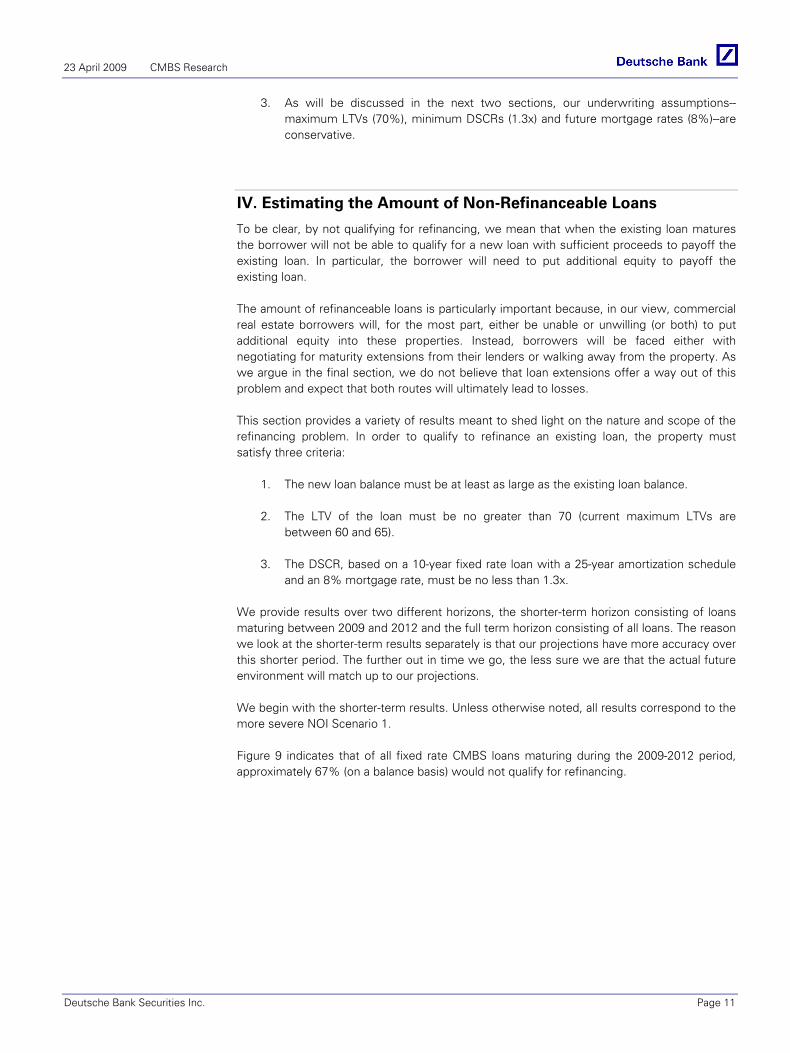
Figure 9 indicates that of all fixed rate CMBS loans maturing during the 2009-2012 period, approximately 67% (on a balance basis) would not qualify for refinancing.
23 April 2009 CMBS Research
Page 12 Deutsche Bank Securities Inc.
Figure 9: Estimated percentage of loans that do not qualify for refinancing: NOI Scenario 1
Property Type # LoansBalance
($BB)
Loans Not Qualifying
(#)
Loans Not Qualifying
($BB)% Not Qualifying
(Loan Count)% Not Qualifying
(Balance)Hotel 475 7.3 182 4.1 38.3 55.5Industrial 1,189 5.8 330 2.2 27.8 37.9Multifamily 3,793 24.4 2,220 18.9 58.5 77.3Office 2,629 40.9 1,433 30.8 54.5 75.3Retail 4,156 44.6 1,727 24.6 41.6 55.1Multi Property 672 29.6 339 21.1 50.4 71.3Other 1,545 12.0 639 8.7 41.4 71.9Aggregate 14,459 164.7 6,870 110.3 47.5 66.9
Refinancing Requirement: LTV < 70 & DCSR > 1.3
Loans Maturing 2009 - 2012
Source: Deutsche Bank
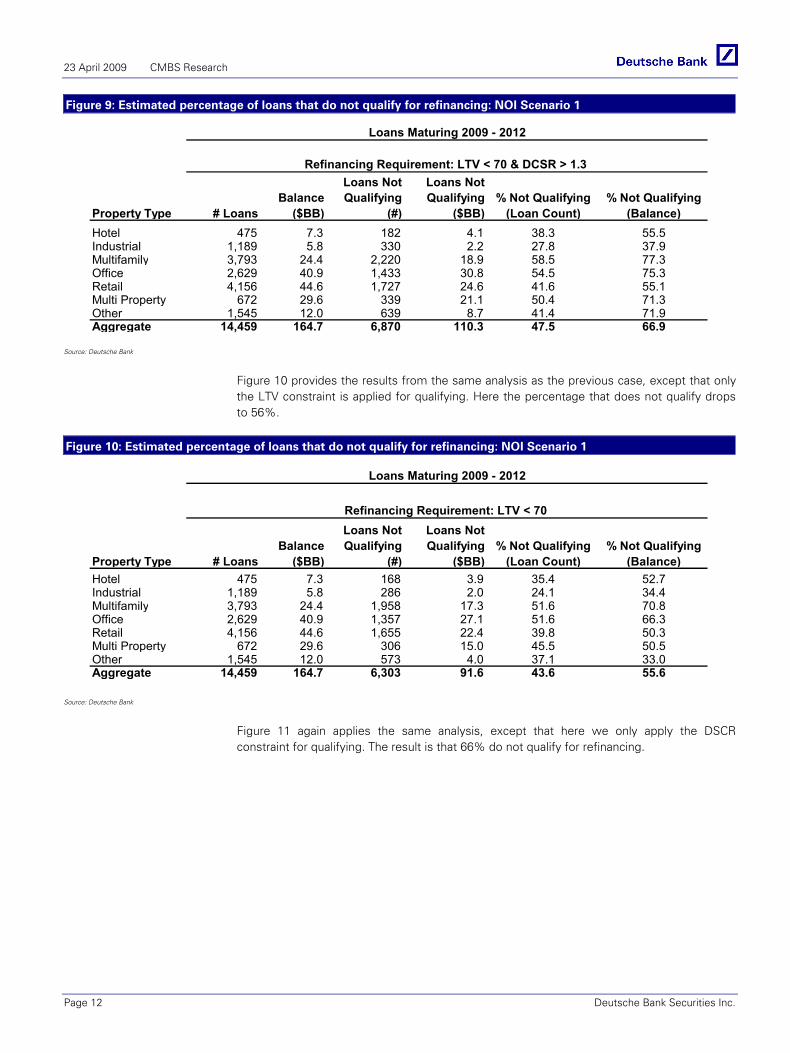
Figure 10 provides the results from the same analysis as the previous case, except that only the LTV constraint is applied for qualifying. Here the percentage that does not qualify drops to 56%.
Figure 10: Estimated percentage of loans that do not qualify for refinancing: NOI Scenario 1
Property Type # LoansBalance
($BB)
Loans Not Qualifying
(#)
Loans Not Qualifying
($BB)% Not Qualifying
(Loan Count)% Not Qualifying
(Balance)Hotel 475 7.3 168 3.9 35.4 52.7Industrial 1,189 5.8 286 2.0 24.1 34.4Multifamily 3,793 24.4 1,958 17.3 51.6 70.8Office 2,629 40.9 1,357 27.1 51.6 66.3Retail 4,156 44.6 1,655 22.4 39.8 50.3Multi Property 672 29.6 306 15.0 45.5 50.5Other 1,545 12.0 573 4.0 37.1 33.0Aggregate 14,459 164.7 6,303 91.6 43.6 55.6
Refinancing Requirement: LTV < 70
Loans Maturing 2009 - 2012
Source: Deutsche Bank
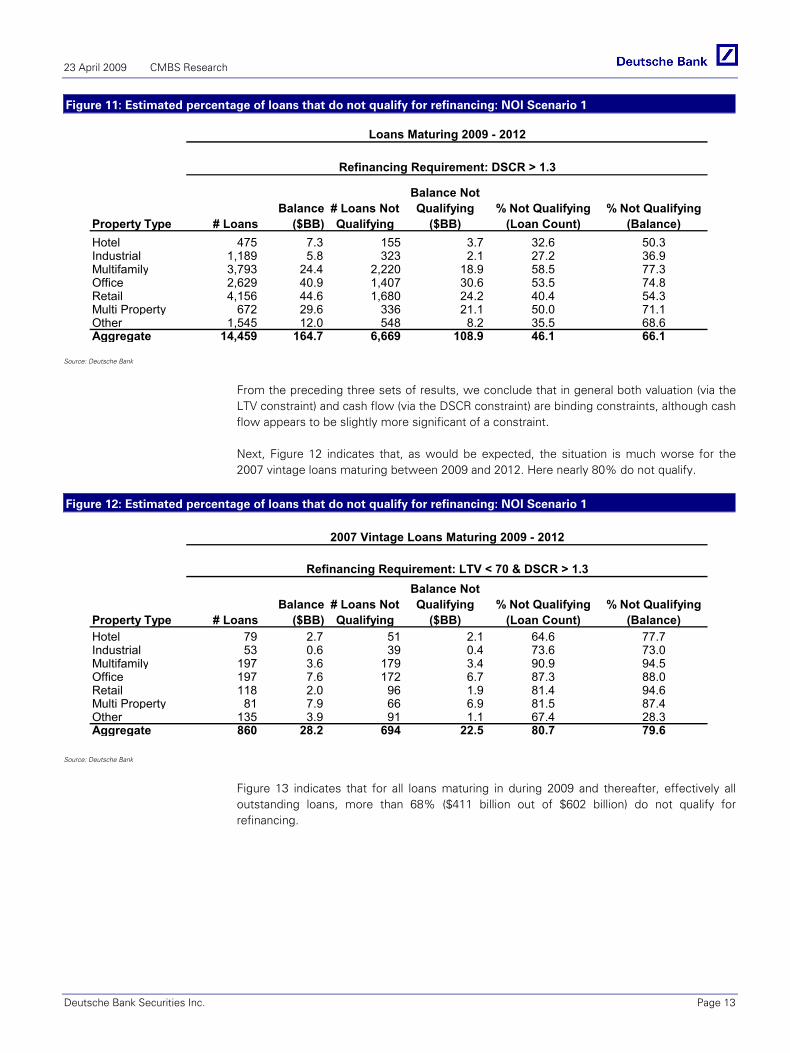
Figure 11 again applies the same analysis, except that here we only apply the DSCR constraint for qualifying. The result is that 66% do not qualify for refinancing.
23 April 2009 CMBS Research
Deutsche Bank Securities Inc. Page 13
Figure 11: Estimated percentage of loans that do not qualify for refinancing: NOI Scenario 1
Property Type # LoansBalance
($BB)# Loans Not Qualifying
Balance Not Qualifying
($BB)% Not Qualifying
(Loan Count)% Not Qualifying
(Balance)Hotel 475 7.3 155 3.7 32.6 50.3Industrial 1,189 5.8 323 2.1 27.2 36.9Multifamily 3,793 24.4 2,220 18.9 58.5 77.3Office 2,629 40.9 1,407 30.6 53.5 74.8Retail 4,156 44.6 1,680 24.2 40.4 54.3Multi Property 672 29.6 336 21.1 50.0 71.1Other 1,545 12.0 548 8.2 35.5 68.6Aggregate 14,459 164.7 6,669 108.9 46.1 66.1
Refinancing Requirement: DSCR > 1.3
Loans Maturing 2009 - 2012
Source: Deutsche Bank
From the preceding three sets of results, we conclude that in general both valuation (via the LTV constraint) and cash flow (via the DSCR constraint) are binding constraints, although cash flow appears to be slightly more significant of a constraint.
Next, Figure 12 indicates that, as would be expected, the situation is much worse for the 2007 vintage loans maturing between 2009 and 2012. Here nearly 80% do not qualify.
Figure 12: Estimated percentage of loans that do not qualify for refinancing: NOI Scenario 1
Property Type # LoansBalance
($BB)# Loans Not Qualifying
Balance Not Qualifying
($BB)% Not Qualifying
(Loan Count)% Not Qualifying
(Balance)Hotel 79 2.7 51 2.1 64.6 77.7Industrial 53 0.6 39 0.4 73.6 73.0Multifamily 197 3.6 179 3.4 90.9 94.5Office 197 7.6 172 6.7 87.3 88.0Retail 118 2.0 96 1.9 81.4 94.6Multi Property 81 7.9 66 6.9 81.5 87.4Other 135 3.9 91 1.1 67.4 28.3Aggregate 860 28.2 694 22.5 80.7 79.6
2007 Vintage Loans Maturing 2009 - 2012
Refinancing Requirement: LTV < 70 & DSCR > 1.3
Source: Deutsche Bank
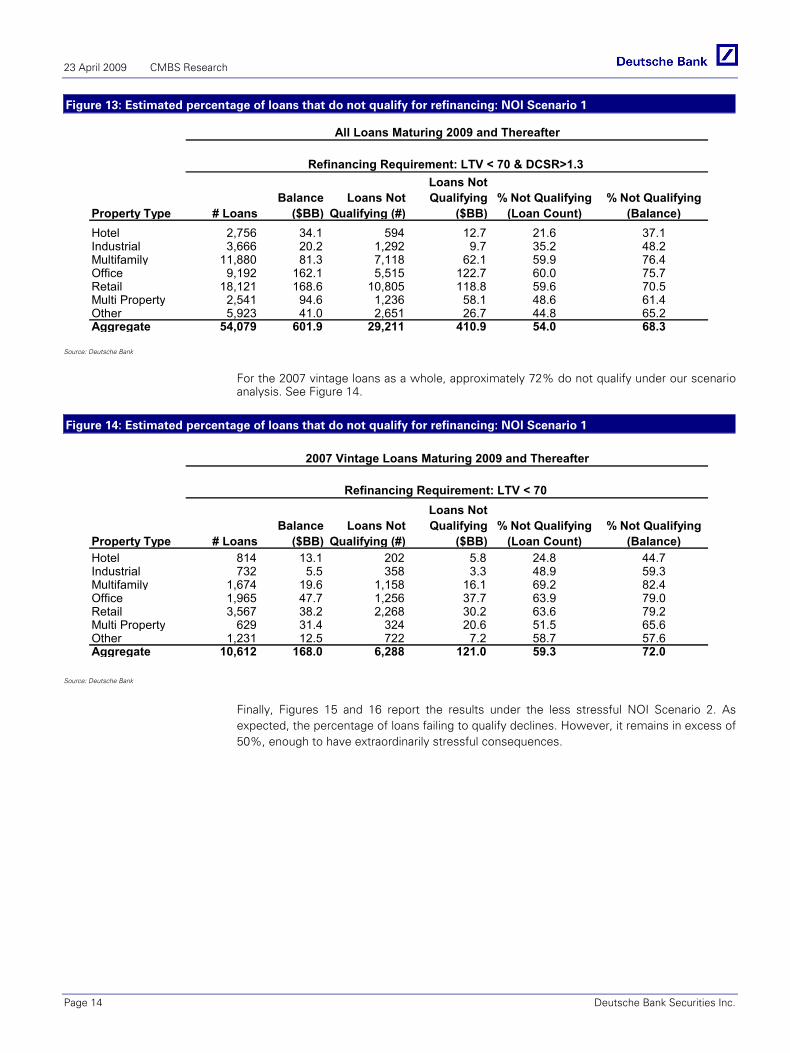
Figure 13 indicates that for all loans maturing in during 2009 and thereafter, effectively all outstanding loans, more than 68% ($411 billion out of $602 billion) do not qualify for refinancing.
23 April 2009 CMBS Research
Page 14 Deutsche Bank Securities Inc.
Figure 13: Estimated percentage of loans that do not qualify for refinancing: NOI Scenario 1
Property Type # LoansBalance
($BB)Loans Not
Qualifying (#)
Loans Not Qualifying
($BB)% Not Qualifying
(Loan Count)% Not Qualifying
(Balance)Hotel 2,756 34.1 594 12.7 21.6 37.1Industrial 3,666 20.2 1,292 9.7 35.2 48.2Multifamily 11,880 81.3 7,118 62.1 59.9 76.4Office 9,192 162.1 5,515 122.7 60.0 75.7Retail 18,121 168.6 10,805 118.8 59.6 70.5Multi Property 2,541 94.6 1,236 58.1 48.6 61.4Other 5,923 41.0 2,651 26.7 44.8 65.2Aggregate 54,079 601.9 29,211 410.9 54.0 68.3
All Loans Maturing 2009 and Thereafter
Refinancing Requirement: LTV < 70 & DCSR>1.3
Source: Deutsche Bank
For the 2007 vintage loans as a whole, approximately 72% do not qualify under our scenario analysis. See Figure 14.
Figure 14: Estimated percentage of loans that do not qualify for refinancing: NOI Scenario 1
Property Type # LoansBalance
($BB)Loans Not
Qualifying (#)
Loans Not Qualifying
($BB)% Not Qualifying
(Loan Count)% Not Qualifying
(Balance)Hotel 814 13.1 202 5.8 24.8 44.7Industrial 732 5.5 358 3.3 48.9 59.3Multifamily 1,674 19.6 1,158 16.1 69.2 82.4Office 1,965 47.7 1,256 37.7 63.9 79.0Retail 3,567 38.2 2,268 30.2 63.6 79.2Multi Property 629 31.4 324 20.6 51.5 65.6Other 1,231 12.5 722 7.2 58.7 57.6Aggregate 10,612 168.0 6,288 121.0 59.3 72.0
2007 Vintage Loans Maturing 2009 and Thereafter
Refinancing Requirement: LTV < 70
Source: Deutsche Bank
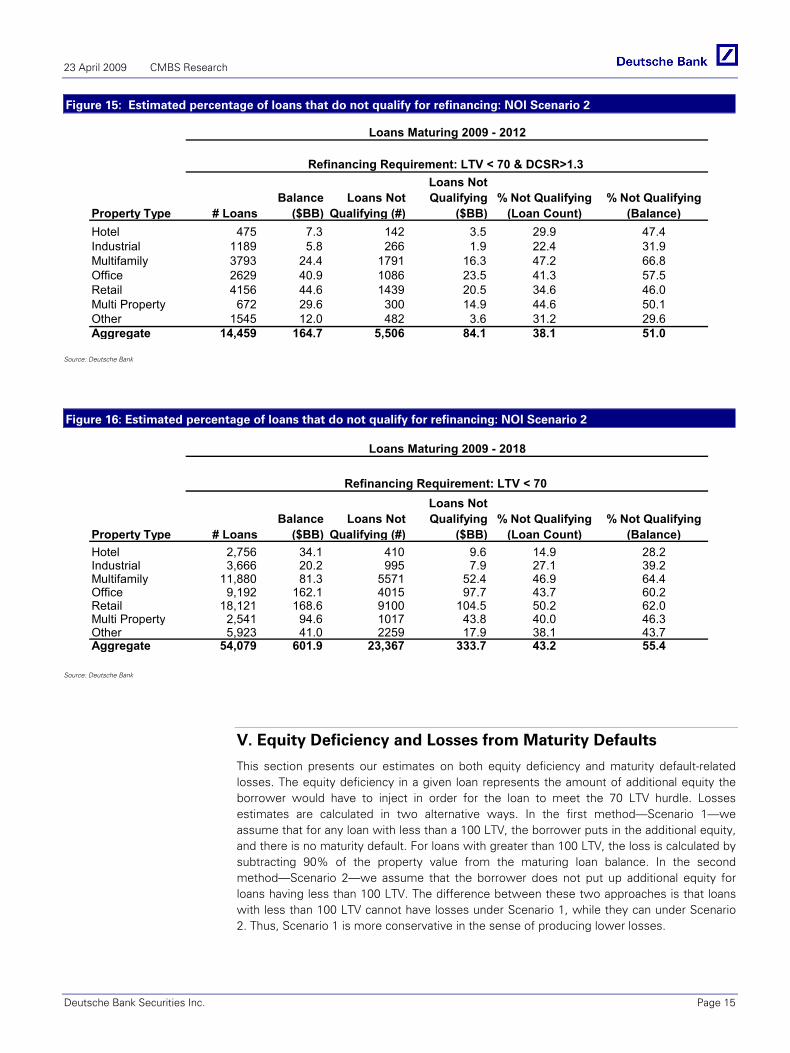
Finally, Figures 15 and 16 report the results under the less stressful NOI Scenario 2. As expected, the percentage of loans failing to qualify declines. However, it remains in excess of 50%, enough to have extraordinarily stressful consequences.
23 April 2009 CMBS Research
Deutsche Bank Securities Inc. Page 15
Figure 15: Estimated percentage of loans that do not qualify for refinancing: NOI Scenario 2
Property Type # LoansBalance
($BB)Loans Not
Qualifying (#)
Loans Not Qualifying
($BB)% Not Qualifying
(Loan Count)% Not Qualifying
(Balance)Hotel 475 7.3 142 3.5 29.9 47.4Industrial 1189 5.8 266 1.9 22.4 31.9Multifamily 3793 24.4 1791 16.3 47.2 66.8Office 2629 40.9 1086 23.5 41.3 57.5Retail 4156 44.6 1439 20.5 34.6 46.0Multi Property 672 29.6 300 14.9 44.6 50.1Other 1545 12.0 482 3.6 31.2 29.6Aggregate 14,459 164.7 5,506 84.1 38.1 51.0
Loans Maturing 2009 - 2012
Refinancing Requirement: LTV < 70 & DCSR>1.3
Source: Deutsche Bank
Figure 16: Estimated percentage of loans that do not qualify for refinancing: NOI Scenario 2
Property Type # LoansBalance
($BB)Loans Not
Qualifying (#)
Loans Not Qualifying
($BB)% Not Qualifying
(Loan Count)% Not Qualifying
(Balance)Hotel 2,756 34.1 410 9.6 14.9 28.2Industrial 3,666 20.2 995 7.9 27.1 39.2Multifamily 11,880 81.3 5571 52.4 46.9 64.4Office 9,192 162.1 4015 97.7 43.7 60.2Retail 18,121 168.6 9100 104.5 50.2 62.0Multi Property 2,541 94.6 1017 43.8 40.0 46.3Other 5,923 41.0 2259 17.9 38.1 43.7Aggregate 54,079 601.9 23,367 333.7 43.2 55.4
Loans Maturing 2009 - 2018
Refinancing Requirement: LTV < 70
Source: Deutsche Bank
V. Equity Deficiency and Losses from Maturity Defaults
This section presents our estimates on both equity deficiency and maturity default-related losses. The equity deficiency in a given loan represents the amount of additional equity the borrower would have to inject in order for the loan to meet the 70 LTV hurdle. Losses estimates are calculated in two alternative ways. In the first method—Scenario 1—we assume that for any loan with less than a 100 LTV, the borrower puts in the additional equity, and there is no maturity default. For loans with greater than 100 LTV, the loss is calculated by subtracting 90% of the property value from the maturing loan balance. In the second method—Scenario 2—we assume that the borrower does not put up additional equity for loans having less than 100 LTV. The difference between these two approaches is that loans with less than 100 LTV cannot have losses under Scenario 1, while they can under Scenario 2. Thus, Scenario 1 is more conservative in the sense of producing lower losses.
23 April 2009 CMBS Research
Page 16 Deutsche Bank Securities Inc.
In both calculations we use 90% of the estimated property value in order to account for:
1. The (quite significant) transactions costs associated with foreclosing upon and liquidating property, and
2. The fact that the liquidations will be taking place in an extremely stressed commercial real estate environment.
We believe that taking 90% of the property value is extremely conservative in this situation.
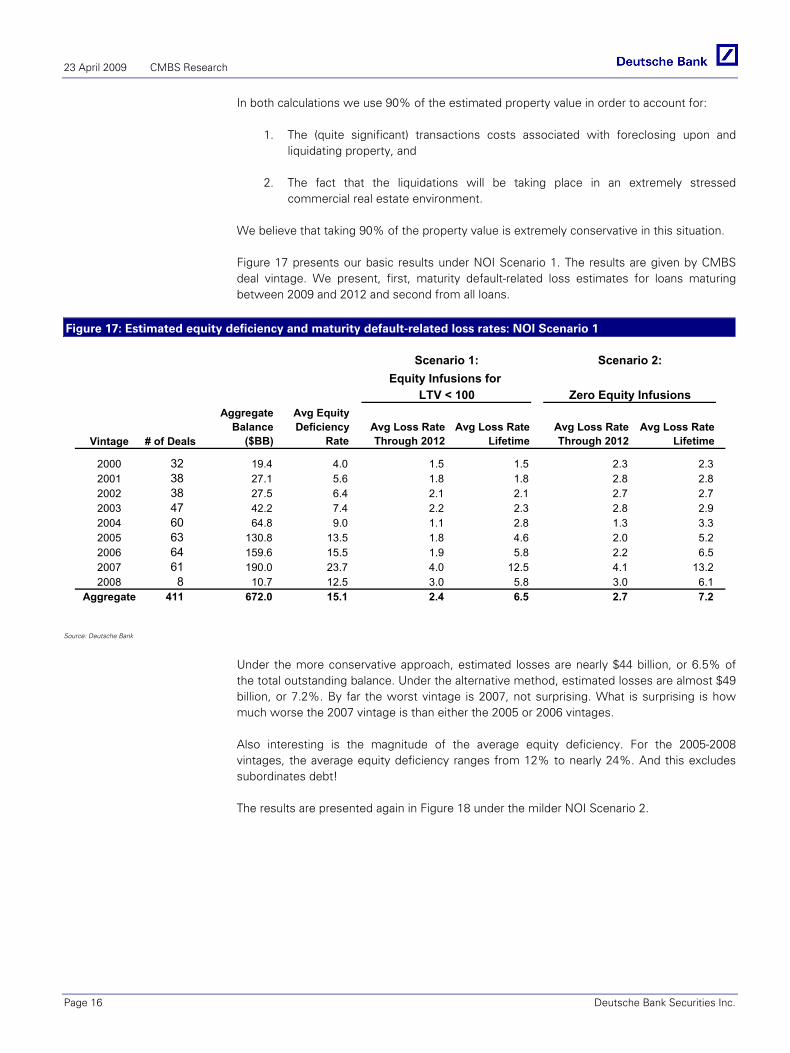
Figure 17 presents our basic results under NOI Scenario 1. The results are given by CMBS deal vintage. We present, first, maturity default-related loss estimates for loans maturing between 2009 and 2012 and second from all loans.
Figure 17: Estimated equity deficiency and maturity default-related loss rates: NOI Scenario 1
Vintage # of Deals
Aggregate Balance
($BB)
Avg Equity Deficiency
RateAvg Loss Rate Through 2012
Avg Loss Rate Lifetime
Avg Loss Rate Through 2012
Avg Loss Rate Lifetime
2000 32 19.4 4.0 1.5 1.5 2.3 2.32001 38 27.1 5.6 1.8 1.8 2.8 2.82002 38 27.5 6.4 2.1 2.1 2.7 2.72003 47 42.2 7.4 2.2 2.3 2.8 2.92004 60 64.8 9.0 1.1 2.8 1.3 3.32005 63 130.8 13.5 1.8 4.6 2.0 5.22006 64 159.6 15.5 1.9 5.8 2.2 6.52007 61 190.0 23.7 4.0 12.5 4.1 13.22008 8 10.7 12.5 3.0 5.8 3.0 6.1
Aggregate 411 672.0 15.1 2.4 6.5 2.7 7.2
LTV < 100 Zero Equity InfusionsEquity Infusions for
Scenario 1: Scenario 2:
Source: Deutsche Bank
Under the more conservative approach, estimated losses are nearly $44 billion, or 6.5% of the total outstanding balance. Under the alternative method, estimated losses are almost $49 billion, or 7.2%. By far the worst vintage is 2007, not surprising. What is surprising is how much worse the 2007 vintage is than either the 2005 or 2006 vintages.
Also interesting is the magnitude of the average equity deficiency. For the 2005-2008 vintages, the average equity deficiency ranges from 12% to nearly 24%. And this excludes subordinates debt!
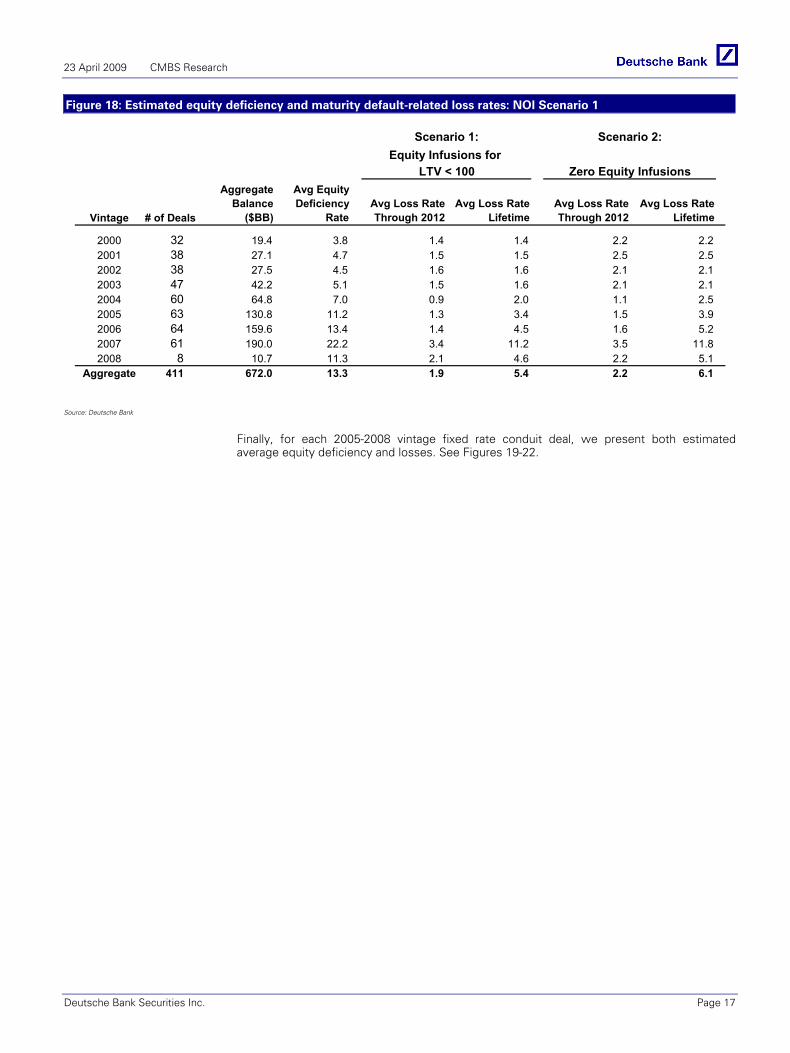
The results are presented again in Figure 18 under the milder NOI Scenario 2.
23 April 2009 CMBS Research
Deutsche Bank Securities Inc. Page 17
Figure 18: Estimated equity deficiency and maturity default-related loss rates: NOI Scenario 1
Vintage # of Deals
Aggregate Balance
($BB)
Avg Equity Deficiency
RateAvg Loss Rate Through 2012
Avg Loss Rate Lifetime
Avg Loss Rate Through 2012
Avg Loss Rate Lifetime
2000 32 19.4 3.8 1.4 1.4 2.2 2.22001 38 27.1 4.7 1.5 1.5 2.5 2.52002 38 27.5 4.5 1.6 1.6 2.1 2.12003 47 42.2 5.1 1.5 1.6 2.1 2.12004 60 64.8 7.0 0.9 2.0 1.1 2.52005 63 130.8 11.2 1.3 3.4 1.5 3.92006 64 159.6 13.4 1.4 4.5 1.6 5.22007 61 190.0 22.2 3.4 11.2 3.5 11.82008 8 10.7 11.3 2.1 4.6 2.2 5.1
Aggregate 411 672.0 13.3 1.9 5.4 2.2 6.1
LTV < 100 Zero Equity InfusionsEquity Infusions for
Scenario 1: Scenario 2:
Source: Deutsche Bank
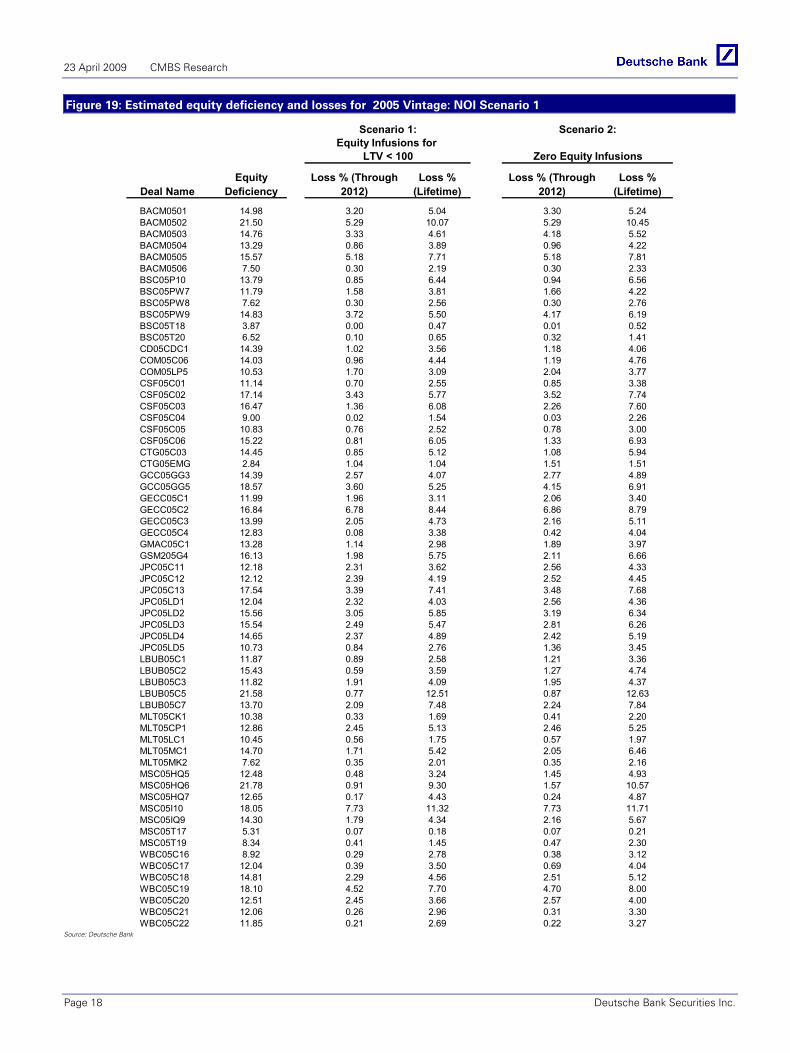
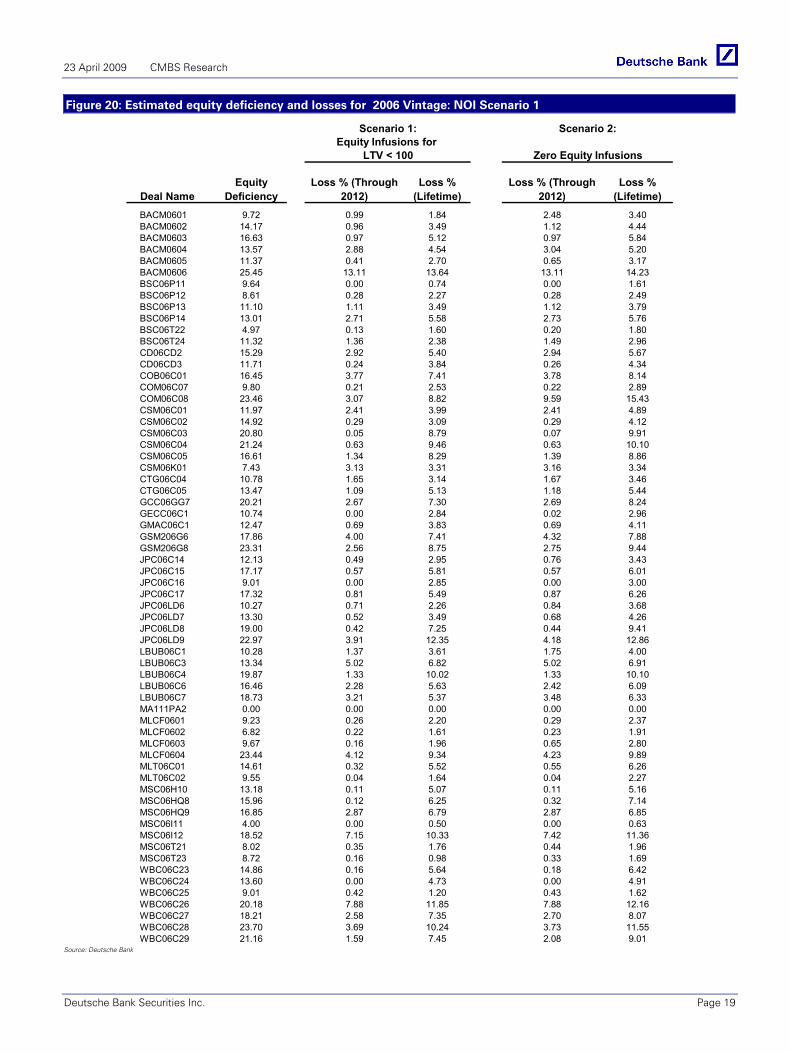
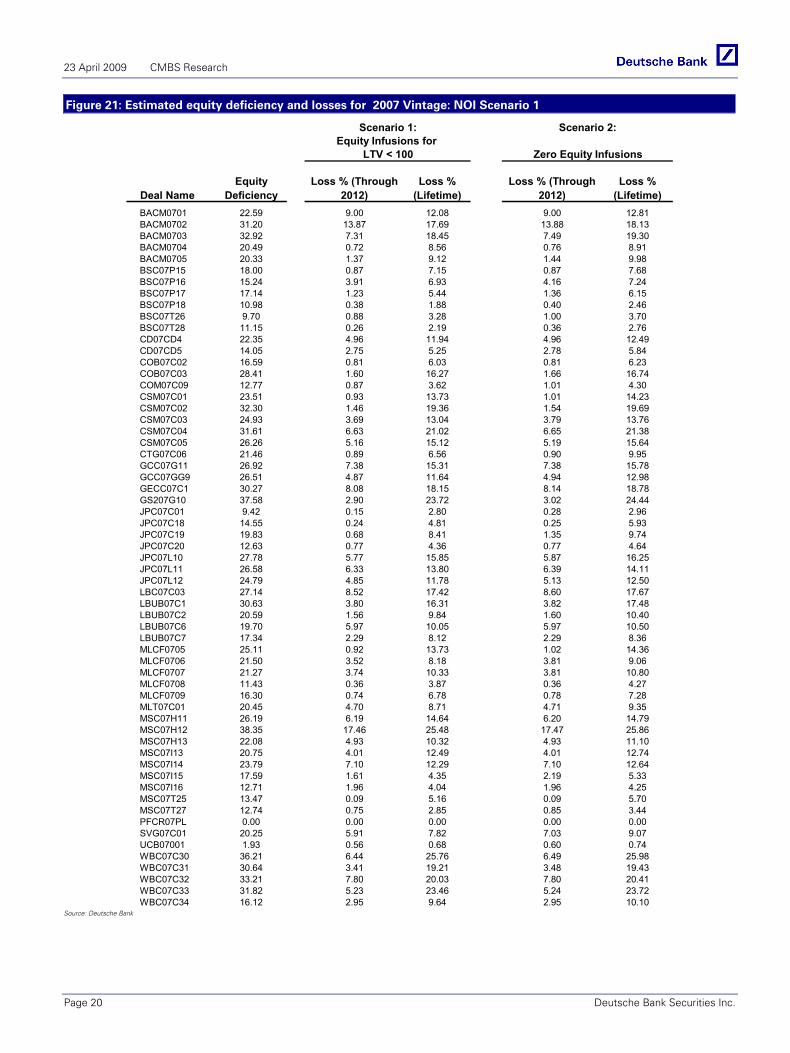
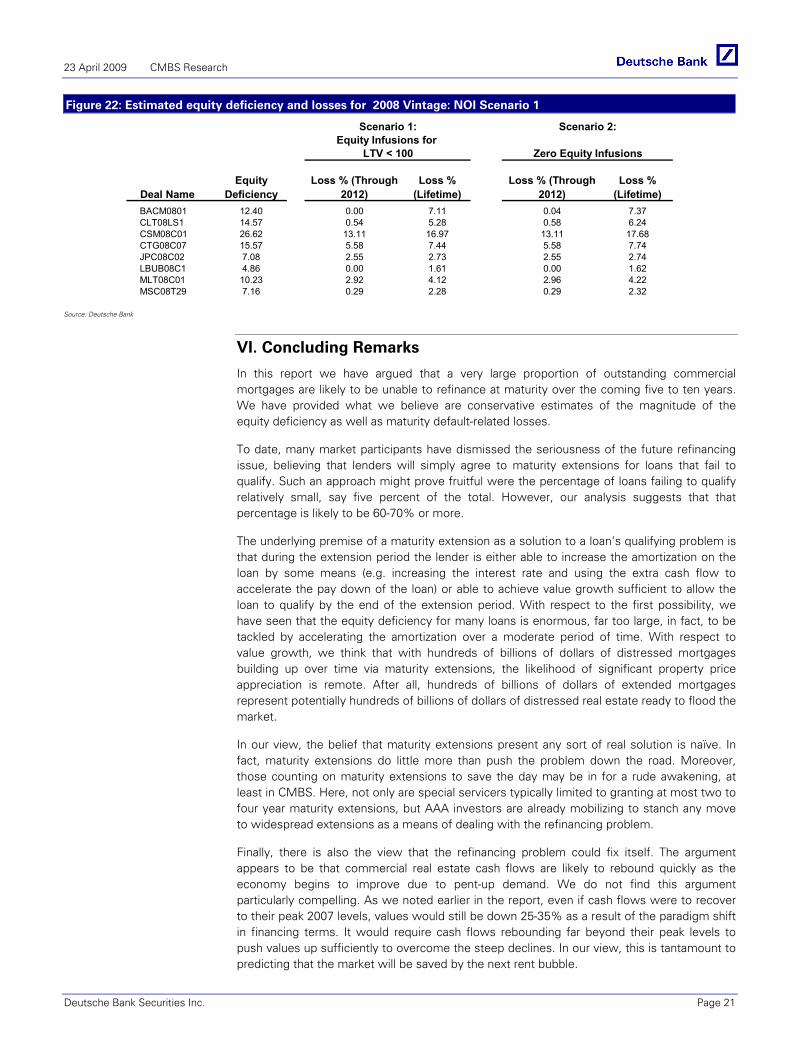
Finally, for each 2005-2008 vintage fixed rate conduit deal, we present both estimated average equity deficiency and losses. See Figures 19-22.
23 April 2009 CMBS Research
Page 18 Deutsche Bank Securities Inc.
Figure 19: Estimated equity deficiency and losses for 2005 Vintage: NOI Scenario 1
Deal NameEquity
DeficiencyLoss % (Through
2012)Loss %
(Lifetime)Loss % (Through
2012)Loss %
(Lifetime)
BACM0501 14.98 3.20 5.04 3.30 5.24BACM0502 21.50 5.29 10.07 5.29 10.45BACM0503 14.76 3.33 4.61 4.18 5.52BACM0504 13.29 0.86 3.89 0.96 4.22BACM0505 15.57 5.18 7.71 5.18 7.81BACM0506 7.50 0.30 2.19 0.30 2.33BSC05P10 13.79 0.85 6.44 0.94 6.56BSC05PW7 11.79 1.58 3.81 1.66 4.22BSC05PW8 7.62 0.30 2.56 0.30 2.76BSC05PW9 14.83 3.72 5.50 4.17 6.19BSC05T18 3.87 0.00 0.47 0.01 0.52BSC05T20 6.52 0.10 0.65 0.32 1.41CD05CDC1 14.39 1.02 3.56 1.18 4.06COM05C06 14.03 0.96 4.44 1.19 4.76COM05LP5 10.53 1.70 3.09 2.04 3.77CSF05C01 11.14 0.70 2.55 0.85 3.38CSF05C02 17.14 3.43 5.77 3.52 7.74CSF05C03 16.47 1.36 6.08 2.26 7.60CSF05C04 9.00 0.02 1.54 0.03 2.26CSF05C05 10.83 0.76 2.52 0.78 3.00CSF05C06 15.22 0.81 6.05 1.33 6.93CTG05C03 14.45 0.85 5.12 1.08 5.94CTG05EMG 2.84 1.04 1.04 1.51 1.51GCC05GG3 14.39 2.57 4.07 2.77 4.89GCC05GG5 18.57 3.60 5.25 4.15 6.91GECC05C1 11.99 1.96 3.11 2.06 3.40GECC05C2 16.84 6.78 8.44 6.86 8.79GECC05C3 13.99 2.05 4.73 2.16 5.11GECC05C4 12.83 0.08 3.38 0.42 4.04GMAC05C1 13.28 1.14 2.98 1.89 3.97GSM205G4 16.13 1.98 5.75 2.11 6.66JPC05C11 12.18 2.31 3.62 2.56 4.33JPC05C12 12.12 2.39 4.19 2.52 4.45JPC05C13 17.54 3.39 7.41 3.48 7.68JPC05LD1 12.04 2.32 4.03 2.56 4.36JPC05LD2 15.56 3.05 5.85 3.19 6.34JPC05LD3 15.54 2.49 5.47 2.81 6.26JPC05LD4 14.65 2.37 4.89 2.42 5.19JPC05LD5 10.73 0.84 2.76 1.36 3.45LBUB05C1 11.87 0.89 2.58 1.21 3.36LBUB05C2 15.43 0.59 3.59 1.27 4.74LBUB05C3 11.82 1.91 4.09 1.95 4.37LBUB05C5 21.58 0.77 12.51 0.87 12.63LBUB05C7 13.70 2.09 7.48 2.24 7.84MLT05CK1 10.38 0.33 1.69 0.41 2.20MLT05CP1 12.86 2.45 5.13 2.46 5.25MLT05LC1 10.45 0.56 1.75 0.57 1.97MLT05MC1 14.70 1.71 5.42 2.05 6.46MLT05MK2 7.62 0.35 2.01 0.35 2.16MSC05HQ5 12.48 0.48 3.24 1.45 4.93MSC05HQ6 21.78 0.91 9.30 1.57 10.57MSC05HQ7 12.65 0.17 4.43 0.24 4.87MSC05I10 18.05 7.73 11.32 7.73 11.71MSC05IQ9 14.30 1.79 4.34 2.16 5.67MSC05T17 5.31 0.07 0.18 0.07 0.21MSC05T19 8.34 0.41 1.45 0.47 2.30WBC05C16 8.92 0.29 2.78 0.38 3.12WBC05C17 12.04 0.39 3.50 0.69 4.04WBC05C18 14.81 2.29 4.56 2.51 5.12WBC05C19 18.10 4.52 7.70 4.70 8.00WBC05C20 12.51 2.45 3.66 2.57 4.00WBC05C21 12.06 0.26 2.96 0.31 3.30WBC05C22 11.85 0.21 2.69 0.22 3.27
Scenario 1:Equity Infusions for
LTV < 100
Scenario 2:
Zero Equity Infusions
Source: Deutsche Bank
23 April 2009 CMBS Research
Deutsche Bank Securities Inc. Page 19
Figure 20: Estimated equity deficiency and losses for 2006 Vintage: NOI Scenario 1
Deal NameEquity
DeficiencyLoss % (Through
2012)Loss %
(Lifetime)Loss % (Through
2012)Loss %
(Lifetime)BACM0601 9.72 0.99 1.84 2.48 3.40BACM0602 14.17 0.96 3.49 1.12 4.44BACM0603 16.63 0.97 5.12 0.97 5.84BACM0604 13.57 2.88 4.54 3.04 5.20BACM0605 11.37 0.41 2.70 0.65 3.17BACM0606 25.45 13.11 13.64 13.11 14.23BSC06P11 9.64 0.00 0.74 0.00 1.61BSC06P12 8.61 0.28 2.27 0.28 2.49BSC06P13 11.10 1.11 3.49 1.12 3.79BSC06P14 13.01 2.71 5.58 2.73 5.76BSC06T22 4.97 0.13 1.60 0.20 1.80BSC06T24 11.32 1.36 2.38 1.49 2.96CD06CD2 15.29 2.92 5.40 2.94 5.67CD06CD3 11.71 0.24 3.84 0.26 4.34COB06C01 16.45 3.77 7.41 3.78 8.14COM06C07 9.80 0.21 2.53 0.22 2.89COM06C08 23.46 3.07 8.82 9.59 15.43CSM06C01 11.97 2.41 3.99 2.41 4.89CSM06C02 14.92 0.29 3.09 0.29 4.12CSM06C03 20.80 0.05 8.79 0.07 9.91CSM06C04 21.24 0.63 9.46 0.63 10.10CSM06C05 16.61 1.34 8.29 1.39 8.86CSM06K01 7.43 3.13 3.31 3.16 3.34CTG06C04 10.78 1.65 3.14 1.67 3.46CTG06C05 13.47 1.09 5.13 1.18 5.44GCC06GG7 20.21 2.67 7.30 2.69 8.24GECC06C1 10.74 0.00 2.84 0.02 2.96GMAC06C1 12.47 0.69 3.83 0.69 4.11GSM206G6 17.86 4.00 7.41 4.32 7.88GSM206G8 23.31 2.56 8.75 2.75 9.44JPC06C14 12.13 0.49 2.95 0.76 3.43JPC06C15 17.17 0.57 5.81 0.57 6.01JPC06C16 9.01 0.00 2.85 0.00 3.00JPC06C17 17.32 0.81 5.49 0.87 6.26JPC06LD6 10.27 0.71 2.26 0.84 3.68JPC06LD7 13.30 0.52 3.49 0.68 4.26JPC06LD8 19.00 0.42 7.25 0.44 9.41JPC06LD9 22.97 3.91 12.35 4.18 12.86LBUB06C1 10.28 1.37 3.61 1.75 4.00LBUB06C3 13.34 5.02 6.82 5.02 6.91LBUB06C4 19.87 1.33 10.02 1.33 10.10LBUB06C6 16.46 2.28 5.63 2.42 6.09LBUB06C7 18.73 3.21 5.37 3.48 6.33MA111PA2 0.00 0.00 0.00 0.00 0.00MLCF0601 9.23 0.26 2.20 0.29 2.37MLCF0602 6.82 0.22 1.61 0.23 1.91MLCF0603 9.67 0.16 1.96 0.65 2.80MLCF0604 23.44 4.12 9.34 4.23 9.89MLT06C01 14.61 0.32 5.52 0.55 6.26MLT06C02 9.55 0.04 1.64 0.04 2.27MSC06H10 13.18 0.11 5.07 0.11 5.16MSC06HQ8 15.96 0.12 6.25 0.32 7.14MSC06HQ9 16.85 2.87 6.79 2.87 6.85MSC06I11 4.00 0.00 0.50 0.00 0.63MSC06I12 18.52 7.15 10.33 7.42 11.36MSC06T21 8.02 0.35 1.76 0.44 1.96MSC06T23 8.72 0.16 0.98 0.33 1.69WBC06C23 14.86 0.16 5.64 0.18 6.42WBC06C24 13.60 0.00 4.73 0.00 4.91WBC06C25 9.01 0.42 1.20 0.43 1.62WBC06C26 20.18 7.88 11.85 7.88 12.16WBC06C27 18.21 2.58 7.35 2.70 8.07WBC06C28 23.70 3.69 10.24 3.73 11.55WBC06C29 21.16 1.59 7.45 2.08 9.01
Scenario 1: Scenario 2:Equity Infusions for
LTV < 100 Zero Equity Infusions
Source: Deutsche Bank
23 April 2009 CMBS Research
Page 20 Deutsche Bank Securities Inc.
Figure 21: Estimated equity deficiency and losses for 2007 Vintage: NOI Scenario 1
Deal NameEquity
DeficiencyLoss % (Through
2012)Loss %
(Lifetime)Loss % (Through
2012)Loss %
(Lifetime)BACM0701 22.59 9.00 12.08 9.00 12.81BACM0702 31.20 13.87 17.69 13.88 18.13BACM0703 32.92 7.31 18.45 7.49 19.30BACM0704 20.49 0.72 8.56 0.76 8.91BACM0705 20.33 1.37 9.12 1.44 9.98BSC07P15 18.00 0.87 7.15 0.87 7.68BSC07P16 15.24 3.91 6.93 4.16 7.24BSC07P17 17.14 1.23 5.44 1.36 6.15BSC07P18 10.98 0.38 1.88 0.40 2.46BSC07T26 9.70 0.88 3.28 1.00 3.70BSC07T28 11.15 0.26 2.19 0.36 2.76CD07CD4 22.35 4.96 11.94 4.96 12.49CD07CD5 14.05 2.75 5.25 2.78 5.84COB07C02 16.59 0.81 6.03 0.81 6.23COB07C03 28.41 1.60 16.27 1.66 16.74COM07C09 12.77 0.87 3.62 1.01 4.30CSM07C01 23.51 0.93 13.73 1.01 14.23CSM07C02 32.30 1.46 19.36 1.54 19.69CSM07C03 24.93 3.69 13.04 3.79 13.76CSM07C04 31.61 6.63 21.02 6.65 21.38CSM07C05 26.26 5.16 15.12 5.19 15.64CTG07C06 21.46 0.89 6.56 0.90 9.95GCC07G11 26.92 7.38 15.31 7.38 15.78GCC07GG9 26.51 4.87 11.64 4.94 12.98GECC07C1 30.27 8.08 18.15 8.14 18.78GS207G10 37.58 2.90 23.72 3.02 24.44JPC07C01 9.42 0.15 2.80 0.28 2.96JPC07C18 14.55 0.24 4.81 0.25 5.93JPC07C19 19.83 0.68 8.41 1.35 9.74JPC07C20 12.63 0.77 4.36 0.77 4.64JPC07L10 27.78 5.77 15.85 5.87 16.25JPC07L11 26.58 6.33 13.80 6.39 14.11JPC07L12 24.79 4.85 11.78 5.13 12.50LBC07C03 27.14 8.52 17.42 8.60 17.67LBUB07C1 30.63 3.80 16.31 3.82 17.48LBUB07C2 20.59 1.56 9.84 1.60 10.40LBUB07C6 19.70 5.97 10.05 5.97 10.50LBUB07C7 17.34 2.29 8.12 2.29 8.36MLCF0705 25.11 0.92 13.73 1.02 14.36MLCF0706 21.50 3.52 8.18 3.81 9.06MLCF0707 21.27 3.74 10.33 3.81 10.80MLCF0708 11.43 0.36 3.87 0.36 4.27MLCF0709 16.30 0.74 6.78 0.78 7.28MLT07C01 20.45 4.70 8.71 4.71 9.35MSC07H11 26.19 6.19 14.64 6.20 14.79MSC07H12 38.35 17.46 25.48 17.47 25.86MSC07H13 22.08 4.93 10.32 4.93 11.10MSC07I13 20.75 4.01 12.49 4.01 12.74MSC07I14 23.79 7.10 12.29 7.10 12.64MSC07I15 17.59 1.61 4.35 2.19 5.33MSC07I16 12.71 1.96 4.04 1.96 4.25MSC07T25 13.47 0.09 5.16 0.09 5.70MSC07T27 12.74 0.75 2.85 0.85 3.44PFCR07PL 0.00 0.00 0.00 0.00 0.00SVG07C01 20.25 5.91 7.82 7.03 9.07UCB07001 1.93 0.56 0.68 0.60 0.74WBC07C30 36.21 6.44 25.76 6.49 25.98WBC07C31 30.64 3.41 19.21 3.48 19.43WBC07C32 33.21 7.80 20.03 7.80 20.41WBC07C33 31.82 5.23 23.46 5.24 23.72WBC07C34 16.12 2.95 9.64 2.95 10.10
Scenario 1: Scenario 2:Equity Infusions for
LTV < 100 Zero Equity Infusions
Source: Deutsche Bank
23 April 2009 CMBS Research
Deutsche Bank Securities Inc. Page 21
Figure 22: Estimated equity deficiency and losses for 2008 Vintage: NOI Scenario 1
Deal NameEquity
DeficiencyLoss % (Through
2012)Loss %
(Lifetime)Loss % (Through
2012)Loss %
(Lifetime)BACM0801 12.40 0.00 7.11 0.04 7.37CLT08LS1 14.57 0.54 5.28 0.58 6.24CSM08C01 26.62 13.11 16.97 13.11 17.68CTG08C07 15.57 5.58 7.44 5.58 7.74JPC08C02 7.08 2.55 2.73 2.55 2.74LBUB08C1 4.86 0.00 1.61 0.00 1.62MLT08C01 10.23 2.92 4.12 2.96 4.22MSC08T29 7.16 0.29 2.28 0.29 2.32
Scenario 1: Scenario 2:Equity Infusions for
LTV < 100 Zero Equity Infusions
Source: Deutsche Bank
VI. Concluding Remarks
In this report we have argued that a very large proportion of outstanding commercial mortgages are likely to be unable to refinance at maturity over the coming five to ten years. We have provided what we believe are conservative estimates of the magnitude of the equity deficiency as well as maturity default-related losses.
To date, many market participants have dismissed the seriousness of the future refinancing issue, believing that lenders will simply agree to maturity extensions for loans that fail to qualify. Such an approach might prove fruitful were the percentage of loans failing to qualify relatively small, say five percent of the total. However, our analysis suggests that that percentage is likely to be 60-70% or more.
The underlying premise of a maturity extension as a solution to a loan’s qualifying problem is that during the extension period the lender is either able to increase the amortization on the loan by some means (e.g. increasing the interest rate and using the extra cash flow to accelerate the pay down of the loan) or able to achieve value growth sufficient to allow the loan to qualify by the end of the extension period. With respect to the first possibility, we have seen that the equity deficiency for many loans is enormous, far too large, in fact, to be tackled by accelerating the amortization over a moderate period of time. With respect to value growth, we think that with hundreds of billions of dollars of distressed mortgages building up over time via maturity extensions, the likelihood of significant property price appreciation is remote. After all, hundreds of billions of dollars of extended mortgages represent potentially hundreds of billions of dollars of distressed real estate ready to flood the market.
In our view, the belief that maturity extensions present any sort of real solution is naïve. In fact, maturity extensions do little more than push the problem down the road. Moreover, those counting on maturity extensions to save the day may be in for a rude awakening, at least in CMBS. Here, not only are special servicers typically limited to granting at most two to four year maturity extensions, but AAA investors are already mobilizing to stanch any move to widespread extensions as a means of dealing with the refinancing problem.
Finally, there is also the view that the refinancing problem could fix itself. The argument appears to be that commercial real estate cash flows are likely to rebound quickly as the economy begins to improve due to pent-up demand. We do not find this argument particularly compelling. As we noted earlier in the report, even if cash flows were to recover to their peak 2007 levels, values would still be down 25-35% as a result of the paradigm shift in financing terms. It would require cash flows rebounding far beyond their peak levels to push values up sufficiently to overcome the steep declines. In our view, this is tantamount to predicting that the market will be saved by the next rent bubble.
23 April 2009 CMBS Research
Page 22 Deutsche Bank Securities Inc.
Appendix 1 Important Disclosures
Additional information available upon request
For disclosures pertaining to recommendations or estimates made on a security mentioned in this report, please see the most recently published company report or visit our global disclosure look-up page on our website at http://gm.db.com/ger/disclosure/DisclosureDirectory.eqsr.
Analyst Certification
The views expressed in this report accurately reflect the personal views of the undersigned lead analyst(s). In addition, the undersigned lead analyst(s) has not and will not receive any compensation for providing a specific recommendation or view in this report. Richard Parkus
Deutsche Bank debt rating key
Buy: These bonds are expected to outperform other issues in the sector/industry group over the next three to six-month period. Hold: These bonds are fairly valued currently. If owned, no need to sell, but we await events/ releases/ conditions that would make the bond attractive enough for us to upgrade. In the interim, the bond will likely perform as well as the average issue in the sector/industry group. Sell: There exists a significant likelihood that these bonds will underperform relative to other issues in their sector/industry group, at least over the next three months.

23 April 2009 CMBS Research
Deutsche Bank Securities Inc. Page 23
Regulatory Disclosures
1. Important Additional Conflict Disclosures
Aside from within this report, important conflict disclosures can also be found at https://gm.db.com/equities under the "Disclosures Lookup" and "Legal" tabs. Investors are strongly encouraged to review this information before investing.
2. Short-Term Trade Ideas
Deutsche Bank equity research analysts sometimes have shorter-term trade ideas (known as SOLAR ideas) that are consistent or inconsistent with Deutsche Bank's existing longer term ratings. These trade ideas can be found at the SOLAR link at http://gm.db.com.
3. Country-Specific Disclosures
Australia: This research, and any access to it, is intended only for "wholesale clients" within the meaning of the Australian Corporations Act. EU countries: Disclosures relating to our obligations under MiFiD can be found at http://globalmarkets.db.com/riskdisclosures. Japan: Disclosures under the Financial Instruments and Exchange Law: Company name – Deutsche Securities Inc. Registration number – Registered as a financial instruments dealer by the Head of the Kanto Local Finance Bureau (Kinsho) No. 117. Member of associations: JSDA, The Financial Futures Association of Japan. This report is not meant to solicit the purchase of specific financial instruments or related services. We may charge commissions and fees for certain categories of investment advice, products and services. Recommended investment strategies, products and services carry the risk of losses to principal and other losses as a result of changes in market and/or economic trends, and/or fluctuations in market value. Before deciding on the purchase of financial products and/or services, customers should carefully read the relevant disclosures, prospectuses and other documentation. Malaysia: Deutsche Bank AG and/or its affiliate(s) may maintain positions in the securities referred to herein and may from time to time offer those securities for purchase or may have an interest to purchase such securities. Deutsche Bank may engage in transactions in a manner inconsistent with the views discussed herein. New Zealand: This research is not intended for, and should not be given to, "members of the public" within the meaning of the New Zealand Securities Market Act 1988. Russia: This information, interpretation and opinions submitted herein are not in the context of, and do not constitute, any appraisal or evaluation activity requiring a license in the Russian Federation.
David Folkerts-Landau Managing Director
Global Head of Research
Stuart Parkinson Chief Operating Officer
Guy Ashton Global Head Company Research
Marcel Cassard Global Head Fixed Income Strategies and Economics
Germany Asia-Pacific Americas
Andreas Neubauer Regional Head
Michael Spencer Regional Head
Steve Pollard Regional Head
Principal Locations
Deutsche Bank AG London 1 Great Winchester Street London EC2N 2EQ Tel: (44) 20 7545 8000
Deutsche Bank AG New York 60 Wall Street New York, NY 10005 United States of America Tel: (1) 212 250-2500
Deutsche Bank AG Hong Kong Cheung Kong Center, 2 Queen's Road Central Hong Kong Tel: (52) 2203 8888
Deutsche Bank AG Japan 2-11-1 Nagatacho Sanno Park Tower Chiyoda-ku, Tokyo 100-6171 Tel: (81) 3 5156 6701
Deutsche Bank AG Frankfurt Große Gallusstraße 10-14 60272 Frankfurt am Main Germany Tel: (49) 69 910 00
Deutsche Bank AG Aurora business park 82 bld.2 Sadovnicheskaya street Moscow, 115035 Russia Tel: (7) 495 797-5000
Deutsche Bank AG Singapore One Raffles Quay South Tower Singapore 048583 Tel: (65) 6423 8001
Deutsche Bank AG Australia Deutsche Bank Place, Level 16 Corner of Hunter & Phillip Streets Sydney NSW 2000 Tel: (61) 2 8258 1234
Deutsche Bank Dubai Dubai International Financial Centre The Gate, West Wing, Level 3 P.O. Box 504 902 Dubai City Tel: (971) 4 3611 700
Subscribers to research via email receive their electronic publication on average 1-2 working days earlier than the printed version.
If you would like to receive this or any other product via email please contact your usual Deutsche Bank representative.
Publication Address: Deutsche Bank Securities Inc. 60 Wall Street New York, NY 10005 United States of America (1) 212 250 2500
Internet: http://gmr.db.com Ask your usual contact for a username and password.
Global Disclaimer
The information and opinions in this report were prepared by Deutsche Bank AG or one of its affiliates (collectively "Deutsche Bank"). The information herein is believed to be reliable and has been obtained from public sources believed to be reliable. Deutsche Bank makes no representation as to the accuracy or completeness of such information.
Deutsche Bank may (1) engage in securities transactions in a manner inconsistent with this research report, (2) with respect to securities covered by this report, sell to or buy from customers on a principal basis, and (3) consider this report in deciding to trade on a proprietary basis.
Opinions, estimates and projections in this report constitute the current judgment of the author as of the date of this report. They do not necessarily reflect the opinions of Deutsche Bank and are subject to change without notice. Deutsche Bank has no obligation to update, modify or amend this report or to otherwise notify a recipient thereof in the event that any opinion, forecast or estimate set forth herein, changes or subsequently becomes inaccurate. Prices and availability of financial instruments are subject to change without notice. This report is provided for informational purposes only. It is not an offer or a solicitation of an offer to buy or sell any financial instruments or to participate in any particular trading strategy.
The financial instruments discussed in this report may not be suitable for all investors and investors must make their own informed investment decisions. Stock transactions can lead to losses as a result of price fluctuations and other factors. If a financial instrument is denominated in a currency other than an investor's currency, a change in exchange rates may adversely affect the investment. Past performance is not necessarily indicative of future results.
Unless governing law provides otherwise, all transactions should be executed through the Deutsche Bank entity in the investor's home jurisdiction. In the U.S. this report is approved and/or distributed by Deutsche Bank Securities Inc., a member of the NYSE, the NASD, NFA and SIPC. In Germany this report is approved and/or communicated by Deutsche Bank AG Frankfurt authorized by the BaFin. In the United Kingdom this report is approved and/or communicated by Deutsche Bank AG London, a member of the London Stock Exchange and regulated by the Financial Services Authority for the conduct of investment business in the UK and authorized by the BaFin. This report is distributed in Hong Kong by Deutsche Bank AG, Hong Kong Branch, in Korea by Deutsche Securities Korea Co. and in Singapore by Deutsche Bank AG, Singapore Branch. In Japan this report is approved and/or distributed by Deutsche Securities Inc. The information contained in this report does not constitute the provision of investment advice. In Australia, retail clients should obtain a copy of a Product Disclosure Statement (PDS) relating to any financial product referred to in this report and consider the PDS before making any decision about whether to acquire the product. Deutsche Bank AG Johannesburg is incorporated in the Federal Republic of Germany (Branch Register Number in South Africa: 1998/003298/10). Additional information relative to securities, other financial products or issuers discussed in this report is available upon request. This report may not be reproduced, distributed or published by any person for any purpose without Deutsche Bank's prior written consent. Please cite source when quoting.
Copyright © 2009 Deutsche Bank AG