the frequency distribution of water characteristics in the pacific ocean
TRANSCRIPT

The frequency distribution of water characteristics in the Pacific Ocean
JOHN D. CoC~mA~,m
(Received 1 April 1958)
Al~ract--The bivariatc distribution of water characteristics in the Pacific Ocean is studied using 155 hydrographic stations. Separate diagrams of potential temperature against salinity give the distributions for the North, the South, and the entire Pacific Ocean. The dominant feature in all the diagrams, an enormous mode near 1-5 C, 34.7 per mille, results largely from water below 2000 m. The mode is at 1.75 C in the South Pacific distribution. It is stronger in the North Pacific distribution and lies at 1.25 C. This lower temperature is surprising, but apparently explicable. A mode. at 4.5 C, 34.55 per mille, Tropical Water, is due mainly to water between the Tropics at depths from 700m. to 1100 m. It is associated with a layer of minimum salinity extending through much of its region of occurrence. Two other waters characterized by extensive salinity minimum layers are represented by ridges in the distributions. These are identified and their relationships with Tropical Water discussed. Also discernible in the distributions are features representing the water of the thermocline layers above the salinity minimum layers. Surface layers account for most of the spreading of the distributions from the modes and important ridges. Unlike the Atlantic and Indian Oceans, the Pacific shows no modes which are far removed from the principal ones. Univariate distributions of characteristics are presented. Means and certain percentiles are tabulated.
INTRODUCTION
ALTHOUGH the temperature-salinity diagram has long been the most familiar means of comparing and classifying ocean waters, its suitability in representing bivariate frequency distributions of the water characteristics, temperature and salinity, has hardly been exploited. This aspect of the diagram is partially recognized when a large number of serial observations is plotted as a scatter diagram in temperature- salinity co-ordinates, as for example, by HELLA~'D-HANSEN and NANSEN (1926). But the first entirely quantitative representation of a distribution by means of the diagram seems to have been given by MONTGOMERY (1955) for surface temperatures and salinities at Weather Ship J.
In the present paper, the frequency distributions of Pacific water characteristics are presented in a series of diagrams. Distributions are given for the North and South Pacific separately as well as for the entire Pacific. The paper is one of a group of three forming an ocean-wide survey of water characteristics. It is the second paper by the author dealing with the frequency distribution of Pacific Water character- istics. The first (CocnRAN~, 1956) was concerned with surface water.
The distributions presented are first approximations. Great accuracy is precluded by the scarcity of data in many parts of the Pacific Ocean, especially in the South Pacific. Reliable representation of major features, however, is an aim of the present study. No attempt was made to take account of seasonal or other time variation, although with bathythermograph data this seems possible for the North Pacific. Frequency is consequently expressed in terms of volume.
111
112 JOHN D . COCHRANE
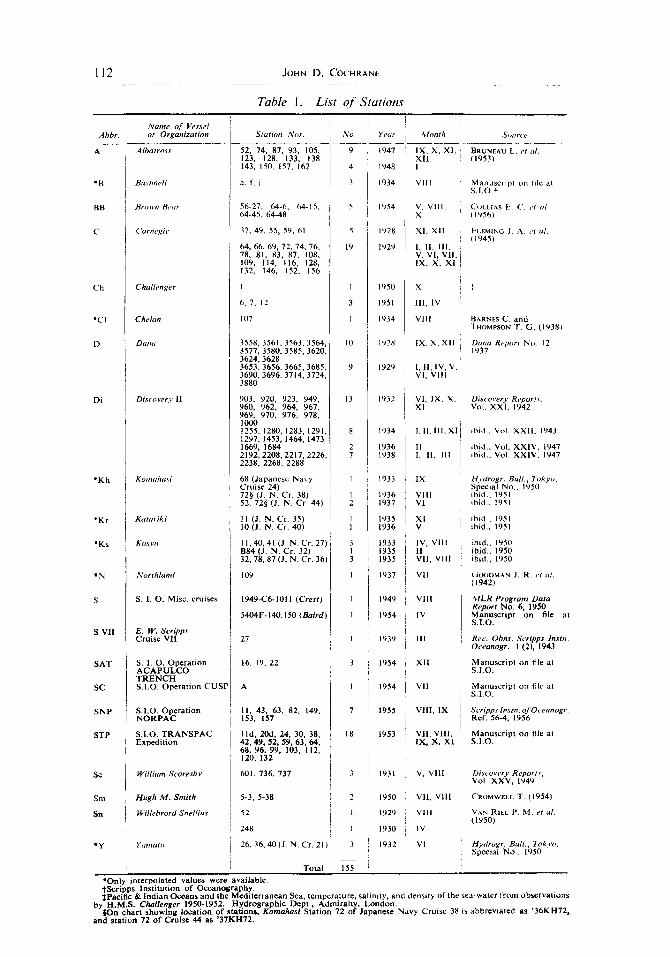
Table 1. List of Stations
Abbr.
A
*B
BB
C
Ch
"CI
D
Di
"Kh
*Kr
*Ks
*N
S
S VII
SAT
SC
SNP
STP
Sc
Sm
Sn
- y
Name of Vessel or Organization
Albatros~
Bushnell
Brown Bear
Carnegie
Challenger
Chelan
Dana
Discovery II
Komahasi
Katuriki
Kosva
Northland
S. 1. O. Misc. cruises
E. W. Scripps Cruise VII
S . I . O . Operation A C A P U L C O T R E N C H S.1.O. O p e r a t i o n C U S P
S.1.O. Operation N O R P A C
S.I.O. T R A N S P A C Expedition
William Seoresby
Hugh M. Smith
Willebrord Snellius
Yamato
Station Nos,
52, 74, 87. 93, 105, 123, 128, 133, 138 143. 150, 157, 162
a , f . j
56-27, 64-6. 64-15. 64-45, 64-48
37, 49, 55, 59, 61
64, 66 ,69 ,72 ,74 ,76 , 78, 81, 83, 87, 108, 109, 114, 116, 128, 132, 146, 152, 156
I
6, 7, 12
107
3558, 3561,3563, 3564, 3577, 3580, 3585, 3620, 3624, 3628 3653, 3656. 3665, 3685, 3690, 3696. 3714, 3724, 3880
903. 920, 923, 949, 960, 962, 964, 967, 969, 970, 976, 978, 1000 1255, 1280, 1283, 1291, 1297, 1453, 1464, 1473 1669, 1684 2192, 2208, 2217. 2226, 2238, 2268, 2288
68 (Japanese Navy Cruise 24) 72§ (J. N. Cr. 38) 52, 72§ (J. N. Cr. 44)
I I (J, N . Cr. 35) 10 (J. N. Cr. 40)
11,40, 41 (J. N. Cr. 27) B84 (J. N . Cr. 32l i 32, 78, 87 (J. N. Cr. 36)
109
1949-C6-1011 (Crest)
5404 F- 140.150 (Baird)
27 i
16, 19. 22 ] r
A
11, 43, 63, 82, 149, 153, 157
l id , 20d, 24, 30, 38, 42,49, 52,59, 63,64, 68, 96 , 99 , 103, 112, 120, 132
601, 736, 737
No.
9
4
3
5
5
19
I
3
I
10
9
13
3
1
7
18
5-3, 5-38
52
248
26, 36, 40 (J. N. Cr. 21 )
Total i 155
J Year [
947--!
1948 [
1934 i
i 1954 ]
1928
1929
1950
1951
1934
1928
1929
1932
1934
1936 1938
1933
1936 1937
1935 1936
1933 1935 1935
1937
1949
1954
1939
1954
1954
1955
1953
1931
1950
1929
1930
1932
Month Source
1×, X, Xl, XII I
VIII
V, VIII, X
X1, XII
1, 11, 111, V, VI, VII, IX, X. XI
X
111, IV
VIII
IX . X, X l l
1, 11, IV, V, Vl. VIII
Vl, IX, X, XI j
1, I1, III, Xt i
ii i 1, I1, Ill
IX
VIII VI
XI V
IV, VIII II VII, VIII
VII
VIII
IV
111
XII
Vll
VIII, 1X
VII, VIII , IX, X, XI
V, VIII
VII, VIII
VIII
IV
VI
~IRUNEAU L, el al. (1953)
Manuscript on file at S.I.O t
C()LLIAS E, C. ~'f ~tl. (1956)
[:LEMtNG J. A. el al. (19451
BARNES C. and THOMPSON T. G. (1938l
Duna Report N o 12 1937
Discovery Reports. Vol. XXI, 1942
ibid., Vol. XXII , 1943
ibid., Vol. XXIV, 1947 ibid., Vol. XX1V, 1947
Hydrogr. Bull., Tokyo, Special No., 1950 ibid., 1951 ibid., 195t
ibid., 1951 ib id . 1951
ibid,, 1950 ibid.. 1950 ibid., 1950
GOODMAN J. R. et a/. (1942)
MLR Program Data Report No. 6, 1950 Manuscript on file at S.1,O.
Rec. Obns. Scripps lnstn. Oceanogr. 1 (2), 1943
Manuscript on tile at S.I.O.
Manuscript on file at S.LO.
Scripps lnsm. oJ Oceanogr. Ref. 56-4, 1956
Manuscript on file at SAD.
Discovery Reports, Vol. XXV, 1949
CROMWELL T. (1954)
VAN RIEL P. M. et al. (1950)
Hydrogr. Bull., Tokyo, Special No.. 1950
*Only interpolated values were available. tScr ipps Institution of Oceanography. ~Pacific & Indian Oceans and the Mediterranean Sea, temperature, salinity, and density of the sea-water from observations
by H M,S. Challenger 1950-1952. Hydrographic Dept., Admiralty, London. f~On chart showing location of stations, Komahasl Station 72 of Japanese Navy Cruise 38 is abbreviated as '36KH72,
and station 72 of Cruise 44 as '37KH72.

S~rP
Z~)
Sll°p
u iO
-f
G1
J(
7
~,~I
~,~
%..
%
m
f ./
¢ !1
$~' ~1
0 ~
¢o~t
Dim
•
p c%
-f
~
g •
Fig.
1.
Loc
atio
n of
sta
tion
s.
Cir
cles
rep
rese
nt s
tati
ons
used
at
all
dept
hs,
X's
sta
tion
s us
ed o
nly
at g
reat
er
dept
hs.
A,
Alb
atro
ss ;
B,
Bus
hnel
l ;
BB
, B
row
n B
ear
; C
, C
arne
gie
; C
h, C
hall
enge
r ;
CI,
Che
lan
; D,
Dan
a ;
Di,
Dis
cove
ry 1
[ ; K
h, K
omah
asi
; Kr,
Kat
urik
i ; K
s, K
osyu
; N
, N
orth
land
;
S, S
crip
ps I
nsti
tuti
on o
f O
cean
ogra
phy
(S.I
.O.),
mis
cella
neou
s ;
S V
II,
E.
W.
Scri
pps,
Cru
ise
VII
;
SAT
, S.
I.O
. O
pera
tion
A
CA
PU
LC
O
TR
EN
CH
; SC
, S.
I.O
. O
pera
tion
C
USP
; SN
P,
S.I.
O.
Ope
rati
on N
OR
PA
C ;
ST
P, S
.I.O
. T
RA
NSP
AC
Exp
edit
ion
; Sc
, W
illi
am S
core
sby
; Si
n, H
ugh
M.
Smit
h ;
Sn,
Wil
lebr
ord
Snel
lius
; Y
, Y
amat
o.

The frequency distribution of water characteristics in the Pacific Ocean 113
METHOD
The defini t ions o f the Pacific Ocean arid the N o r t h and South port ioris fol low those given in Die Grenzen der Ozeane und ihre Nebenmeere (ANON., 1939). Adjacen t
seas are included. Es t imates o f the d is t r ibut ions are based on a selected g roup o f hydrograph ic
stat ions. Each pa i r o f t empera tu re and sal ini ty values at a s ta t ion is taken as typical o f a volume su r round ing the pair . The magni tude o f the volume depends on the vertical and hor izonta l spacing between observat ions. The volumes typified by character is t ics within selected intervals are to ta l led to ob ta in the d is t r ibut ion o f volume among characteris t ics .
Ideal ly , the selected s ta t ions would be un i formly spaced and would reach to the bo t tom. Actua l ly , such a g roup canno t be approx ima ted even roughly in the Pacific Ocean unless the spacing is so wide tha t many well es tabl i shed features o f the tem- pera ture and sal ini ty s t ructure are ignored. Sampl ing known impor t an t features is
favoured over un i fo rm spacing. The s tat ions on which this s tudy is based are listed in Table i and their locat ions
shown in Fig. 1. Wherever possible, observed rather than interpolated values are employed. For some localities,
however, only the interpolated values at hydrographic stations are published. There are 22 such stations used in the present study.
As many of the stations selected do not reach to sufficient depth, values from neighbouring stations are used. In seven cases deep values are taken from stations which are not suitable for representation of the shallower layers. These stations are indicated in Fig. 1.
Table 2. Volume distribution o f potential specific volume anomaly. Volume in 104 k m s
Potential specific volume anomaly,
in ci t-1
O- 9 10- 19 20- 29 30- 39 40- 49
50- 59 60-- 69 70- 79 80- 89 90- 99
100-109 110-119 120-129 i 30-139 140-149
Portion of Pacific Ocean
Entre
0 328
14637 22667 10819
3550 3718 2940 2258 2012
2328 1128 792 759 432
North South
0 0 25 303
5209 9428 13559 9108 5012 5807
1556 1994 1833 1885 1485 1455 806 1452 556 1456
724 1604 438 690 417 375 476 283 290 142
Potential specific volume anomaly,
in cl t-t
0 - 4 9 50-99
100-149 150-199 200-249 250-299 300-349 350-399 400-449 450-499 500-549 550-599 600--649 650-699 700-749 750-799 800-849 850-899
Portion of Pacific Ocean
Entre North South
48451 2 3 8 0 5 24646 14478 6236 8242 5439 2345 3094 1399 814 585 749 439 310 555 255 300 336 197 139 307 191 IL6 189 132 57 149 96 53 153 97 56 127 102 25 67 36 31
8 8 0 2 2 0 l l 0 l l 0 2 2 0
Boundaries between regions surrounding hydrographic stations are located partly for convenience and partly on the basis of established feature, s of the fields of temperature and salinity. Some attempt is also made to select boundaries which keep the depth of each region fairly uniform.
The volume assumed to be typified by a pair of temperature and salinity values is determined by the following procedure. The area of a region is obtained by planimetering on an exiuiareal chart. The depth for a given pair extends between the midpoint to the next pair above and the midpoint
114 JOHN D. COCHRANE
below, or, if the pair is at the top or bottom of a series, between the top or bottom and the mid- point to the next pair. The bottom of a region is taken at the average depth of the region as visually estimated from a bathymetric chart of the Pacific.
The sum of the volumes obtained by the above procedure is 72413 x 104 km a. This may be compared with KOSSINA'S more precise value of 72368 x 104 km a for the entire Pacific Ocean.
Since waters from all depths are treated together in this study, potential temperature is employed rather than temperature in situ. Thus the effect of depth on temperature is el iminated inasmuch as the potential temperature of a water parcel is the temperature it will acquire when its pressure is reduced adiabatically to atmospheric pressure. Potential temperatures are computed by means of nomograms prepared by MONTGOMERY and POLLAK on the basis of HELLAND-HANSEN'S (1930) computat ions.
The class intervals used in the bivariate distr ibutions represent compromises
3
5 ,- o/
8
57
194
63~
54%o i06d7
5 9 4 8 4
753
4 7 6 o 36 Yoo
t85
724! ~,
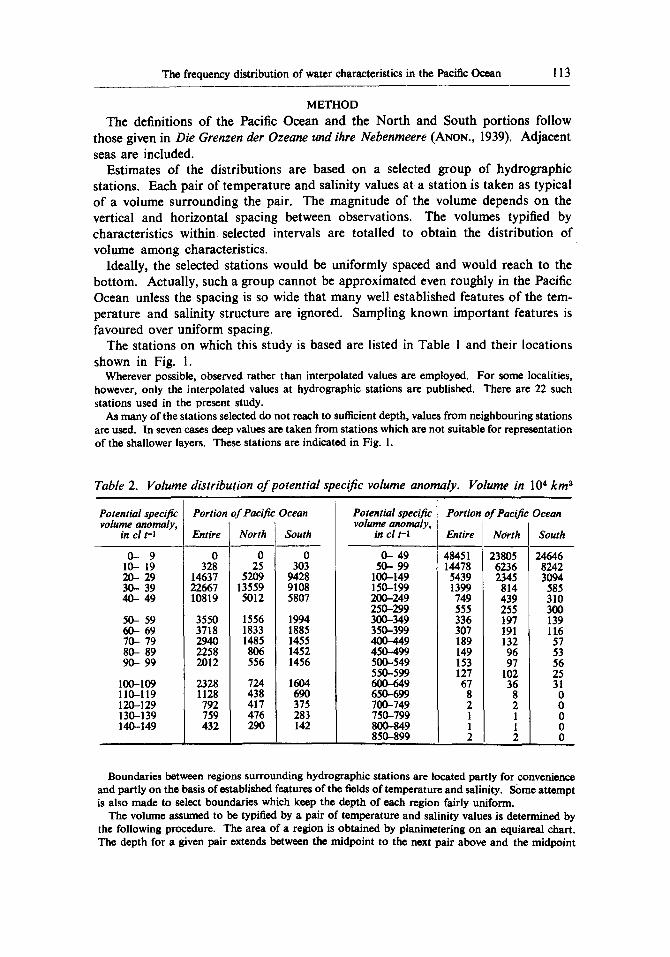
Fig. 2 (a). The bivariate distribution of volume among potential temperatures and salinities for the entire Pacific Ocean. Sloping numbers give the volume of water in 104 km3 for each class 2C x 0.5 per mille. Sums at the bottom give the distribution by potential temperature alone, sums at the left by salinity alone. The heavy boundary encloses classes comprising 75 per cent of the volume of the entire Pacific Ocean (classes with 4039 x 104 km3 or more). The light boundary encloses classes comprising 99 per cent (classes with 45 x 104 km3 or more). Potential specific volume
anomaly is represented by the curves.
between the detailed informat ion of small intervals and the reliability of large intervals. Since the sample is relatively large at low potential temperatures, small intervals can be employed. These intervals are clearly unsui table for the entire range. Con- sequently two sets of intervals are used, finer classes, 0.5 C × 0.1 per mille, for water colder than 10 C and saltier than 32"5 per mille and coarser classes, 2 C x 0.5 per mille, for the entire range, that is, classes 20 times as large as the finer ones.
The frequency distribution of water characteristics in the Pacific Ocean 115
I ' I ; ' I ' I ~ I ~ " . L \ ' ! ' I ~ I ' I " ~ , r \ , , . . . . .
Zl I I ~ ~ . . ' ' , \ 'Z. ' ? - . % ) .
3 . ~
- ~: ~ ~ . . " - , . - , , , ~ , = , : ' . , ,, , ! ~ ~ ~> ~, ~,\~,', , ~ ,-~,,,.~-~ ~.~ ~-~..,,, ,,~ . ~ ~ , ~
" ' " X \ -
- 3 4 . 5 % , [ ~ . . - - J - " " ~ " - , , _ X \ - _
" ° _ ~ 5 . o % , - - r _ _ - - _ ~ - _ ~ ~ ' - - ~ . . . . . ~ - - - ~ - - - ~ - - : _
I , I , I c " ~ l " ~ I F . . , c 661 ~ ,~ \
~'~ - o'~ t,... o i ,o ~.o ea ' ¢ ' ) or, ¢¢, I,.-. I,.-. ~ I,,,,. ,~r ~ ~ ~ o o
- ~ _~ ~ = ~ ~ - ~ - ~
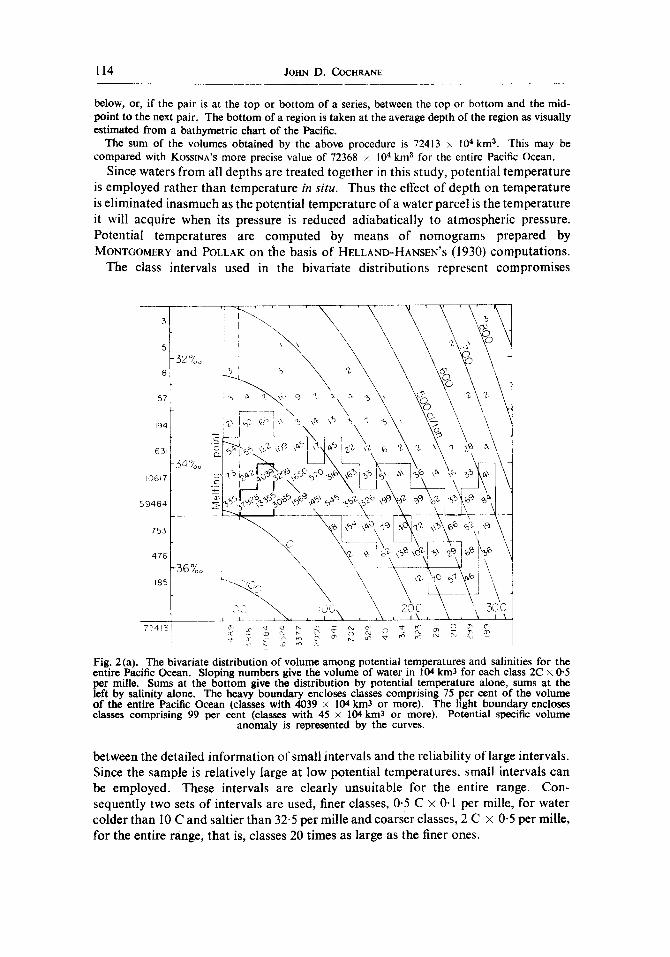
Fig. 2(b). Magnified portion of the bivariate distribution of volun~ among potential temperatures and ~linities for the entire Pacific Ocean. Sloping numbers give the volume of water in 104 kin3 for each class 0"5 C x 0.1 per mille. Water outside of the range of the diagram is represented by sloping numbers in the bands at the top and right. Sums at the bottom give the distribution by potential temperature alone, at the right by salinity alone. The heavy boundary encloses classes comprising 50 per cent of the volume of the entire Pacific Ocean (classes with 2715 x 104 kin3 or more). The light boundary enclose~ c l a~s comprising 75 per cent (classes with 487 x 104 km3 or
more). Potential specific volume anomaly is represented by the curves.
The distribution for the entire Pacific Ocean is presented in Figs. 2 (a) and 2 (b), for the North Pacific in Figs. 3 (a) and 3 (b), and for the South in Figs. 4 (a) and 4 (b). The " a " designates the diagrams with coarser classes which cover the entire range, the " b " designates the diagrams magnifying the limited range with the finer classes. Column and row totals are entered in the diagrams so as to give the univariate distributions of potential temperature and salinity. The entries in the diagrams are
116 JOHN D. COCHRANE
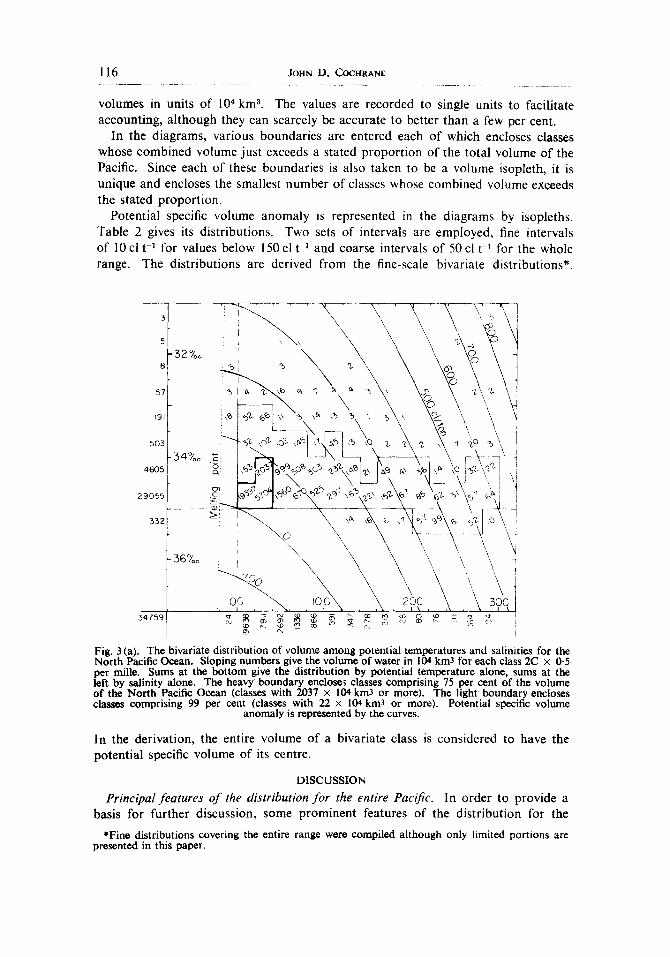
volumes in units of 104 km 3. The values are recorded to single units to facil i tate accounting, a l though they can scarcely be accurate to better than a few per cent.
In the diagrams, various boundar ies are entered each of which encloses classes whose combined volume jus t exceeds a stated p ropor t ion of the to ta l volume of the Pacific. Since each o f these boundar ies is also taken to be a volume isopleth, it is unique and encloses the smallest number o f classes whose combined volume exceeds the stated p ropor t ion .
Potential specific volume anomaly is represented in the d iagrams by isopleths. Table 2 gives its dis t r ibut ions. Two sets o f intervals are employed, fine intervals of 10 cl t -J for values below 150 cl t ~ and coarse intervals of 50 cl t x for the whole range. The dis t r ibut ions are derived from the fine-scale bivariate distr ibutions*.
34759
_ r ~ i
34%0
3
5
8
57
191
5O3
46O5
29055
332
132%o
36%°
Fig. 3 (a). The bivariate distribution of volume among potential temperatures and salinities for the North Pacific Ocean. Sloping numbers give the volume of water in 104 km3 for each class 2C x 0'5 per mille. Sums at the bottom give the distribution by potential temperature alone, sums at the left by salinity alone. The heavy boundary enciose~ classes comprising 75 per cent of the volume of the North Pacific Ocean (classes with 2037 × 104 km3 or more). The light boundary encloses classes comprising 99 per cent (classes with 22 × 104 km3 or more). Potential specific volume
anomaly is represented by the curves.
In the der ivat ion, the entire volume of a bivariate class is considered to have the potent ia l specific volume of its centre.
DISCUSSION
Principal features of the distribution for the entire Pacific. In order to provide a basis for further discussion, some prominen t features of the dis t r ibut ion for the
*Fine distributions covering the entire range were compiled although only limited portions are presented in this paper.

The frequency distribution of water characteristics in the Pacific Ocean 1 1 7
16 q. \ \ "5 \ S
'6-33O%o i : I~ ~ % " ~ " "~-~ \ - • , 'b I "b ~ - \& \ ~ - \ " ~ ' 0 \ \ ~ % e
°'- , , - r - - - -~.~ ~ ,~ ~ " ~ , ~ ~ ~ , . ~.. \ ~ \ - ~
4 5
o ~ I
\
- s 5 . o % - ~ - r - - :~-~-<C . . . . . " ~ - - - -'~.- - - - ~ - - - - ~ - - ~ . - ,-~
~ ! ~ "~ . "~o \ \ \ . ~ OC 2C 4 . C \ . 6C. . \ 8C \ \o
=c I , l i = X I ~ ] , I " ~ . ~ I , I ,.~ I , I ~ . , I , , . I I ~ ,
~ = o ~ ~ ~ ~ ~ o ~ o ~ ~ ~ ~ o 5 4 7 5 9 - - - - - ~ r J eJ e~ ~ ~ ~ N -
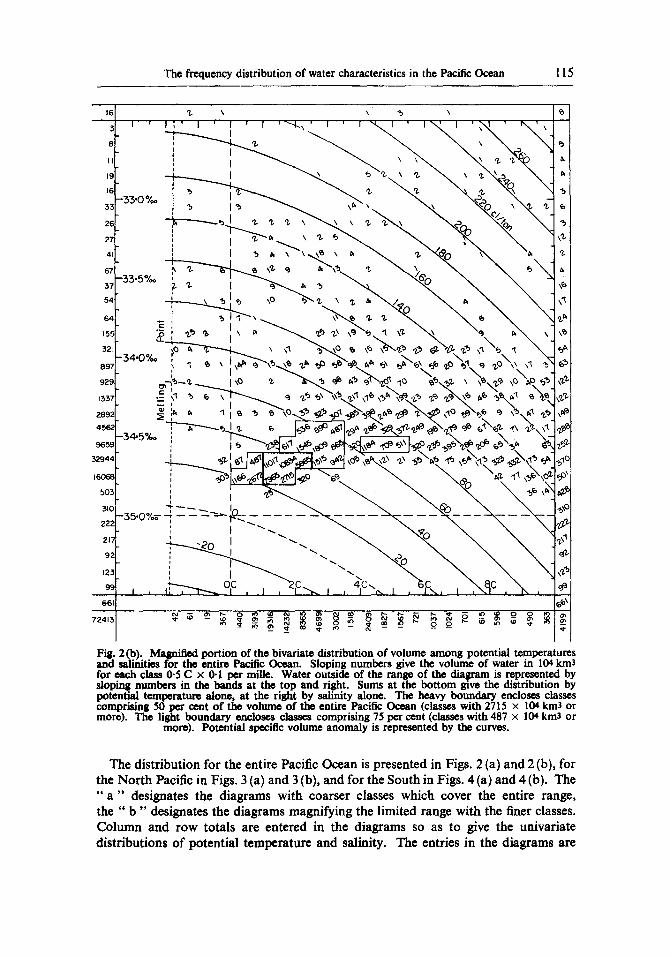
Fig. 3 (b). Magnified portion of the bivariat¢ distribution of volume among potential temperatures and salinities for the North Pacific Ocean. Sloping numbers give the volume of water in 104 km3 for each class 0-5 C × 0" 1 per mille. Water outside of the range of the diagram is represented by sloping numbers in the bands at the top and right. Sums at the bottom give the distribution by potential temperature alone, at the fight by salinity alone. The heavy boundary encloses classes comprising 50 per cent of the volume of the North Pacific Ocean (classes with 4455 × 104 kin3 or more). The light boundary encloses classes comprising 75 per cent (classes with 329 × 104 kin3 or more). Poten-
tial specific volume anomaly is represented .by the curves.
entire Pacific are descr ibed and their geographic counterpar t s ment ioned. A few new names are in t roduced when they seem impor t an t for clarity.
One feature o f the d i s t r ibu t ion dwarfs all others, the gigantic mode at 1.5 C, 34.65 per mil le (potent ia l specific volume anomaly 35 cl t-l). The fine-scale d iag ram (Fig. 2b) c lear ly shows how great the concent ra t ion abou t this point is, 33 per cent o f the volume having character is t ics between l and 2 C and between 34.6 and 34.7 per mille, only two o f the fine-scale classes. The 50-per-cent b o u n d a r y ( indicat ing

118 JOHN D. COCHRANE
a volume greater than that of the entire Atlantic Ocean) encloses only five classes. The water within these fills the Pacific below a few hundred metres in its Antarctic regions and below roughly 2000 m elsewhere. The name Deep Water will be used to designate water within or very near the 50-per-cent boundary.
The 75-per-cent boundary further emphasizes the degree of homogeneity of the Pacific, only 20 classes lying within it. Of these, 17 form a single group including the five within the 50-per-cent boundary. There are no subsidiary maxima within this group. Three classes form an extension below 1.0 C from the 50-per-cent boundary and nine bulge from the boundary toward higher temperature and somewhat lower salinity.
The three classes bounded by the second closed portion of the 75-per-cent line constitute a secondary mode with a peak at 4.25 C, 34.55 per mille (65 el t-t). Most
3
128
6012
30329
421
476
185
37654
Fig. 4 (a). The bivariate distribution of volume among potential temperatures and salinitics for the South Pacific Ocean. Sloping numbers give the volume of water in 104 kin3 for each class 2 C x 0.5 per mille. Sums at the bottom give the distribution by potential temperature alone, sums at the left by salinity alone. The heavy boundary enclo~s classes comprising 75 per cent of the volume of the South Pacific Ocean (classes with 2300 x 104 kin3 or more), The light boundary encloses classes comprising 99 per cent (classes with 36 × 104 kin3 or more). Potential specific volume anomaly is
represented by the curves.
of the water represented by the three classes occupies a region extending across the ocean between the Tropics and reaching from 700 m to as deep as 1100 m. The water is therefore called Tropical Water. Some of it is found in a rather thin layer extending f rom the Tropical region along the coast of the Americas to latitudes of somewhat more than 30 °. It also occurs in the western South Pacific north of 50°S at depths between 900 m and 1200 m.
A third mode appears at 0.25 C, 34.05 per mille (75 cl t-l). Nearly all of this water
The frequency distribution of water characteristics in the Pacific Ocean 119
444237 . e~-- ~ " , . ~ \ ¢ o aq, I "b'7.
- 3 4 5%0 : I ~ 4960. : ' - --q'"~%"' l ' fS")~kk"~"J" \ ' ~ \ \ ~ L . ~ . . . . . . . "5 .
, '~'_~.oo/~_ -_-_-_-_._-#~.7._ . . . . ,~',~,~
'~4 . -'b ~,
OC 2C 4 C \ 6 8C
661 661
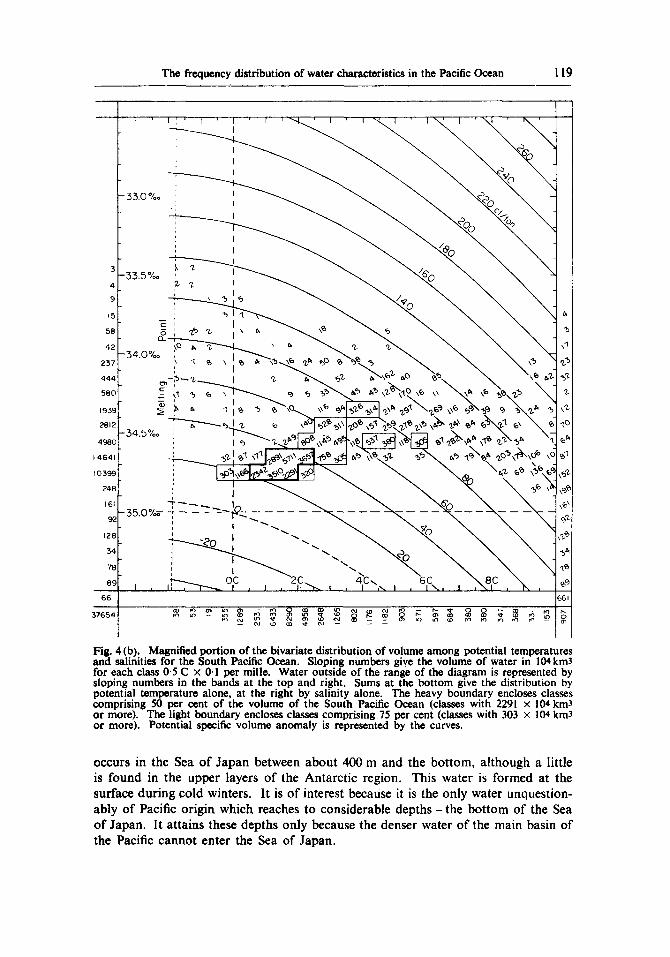
Fig. 4 (b). Magnified portion of the bivariate distribution of volume among potential temperatures and salinities for the South Pacific Ocean. Sloping numbers give the volume of water in 104km3 for each class 0.5 C x 0.1 per mille. Water outside of the range of the diagram is represented by sloping numbers in the bands at the top and right. Sums at the bottom give the distribution by potential temperature alone, at the right by salinity alone. The heavy boundary encloses classes comprising 50 per cent of the volume of the South Pacific Ocean (classes with 2291 x 104 km3 or more). The light boundary encloses classes comprising 75 per cent (classes with 303 × 104 km3 or more). Potential specific volume anomaly is represented by the curves.
occurs in the Sea o f J apan between abou t 400 m and the bo t tom, a l though a lit t le is found in the upper layers o f the Antarc t ic region. This water is fo rmed at the surface dur ing cold winters. I t is o f interest because it is the only water unquest ion- ab ly o f Pacific or igin which reaches to considerable depths - the bo t t om of the Sea o f Japan. I t a t ta ins these depths only because the denser water o f the main basin of the Pacific canno t enter the Sea o f Japan.
t20 JOHN D. COCHRANE
From the coarse-scale d iagram of Fig. 2 (a), it is possible to see the general outl ines of the dis t r ibut ion. It consists largely of a ra ther b road ridge extending from the pr imary mode toward higher potent ia l tempera tures and somewhat higher salinities. In most cases, the crest of the ridge lies near the highest sal ini ty for a temperature . Above 18 C, the ridge separates into two branches, as the 99-per-cent boundary shows. The one at lower salinities represents the Nor th Pacific and the one at high salinities the South. In both branches, max imum salinities are found between 22 C and 26 C. Lowest salinities appear at potent ial tempera tures below 10 C and above
24 C.
There are no de tached modes at high salinities in the Pacific dis t r ibut ion. In this regard the Pacific d is t r ibut ion differs from both the Atlant ic Ocean d is t r ibut ion given by MONTGOMERY (1958) and the Indian Ocean dis t r ibut ion given by POLLAK (1958). No seas adjacent to the Pacific cor respond to the Medi te r ranean or to the Red Sea, where very salty water forms. Some, indeed, is formed in the nor thern parts of the Gu l f of California, but in amounts which are inappreciable for the present study.
The Deep Water. The Deep Water of the Pacific appears to consist of water imported into the Pacific by the Antarc t ic Ci rcumpola r Current and very similar forms which result from the mixing of the C i rcumpola r Water with less salty water above and possibly from warming of the deepest layers due to heat flow through the floor of the Ocean. Water with the characteris t ics o f Deep Wate r does not appear in appreciable quant i ty at the surface according to the statistics given by COCnRANE (1956). It is possible that small amounts are formed a long the Pacific coast of the Antarc t ic in a manner similar to that occurr ing in the Weddel l Sea ,(SVERDRUP et al., 1942). Such amounts must be very small in view of the relative rari ty of water with potent ia l tempera tures less than 0 C. Except for this possibi l i ty there seems to be no source of water sufficiently dense to reach great depths in open por t ions o f the Pacific.
Where the Deep Water enters the Pacific, its upper layers are saltier than those at the bottom, 34.75 to 34.76 per mille compared to about 34-70 per mille at the bottom. In the present study, nearly all stations at which salinity as high as 34.75 per mille appears in the Deep Water are at the " Antarctic Convergence " or farther south. Within this group there is apparently a slight decrease in salinity toward the east, that is, in the direction of flow of the Antarctic Circumpolar Current. At nearly all stations to the north of the "' Convergence," the higher salinity values do not appear, probably because of mixing with the less saline water above. Salinity of 34.75 per mille is recorded in the upper Deep Water layers at Dana Station 3656, which is at 33°S in the Tasman Sea, far to the north of the " Convergence," but near the region where the Deep Water enters the Pacific Ocean. Higher salinities appear in three observations below 2470 m at Discovery Station 1280. Since high values extend all the way to the bottom, the observations are difficult to interpret.
As is pointed out by MONTGOMERY (1958), the Deep Water of the Pacific is the most nearly homogeneous occurr ing in any o f the oceans. This is due in par t to the lack o f impor tan t sources o f water with comparab le densi ty - and with slightly different characterist ics. It results also from the mixing of the upper layers of the Deep Wate r with less salty water which brings the sal ini ty o f the upper layers o f Deep W a t e r near ly to that of the deeper layers. The greatest uniformity o f Deep Wate r is thus achieved in the ocean far thest from its main sources.
The degree of uniformity of Deep Water is even greater than is indicated by the distributions (Figs. 2b, 3b, and 4b). Actually, the bulk of salinities lies between 34.67 and 34'72 per mille. But because the division between intervals falls at 34.70 per mille, the volumes are split between two intervals with a total range nearly twice the one actually appearing in the observations.

The frequoncy distribution of water characteristics in the Pacific Ocean 121
Within the Pacific Ocean, greater uniformity is found in the North. The 50-per- cent boundary encloses only three classes of the fine-scale distribution for the North (Fig. 3b), but six classes for the South (Fig. 4b). The 75-per-cent boundary shows a similar difference, enclosing 17 classes for the North and 21 for the South. It may be noted that the ratio of the number of classes within the 75-per-cent boundary to the number of classes within the 50-per-cent boundary is nearly 5.7 for the North, but only 3-5 for the South. The North distribution might thus be characterized as more peaked than the South. On the basis of values given by MorcrGOMERY (1958), it is found that this ratio is about 4-0 for each of the major Oceans, the Pacific, the Atlantic, and the Indian.
The 50-per-cent boundaries for North and South Pacific lie between salinities of 34.6 and 34.8 per mille. The boundary extends from 1 C to 2 C in the North Pacific distribution and to both lower and higher temperatures in the South, 0-5 C and 2.5 C, respectively. The modal class for the North Pacific is centred at 1.25 C, 34.65 per mille, the modal class for the South at 1.75 C, 34.65 per mille.
It is not surprising to find that the proportion of water colder than 1.0 C is less in the North than in the South Pacific, since in travelling northward from the South Pacific, the coldest water might be expected to mix in some degree with the warmer water above. However, the proportion changes from 11 per cent in the South to two per cent in the North Pacific, a very large decrease. Examination of the stations used in the present study discloses that, below 4000 m in much of the North Pacific, the potential temperature becomes constant at slightly more than 1.0 C, while, in the South Pacific, it almost always decreases with depth all the way to the bottom. The decrease in the proportion below 1.0 C thus does not seem to arise from mixing alone. Two other influences on the deep temperature structure have been pointed out by WOOSTER and VOLKMANN °. One is the deep sills which apparently cut much of the North Pacific off from the South Pacific and prevent the flow of the coldest South Pacific water into the North Pacific. The other is heating through the ocean floor.
It is surprising to find that the proportion of water colder than 1.5 C is much greater in the North, 39 per cent, than in the South Pacific, 28 per cent. The pro- portion of colder water increases downstream from the source of cold water. This odd circumstance arises because the 1.5 C surface lies, in general, at a shallower depth in the North than in the South Pacific except in the region south of the Antarctic Convergence (described, for example, by SVERDRUP et aL, 1942). Between .40°S and the Equator, most of the stations of the sample reach 1.5 C below 3000 m. On the other hand, few of the North Pacific stations fail to reach 1.5 C above 3000 m.
Compensation for the greater proportion of the North Pacific with temperature below 1.5 C is effected largely within the range of temperatures from 1.5 C to 3.0 C, where only 33 per cent of the North Pacific water, but 42 per cent of the South Pacific water is found. The layer from the 1.5 C to the 3.0 C surface is evidently much thinner in the North Pacific. Possibly, this difference results from a less effective means of carrying warmer water down from the upper layers in the North Pacific. The North Pacific counterpart of the Southern Intermediate Water, which is described
*In a paper presented at the Symposium on Abyssal Circulation (International Association of Physical Oceanography, International Union of Geodesy and Geophysics), Toronto, 5-6 September 1957.

122 JOHN D. COCHRANE
below, may not carry as much heat down with it. Another possibility, however, is that, within the layer with temperatures from 1-5 C to 3.0 C, greater vertical convergence occurs in the North than in the South Pacific.
The transitions to the waters above Deep Water are shown by features appearing in the 75-per-cent boundary surrounding the primary mode. In the South Pacific distribution (Fig. 4b) classes within this boundary extend from the 50-per-c, nt boundary along a roughly linear ridge to the vicinity of 4.0 C, 34.35 per mille. The detached classes within the 75-per-cent boundary are joined to the main body of classes within the boundary more from the end of the ridge described above than by a ridge extending directly to them from the main body.
The classes within the 75-per-cent boundary surrounding the primary mode of the North Pacific distribution (Fig. 3b) do not constitute a single ridge towards higher temperature from the 50-per-cent boundary, but rather two ridges. The extension of one of the ridges connects the detached classes within the 75-per-cent boundary, Tropical Water, directly to the main body surrounding the primary mode at 34.55 per mille. The other runs along a line from 2.25 C, 34.55 per mille to the vicinity of 5.0 C, 34.0 per mille.
Intermediate Waters. In the Pacific there are a number of extensive layers typified by a minimum of salinity with depth. It is convenient to refer to the waters with the characteristics occurring in any of these layers as Intermediate Waters. The Inter- mediate Water most clearly shown in the diagrams (Figs. 2b, 3b and 4b) is the Tropical Water described above, which constitutes the secondary mode in each of the distributions.
In the stations used in the present study, the salinity minimum associated with the Tropical Water is found usually at potential temperatures somewhat above 5 C, that is, at potential specific volume anomalies of 75 cl t -1 or somewhat higher. Since the peak of Tropical Water is at 4.25 C (65 cl t-x), the greater part of Tropical Water lies below the salinity minimum. This evidently results from the fact that the salinity increase with height above the minimum is greater than the increase with depth below it.
Not all of the Tropical Water is typified by a salinity minimum. West of about 150°W and north of about 10°N, it is overlain by water of still lower salinity, Northern Intermediate Water, which will be described later.
In the South Pacific distribution (Fig. 4b), there is a broad ridge extending between 70 and 95 cl t -1 from 3.5 C to 6.0 C, that is, from the high-temperature end of the main 75-per-cent boundary to the detached 75-per-cent boundary representing Tropical Water. Water with these characteristics will be called Southern Intermediate Water.
Most of the volumes making up the ridge are associated with the minimum of salinity with depth which covers the South Pacific north of the Antarctic Convergence. (This feature is described, for example, by SVERDRUP et al., 1942.) Most of the depths at which the minimum is found fall between 400 and 1000 m. The minimum is distinct in a region bounded on the south roughly by a line from 50°S in the longitude of Tasmania (145°E) to 25 ° at the South American coast. Between this line and the Antarctic Convergence, the minimum is not always clear because the water above it has nearly as low salinity.
In the distribution (Fig. 4b), the classes representing Southern Intermediate Water merge with the classes representing Tropical Water. The stations of the
The frequency distribution of water characteristics in the Pacific Ocean 123
present study do not indicate that the salinity minimum suddenly changes its depth or potential specific volume anomaly in going from the Southern Intermediate Water to Tropical Water. Much of the latter appears to be only a modification of Southern Intermediate Water produced by mixing with the saltier waters above and below. Tropical Water of lowest temperature (4.25 C, 34.55 per mille, 65 cl t-x), however, does not fall within the specific volumes typifying Southern Intermediate Water.
According to SVERDRUP et al. (1942), water of 2"2 C, 33.8 per mille (about 105 el t -x) sinks at the "Antarctic Convergence" and mixes with saltier water to produce Southern Intermediate Water (called Antarctic Intermediate Water by SVERDRUP) in the Pacific as well as in the other oceans. While the present sample shows no water in either of the two classes at 2.25 C between 33.7 and 33.9 per mille, probably because of the small sample size, waters of adjacent classes do appear in the diagram (Fig. 4b). From the vicinity of 2.5 C, 34.0 per mille a discernible ridge extends to 4.0 C, 34.35 per mille (about 80 cl t -x) to join the extension of the main 75-per-cent boundary.
In the North Pacific distribution (Fig. 3b), Tropical Water forms a very distinct peak. Unlike their counterparts in the South Pacific distribution, the three classes in the 75-per-cent boundary stand clearly above their surroundings except along a line to the primary mode. Tropical Water is apparently an intrusion from the South Pacific. It does not seem to give rise to other waters occurring in important amounts except, possibly, mixtures with the Deep Water.
An Intermediate Water which is quite distinct from Tropical Water is found in the North Pacific. To indicate its analogy to Southern Intermediate Water, it will be called Northern Intermediate Water. It is associated with the widespread salinity minimum at depths ranging from 300 m to 800 m. The region covered by the minimum extends from the western side of the North Pacific to about 150°W. It lies between the surface waters of low salinity in the north and a line in the south running from 10°N at the western side of the Ocean to 20°N at 150°W. Most easily expressed in terms of potential specific volume and temperature, its range of characteristics is from 105 cl t -x to 135 el t -x and from 5.0 C to 9.0 C.
Waters with these characteristics are not confined to the salinity minimum layer, but are also found farther east all the way to the American coast at depths ranging from 300 m to 600 m. The extension east of the minimum layer is bounded on the south by the parallel of 20°N. The northern boundary is more complex, extending eastward at 45°N to a point roughly 600 miles west of the American coast where it turns north to enclose a narrowing strip along the coast as far as Kodiak Island. Much of the Northern Intermediate Water of the extended region lies in the halocline layer between the surface layers of low salinity and the Deep Water. Some of the Northern Intermediate Water in the region of 150°W, but roughly 400 miles from the American coast, lies below a salinity minimum layer which is at smaller depths and higher potential specific volume anomalies than the more extensive salinity minimum associated with Northern Intermediate Water.
Northern Intermediate Water appears in the distribution (Fig. 3b) as an extension of the ridge from the principal mode to the vicinity of 5.0 C, 34.0 per mille. Near there the ridge is joined by a rather poorly defined limb of the distribution coming from the vicinity of 2.0 C, 33.3 per mile. At temperatures above those at the junction,

124 JOHN D. COCHRANE
the main ridge changes direction to follow the 125 cl t -1 isostere. At 6.0 C, 34.0 per mille the ridge becomes quite distinct, but loses its distinctness beyond 7.0 C, and becomes almost indiscernible beyond 8.5 C.
The junction at 5-0 C, 34.0 per mille seems consistent with the idea that Northern Intermediate Water is formed in somewhat the same way as its southern counterpart. Water of characteristics near 2.0 C, 33.3 per mille descends from the surface and mixes with deeper, saltier waters reaching a smallest potential specific volume anomaly of 125 cl t -1, possibly because of an increase in the rate of decrease of specific volume with depth.
The ridge from the principal mode to 5-0 C, 34.0 per mille represents the water beneath much of the Northern Intermediate Water, particularly in the northern part of the region where it is found. Along the southern edge of the region, Tropical Water lies under the Northern Intermediate Water. Between these two waters is a layer of transition represented in the distribution by an irregular region of higher volumes extending from 5.25 C, 34.55 per mille to the 120 el t -x isostere at salinities between 34.2 and 34-5 per mille.
Waters of the permanent thermocline layer. From the features representing Inter- mediate Waters in the distributions (Figs. 3b and 4b) ridges extend toward higher temperatures and salinities. These ridges represent the waters of the deeper portions of the permanent thermocline layers above the salinity minimum layers. In the entire Pacific there are two such groups of waters. One is composed of waters of the thermocline layer above the salinity minimum of the Southern Intermediate and Tropical Waters, the other of waters having the same relation to the Northern Intermediate Waters.
In the South Pacific distribution (Fig. 4b), where Tropical Water is merged with Southern Intermediate Water, the ridge corresponding to the waters of the permanent thermocline is rather broad. Starting from the largest classes along the 80 el t -1 isostere, it runs to the vicinity of 34.75 per mille at 10.0 C (approximately 125 cl t-x).
In the North Pacific distribution (Fig. 3b), both groups of thermocline waters are represented. One appears as an extension of the ridge through the detached 75-per- cent boundary to the vicinity of 34.65 per mille at 10.0 C (approximately 130 cl t-~). This corresponds, of course, to the layer above Tropical Water and so is quite similar to the ridge of the South Pacific distribution, but not so broad nor so saline at 10.0 C. The other group of thermocline waters is represented in the distribution by a ridge from the vicinity of 6.0 C, 34.0 per mille to about 34.25 per mille at 10.0 C, that is, from the most conspicuous feature representing Northern Intermediate Water along a line nearly parallel to the first ridge.
Waters of the surface layers. The extremes of the distributions result for the most part from waters of the surface layers, the layers above the permanent thermocline or halocline. A notable exception is provided by the extreme characteristics of the Deep Water, which is evidently imported into the Pacific Ocean. The extremes of the North and South Pacific distributions (Figs. 3a and 4a) are much the same as those of the corresponding distributions of Pacific sea-surface characteristics given by COCHRAr~E (1956), although the latter show lower salinities occurring at all tempera- tures. The agreement between the two sets of distributions is very good in view of the facts that the 155 stations used in the present study represent a very small sample of surface characteristics and that seasonal changes are not taken into account.
The frequency distribution of water characteristics in the Pacific Ocean 125
A notable feature of the distributions is the lack of low salinity water between 20 C and 24 C. In this range, there are no salinities below 33.5 per mille in the North Pacific distribution (Fig. 3a) or below 34.5 per mille in the South Pacific distribution (Fig. 4a). This situation arises from the considerable excess of evaporation over precipitation in the regions where temperatures of 20 C to 24 C are found at the sea-surface.
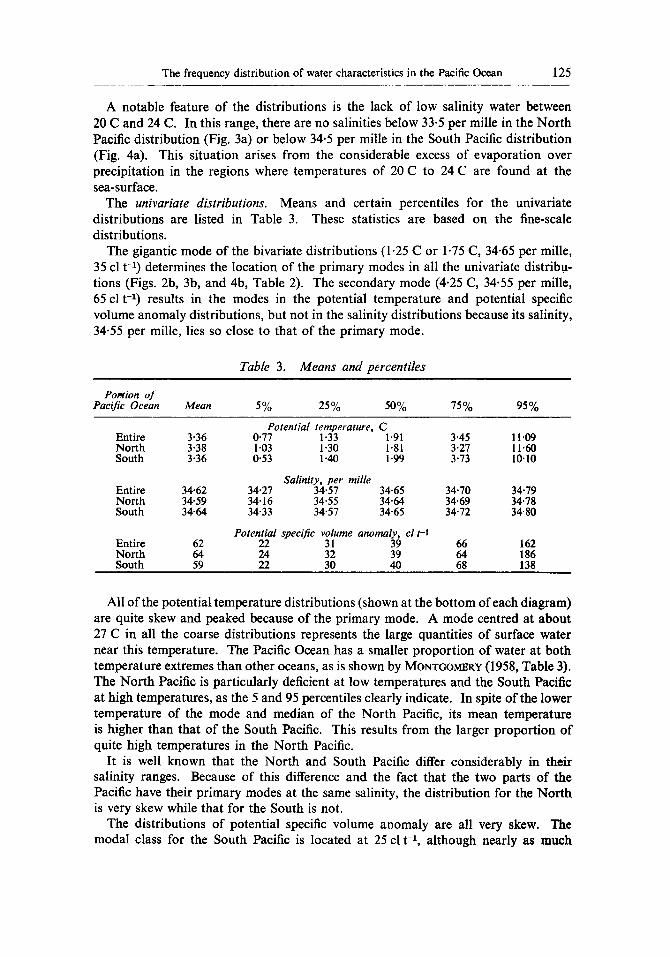
The univariate distributions. Means and certain percentiles for the univariate distributions are listed in Table 3. These statistics are based on the fine-scale distributions.
The gigantic mode of the bivariate distributions (1.25 C or 1.75 C, 34.65 per mille, 35 cl t -t) determines the location of the primary modes in all the univariate distrib.u- tions (Figs. 2b, 3b, and 4b, Table 2). The secondary mode (4.25 C, 34.55 per mille, 65 cl t -t) results in the modes in the potential temperature and potential specific volume anomaly distributions, but not in the salinity distributions because its salinity, 34-55 per mille, lies so close to that of the primary mode.
Table 3. Means and percentiles
PoPtion of Pacific Ocean Mean 5% 25% 50% 75% 95%
Potential temperature, C Entire 3'36 0'77 1"33 1"91 3"45 11'09 North 3'38 1"03 1"30 1"81 3"27 11"60 South 3'36 0'53 1"40 1"99 3"73 10"10
Salinity, per mille Entire 34.62 34.27 34.57 34.65 34.70 34"79 North 34.59 34.16 34.55 34.64 34.69 34.78 South 34-64 34.33 34.57 34.65 34.72 34'80
Potential specific volume anomaly, cl t-I Entire 62 22 31 39 66 162 North 64 24 32 39 64 186 South 59 22 30 40 68 138
All of the potential temperature distributions (shown at the bottom of each diagram) are quite skew and peaked because of the primary mode. A mode centred at about 27 C in all the coarse distributions represents the large quantities of surface water near this temperature. The Pacific Ocean has a smaller proportion of water at both temperature extremes than other oceans, as is shown by Mor,rrGOM~R¥ (1958, Table 3). The North Pacific is particularly deficient at low temperatures and the South Pacific at high temperatures, as the 5 and 95 percentiles clearly indicate. In spite of the lower temperature of the mode and median of the North Pacific, its mean temperature is higher than that of the South Pacific. This results from the larger proportion of quite high temperatures in the North Pacific.
It is well known that the North and South Pacific differ considerably in their salinity ranges. Because of this difference and the fact that the two parts of the Pacific have their primary modes at the same salinity, the distribution for the North is very skew while that for the South is not.
The distributions of potential specific volume anomaly are all very skew. The modal class for the South Pacific is located at 25 cl t -t, although nearly as much
126 JOaN D. COCaRA~E
lies in the class centred at 35 cl t -x, the class corresponding strictly to the primary bivariate mode. Because of its low salinities coupled with high temperatures, the North Pacific has a considerably longer tail to high specific volumes than has the South. In addition to the primary and secondary modes discussed above, the distri- butions all have modes at 105 cl t -1. While such a small mode must be viewed with some scepticism, its occurrence in both the North and South distributions lends support to its reality.
Conclus;.on. The information presented above, it is believed, is a necessary step toward classifying Pacific waters systematically and putting studies of their evolution, maintenance, and modification on a quantitative basis. The information also seems essential to investigating the general circulation of the Pacific, particularly the deep circulation. The frequency distributions obtained are, as has been pointed out, only first approximations. Accurate representation of the larger features has been sought. For the North Pacific, this aim seems to have been attained. For the South Pacific, however, there may well be distortion of even some major features because of the tremendous volumes in the central South Pacific for which no serial data are now available. Seasonal changes and smaller permanent features of the geographical distribution have been neglected. These matters, while perhaps vitally important in the evolution of certain waters, can probably be approached best by a route other than the one followed in the present study. Basic information still lacking in the study of Pacific water characteristics is a uniform charting of the geographical distri- bution of characteristics for the entire Pacific. The frequency distributions presented above should prove valuable in deciding how such charting can best be carried out.
Acknowledgement--The writer wishes to record his gratitude to Dr. R. B. MONTGOMERY for suggestions on many points in this paper.
Department of Oceanography and Meteorology Agricultural and Mechanical College of Texas
Contribution from the Department of Oceanography and Meteorology of the Agricul- tural and Mechanical College of Texas, Oceanography and Meteorology Series No. 115, based on investigations conducted for the Texas A & M Research Foundation through sponsorship of the Office of Naval Research Contract N7 onr-48702.
REFERENCES ANON . . (1939) Die Grenzen der Ozeane und ihre Nebenmeere. Ann. tier Itydrogr.
u. Mr.~r. Met. Suppl. to May issue, 11 pp., 2 encl. BARNES C. and THOMPSON T. G. (1938) Physical and chemical investigations in Bering
Sea and portions of the North Pacific. Univ. of Wash. Publ. in Oceanogr. 3 (2), 35-79 and appendix 164 pp.
BRUNEAU L., JERLOV N. G. and KoczY F. (1953) Reports of the Swedish Deep-Se~ Expedition 194%1948. 3 (4), 101-112 and appendix : Physical and Chemical data, i-lv. G6teborg, Elanders.
COCHXANE J. D. (1956) The frequency distribution of surfac¢-water characteristics in the Pacific Ocean. Deep-Sea Res. 4, 45-53.
COLLIAS E. C., LOVE C. M. and PAQUETTE R. G. (1956) Eastern North Pacific and Gulf of Alaska, Offshore Physical and Chemical data. Apr. 1954-Jan. 1955. Univ. of Wash. Tech. Rpt. 49 (Ref. 56.-10) 33 pp.
CROMWELL T. (1954) Mid-Pacific oceanography II, transequatorial waters June-August 1950, January-March 1951. U.S. Dept. of Interior Fish and Wildlife Service Spec. Sci. Rpt.- Fisheries 131, 13 pp. and tables.

The frequency distribution of water characteristics in the Pacific Ocean 127
Ft~)¢(3 J. A., SVERDRUP H. U., E ~ s C. C., SEATON S. L. and He)comx W. C. (1945) Scientific results of Cruise VII of the Carnegie during 1928-1929 under command of Capt. J. P. Ault. Oceanography - I-B, Observations and results in physical oceanography, graphical and tabular summaries. Carnegie Inst. Wash. Publ. 545, 315 pp.
GOODMA~ J. R., LINCOLN J. H., THOMPSON T. G. and ZEUSLER F. A. (1942) Physical and chemical investigations : Bering Sea, Bering Strait, Chukchi Sea during the summers of 1937 and 1938. Univ. of Wash. Publ. in Oceanogr. 3 (4), 81-103 and appendix, 117 pp.
H~LA)O-HANSEN B. (1930), Physical oceanography and meteorology. Bergen, Report on the scientific results of the "Michael Sars" North Atlantic Deep-Sea Exped., 1910, v. 1, art. 2, 115 and 102 pp.
HELLAND-HANSEN B. and NANSEN F. (1926) The eastern North Atlantic. Geofys. Publ. 4 (2), 76 pp., 71 pls.
KO~INA E. (1921) Die Tiefen des Weltmeeres. Berlin Univ., lnstitutf Meereskunde, Veroff N.F., A. Geogr. -Naturwiss. Reihe, 9, 70 pp.
MOWrGOM~I~Y R. B. (1955) Characteristics of surface water at Weather Ship J. Deep.Sea Res. 3, supplement, Papers in marine biology and oceanography dedicated to HENRY BRYANT BIGELOW, 331-334.
MONT(3OMeJ~Y R. B. (1958) Water characteristics of Atlantic Ocean and of world ocean. Deep-Sea Res. 5, 134-148.
PotJ.7,x M. J. (1958) Frequency distribution of potential temperatures and saUnities in the Indian Ocean. Deep-Sea Res. 5, 128-133.
Swm3Rup H. U., JOHNSON M. W. and FLEMINO R. H. (1942) The Oceans. Prentice-Hall, New York, 1087 pp. and 7 charts.
VAN RIEL P. M., HAMAKER H. C. and VAN EYCK L. (1950) The Snellius Expedition. VoL II, Part 6, Serial and Bottom Observations. Temperature, salinity and density. 1-42. Leyden, E. J. Brill.