the fiscal effects of tariff reduction in the caribbean community
TRANSCRIPT
1
The Fiscal Effects of Tariff Reduction in the Caribbean Community‡
Prepared by
Amos Peters Economic Intelligence and Policy Unit
CARICOM Secretariat P.O. Box 10827
Georgetown Guyana, SA
Tel: 592-226-9280 Fax: 592-227-4537
E-mail: [email protected]
Key words – Caribbean Community, tariff, fiscal reform, trade liberalization
‡ IADB, Washington D.C, September 19, 2002.

2
Glossary of Acronyms and Abbreviations
CARICOM Caribbean Community
CARIFORUM Caribbean Forum
CET Common External Tariff
COFAP Council for Finance and Planning
CSME CARICOM Single Market and Economy
CTAG Caribbean Trade and Adjustment Group
EU European Union
FTAA Free Trade Area of the Americas
FTA Free Trade Area
GDP Gross Domestic Product
IMF International Monetary Fund
MFN Most Favoured Nation
NAFTA North American Free Trade Area
OECS Organisation of Eastern Caribbean States
PTA Preferential Trading Arrangements
REPA Regional Economic Partnership Agreement
RPA Regional Partnership Agreement
VAT Value Added Tax
WTO World Trade Organisation

3
Abstract
This paper explores the fiscal effects of tariff reduction for the Caribbean Community.
The paper concludes that Caribbean countries are likely to experience short-run revenue
shortfall as a consequence of trade liberalization. Indications are that the shortfall could
be as much as a 45 per cent decline in customs duties. In order to mitigate this substantial
effect, the ongoing efforts at fiscal reform must continue, paying particular attention to
lowering tax exemptions, enhancing indirect tax systems, improving tax collection and
administration and modifying the tax structure to reflect lower dependence on trade taxes
for fiscal receipts.
4
I. Introduction
Since the 1973 Treaty of Chaguaramas establishing the Caribbean Community and
Common Market, Caribbean leaders have displayed an unequivocal commitment to Free
Trade both within Community Member States and internationally. The decision in 1992
to design and implement the CARICOM Single Market and Economy reaffirmed this
commitment. The Caribbean Community having achieved free trade in goods is now
moving ahead with free trade in services.
At the international levels, Member States of the Caribbean Community signed on to the
Marrakesh Agreement that established the World Trade Organisation (WTO) and set the
rules that govern global trade. The Caribbean Community has signalled its intention to
participate in the hemispheric free trade arrangement, the Free Trade Area of the
Americas (FTAA). Moreover Caribbean economies are highly open, and have been
participating in global trade for centuries.
It is clear, that CARICOM Member States understand the benefits of free trade, it is clear
that Member States are committed to trade liberalization, but unfortunately, in many
ways the global environment has not been kind to the Caribbean. The Caribbean
continues to experience marginalization in the new international order. The erosion of
preferential markets, primarily in Europe, adverse commodity price shocks and stiff
competition in tourism services, has seriously affected export earnings and export
earnings capacity in all Member States. Finance for development, has become
increasingly difficult to access, and this has increased pressure on domestic resources to
finance investment, growth and development.
A substantial element of trade liberalization is the lowering of import tariffs and removal
of import restrictions. Caribbean governments especially given the backdrop of
worsening fiscal deficits are concerned that tariff reduction could have substantial
negative revenue effects which could seriously affect their ability to grow their
economies, alleviate poverty, and keep debt burdens low.
5
The concern is acute for those Member States where dependence on import duties as a
source of revenue is particularly high. The purpose of this paper is to explore what the
impact on revenues might be. The paper is organized as follows: Section II presents a
theoretical discussion of the fiscal effects of trade liberalization, Section III outlines the
characteristics of Caribbean economies and then Section IV examines the trade structure
and trade commitment of the region. A description and analysis of the tax and tariff
structure is presented in Sections V and VI. In section VII, we discuss the fiscal effects of
tariff reduction on the Caribbean Community given there current fiscal positions, trade
structure and tax systems and in section VIII and IX after the likely effects have been
established, policy solutions are discussed. Section X concludes the paper.
II. Theoretical Considerations
It is widely acknowledged that there are substantial gains from trade that result from
participation in a free trade area, but when fiscal revenue is accounted for, it is not clear
what the net welfare effect will be. Bhagwati, Greenaway, and Panagariya (1998) have
stated that loss of tariff revenues from inter participant trade can exceed the net gains
usually identified in the Harberger-Johnson triangles thus resulting in an overall welfare
loss (Nicholls et al: 1999). In this context fiscal loss and adjustment, therefore takes on
added significance in the short run.
The elimination of trade barriers among members of a Free Trade Area (FTA), while
maintaining barriers with the rest of the world can lead to trade creation and trade
diversion of particular products. Trade creation refers to the substitution of high cost
production for lower cost source of supply inside the integrated area, leading ultimately
to lower domestic prices. Trade diversion is the opposite of trade creation and occurs
when higher cost production from the Free Trade Area replaces lower cost sources of
supply from third countries (OECD: 2000). The net welfare effect involves a comparison
of the trade creating gains with the trade creating losses (Nicholls et al: 1999) an analysis
associated with Viner (1950). To determine the scope for trade creation and trade
diversion exante, a comparison of the production cost structure of the potential Free
6
Trade Area participants and also the rest of the world must be made for particular
products.
Nicholls et al (1999) outline some of the weaknesses of the Vinerian theoretical
apparatus. Among them the whole issue of distribution of trade gains. Distribution is of
special concern to small vulnerable CARICOM states since as mentioned before,
particular distributions could result in overall net welfare losses for particular countries in
a Free Trade Area because of the significance and magnitude of fiscal losses.
The fiscal impact of a tariff reduction depends upon a number of factors such as the size
of the tariff reduction, the response of imports to the tax change, the relative importance
of import tariffs as a source of government revenue, the response of the other tax bases to
the tariff reduction and how those tax bases will impact on total revenue, the number of
tariff line items that are above and below the maximum revenue tariff, the level of initial
tariff, and the share of those imports subject to high tariffs in total imports.
It is expected that countries with heavier dependence on trade taxes as a source of fiscal
revenue will be more severely affected, but what is also of critical importance is the
response of exporters and importers in CARICOM to the reduction in tariffs. It is
important because, the level of imports and exports and overall economic activity affects
the revenue that governments collect. The extent of the impact of trade liberalisation on
the Caribbean also depends on the extent of substitution of local production for goods and
services, which are cheaper from other hemispheric partners (Worrell: 1993).
III. Economic Characteristics of CARICOM countries
Caribbean economies are typically small and highly open to international trade. The total
mid-year population of the Caribbean Community, in 1999 was 6,341,382 and with the
exception of Guyana and Suriname who take up 87.1 per cent of the Community land
mass, the physical size of each Member State are all below 23,000 square kilometres.
Most Community countries are islands that lie in the hurricane belt and earthquake zone
of the Caribbean Sea, thereby making them acutely vulnerable to natural disasters.
7
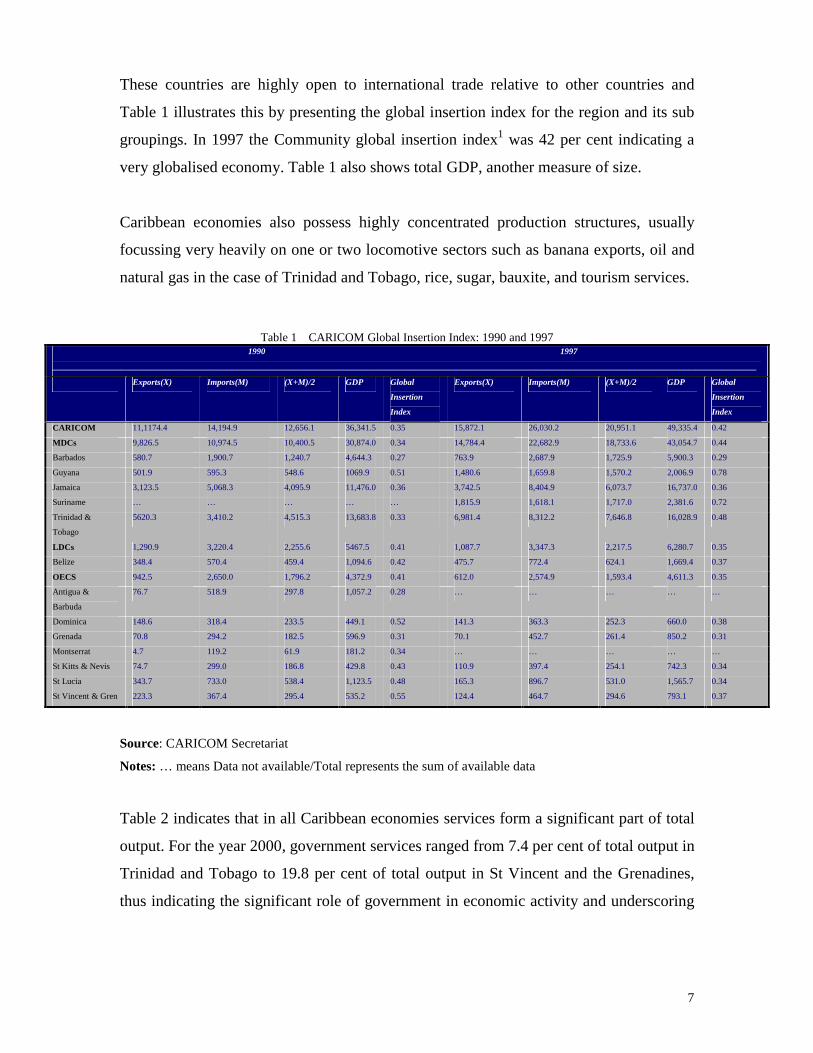
These countries are highly open to international trade relative to other countries and
Table 1 illustrates this by presenting the global insertion index for the region and its sub
groupings. In 1997 the Community global insertion index1 was 42 per cent indicating a
very globalised economy. Table 1 also shows total GDP, another measure of size.
Caribbean economies also possess highly concentrated production structures, usually
focussing very heavily on one or two locomotive sectors such as banana exports, oil and
natural gas in the case of Trinidad and Tobago, rice, sugar, bauxite, and tourism services.
Table 1 CARICOM Global Insertion Index: 1990 and 1997 1990 1997
___________________________________________________________________________________________________________________________________________________________________
Exports(X) Imports(M) (X+M)/2 GDP Global
Insertion
Index
Exports(X) Imports(M) (X+M)/2 GDP Global
Insertion
Index
CARICOM 11,1174.4 14,194.9 12,656.1 36,341.5 0.35 15,872.1 26,030.2 20,951.1 49,335.4 0.42
MDCs 9,826.5 10,974.5 10,400.5 30,874.0 0.34 14,784.4 22,682.9 18,733.6 43,054.7 0.44
Barbados 580.7 1,900.7 1,240.7 4,644.3 0.27 763.9 2,687.9 1,725.9 5,900.3 0.29
Guyana 501.9 595.3 548.6 1069.9 0.51 1,480.6 1,659.8 1,570.2 2,006.9 0.78
Jamaica 3,123.5 5,068.3 4,095.9 11,476.0 0.36 3,742.5 8,404.9 6,073.7 16,737.0 0.36
Suriname … … … … … 1,815.9 1,618.1 1,717.0 2,381.6 0.72
Trinidad &
Tobago
5620.3 3,410.2 4,515.3 13,683.8 0.33 6,981.4 8,312.2 7,646.8 16,028.9 0.48
LDCs 1,290.9 3,220.4 2,255.6 5467.5 0.41 1,087.7 3,347.3 2,217.5 6,280.7 0.35
Belize 348.4 570.4 459.4 1,094.6 0.42 475.7 772.4 624.1 1,669.4 0.37
OECS 942.5 2,650.0 1,796.2 4,372.9 0.41 612.0 2,574.9 1,593.4 4,611.3 0.35
Antigua &
Barbuda
76.7 518.9 297.8 1,057.2 0.28 … … … … …
Dominica 148.6 318.4 233.5 449.1 0.52 141.3 363.3 252.3 660.0 0.38
Grenada 70.8 294.2 182.5 596.9 0.31 70.1 452.7 261.4 850.2 0.31
Montserrat 4.7 119.2 61.9 181.2 0.34 … … … … …
St Kitts & Nevis 74.7 299.0 186.8 429.8 0.43 110.9 397.4 254.1 742.3 0.34
St Lucia 343.7 733.0 538.4 1,123.5 0.48 165.3 896.7 531.0 1,565.7 0.34
St Vincent & Gren 223.3 367.4 295.4 535.2 0.55 124.4 464.7 294.6 793.1 0.37
Source: CARICOM Secretariat
Notes: … means Data not available/Total represents the sum of available data
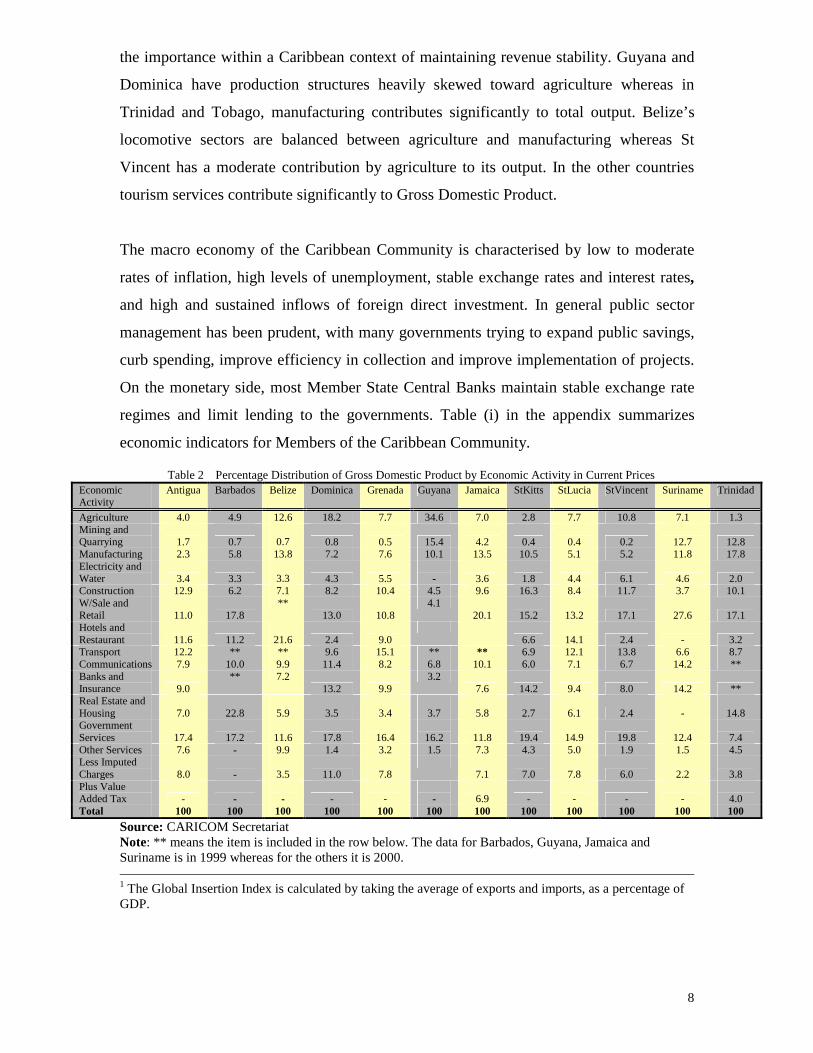
Table 2 indicates that in all Caribbean economies services form a significant part of total
output. For the year 2000, government services ranged from 7.4 per cent of total output in
Trinidad and Tobago to 19.8 per cent of total output in St Vincent and the Grenadines,
thus indicating the significant role of government in economic activity and underscoring
8
the importance within a Caribbean context of maintaining revenue stability. Guyana and
Dominica have production structures heavily skewed toward agriculture whereas in
Trinidad and Tobago, manufacturing contributes significantly to total output. Belize’s
locomotive sectors are balanced between agriculture and manufacturing whereas St
Vincent has a moderate contribution by agriculture to its output. In the other countries
tourism services contribute significantly to Gross Domestic Product.
The macro economy of the Caribbean Community is characterised by low to moderate
rates of inflation, high levels of unemployment, stable exchange rates and interest rates,
and high and sustained inflows of foreign direct investment. In general public sector
management has been prudent, with many governments trying to expand public savings,
curb spending, improve efficiency in collection and improve implementation of projects.
On the monetary side, most Member State Central Banks maintain stable exchange rate
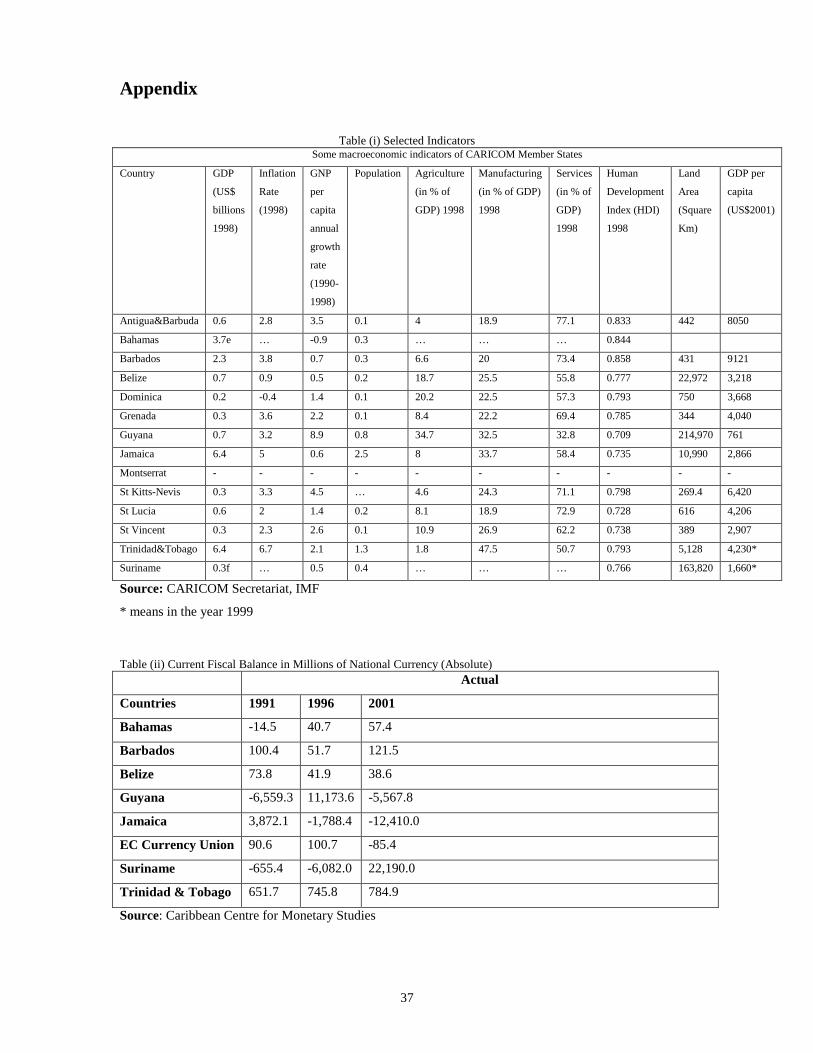
regimes and limit lending to the governments. Table (i) in the appendix summarizes
economic indicators for Members of the Caribbean Community.
Table 2 Percentage Distribution of Gross Domestic Product by Economic Activity in Current Prices Economic Activity
Antigua Barbados Belize Dominica Grenada Guyana Jamaica StKitts StLucia StVincent Suriname Trinidad
Agriculture 4.0 4.9 12.6 18.2 7.7 34.6 7.0 2.8 7.7 10.8 7.1 1.3 Mining and Quarrying 1.7 0.7
0.7 0.8 0.5 15.4 4.2 0.4 0.4 0.2 12.7 12.8
Manufacturing 2.3 5.8 13.8 7.2 7.6 10.1 13.5 10.5 5.1 5.2 11.8 17.8 Electricity and Water 3.4 3.3
3.3 4.3 5.5
- 3.6 1.8 4.4 6.1 4.6 2.0
Construction 12.9 6.2 7.1 8.2 10.4 4.5 9.6 16.3 8.4 11.7 3.7 10.1 W/Sale and Retail 11.0 17.8
** 13.0 10.8
4.1 20.1 15.2 13.2 17.1 27.6 17.1
Hotels and Restaurant 11.6 11.2
21.6 2.4 9.0
6.6 14.1 2.4 - 3.2
Transport 12.2 ** ** 9.6 15.1 ** ** 6.9 12.1 13.8 6.6 8.7 Communications 7.9 10.0 9.9 11.4 8.2 6.8 10.1 6.0 7.1 6.7 14.2 ** Banks and Insurance 9.0
** 7.2 13.2 9.9
3.2 7.6 14.2 9.4 8.0 14.2 **
Real Estate and Housing 7.0
22.8
5.9 3.5 3.4
3.7 5.8 2.7 6.1 2.4 -
14.8
Government Services 17.4
17.2
11.6 17.8 16.4
16.2 11.8 19.4 14.9 19.8
12.4
7.4
Other Services 7.6 - 9.9 1.4 3.2 1.5 7.3 4.3 5.0 1.9 1.5 4.5 Less Imputed Charges 8.0
-
3.5 11.0
7.8
7.1 7.0
7.8 6.0
2.2
3.8
Plus Value Added Tax -
-
- -
-
-
6.9 -
- -
-
4.0
Total 100 100 100 100 100 100 100 100 100 100 100 100 Source: CARICOM Secretariat Note: ** means the item is included in the row below. The data for Barbados, Guyana, Jamaica and Suriname is in 1999 whereas for the others it is 2000. 1 The Global Insertion Index is calculated by taking the average of exports and imports, as a percentage of GDP.

9
IV. Caribbean Community Trade Structure
The United States is CARICOM’s principal trading partner but in recent times, trade with
other hemispheric partners has been growing, largely on account of Trinidad and Tobago
and Jamaica. Tables 3 and 4 present the distribution of CARICOM imports and exports
respectively by principal source and destination.
Table 3 Distributions of CARICOM Imports by Principal Sources: 1980-1998 (Percentage) Source of Imports 1980 1985 1990 1995 1996 1997 1998
USA 27.8 38.3 41.2 42.6 44.4 47.7 46.2
European Union 15.8 16.5 15.5 15.2 14.1 14 13.7
CARICOM 8.8 9.7 9.2 9.8 9.7 9.1 9.5
LAIA 5.6 9.1 11.2 9 12.2 9.8 10.4
Selected Asian Countries 6.6 10.2 7.7 8.4 8.2 8.4 9.6
Rest of the World 35.4 16.2 15.2 15 11.4 11 10.6
Source: A Quick Reference to Some Summary Data 1980-1996 and CARICOM Secretariat
Notes: LAIA – Latin America Integration Association Selected Asian Countries are China, Hong Kong, India, Japan, Singapore, South Korea, Taiwan and Thailand 1990 Excludes data for Antigua and Barbuda 1995 Excludes data for Antigua and Barbuda, Guyana and Montserrat 1996 Excludes data for Antigua & Barbuda, Guyana, Montserrat, St Vincent & the Grenadines and Suriname 1997 Excludes data for Antigua & Barbuda, Guyana, Montserrat and Suriname 1998 Excludes data for Antigua & Barbuda, Dominica, Guyana, Montserrat St Kitts & Nevis and Suriname

10
Table 4 Distribution of CARICOM Exports by Principal Destinations.: 1980-1998 (Percentage) Destination of Exports 1980 1985 1990 1995 1996 1997 1998
USA 48.7 47.2 40.7 34.1 38.5 35.3 35.2
European Union 16.5 17.8 20.6 20.9 18.0 18.1 16.9
CARICOM 8.9 12.8 12.2 16.5 18.3 19 22.5
LAIA 1.9 2.1 2.8 5.4 5.2 4.6 3.7
Selected Asian Countries 0.4 1.3 1.2 1.5 0.9 1 0.6
Rest of the World 23.6 18.8 22.5 21.6 19.1 22 21.1
Source: A Quick Reference to Some Summary Data 1980-1996 and CARICOM Secretariat
Notes: LAIA – Latin America Integration Association Selected Asian Countries are China, Hong Kong, India, Japan, Singapore, South Korea, Taiwan and Thailand 1990 Excludes data for Antigua and Barbuda and Montserrat’s Re-Exports 1995 Excludes data for Antigua and Barbuda and Guyana 1996 Excludes data for Antigua & Barbuda, Guyana and Suriname 1997 Excludes data for Antigua & Barbuda, Guyana, Montserrat and Suriname 1998 Excludes data for Antigua & Barbuda, Dominica, Guyana, Montserrat St Kitts & Nevis and Suriname
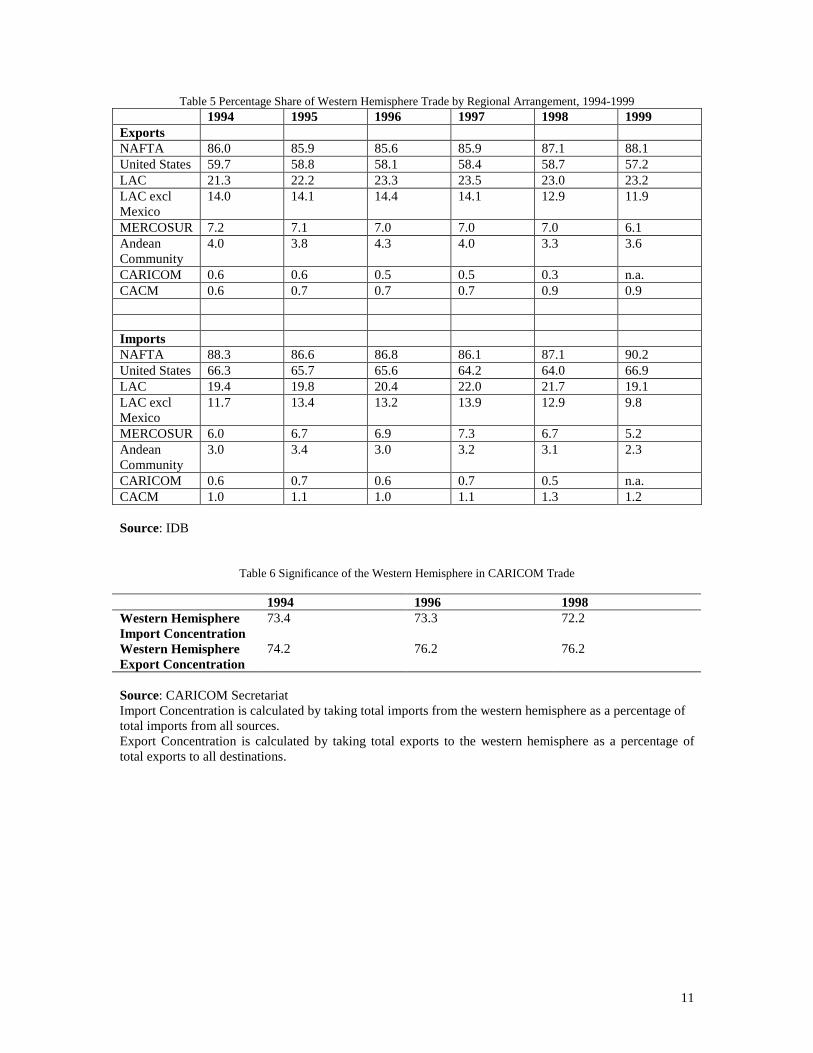
Table 5 illustrates CARICOM’s small size in the hemisphere. In 1998 CARICOM
accounted for 0.3 per cent of Western Hemisphere exports and 0.5 per cent of regional
imports.
11
Table 5 Percentage Share of Western Hemisphere Trade by Regional Arrangement, 1994-1999
1994 1995 1996 1997 1998 1999 Exports NAFTA 86.0 85.9 85.6 85.9 87.1 88.1 United States 59.7 58.8 58.1 58.4 58.7 57.2 LAC 21.3 22.2 23.3 23.5 23.0 23.2 LAC excl Mexico
14.0 14.1 14.4 14.1 12.9 11.9
MERCOSUR 7.2 7.1 7.0 7.0 7.0 6.1 Andean Community
4.0 3.8 4.3 4.0 3.3 3.6
CARICOM 0.6 0.6 0.5 0.5 0.3 n.a. CACM 0.6 0.7 0.7 0.7 0.9 0.9 Imports NAFTA 88.3 86.6 86.8 86.1 87.1 90.2 United States 66.3 65.7 65.6 64.2 64.0 66.9 LAC 19.4 19.8 20.4 22.0 21.7 19.1 LAC excl Mexico
11.7 13.4 13.2 13.9 12.9 9.8
MERCOSUR 6.0 6.7 6.9 7.3 6.7 5.2 Andean Community
3.0 3.4 3.0 3.2 3.1 2.3
CARICOM 0.6 0.7 0.6 0.7 0.5 n.a. CACM 1.0 1.1 1.0 1.1 1.3 1.2 Source: IDB
Table 6 Significance of the Western Hemisphere in CARICOM Trade 1994 1996 1998 Western Hemisphere Import Concentration
73.4 73.3 72.2
Western Hemisphere Export Concentration
74.2 76.2 76.2
Source: CARICOM Secretariat Import Concentration is calculated by taking total imports from the western hemisphere as a percentage of total imports from all sources. Export Concentration is calculated by taking total exports to the western hemisphere as a percentage of total exports to all destinations.
12
Table 6 shows the concentration of CARICOM trade within the Western Hemisphere,
CARICOMs imports from sources within the hemisphere. CARICOM imports from
hemispheric partners amounted to 72.2 per cent of total CARICOM imports in 1998
whereas CARICOM exports to the hemisphere constituted 76.2 per cent of total
CARICOM exports. This suggests that the Free Trade Area of the Americas will have the
largest impact on Caribbean economies.
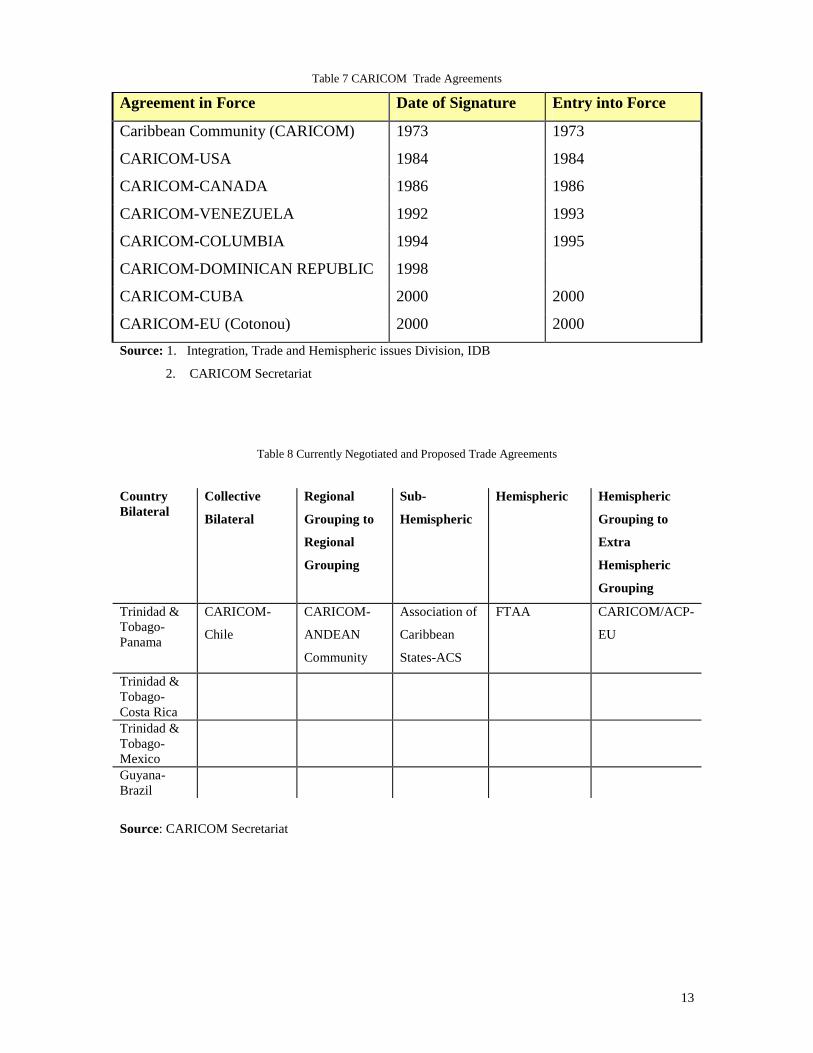
CARICOM Trade Commitments
CARICOM has entered into a number of bilateral trading arrangements both as an
economic block and also as individual countries. Table 7 shows the hemispheric trade
agreements with which CARICOM is involved and Table 8 presents agreements that are
currently being negotiated or currently proposed. Most of CARICOM’s trade agreements
are on a non-reciprocal basis although in recent times many of the bilateral trade
agreements have sought to expose Caribbean firms to competition with firms of similar
size in neighbouring countries. This is a deliberate attempt by CARICOM to adjust to the
inevitable liberalised environment associated with the FTAA. Moreover, it has the effect
of expanding the regional common marked and allowing for growing production in the
region especially in Trinidad and Tobago, the industrial hub of the region. There has been
marginal growth in trade between Latin America and CARICOM but not sufficient to
cause fiscal problems in the region.
13
Table 7 CARICOM Trade Agreements
Agreement in Force Date of Signature Entry into Force
Caribbean Community (CARICOM) 1973 1973
CARICOM-USA 1984 1984
CARICOM-CANADA 1986 1986
CARICOM-VENEZUELA 1992 1993
CARICOM-COLUMBIA 1994 1995
CARICOM-DOMINICAN REPUBLIC 1998
CARICOM-CUBA 2000 2000
CARICOM-EU (Cotonou) 2000 2000 Source: 1. Integration, Trade and Hemispheric issues Division, IDB
2. CARICOM Secretariat
Table 8 Currently Negotiated and Proposed Trade Agreements Country Bilateral
Collective
Bilateral
Regional
Grouping to
Regional
Grouping
Sub-
Hemispheric
Hemispheric Hemispheric
Grouping to
Extra
Hemispheric
Grouping
Trinidad & Tobago-Panama
CARICOM-
Chile
CARICOM-
ANDEAN
Community
Association of
Caribbean
States-ACS
FTAA CARICOM/ACP-
EU
Trinidad & Tobago-Costa Rica
Trinidad & Tobago-Mexico
Guyana-Brazil
Source: CARICOM Secretariat
14
Free Trade Area of the Americas
Within the next five years, the FTAA will remove nearly all barriers to trade and services
in a market of nearly 800 million people and over 11 trillion dollars in GDP. This free
trade area comprises the United States, Canada, and Latin America and the Caribbean. As
with the EU, the FTAA is expected to have a negative impact on fiscal revenues in the
short run. However the magnitude of trade from the USA suggests that the impact on tax
base may substantial in the short run. Table 5 indicates that the level of trade with the
United States is quite substantial, averaging 60 per cent of all hemispheric trade.
The CARIFORUM-EU REPA
The European Commission has proposed a Regional Economic Partnership Agreement
(REPA) as a successor agreement to the non-reciprocal Lomé agreements. According to
Bourne et al (1999), this proposal is essentially a Free Trade Area whereby the short run
costs for CARIFORUM countries are likely to exceed the gains. Given that this potential
agreement would be WTO plus2. Bourne et al (1999) conclude that given the overall
dependence of CARIFORUM countries on trade tax revenues the short-term effects of a
REPA are clear. Tariff reduction would cause revenue loss, which would be further
exacerbated by weakness in tax administration and narrowness of the tax base. These
characteristics further constrain the ability of the Member States to diversify revenue
sources. Bourne et al (1999) use Trinidad and Tobago as an example. They highlight the
problems that the country encountered when introducing the value added tax. An
underdeveloped business sector and register problems, among other things lead to tax
15
collection lags, which created divergence between actual and planned revenues. The
analysis here is as before, conditional on the import elasticities since positive macro-
effects (expansionary import volume) can compensate or mitigate revenue loss.
V. Tax Structure of Caribbean Economies
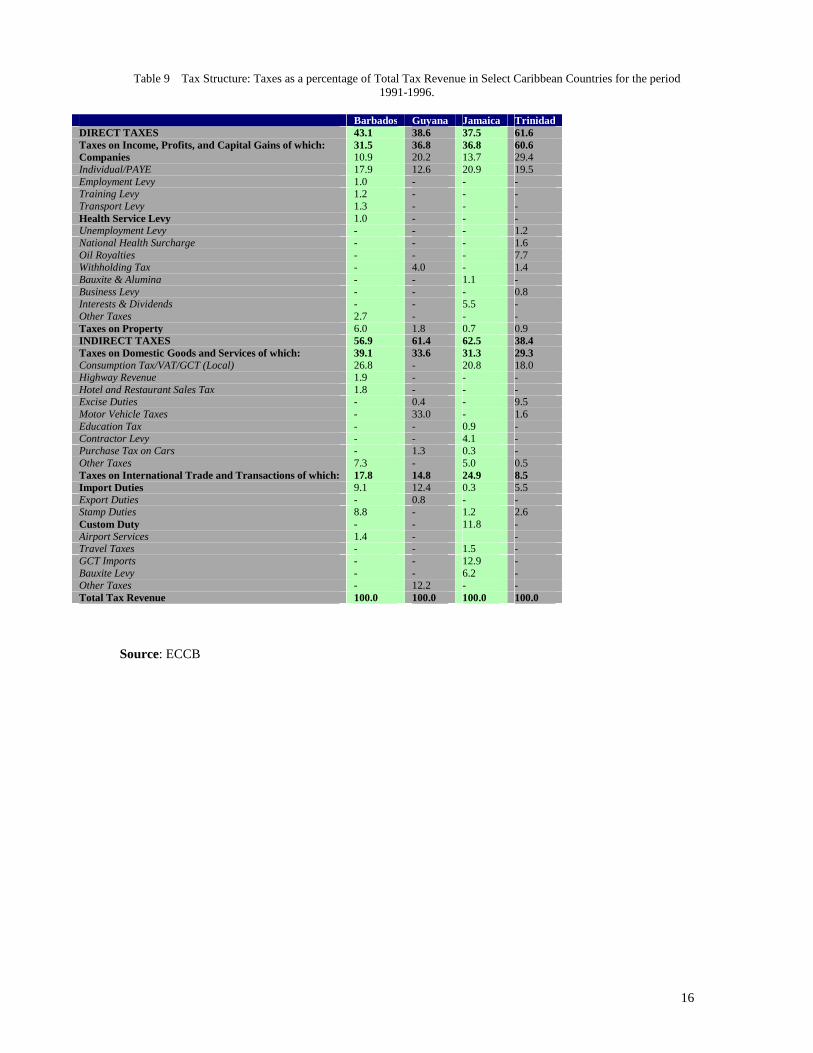
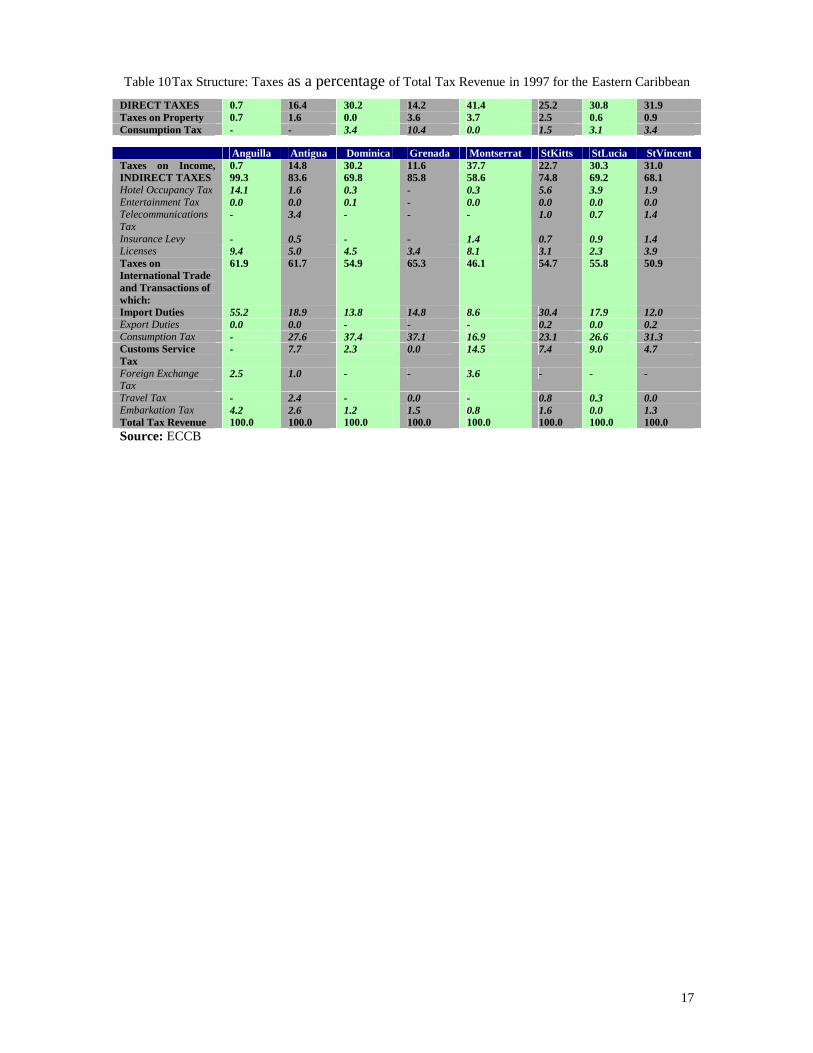
Peters (2002) indicates that the average tax rate3 over the last two decades ranged from
25% in Belize and the OECS to 38% and 32% in Guyana and Trinidad and Tobago
respectively. Tables 9 and 10 further illustrate the characteristics of Caribbean tax
structure. In the smaller OECS countries taxes on international trade accounted for over
50 % of tax revenue except in Montserrat where it was 46.1%. In the bigger Caribbean
territories such as Trinidad and Jamaica, the dependence on trade taxes is lower but still
high; it ranges from 8.5% in Trinidad and Tobago to 24.9% in Jamaica. Direct taxes
account for significant portions of total revenue in the bigger Caribbean territories and a
very small part in the smaller territories. In Trinidad Direct Taxes account for as much as
60.6% of total revenue on average, whereas for Barbados, Guyana and Jamaica direct
taxes are approximately a third of total tax revenue. There is also a dichotomy between
smaller states and larger states on the role of domestic consumption taxes because
consumption taxes are more significant revenue earners in the bigger territories than in
the smaller territories mainly due to the introduction of a broad based consumption type
VAT. The VAT accounts for 26.8 per cent of total revenue in Barbados, 20.8 per cent in
Jamaica, and 18.0 per cent in Trinidad and Tobago. In the OECS, however, the revenue
gained from consumption taxes on imported goods is substantial and in most cases
transcends revenue earned from import duties.
2 Member States will be expected to lower tariff rates below WTO bound rates. 3 This is defined as total tax divided by total income or GDP.
16
Table 9 Tax Structure: Taxes as a percentage of Total Tax Revenue in Select Caribbean Countries for the period 1991-1996.
Barbados Guyana Jamaica Trinidad DIRECT TAXES 43.1 38.6 37.5 61.6 Taxes on Income, Profits, and Capital Gains of which: 31.5 36.8 36.8 60.6 Companies 10.9 20.2 13.7 29.4 Individual/PAYE 17.9 12.6 20.9 19.5 Employment Levy 1.0 - - - Training Levy 1.2 - - - Transport Levy 1.3 - - - Health Service Levy 1.0 - - - Unemployment Levy - - - 1.2 National Health Surcharge - - - 1.6 Oil Royalties - - - 7.7 Withholding Tax - 4.0 - 1.4 Bauxite & Alumina - - 1.1 - Business Levy - - - 0.8 Interests & Dividends - - 5.5 - Other Taxes 2.7 - - - Taxes on Property 6.0 1.8 0.7 0.9 INDIRECT TAXES 56.9 61.4 62.5 38.4 Taxes on Domestic Goods and Services of which: 39.1 33.6 31.3 29.3 Consumption Tax/VAT/GCT (Local) 26.8 - 20.8 18.0 Highway Revenue 1.9 - - - Hotel and Restaurant Sales Tax 1.8 - - - Excise Duties - 0.4 - 9.5 Motor Vehicle Taxes - 33.0 - 1.6 Education Tax - - 0.9 - Contractor Levy - - 4.1 - Purchase Tax on Cars - 1.3 0.3 - Other Taxes 7.3 - 5.0 0.5 Taxes on International Trade and Transactions of which: 17.8 14.8 24.9 8.5 Import Duties 9.1 12.4 0.3 5.5 Export Duties - 0.8 - - Stamp Duties 8.8 - 1.2 2.6 Custom Duty - - 11.8 - Airport Services 1.4 - - Travel Taxes - - 1.5 - GCT Imports - - 12.9 - Bauxite Levy - - 6.2 - Other Taxes - 12.2 - - Total Tax Revenue 100.0 100.0 100.0 100.0
Source: ECCB
17
Table 10 Tax Structure: Taxes as a percentage of Total Tax Revenue in 1997 for the Eastern Caribbean
DIRECT TAXES 0.7 16.4 30.2 14.2 41.4 25.2 30.8 31.9 Taxes on Property 0.7 1.6 0.0 3.6 3.7 2.5 0.6 0.9 Consumption Tax - - 3.4 10.4 0.0 1.5 3.1 3.4
Source: ECCB
Anguilla Antigua Dominica Grenada Montserrat StKitts StLucia StVincent Taxes on Income, Profits, and Capital Gains of which:
0.7 14.8 30.2 11.6 37.7 22.7 30.3 31.0
Personal Income Tax
0.0 3.1 13.9 2.8 31.4 6.9 12.1 13.9
Corportate Income Tax
0.0 7.9 16.3 8.7 4.9 15.1 12.2 13.6
INDIRECT TAXES 99.3 83.6 69.8 85.8 58.6 74.8 69.2 68.1 Taxes on Domestic Goods and Services of which:
37.4 21.9 14.9 20.5 12.4 20.1 13.4 17.2 Hotel Occupancy Tax 14.1 1.6 0.3 - 0.3 5.6 3.9 1.9 Entertainment Tax 0.0 0.0 0.1 - 0.0 0.0 0.0 0.0 Telecommunications Tax
- 3.4 - - - 1.0 0.7 1.4
Insurance Levy - 0.5 - - 1.4 0.7 0.9 1.4 Licenses 9.4 5.0 4.5 3.4 8.1 3.1 2.3 3.9 Taxes on International Trade and Transactions of which:
61.9 61.7 54.9 65.3 46.1 54.7 55.8 50.9
Import Duties 55.2 18.9 13.8 14.8 8.6 30.4 17.9 12.0 Export Duties 0.0 0.0 - - - 0.2 0.0 0.2 Consumption Tax - 27.6 37.4 37.1 16.9 23.1 26.6 31.3 Customs Service Tax
- 7.7 2.3 0.0 14.5 7.4 9.0 4.7
Foreign Exchange Tax
2.5 1.0 - - 3.6 - - -
Travel Tax - 2.4 - 0.0 - 0.8 0.3 0.0 Embarkation Tax 4.2 2.6 1.2 1.5 0.8 1.6 0.0 1.3 Total Tax Revenue 100.0 100.0 100.0 100.0 100.0 100.0 100.0 100.0

Table 11 Tax Buoyancy in Select Caribbean Countries
ANG ANU DCA GDA MON SKN SLU SVG BAR GUY JAM TNT
Direct Taxes -1.7 1.4 4.6 11.5 -1.2 1.1 0.4 2.1 -0.9 1.4 0.9 0.9
Taxes on Income,
Profits, Capital Gains
-1.7 1.6 3.5 -0.5 -1.4 1.1 0.4 2.1 -0.8 1.4 0.9 0.9
Taxes on Property - - - - - - - - 0.3 1.9 1.2 1.4
Indirect Taxes 2.4 1.1 2.2 0.5 -1.0 0.8 0.9 1.2 1.0 1.2 1.1 1.3
Taxes on Domestic
Goods and Services
3.0 1.2 5.2 0.6 0.9 1.2 1.6 1.6 -0.4 1.3 1.0 1.5
Taxes on Int’l Trade
&Transactions
2.1 1.1 1.4 0.6 -1.3 0.7 0.7 1.1 2.5 1.1 1.2 0.9
Total Tax Revenue 2.5 2.9 3.0 0.7 -1.1 0.9 0.7 1.5 0.1 1.3 1.0 1.0
Source: ECCB Note: For Barbados, Guyana, Jamaica, and Trinidad and Tobago the period 1991-1996 was used to derive an average whereas for the other countries the year 1997 was employed. Table 11 illustrates the responsiveness of tax revenues in the Caribbean to changes in
income or GDP. Over the period 1991 to 1996, the tax buoyancy coefficient was 1.0 per
cent in Jamaica and Guyana due mainly to the high buoyancy for the indirect taxes.
Barbados recorded low tax buoyancy overall and for both direct and indirect taxes. For
the OECS countries, the indirect tax buoyancy coefficient ranges between 0.5 and 2.4,
whereas the overall average tax buoyancy coefficient stood at 1.3, thus indicating a
degree of elasticity between tax revenue and income.
The reduction of import duties, associated with trade liberalisation often has the effect of
reducing fiscal revenues because the level of tax receipts in small open economies is
heavily dependent on import and export trends. There are a number of measures of
dependence on trade taxes most notably the ratio of tax receipts from international trade
to total tax revenue, which is employed by this paper. Another measure is the ratio of
import duties to Gross Domestic Product4.
4 For a detailed description and analysis of CARICOM fiscal dependence on trade taxes, using various measures, see Nicholls et al (1999).
19
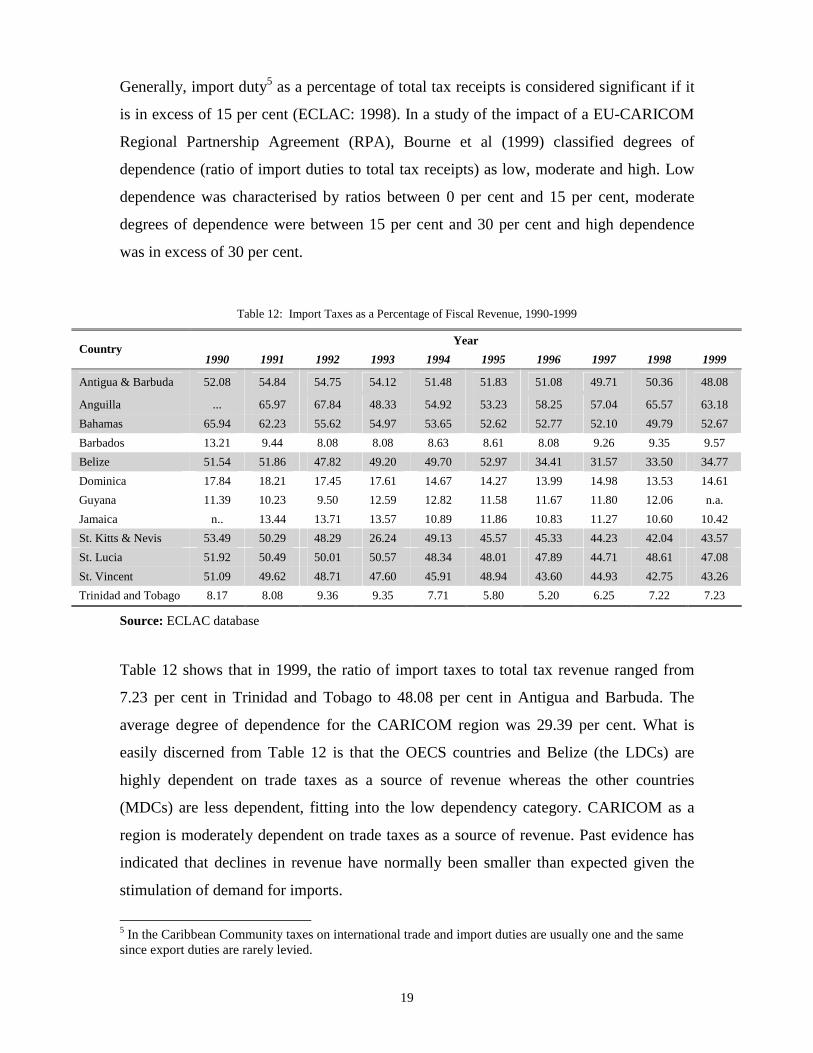
Generally, import duty5 as a percentage of total tax receipts is considered significant if it
is in excess of 15 per cent (ECLAC: 1998). In a study of the impact of a EU-CARICOM
Regional Partnership Agreement (RPA), Bourne et al (1999) classified degrees of
dependence (ratio of import duties to total tax receipts) as low, moderate and high. Low
dependence was characterised by ratios between 0 per cent and 15 per cent, moderate
degrees of dependence were between 15 per cent and 30 per cent and high dependence
was in excess of 30 per cent.
Table 12: Import Taxes as a Percentage of Fiscal Revenue, 1990-1999
Year Country
1990 1991 1992 1993 1994 1995 1996 1997 1998 1999
Antigua & Barbuda 52.08 54.84 54.75 54.12 51.48 51.83 51.08 49.71 50.36 48.08
Anguilla ... 65.97 67.84 48.33 54.92 53.23 58.25 57.04 65.57 63.18 Bahamas 65.94 62.23 55.62 54.97 53.65 52.62 52.77 52.10 49.79 52.67 Barbados 13.21 9.44 8.08 8.08 8.63 8.61 8.08 9.26 9.35 9.57 Belize 51.54 51.86 47.82 49.20 49.70 52.97 34.41 31.57 33.50 34.77 Dominica 17.84 18.21 17.45 17.61 14.67 14.27 13.99 14.98 13.53 14.61 Guyana 11.39 10.23 9.50 12.59 12.82 11.58 11.67 11.80 12.06 n.a. Jamaica n.. 13.44 13.71 13.57 10.89 11.86 10.83 11.27 10.60 10.42 St. Kitts & Nevis 53.49 50.29 48.29 26.24 49.13 45.57 45.33 44.23 42.04 43.57 St. Lucia 51.92 50.49 50.01 50.57 48.34 48.01 47.89 44.71 48.61 47.08 St. Vincent 51.09 49.62 48.71 47.60 45.91 48.94 43.60 44.93 42.75 43.26 Trinidad and Tobago 8.17 8.08 9.36 9.35 7.71 5.80 5.20 6.25 7.22 7.23
Source: ECLAC database Table 12 shows that in 1999, the ratio of import taxes to total tax revenue ranged from
7.23 per cent in Trinidad and Tobago to 48.08 per cent in Antigua and Barbuda. The
average degree of dependence for the CARICOM region was 29.39 per cent. What is
easily discerned from Table 12 is that the OECS countries and Belize (the LDCs) are
highly dependent on trade taxes as a source of revenue whereas the other countries
(MDCs) are less dependent, fitting into the low dependency category. CARICOM as a
region is moderately dependent on trade taxes as a source of revenue. Past evidence has
indicated that declines in revenue have normally been smaller than expected given the
stimulation of demand for imports.
5 In the Caribbean Community taxes on international trade and import duties are usually one and the same since export duties are rarely levied.
20
VI. Tariff Levels within CARICOM
Generally CARICOM has duty free trade among its members and a Common External
Tariff against third parties. CARICOM also has multilateral commitments in relation to
third countries, including tariff bindings. The Free Trade Area of the Americas (FTAA) is
likely to create further WTO plus tariff commitments.
Indications are that WTO agreements and outcomes of the Uruguay Round are
incorporated into domestic legislation at varying degrees within the Community, but
generally the Community has been slow in the implementation of these commitments.
Tariff bindings differ considerably among CARICOM States and sometimes conflict with
CET rates. It is not anticipated that WTO bound rates or phase CET reductions would
have a significant revenue effects since considerable time for adjustment and reform
enables Member States to take advantage of the opportunities presented by trade
liberalisation while avoiding the pitfalls.
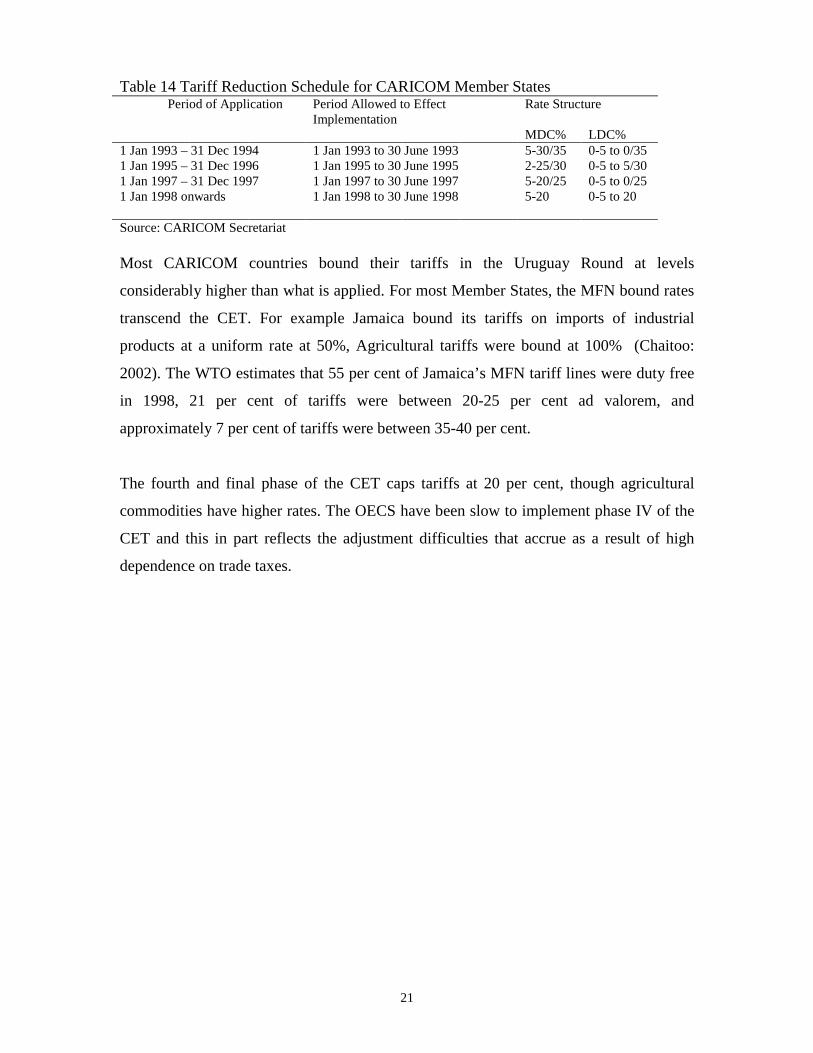
The Common External Tariff (CET) governs trade between the Caribbean Community
and third parties and serves as a protective trade instrument for the Community. In an
effort to reduce protection, Member Stated agreed in 1992 to a four-stage reduction in the
tariff rates, spanning over five (5) years. Table 2 below presents the proposed schedule of
reductions. Few Member States have complied with the CET reduction tariff schedule.
Member States do make an effort to introduce offsetting measures by increasing other
duties and charges (most falling almost exclusively on imports).
21
Table 14 Tariff Reduction Schedule for CARICOM Member States Period of Application Period Allowed to Effect
Implementation Rate Structure
MDC% LDC% 1 Jan 1993 – 31 Dec 1994 1 Jan 1993 to 30 June 1993 5-30/35 0-5 to 0/35 1 Jan 1995 – 31 Dec 1996 1 Jan 1995 to 30 June 1995 2-25/30 0-5 to 5/30 1 Jan 1997 – 31 Dec 1997 1 Jan 1997 to 30 June 1997 5-20/25 0-5 to 0/25 1 Jan 1998 onwards 1 Jan 1998 to 30 June 1998 5-20 0-5 to 20 Source: CARICOM Secretariat Most CARICOM countries bound their tariffs in the Uruguay Round at levels
considerably higher than what is applied. For most Member States, the MFN bound rates
transcend the CET. For example Jamaica bound its tariffs on imports of industrial
products at a uniform rate at 50%, Agricultural tariffs were bound at 100% (Chaitoo:
2002). The WTO estimates that 55 per cent of Jamaica’s MFN tariff lines were duty free
in 1998, 21 per cent of tariffs were between 20-25 per cent ad valorem, and
approximately 7 per cent of tariffs were between 35-40 per cent.
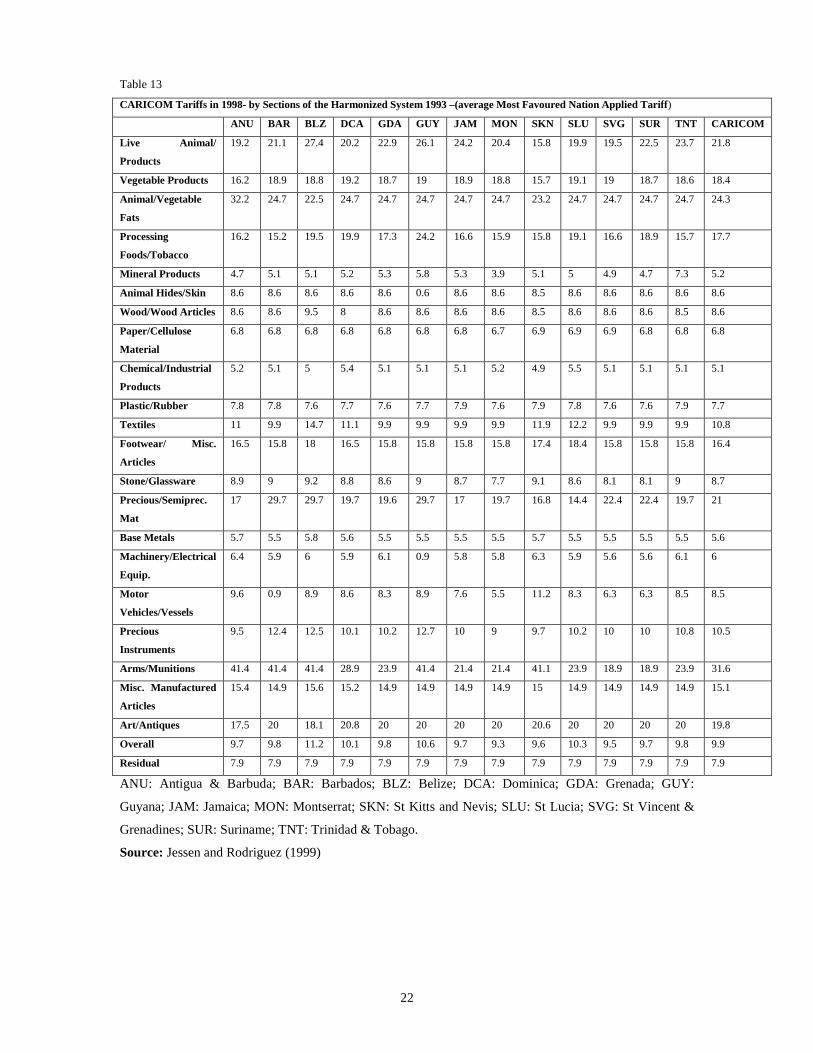
The fourth and final phase of the CET caps tariffs at 20 per cent, though agricultural
commodities have higher rates. The OECS have been slow to implement phase IV of the
CET and this in part reflects the adjustment difficulties that accrue as a result of high
dependence on trade taxes.
22
Table 13
CARICOM Tariffs in 1998- by Sections of the Harmonized System 1993 –(average Most Favoured Nation Applied Tariff)
ANU BAR BLZ DCA GDA GUY JAM MON SKN SLU SVG SUR TNT CARICOM
Live Animal/
Products
19.2 21.1 27.4 20.2 22.9 26.1 24.2 20.4 15.8 19.9 19.5 22.5 23.7 21.8
Vegetable Products 16.2 18.9 18.8 19.2 18.7 19 18.9 18.8 15.7 19.1 19 18.7 18.6 18.4
Animal/Vegetable
Fats
32.2 24.7 22.5 24.7 24.7 24.7 24.7 24.7 23.2 24.7 24.7 24.7 24.7 24.3
Processing
Foods/Tobacco
16.2 15.2 19.5 19.9 17.3 24.2 16.6 15.9 15.8 19.1 16.6 18.9 15.7 17.7
Mineral Products 4.7 5.1 5.1 5.2 5.3 5.8 5.3 3.9 5.1 5 4.9 4.7 7.3 5.2
Animal Hides/Skin 8.6 8.6 8.6 8.6 8.6 0.6 8.6 8.6 8.5 8.6 8.6 8.6 8.6 8.6
Wood/Wood Articles 8.6 8.6 9.5 8 8.6 8.6 8.6 8.6 8.5 8.6 8.6 8.6 8.5 8.6
Paper/Cellulose
Material
6.8 6.8 6.8 6.8 6.8 6.8 6.8 6.7 6.9 6.9 6.9 6.8 6.8 6.8
Chemical/Industrial
Products
5.2 5.1 5 5.4 5.1 5.1 5.1 5.2 4.9 5.5 5.1 5.1 5.1 5.1
Plastic/Rubber 7.8 7.8 7.6 7.7 7.6 7.7 7.9 7.6 7.9 7.8 7.6 7.6 7.9 7.7
Textiles 11 9.9 14.7 11.1 9.9 9.9 9.9 9.9 11.9 12.2 9.9 9.9 9.9 10.8
Footwear/ Misc.
Articles
16.5 15.8 18 16.5 15.8 15.8 15.8 15.8 17.4 18.4 15.8 15.8 15.8 16.4
Stone/Glassware 8.9 9 9.2 8.8 8.6 9 8.7 7.7 9.1 8.6 8.1 8.1 9 8.7
Precious/Semiprec.
Mat
17 29.7 29.7 19.7 19.6 29.7 17 19.7 16.8 14.4 22.4 22.4 19.7 21
Base Metals 5.7 5.5 5.8 5.6 5.5 5.5 5.5 5.5 5.7 5.5 5.5 5.5 5.5 5.6
Machinery/Electrical
Equip.
6.4 5.9 6 5.9 6.1 0.9 5.8 5.8 6.3 5.9 5.6 5.6 6.1 6
Motor
Vehicles/Vessels
9.6 0.9 8.9 8.6 8.3 8.9 7.6 5.5 11.2 8.3 6.3 6.3 8.5 8.5
Precious
Instruments
9.5 12.4 12.5 10.1 10.2 12.7 10 9 9.7 10.2 10 10 10.8 10.5
Arms/Munitions 41.4 41.4 41.4 28.9 23.9 41.4 21.4 21.4 41.1 23.9 18.9 18.9 23.9 31.6
Misc. Manufactured
Articles
15.4 14.9 15.6 15.2 14.9 14.9 14.9 14.9 15 14.9 14.9 14.9 14.9 15.1
Art/Antiques 17.5 20 18.1 20.8 20 20 20 20 20.6 20 20 20 20 19.8
Overall 9.7 9.8 11.2 10.1 9.8 10.6 9.7 9.3 9.6 10.3 9.5 9.7 9.8 9.9
Residual 7.9 7.9 7.9 7.9 7.9 7.9 7.9 7.9 7.9 7.9 7.9 7.9 7.9 7.9
ANU: Antigua & Barbuda; BAR: Barbados; BLZ: Belize; DCA: Dominica; GDA: Grenada; GUY:
Guyana; JAM: Jamaica; MON: Montserrat; SKN: St Kitts and Nevis; SLU: St Lucia; SVG: St Vincent &
Grenadines; SUR: Suriname; TNT: Trinidad & Tobago.
Source: Jessen and Rodriguez (1999)

23
VIII. The Fiscal Impact
According to a report on ‘Improving competitiveness for Caribbean Development’,
prepared by the Caribbean Trade and Adjustment Group, estimates indicate that a 50 per
cent multilateral liberalisation will result in 42 to 45 per cent decline in customs revenue.
The Trade and Adjustment Group anticipates that this decline would be somewhat off-set
by expansion in the taxable base that would occur as a result of increased imports and
exports.
Devarajan, Go and Li (1999) estimate import and export elasticities for 60 countries
including some Caribbean territories. Table 14 displays those results.
Table 14 Import and Export Elasticities for selected CARICOM States Country Import Elasticity Export Elasticity
The Bahamas 1.50; 1.44 …
Belize 0.66; 0.81 …
Grenada 0.22 …
Haiti 0.69; 0.62; 0.64; 1.62 0.43; 0.40; 0.37; 0.32; 0.30;
Jamaica 0.24; 0.37; 0.24 0.45; 0.22; 0.30; 0.29; 0.38; 1.55; 1.47
St Kitts & Nevis 2.80; 2.67 …
St Vincent & the Grenadines 1.09; 0.47 …
Trinidad & Tobago 0.81; 0.62; 0.78; 0.76; 0.61; 1.01 …
Source: Devarajan, Go and Li (1999)
… means not available.
Note: For details of estimation methodology, number of observations and statistical attributes of estimates,
see above captioned reference.
Devarajan, Go and Li (1999) state that even if one of the elasticities is close to zero,
revenue will decline unequivocally, reaching close to zero regardless whether the other
elasticity is high. Moreover for imports to grow and tariff collection to compensate for
the fall in tariffs, the import elasticity has to be high. They argue that due the balance of
24
trade constraint imports cannot substitute perfectly for domestic goods unless the supply
responds by exporting. This means export elasticities must be high as well for tariff cuts
to be self-financing. In the example they give, both elasticities have to be greater than 20.
Clearly based on these criteria, tariff reduction in the Caribbean Community will not be
self financing.
Nicholls et al (1999) examine using an Almost Ideal Demand System (AIDS) model6, the
impact of tariff removal from the CARIFORUM-EU REPA on revenues. Their results
indicate that for the OECS, Jamaica, and Trinidad and Tobago, tariff removal under a
FTA would result in a decline of revenues from trade taxes. The estimated magnitudes of
those changes tell a story because in Jamaica and Trinidad and Tobago, revenues from
trade taxes were projected to decline by 3.4 and 2.36 per cent respectively. The OECS
revenues on the other hand would decline by 8.4 per cent. This outcome obviously is a
direct function of dependence on trade taxes, since the OECS is highly dependent. In the
OECS as whole tax collected on international trade represented 57.4 per cent of tax
revenue in 1999 and 26. 3 per cent of the value of imports. Consumption tax was the
main source of tax revenue (28.3 per cent of tax revenue), followed by tariffs (17.8 per
cent) and customs service charges (7.3 per cent). Currently the OECS Member States are
working on reform of the tax system with a view to introduce a value added tax.
6 This is an import expenditure function.
25
CARICOM countries are extremely open, and not only are they big importers of
consumer goods, but they are also big importers of production and intermediate goods.
Merchandise trade accounts for in excess of 50 per cent of GDP (ECLAC: 1998) and
when services are included this percentage is much higher. On the supply side their
production base is fairly narrow, relying in most cases on a single commodity export for
earnings. This constrains the ability of Caribbean economies to adjust quickly so as to
mitigate the effects of short-term shocks. Moreover the highly specialised nature of
CARICOM production structures greatly increases their fiscal vulnerability. Solutions,
therefore, lie not only in tax reform but also in longer-term structural reform. It can
already be inferred that the smaller countries of CARICOM will be more severely
affected. Most available literature on this issue supports this conclusion.
The 1997 Report on Small Economies and Western Hemispheric Integration
(Independent Group of Experts) indicated that a major challenge with establishing a Free
Trade Area of the Americas is to integrate countries of diverse size and levels of
development. The Caribbean faces two constraints, namely small size and a lower level
of development. Associated with small size are structural features such as high
dependence on external trade, small domestic markets, un-diversified and sometimes
mono-production structures with narrow tax bases. Mature and highly developed
countries usually depend more on sales or value added taxes and hardly if at all on trade
taxes, so high dependence on trade taxes is in some sense symptomatic of the level of
maturity in an economy. CARICOM countries have attempted to reposition themselves in
the new global economy by pursuing prudent macroeconomic management and regional
integration.
Naturally there are costs and benefits associated with any action, and in the case of the
Caribbean lowering tariffs has immense potential especially in the area of expanding
tourism and service production. The costs however are real in the short run, so the only
alternative for Member States is to pursue alternative sources of income such as sales or
value added tax. Because reforming the tax structure requires a new level sophistication,
new more efficient methods of tax collection and administration, and a search for
26
alternative tax bases, fiscal reform can be a timely but worthwhile exercise. Many
Member States have already started this process, and this must be an ongoing one. It is
important that Member States design and implement fiscal reform to maximise
compliance while simultaneously providing incentives for savings and investment and the
overall promotion of economic development.
Over the years 1994 to 1998, the CARICOM region became more integrated with the
international economy, as measured by their increasing degrees of openness. Government
consumption on average has fallen relative to GDP. Trade shocks have taken the form of
diminished preferential trading arrangements (PTA). In general, the revenue effects of
trade liberalisation are uncertain. Blejer and Cheasty (1990), Tanzi (1989) conclude that
ultimately the net impact of trade liberalisation on tax revenue is an empirical matter.
Much depends on countries initial conditions and other tax measures that they introduce
at the time of tariff reduction. Indeed depending on the level of import elasticities of
substitution, revenues could possibly increase. If however import levels remained the
same, the effect of a reduction in tariff rates would be to immediately lower revenue.
However, imports are likely to expand given the reduced cost of importing, thus
compensating at least partially for the lower taxation rates. How pronounced the net
effect will be, is highly dependent on the initial level of tax rates as mentioned in the
introduction.
Ebrill et al (1999) state that revenue will least likely be affected or could even expand
when:
� The initial position is highly restrictive;
� Trade liberalisation involves the tariffication of quantitative restrictions, the
auctioning of licenses to import, or both;
� Trade liberalisation includes such reforms as a reduction in tariff dispersion, the
introduction of a minimum tariff, or the elimination of exemptions;
27
� Trade liberalisation is accompanied by reforms in customs and tax
administrations, which also reduce the incentives to evade taxes; and
� Trade liberalisation is supported by sound macroeconomic policies that ensure
that liberalisation is consistent with external balance.
The erosion of trade preferences in the European Union market and Caribbean Basin
Initiative (CBI) preferences under NAFTA7 and the concomitant reduction in
concessional finance and/or official development assistance (ODA) has made adjustment
all the more challenging for CARICOM Member States. Weak tax administration in the
Less Developed Countries (LDC) of CARICOM exacerbate the problem as they
constrain the ability of the Member States to accumulate much needed public savings.
Most states continue to reform their tax administrative systems and some have made
substantial gains in this area.
Moreover, intense competition among Member States for Foreign Direct Investment has
caused Member States to offer overly generous duties and tax exemptions and diverse
subsidies. This has put severe downward pressure on corporate income receipts (Loser:
1999). As a result of this CARICOM States must streamline and rationalise their tax and
investment incentive regimes8. This is best accomplished through regional tax
harmonisation and co-ordination efforts to reduce the brutal effects of competition for
capital. This will enable Member States to shore up public savings and better deal with
tariff reductions.
7 See List of Acronyms and Abbreviations, p2. 8 See Exploring Caribbean Tax Structure and Harmonisation Strategies, CARICOM Secretariat (5th COFAP Meeting Research Paper).
28
Tanzi and Zee (2000) state that nominal tariff reductions are likely to cause short-term
revenue loss, though in the long-run the response is conditional on import elasticities.
They advocate three compensatory measures, namely:
1. Reducing the scope of tariff exemptions in the existing system9
2. Compensating for the tariff reductions on excisable imports by a commensurate
increase in their excise rates;
3. Adjusting the rate of the general consumption tax (such as the VAT) to
meet remaining revenue needs. With regard to introducing a Value Added Tax valuable lessons can be drawn from the
success of Trinidad and Tobago and Barbados. Countries need to remove overly generous
tax incentive regimes.10 Evidence from different sources (Devarajan, 1999; ECLAC,
1999; IMF, 2000) indicate that ‘trade liberalization may produce a revenue depleting
effect.’
VIII. Trade Negotiation Solutions The Caribbean Community faces a number of challenges in the near future. The region
will have to negotiate its way through a growing maze of trade negotiations at the
regional, hemispheric, and international levels. At the regional level CARICOM
countries are negotiating among themselves free trade in services, as part of a move
toward the CARICOM Single Market and Economy. The FTAA and CARICOM-EU
regional partnership agreements are major negotiations that involve CARICOM’s major
trading partners namely the United States, Canada, and the European Union. Other
negotiations include hemispheric bilateral agreements and the WTO (to include GATS).
9 This can be done by imposing a low minimum tariff on all imports. 10 For detailed policy solutions, see Caribbean Trade and Adjustment Group report on Improving Competitiveness for Caribbean Development.

29
It is fair to state that given that CARICOM has non-reciprocal market access agreements
with all of its major trading partners and with other countries (under the Generalised
System of Preferences), CARICOM has little to gain from tariff negotiations with their
main trading partners (Chaitoo: 2002). Over 95 per cent of Commonwealth Caribbean
country exports receive preferential, non-reciprocal duty free entry into Canada and up to
63.4 per cent of CARICOM exports receive duty free entry into the United States.
Approximately 21.2 per cent of CARICOM exports face a 0-5 per cent tariff.
CARICOM’s market access, therefore, compares favourably with other regional
groupings such as the Andean Community (39.7 % duty free imports into the USA),
Mercosur (61.4% duty free imports into the USA) and CACM (40.4 duty free imports
into the United States.
In general CARICOM’s approach has been one of promoting limited reciprocity for small
countries with longer phase-ins of agreement terms and requisite safeguards (INTAL:
2002). The underlying rationale for this approach is that CARICOM countries are acutely
vulnerable to adverse economic shocks and these ‘special’ circumstances should be taken
into account when applying XXIV of the General Agreement on Tariffs and Trade
(GATT).
Chaitoo (2002) states Trade Ministers under the FTAA market Access Negotiations
decided in March 1998 at San Jose on the following:
� The FTAA will be consistent with the provisions of the WTO, including GATT
Article XXIV (1994) and its understanding on the Interpretation of Article XXIV of
the GATT 1994 to progressively eliminate tariffs and non-tariff barriers as well as
other measures with equivalent effect, that restrict trade between participating
countries.
� All tariffs will be subject to negotiation
� Different trade liberalisation timetables may be negotiated.
30
� To facilitate the integration of smaller economies and their full participation in the
FTAA negotiations.
Even though the FTAA is designed to be WTO compatible, it has been so structured to
extend special and differential treatments to smaller economies (Arthur: 2001). Special
and Differential treatments is therefore an obvious solution and CARICOM has
continued to argue with success that their special circumstances warrant different
treatment. Based on the analysis presented so far, it is clear that CARICOM countries
will have to make a relatively greater economic and fiscal adjustment that other
participating groups in the FTAA. This is due to CARICOM’s high dependence on trade
taxes for government revenue, and its economic structure with a higher ratio of trade
preference induced activity to GDP than anywhere else. The small size of CARICOM
countries and high fixed costs associated with introducing replacement taxes means that
effective participation in the FTAA will extended phase-in periods to allow these
economies to adjust their production and fiscal structures.
Special and Differential treatment should comprise the following:
� FTAA must have longer phase-in periods;
� Special derogations from agreed liberalisations where necessary;
� Very high thresholds in particular sectors before liberalisation, for example
government procurement;
� Longer lists of sensitive industries than is normally the case;
� Special arrangements to allow the small economies affordable access to costly dispute
settlement mechanisms;
� Technical assistance in relation to capacity building and institutional reform; and

31
� Access to a social cohesion or adjustment fund. The final trade negotiation solution is to start tariff negotiations at rates that are not too
low, so as to concede before the process begins. The base rate should be as close to the
WTO MFN rate as possible taking into consideration that the FTAA must be WTO-plus.
IX. Fiscal Solutions The magnitude of the impact of trade liberalisation is conditional on the type of fiscal
structure a country may have. In the case of CARICOM, the governments are highly
dependent on trade taxes. Hence, there is an obvious case for fiscal reform.
First of all it is imperative that Member States pursue prudent fiscal management. This
entails increasing public sector savings, efficient and effective public sector investment,
and reducing wasteful transfers to loss-making state enterprises, cutting the ‘fat’ in civil
service payrolls, and reducing the scope for wasteful spending. In this regard, there is
urgent need for civil service reform. CARICOM countries have already seen
improvements in their expenditure control systems and enhancement of tax and
administration. Overly generous discretionary and distortionary fiscal incentive regimes
need to be replaced with tax environments that are stable and credible.
As mentioned earlier in the paper, countries can introduce compensatory measures like
reducing the scope of tariff exemptions in the system in favour of imposing low
minimum tariffs on all imports. This has the added benefit of removing distortions and
raising the credibility of the tax system. Caribbean governments can also raise excisable
duties on excisable imports to mitigate or compensate for revenue loss fom lower tariffs.
In fact many Caribbean governments have introduced environmental levies, raised
customs charges and raised consumption tax rates.
One of the major fiscal adjustments solutions is to introduce and/or strengthen broad
based taxes, such as the value-added tax and corporate and personal income taxes while
32
simultaneously developing alternative revenue or underused revenue sources such as
property taxes and taxes on the self employed.
The specific form a general broad-based indirect tax should assume is debatable but
Barbados and Trinidad and Tobago have had success with the introduction of the VAT.
The VAT collections have exceeded revenue expectations in Barbados and indeed this
tax is known for its ability to enhance revenues.
In conclusion, adjustment solutions revolve around improving efficiency and prudence in
fiscal management both on the revenue and the expenditure side. CARICOM must
reform its fiscal system to reflect a lower dependence on trade taxes and improve the
credibility of the tax and incentive regime.
33
X. Conclusion Trade Liberalisation will engender decreased reliance on border taxes and loss of fiscal
receipts for Member States. The magnitude is difficult to assess, but indications are that
in the short run revenue, shortfall could be substantial. Member States must pursue
prudent fiscal management, keeping expenditures roughly in line with revenues, if
possible expanding public savings. Member States must widen the tax net and develop
new tax bases. This includes improving tax collection and administration.
34
References
Arthur, Owen, (2001), ‘The Promise and the Peril: A Caribbean Perspective on the
FTAA’, Keynote Address at the 2001 CLAA Miami Conference.
Blejer, Mario, and Adrienne Cheasty, (1990), ‘Fiscal Implications of Trade
Liberalisation’, in Fiscal Policy in Open Developing Economies, ed. By Vito Tanzi
(Washington: International Monetary Fund), pp.66-81
Bourne, Compton, (1999), ‘Regional Economic Partnership Agreement between the
European Union and CARIFORUM ACP countries Volume One: Economic Aspects of a
Regional Economic Partnership Agreement’ (unpublished: Regional Negotiating
Machinery-RNM).
Caribbean Centre For Monetary Studies, Report on the Economic Performance and
Convergence of the CARICOM Region (for the year ending December 2001), May 24,
CARICOM Central Bank Governors Meeting.
Caribbean Community Secretariat, (2000), Caribbean Trade and Investment Report 2000:
Dynamic Interface of Regionalism and Globalisation, Ian Randle Publishers, Kingston.
Caribbean Community Secretariat, (2001), ‘Exploring Caribbean Tax Structure and
Harmonisation Strategies’, 5th Meeting of the COFAP, St Georges, Grenada.
Caribbean Group for Economic Co-operation in Economic Development, (2000)
‘Caribbean Economic Overview, World Bank.
Caribbean Trade and Adjustment Group, (2001), ‘Improving Competitiveness for
Caribbean Development’, CARICOM Negotiating Machinery and CARICOM Secretariat
35
Chaitoo, Ramesh, (2002), ‘Tariff Negotiation Methods and Modalities in the FTAA:
Implications for CARICOM’, Caribbean Regional Negotiating Machinery, Barbados.
Deaton A. and J. Muellbauer, (1980), ‘An almost ideal demand system’, American
Economic Review, Vol.70 (3), pp. 312-326.
Devarajan, Shantayanan, Delfis S. Go, Hongyi Li, (1999), ‘Quantifying the fiscal effects
of trade reform: A general equilibrium model estimated for 60 countries’, World Bank.
Eastern Caribbean Central Bank, (1999), ECCB Area Annual Statistical Digest 1999.
Ebrill, Liam, Janet Stotsky, Reint Gropp, (1999), Revenue Implications of Trade
Liberalization, IMF Occasional Paper No. 180.
ECLAC, (1998), The Fiscal Covenant: Strengths, Weaknesses, Challenges, Chile.
FTAA- Consultative Group on Smaller Economies (Tripartite Committee), (2001), ‘The
Fiscal Implication of Trade Liberalisation: Issues for the Free Trade Area of Americas’.
Greene, William H., Econometric Analysis, 3rd Edition, Prentice Hall, New Jersey.
Hamilton, J.D., (1994), Time Series Analysis, Princeton University Press, New Jersey.
Independent Group of Experts, (1997), ‘Overcoming Obstacles and Maximizing
Opportunities: Smaller Economies and Western Hemispheric Integration’,
Johnston, Jack J., and John Dinardo, Econometric Methods, 1997, McGraw-Hill, New
York.
Loser, Claudio M., (1999), ‘Globalisation: Challenges and Opportunities for the Eastern
Caribbean Region’, Address given at the Seminar organised by the St Kitts-Nevis
Economics Society, July 15, Basseterre.

36
Nicholls, Shelton., Janice Christopher-Nicholls, Philip Colthrust, (1999), ‘Evaluating the
Fiscal Impact of a Potential Regional Economic Partnership Agreement (REPA) between
the European Union and the Small Island Economies of CARICOM’, University of the
West Indies Department of Economics.
OECD, (2000), The European Union’s Trade Policies and their Economic Effects, Paris
Peters, Amos, and Marlon Bristol, (2002), ‘Value Added Tax: Is it Suitable for the
Caribbean Community?’, CARICOM Secretariat.
Peters, Amos C., (2002), ‘Exploring Caribbean Tax Structure and Harmonisation
Strategies’, Bulletin for International Fiscal Documentation, Vol. 56, No. 5.
Tanzi, Vito, (1989), ‘Impact of Macroeconomic Policies on the Level of Taxation and the
Fiscal Balance in Developing Countries’, Staff Papers, International Monetary Fund, Vol.
36 (September), pp.633-56.
Tanzi, Vito, and Howell H. Zee, (2000), ‘Tax Policy for Emerging Markets: Developing
Countries’, IMF Working Paper, International Monetary Fund, WP/00/35 (March).
Viner J., (1950), The Customs Union Issue, New York: Carnegie Endowment for Peace.
World Bank, (2000), World Development Indicators CD ROM 2000.
World Trade Organisation, (2001), OECS Trade Policy Review.
Worrell, D, (1993), ‘Economic Integration with Unequal Partners: The Caribbean and
North America’, Central Bank of Barbados.
Www.imf.org
37
Appendix
Table (i) Selected Indicators Some macroeconomic indicators of CARICOM Member States
Country GDP
(US$
billions
1998)
Inflation
Rate
(1998)
GNP
per
capita
annual
growth
rate
(1990-
1998)
Population Agriculture
(in % of
GDP) 1998
Manufacturing
(in % of GDP)
1998
Services
(in % of
GDP)
1998
Human
Development
Index (HDI)
1998
Land
Area
(Square
Km)
GDP per
capita
(US$2001)
Antigua&Barbuda 0.6 2.8 3.5 0.1 4 18.9 77.1 0.833 442 8050
Bahamas 3.7e … -0.9 0.3 … … … 0.844
Barbados 2.3 3.8 0.7 0.3 6.6 20 73.4 0.858 431 9121
Belize 0.7 0.9 0.5 0.2 18.7 25.5 55.8 0.777 22,972 3,218
Dominica 0.2 -0.4 1.4 0.1 20.2 22.5 57.3 0.793 750 3,668
Grenada 0.3 3.6 2.2 0.1 8.4 22.2 69.4 0.785 344 4,040
Guyana 0.7 3.2 8.9 0.8 34.7 32.5 32.8 0.709 214,970 761
Jamaica 6.4 5 0.6 2.5 8 33.7 58.4 0.735 10,990 2,866
Montserrat - - - - - - - - - -
St Kitts-Nevis 0.3 3.3 4.5 … 4.6 24.3 71.1 0.798 269.4 6,420
St Lucia 0.6 2 1.4 0.2 8.1 18.9 72.9 0.728 616 4,206
St Vincent 0.3 2.3 2.6 0.1 10.9 26.9 62.2 0.738 389 2,907
Trinidad&Tobago 6.4 6.7 2.1 1.3 1.8 47.5 50.7 0.793 5,128 4,230*
Suriname 0.3f … 0.5 0.4 … … … 0.766 163,820 1,660*
Source: CARICOM Secretariat, IMF
* means in the year 1999
Table (ii) Current Fiscal Balance in Millions of National Currency (Absolute) Actual
Countries 1991 1996 2001
Bahamas -14.5 40.7 57.4
Barbados 100.4 51.7 121.5
Belize 73.8 41.9 38.6
Guyana -6,559.3 11,173.6 -5,567.8
Jamaica 3,872.1 -1,788.4 -12,410.0
EC Currency Union 90.6 100.7 -85.4
Suriname -655.4 -6,082.0 22,190.0
Trinidad & Tobago 651.7 745.8 784.9
Source: Caribbean Centre for Monetary Studies

38
Table (iii) Current Fiscal Balances (in % of GDP) Actual
Countries 1991 1996 2001
Bahamas -1.1 1.0 2.4
Barbados 3.0 1.3 4.0
Belize 8.5 3.5 2.7
Guyana -0.3 11.3 -1.2
Jamaica 8.0 -0.8 1.1
EC Currency Union 1.6 1.6 1.0
Suriname -17.6 -3.0 -10.2
Trinidad & Tobago 2.9 2.2 4.0
Average 0.9 2.3 0.2
Source: Caribbean Centre for Monetary Studies
Table (iv) Overall Fiscal Balance (in % of GDP) Actual
Countries 1991 1996 2001
Bahamas -3.9 -0.9 -1.9
Barbados -1.4 -3.2 -3.7
Belize 4.9 -0.4 -11.4
Guyana -0.2 -1.6 -8.3
Jamaica 3.6 -5.1 -6.9
EC Currency Union -2.1 -1.7 -6.5
Suriname -16.6 -3.0 -1.1
Trinidad & Tobago -0.2 0.5 -0.1
Average -2.0 -1.9 -5.0
Source: Caribbean Centre for Monetary Studies