the financial markets outlook - oecd.org · the financial markets outlook ... financial crisis with...
TRANSCRIPT
OECD Business and Finance Outlook 2016
© OECD 2016
35
Chapter 1
The financial markets outlook
The global economy is caught between two major headwinds: the reversal of the investment-heavy commodity supercycle; and the “L-shaped” recovery in advanced economies caused by the aftermath of the financial crisis and the interaction of re-regulation with low and negative interest rates. The zero and even negative time value given to money is having perverse effects. Investors are being herded into concentrated and less liquid positions which work against long-term value creation and productivity growth. Normalisation of interest rates and a sustainable recovery of asset prices is shown to depend on which global scenario emerges: an “inflation first” set of policies favoured by central banks, and avoidance of a “creative destruction” phase to deal with over-investment and excess capacity in certain sectors and countries; or “productivity first” policies that bring about structural adjustment more quickly. The scenario most likely to emerge is one of continued monetary ease and choppy and sometimes volatile markets. Equities are least overvalued but cannot rise sustainably on monetary policy alone. Longer-run negative valuation adjustments are implied for some of the other most severely overvalued asset classes.
1. THE FINANCIAL MARKETS OUTLOOK
OECD BUSINESS AND FINANCE OUTLOOK 2016 © OECD 201636
Main findingsThe world is caught between two structural headwinds: a) the reversal of the commodity
supercycle and the related (and often underestimated) energy and materials company
investment on which growth came to depend; and b) the aftermath of the global
financial crisis with re-regulation contributing to a continuation of the L-shaped
recovery in advanced economies, and low and negative interest rates hurting bank
returns and introducing distortions in investment portfolios.
The supercycle headwind was caused by massive over-investment in the BRIICS, especially
the People’s Republic of China, and the sector misallocation of resources globally resulting
from it. The return on equity, less the cost of capital, is negative in the key supercycle
sectors in emerging economies and this has spilled into other sectors globally. Despite a
bounce related to recent Chinese policy, commodity prices are low and the Baltic Dry Index
was at an all-time low in early 2016. This will take years to set right.
Some regions (unlike the United States) have not been able to deal with non-performing
loans by taking them off bank balance sheets; and bank exposure to energy assets is a
problem. Both issues are reinforcing the L-shaped recovery. Negative interest rates
interact with regulatory measures that force banks to hold high quality liquid assets.
Bank distance-to-default (DTD) measures are declining again.
The low and sometimes negative interest rates imply a zero or negative time value of
money which is causing investor responses that portend problems for the future. Investors
are being herded into concentrated trades with poor liquidity. A kind of barbell has
developed with alternative assets: with private equity (because they specialise in managing
long-term risk premiums) and exchange-traded funds (because their fees are low and
easier access to illiquid assets can be obtained with promises of daily liquidity) at one end;
and products which generate absolute cash-like returns based on leverage at the other end.
In between is an allocation to equities and bonds within which further herding of investors
into concentrated positions is found: in high-yield non-investment grade bonds; and in
equities that focus on providing strong dividends and buybacks (instead of investment).
Cross-border divestment (apparent in mergers and acquisition activity) concentrated in
emerging economies accelerated after the crisis. To this weakened longer-term trend
component was added portfolio outflow pressure at the turn of the year when US
tightening came into view, resulting in exchange rate pressures (temporarily abated in
March with the softer Federal Reserve tone).
Normally markets have a way of forcing required policy adjustments. But because emerging
countries are less market oriented, pressures arising from resource misallocation are
also relayed elsewhere. Emerging countries (and notably China) have increased market
restrictions and Chinese equity prices are distorted by policy actions.
Corporate borrowing is concentrated in the supercycle sectors (especially energy,
materials and capital goods) which are particularly exposed to falling commodity prices.

1. THE FINANCIAL MARKETS OUTLOOK
OECD BUSINESS AND FINANCE OUTLOOK 2016 © OECD 2016 37
The impact of normalisation or “lift-off” in interest rates will depend on whether this
occurs as an “inflation first” scenario with more monetary ease and emerging economy
investment spending (which raises global supply further), or as part of a “productivity
first” strategy led by structural policy. With the former, central banks would be obliged to
lift interest rates in response to inflation before the “creative destruction” phase to deal
with excess capacity, as happened in 2009. The “lift-off” in interest rates would turn into
a two-step process.
If a healthy “creative destruction” phase ensued, as higher interest rates confronted
companies with a realistic cost of capital and structural policies were implemented, then
the scene would be set for more sustainable growth and normalised interest rates later
on. The required structural policies to lift productivity that might actually work, based
on evidence from the analysis of financial decisions of companies that succeeded
following the crisis, are set out.
If monetary policy continues to try to do the heavy lifting without global structural
reform, then choppy and sometimes volatile markets with little sustainable rise in asset
valuations will be the result. Equity is the least overvalued asset class, but even here a
sustained rally would be unlikely unless productivity growth accelerates – it cannot be
based on monetary policy alone.
IntroductionSeven years of extremely easy monetary policy has not restored the investment and
productivity growth needed to raise income per head, real wages, demand and growth.
This policy was originally designed to stabilise the financial system and support economic
recovery, but somehow has slipped into trying to compensate for the absence of the other
policies that are needed. Monetary policy is now trying to deal with issues that are not
wholly “nominal” in their origins.
The world economy, which has seen poor growth and no sign of inflation since the
global crisis, is facing two major headwinds:
The reversal of the commodity supercycle based on over-investment which has led to
excess capacity in emerging economies; and
The L-shaped recovery in the advanced economies resulting from deleveraging, as banks
struggle to deal with non-performing loans in some parts of the world while new
financial regulations are imposed.
Central banks have stepped in because other policies have not dealt with these
structural problems at their source. However, quantitative easing and low-interest-rate
monetary policy can do little to correct over-investment in global industrial sectors. At this
point, the unintended consequences of such policy may be harming the prospect of
sustainable recovery.
Zero rates imply a zero time value for money and can encourage short-termism, whereas
innovation and productivity growth require long-term risk taking in capital spending
and its financing.
Low and negative interest rates may combine with regulatory factors to hurt banks in
some advanced economies.
These policies have also created incentives for investors that may lead to problems for
the future. Very low rates have created a demand for a kind of portfolio “barbell” in the

1. THE FINANCIAL MARKETS OUTLOOK
OECD BUSINESS AND FINANCE OUTLOOK 2016 © OECD 201638
world of institutional investors: large asset allocations to both i) private equity and
low-cost exchange-traded funds (ETFs) giving easy exposure to less liquid assets at one
end; and ii) capital market risk assets, based on leverage, that pay higher short-term
cash yields (e.g. hedge and absolute return funds) at the other end. In between is an
allocation to equities and bonds within which further herding of investors into
concentrated positions is found: in high-yield non-investment grade bonds; and in
equities that focus on providing strong dividends and buybacks.
This chapter is concerned with analysing these issues and presenting a financial outlook
based on the research within this, and some of the other chapters, in this publication.
Headwind 1: The reversal of the commodity supercycleThe prolonged boom and subsequent collapse of energy and commodity prices is
related to the reversal of the so-called “supercycle”. The development strategy in emerging
economies based on saving, state-driven investment and exporting to advanced economies
was never going to be sustainable. This is because: the group became too big for all to follow
the “Asian Tigers” model; and investment-led-growth using existing technology within the
lower-value-added parts of the global supply chain does not enhance company productivity
growth.1 Figure 1.1 shows national saving by major countries and regions in the global
economy. Saving declines in 2015 and national investment follows, more-or-less, exactly the
same pattern. Prior to the 2000s, emerging market national saving and investment was
around 20% of the world economy total and it then rose to over 50% by 2015 – in the space of
a single decade. By far the greater part of the rise in saving and investment in the world
economy is attributable to emerging market economies (EMEs) and to China in particular,
although Europe also rose. At the start of the 2000s, China was responsible for around 5% of
the total and subsequently this rose to be over 30%, far in excess of the United States or
Europe, both at around 20% each. State-owned enterprises (SOEs) and banks were heavily
involved in the process within EMEs, so market discipline was largely absent in the allocation
of resources.
Figure 1.1. Emerging economies drive recent surge in gross national saving and investment, 1995-2015
Note: Europe refers to the European Union, Norway and Switzerland.Source: OECD calculations, IMF World Economic Outlook Database.
1 2 http://dx.doi.org/10.1787/888933362112
02000400060008000
100001200014000160001800020000
1995 1996 1997 1998 1999 2000 2001 2002 2003 2004 2005 2006 2007 2008 2009 2010 2011 2012 2013 2014 2015
USD bln
United States Europe Japan Australia & New ZealandAsian Tigers BRIIS China Other EMEs

1. THE FINANCIAL MARKETS OUTLOOK
OECD BUSINESS AND FINANCE OUTLOOK 2016 © OECD 2016 39
This strategy in countries often poor in natural resources stimulated investment in the
energy, materials and industrials sectors on an unprecedented scale. This growth led to
over-investment in these sectors; and this began reversing in 2015. The extent of the
importance of this reversal in global growth is easy to underestimate.
Figure 1.2 shows a long time series of key commodity prices and the Baltic Dry Index
(an index of the US dollars paid per day to hire four categories of ships2 over 23 shipping
routes). This presents a price snapshot of how over-investment works. Demand picks up
due to state-driven investment and growth, commodity and shipping shortages abound and
prices rise sharply. This rise in price stimulates strong investment in commodities and
ships.3 Supply in the end becomes too great in relation to demand (contributing to low
inflation), and resource prices then fall. This leaves past investments stranded with
financial consequences for the companies that borrowed – which for China has been
estimated to be around 230% of GDP – and then capital expenditure declines relative to
depreciation and a reversal begins.
The so-called “hog cycle” in farming has occurred on a global scale. Unlike swine that
can be slaughtered, however, investment in energy, commodities, related services and
infrastructure are long-term in nature and may take years to be built and years to be run
down via depreciation. Investing on the assumption of a supercycle that turns out not to be
sustainable gives rise to over-investment in the affected sectors with negative consequences
for future investment and for dealing with past liabilities.
This current period of weakening investment has also coincided with the stronger
US dollar since 2012 (as the US economy has been improving vis-à-vis other countries in
the past few years). In addition to weakening fundamentals, movement in the dollar is a
swing factor that can drive turning points in commodity prices: since commodities are
priced in dollars, a stronger dollar acts to reduce commodity demand from the non-dollar-
block countries (e.g. prices rise in yen and euro which can reduce demand from from places
like Japan and Europe); conversely, commodity prices tend to rise when the dollar falls.
Figure 1.2. Commodity prices and the Baltic Dry Index, 1980-2016
Source: OECD calculations, Thomson Reuters Datastream.1 2 http://dx.doi.org/10.1787/888933362120
0
2000
4000
6000
8000
10000
12000
14000
0
100
200
300
400
500
600
Jan-
80
May
-81
Sep-
82
Jan-
84
May
-85
Sep-
86
Jan-
88
May
-89
Sep-
90
Jan-
92
May
-93
Sep-
94
Jan-
96
May
-97
Sep-
98
Jan-
00
May
-01
Sep-
02
Jan-
04
May
-05
Sep-
06
Jan-
08
May
-09
Sep-
10
Jan-
12
May
-13
Sep-
14
Jan-
16
B-Dry, IndexIndex
(100=Jan 2007)
Iron Ore Copper Brent Crude Baltic Dry (RHS)
1. THE FINANCIAL MARKETS OUTLOOK
OECD BUSINESS AND FINANCE OUTLOOK 2016 © OECD 201640
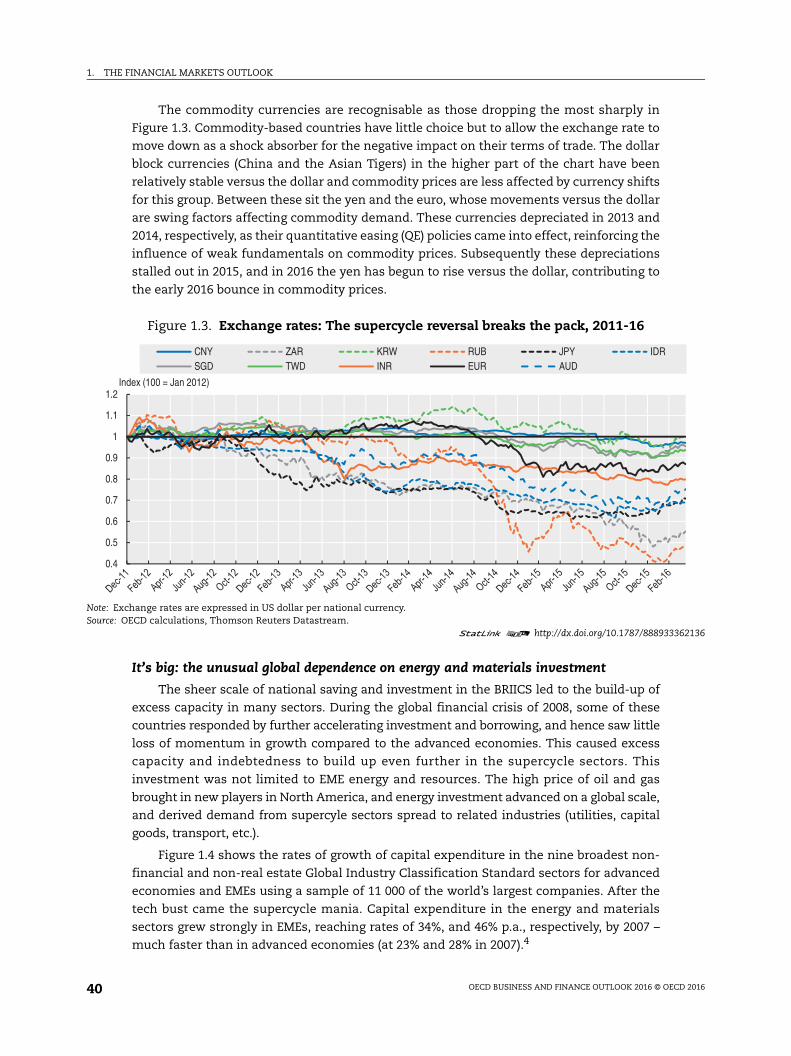
The commodity currencies are recognisable as those dropping the most sharply in
Figure 1.3. Commodity-based countries have little choice but to allow the exchange rate to
move down as a shock absorber for the negative impact on their terms of trade. The dollar
block currencies (China and the Asian Tigers) in the higher part of the chart have been
relatively stable versus the dollar and commodity prices are less affected by currency shifts
for this group. Between these sit the yen and the euro, whose movements versus the dollar
are swing factors affecting commodity demand. These currencies depreciated in 2013 and
2014, respectively, as their quantitative easing (QE) policies came into effect, reinforcing the
influence of weak fundamentals on commodity prices. Subsequently these depreciations
stalled out in 2015, and in 2016 the yen has begun to rise versus the dollar, contributing to
the early 2016 bounce in commodity prices.
It’s big: the unusual global dependence on energy and materials investment
The sheer scale of national saving and investment in the BRIICS led to the build-up of
excess capacity in many sectors. During the global financial crisis of 2008, some of these
countries responded by further accelerating investment and borrowing, and hence saw little
loss of momentum in growth compared to the advanced economies. This caused excess
capacity and indebtedness to build up even further in the supercycle sectors. This
investment was not limited to EME energy and resources. The high price of oil and gas
brought in new players in North America, and energy investment advanced on a global scale,
and derived demand from supercyle sectors spread to related industries (utilities, capital
goods, transport, etc.).
Figure 1.4 shows the rates of growth of capital expenditure in the nine broadest non-
financial and non-real estate Global Industry Classification Standard sectors for advanced
economies and EMEs using a sample of 11 000 of the world’s largest companies. After the
tech bust came the supercycle mania. Capital expenditure in the energy and materials
sectors grew strongly in EMEs, reaching rates of 34%, and 46% p.a., respectively, by 2007 –
much faster than in advanced economies (at 23% and 28% in 2007).4
Figure 1.3. Exchange rates: The supercycle reversal breaks the pack, 2011-16
Note: Exchange rates are expressed in US dollar per national currency.Source: OECD calculations, Thomson Reuters Datastream.
1 2 http://dx.doi.org/10.1787/888933362136
0.4
0.5
0.6
0.7
0.8
0.9
1
1.1
1.2Index (100 = Jan 2012)
CNY ZAR KRW RUB JPY IDRSGD TWD INR EUR AUD

1. THE FINANCIAL MARKETS OUTLOOK
OECD BUSINESS AND FINANCE OUTLOOK 2016 © OECD 2016 41
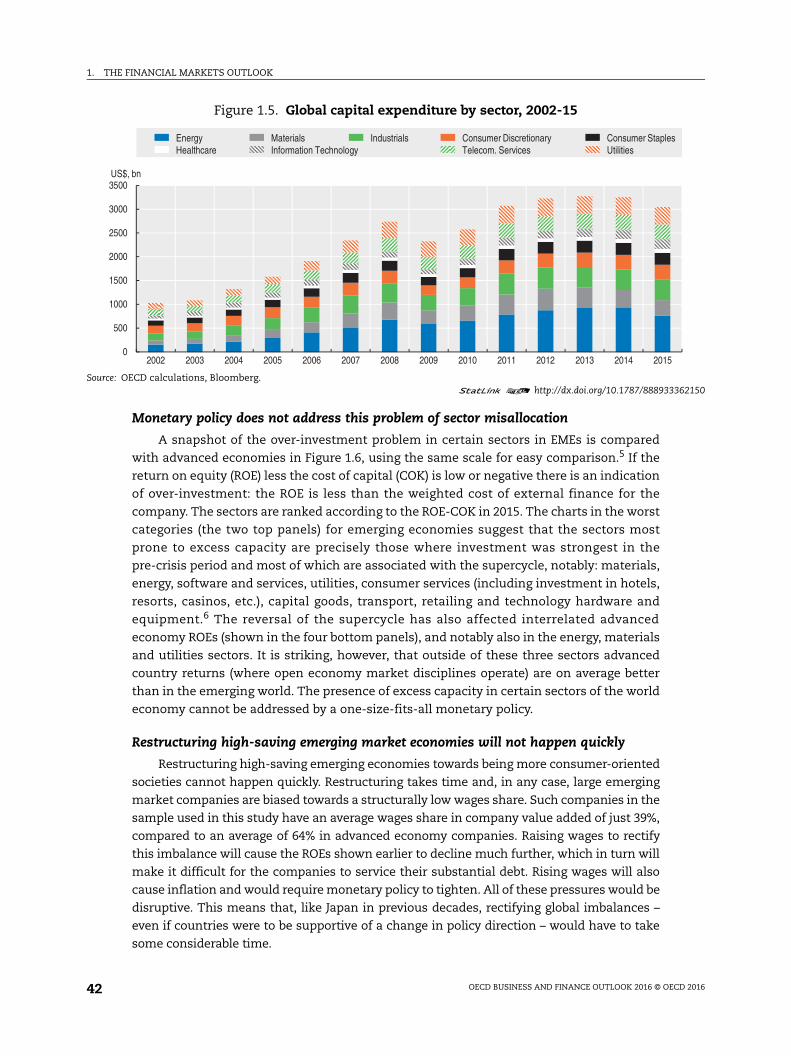
It is seldom appreciated just how important these two sectors became as a share of
global (non-financial and non-real estate) capital expenditure by companies shown in
Figure 1.5. In the sample of 11 000 companies these percentage shares peaked around
2013-14. By 2014, the energy and materials sectors together constituted 40% of global
listed-company capital expenditure across all sectors (excluding banking and real estate).
If related industrials and utilities are added, this rises to a 60% share.
Energy is a vast sector consisting of oil, gas, drilling, oil and gas equipment and services,
exploration, refining, storage, transportation, coal and consumable fuels. Materials also
cover widespread industries that are major inputs to the industrialisation of EMEs including:
chemicals, fertilisers, industrial gases, construction materials, metal and glass containers,
paper packaging, aluminium, diversified materials and mining, gold, precious metals and
minerals, forest products and paper products.
The slowdown and reversal of such a major part of investment has become and will
remain a major headwind to world economic growth going forward. Capital spending in
these three sectors has moved into negative growth in EMEs since 2014. This is compounded
by similar weakness induced in advanced economies.
Figure 1.4. Capital expenditure by sector in advanced and emerging economies, 2003-15
Source: OECD calculations, Bloomberg.1 2 http://dx.doi.org/10.1787/888933362144
-40
-30
-20
-10
0
10
20
30
40
50
2003 2004 2005 2006 2007 2008 2009 2010 2011 2012 2013 2014 2015
%YoY
AdvancedEnergy Materials IndustrialsConsumer Discretionary Consumer Staples HealthcareInformation Technology Telecom. Services Utilities
-30-20-10
01020304050607080
2003 2004 2005 2006 2007 2008 2009 2010 2011 2012 2013 2014 2015
%YoYEmerging
1. THE FINANCIAL MARKETS OUTLOOK
OECD BUSINESS AND FINANCE OUTLOOK 2016 © OECD 201642
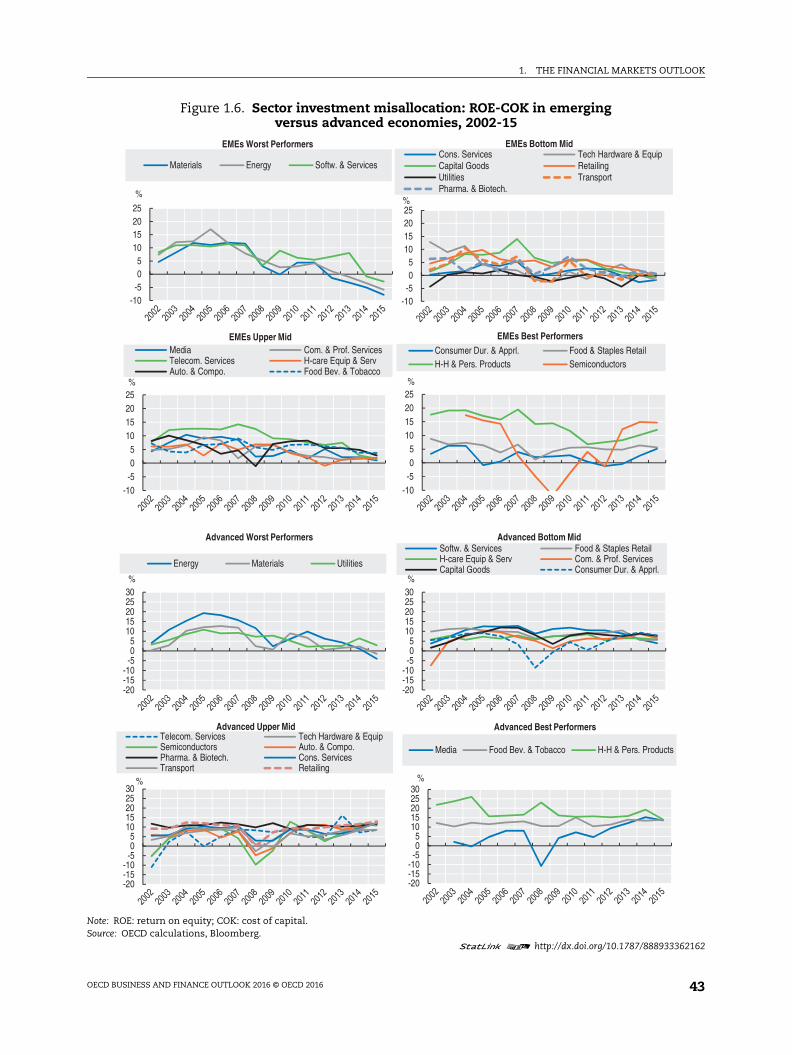
Monetary policy does not address this problem of sector misallocation
A snapshot of the over-investment problem in certain sectors in EMEs is compared
with advanced economies in Figure 1.6, using the same scale for easy comparison.5 If the
return on equity (ROE) less the cost of capital (COK) is low or negative there is an indication
of over-investment: the ROE is less than the weighted cost of external finance for the
company. The sectors are ranked according to the ROE-COK in 2015. The charts in the worst
categories (the two top panels) for emerging economies suggest that the sectors most
prone to excess capacity are precisely those where investment was strongest in the
pre-crisis period and most of which are associated with the supercycle, notably: materials,
energy, software and services, utilities, consumer services (including investment in hotels,
resorts, casinos, etc.), capital goods, transport, retailing and technology hardware and
equipment.6 The reversal of the supercycle has also affected interrelated advanced
economy ROEs (shown in the four bottom panels), and notably also in the energy, materials
and utilities sectors. It is striking, however, that outside of these three sectors advanced
country returns (where open economy market disciplines operate) are on average better
than in the emerging world. The presence of excess capacity in certain sectors of the world
economy cannot be addressed by a one-size-fits-all monetary policy.
Restructuring high-saving emerging market economies will not happen quickly
Restructuring high-saving emerging economies towards being more consumer-oriented
societies cannot happen quickly. Restructuring takes time and, in any case, large emerging
market companies are biased towards a structurally low wages share. Such companies in the
sample used in this study have an average wages share in company value added of just 39%,
compared to an average of 64% in advanced economy companies. Raising wages to rectify
this imbalance will cause the ROEs shown earlier to decline much further, which in turn will
make it difficult for the companies to service their substantial debt. Rising wages will also
cause inflation and would require monetary policy to tighten. All of these pressures would be
disruptive. This means that, like Japan in previous decades, rectifying global imbalances –
even if countries were to be supportive of a change in policy direction – would have to take
some considerable time.
Figure 1.5. Global capital expenditure by sector, 2002-15
Source: OECD calculations, Bloomberg. 1 2 http://dx.doi.org/10.1787/888933362150
0
500
1000
1500
2000
2500
3000
3500
2002 2003 2004 2005 2006 2007 2008 2009 2010 2011 2012 2013 2014 2015
US$, bn
Energy Materials Industrials Consumer Discretionary Consumer StaplesHealthcare Information Technology Telecom. Services Utilities
1. THE FINANCIAL MARKETS OUTLOOK
OECD BUSINESS AND FINANCE OUTLOOK 2016 © OECD 2016 43
Figure 1.6. Sector investment misallocation: ROE-COK in emerging versus advanced economies, 2002-15
Note: ROE: return on equity; COK: cost of capital.Source: OECD calculations, Bloomberg.
1 2 http://dx.doi.org/10.1787/888933362162
-20-15-10
-505
1015202530%
Advanced Worst Performers
Energy Materials Utilities
-20-15-10-505
1015202530%
Advanced Bottom MidSoftw. & Services Food & Staples RetailH-care Equip & Serv Com. & Prof. ServicesCapital Goods Consumer Dur. & Apprl.
-20-15-10
-505
1015202530
%
Advanced Upper MidTelecom. Services Tech Hardware & EquipSemiconductors Auto. & Compo.Pharma. & Biotech. Cons. ServicesTransport Retailing
-20-15-10-505
1015202530
%
Advanced Best Performers
Media Food Bev. & Tobacco H-H & Pers. Products
-10-505
10152025
%
EMEs Worst Performers
Materials Energy Softw. & Services
-10-505
10152025%
EMEs Bottom MidCons. Services Tech Hardware & EquipCapital Goods RetailingUtilities TransportPharma. & Biotech.
-10-505
10152025%
EMEs Upper MidMedia Com. & Prof. ServicesTelecom. Services H-care Equip & ServAuto. & Compo. Food Bev. & Tobacco
-10-505
10152025%
EMEs Best PerformersConsumer Dur. & Apprl. Food & Staples RetailH-H & Pers. Products Semiconductors
1. THE FINANCIAL MARKETS OUTLOOK
OECD BUSINESS AND FINANCE OUTLOOK 2016 © OECD 201644
Headwind 2: The L-shaped recovery in advanced economies due to the aftermath of, and responses to, the financial crisis
The financial crisis of 2008 was the first phase of the collision in mega-trends that policy
makers are still trying to deal with. This led to unconventional monetary policy and a move
to zero (and now negative) rates in many countries to avoid a collapse of the world financial
system. This has been followed by new rules to re-regulate the banking system. Deleveraging
associated with these new capital and liquidity rules, together with the size of current and
prospective non-performing loans, have become the prime contributors to the L-shaped
recovery in many advanced economies. This has always been expected by financial market
analysts who argued that bank ROEs would fall sharply, particularly for banks involved with
capital market products.7 But this has been the intention of re-regulation: i.e. policy makers
aiming to have a smaller, safer and more consolidated banking system where higher risks
are priced appropriately. Banks have pushed back hard against these reforms.8
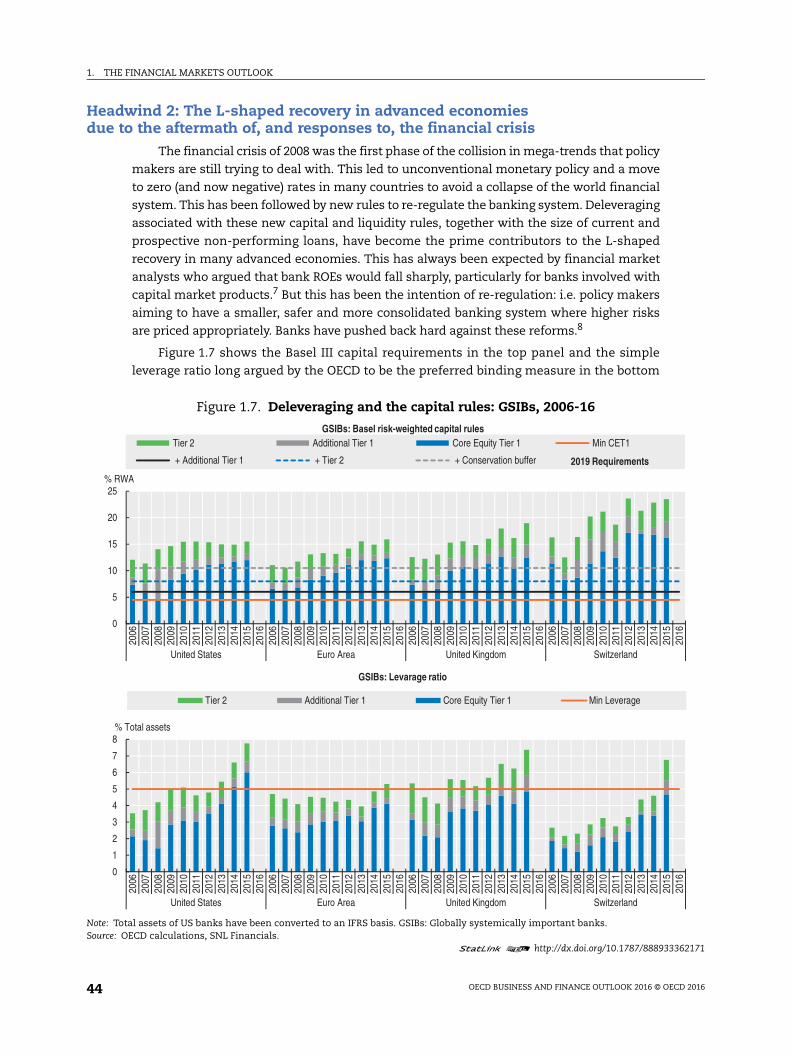
Figure 1.7 shows the Basel III capital requirements in the top panel and the simple
leverage ratio long argued by the OECD to be the preferred binding measure in the bottom
Figure 1.7. Deleveraging and the capital rules: GSIBs, 2006-16
Note: Total assets of US banks have been converted to an IFRS basis. GSIBs: Globally systemically important banks.Source: OECD calculations, SNL Financials.
1 2 http://dx.doi.org/10.1787/888933362171
0
5
10
15
20
25
2006
2007
2008
2009
2010
2011
2012
2013
2014
2015
2016
2006
2007
2008
2009
2010
2011
2012
2013
2014
2015
2016
2006
2007
2008
2009
2010
2011
2012
2013
2014
2015
2016
2006
2007
2008
2009
2010
2011
2012
2013
2014
2015
2016
United States Euro Area United Kingdom Switzerland
% RWA
GSIBs: Basel risk-weighted capital rulesTier 2 Additional Tier 1 Core Equity Tier 1 Min CET1
+ Additional Tier 1 + Tier 2 + Conservation buffer 2019 Requirements
0
1
2
3
4
5
6
7
8
2006
2007
2008
2009
2010
2011
2012
2013
2014
2015
2016
2006
2007
2008
2009
2010
2011
2012
2013
2014
2015
2016
2006
2007
2008
2009
2010
2011
2012
2013
2014
2015
2016
2006
2007
2008
2009
2010
2011
2012
2013
2014
2015
2016
United States Euro Area United Kingdom Switzerland
% Total assets
GSIBs: Levarage ratio
Tier 2 Additional Tier 1 Core Equity Tier 1 Min Leverage

1. THE FINANCIAL MARKETS OUTLOOK
OECD BUSINESS AND FINANCE OUTLOOK 2016 © OECD 2016 45
panel.9 The rise in the ratio of core tier 1 (T1) equity to total assets in all of the jurisdictions
shown in blue reflects the deleveraging pressure on economies. All banks in all countries
appear to satisfy the Basel rules, and have done so for some time. The total loss absorbing
capacity (TLAC) extension of Basel III for globally systemically important banks (GSIBs) was
also examined. This work (not reported) found that only a handful of such banks would be
required to issue more long-term unsecured debt for potential bail-in purposes.
If the Basel risk-weighted rules were the binding constraint on banking then the
L-shape recovery should be lifting, as it has done in the United States. But this is not the
case. The OECD recommendation that banks should have core equity equal to 5% of their
total un-weighted assets has only been surpassed in the United States. Bad loans have not
been dealt with in Europe and this makes it more difficult (with the continual slow
bleeding of non-performing loan write-offs) to finish raising capital and to begin lending.
For other non-GSIBs, which are very important in lending and economic growth, lack of T1
equity is most apparent in Europe and the United Kingdom, but not the United States and
Switzerland. The United States and Switzerland are parts of the world where economic
growth is reflecting less of the L-shape pattern that is more prevalent elsewhere.
Figure 1.8. Deleveraging and the capital rules: Other non-GSIB banks, 2006-16
Note: Total assets of US banks have been converted to an IFRS basis. GSIBs: Globally systemically important banks.Source: OECD calculations, SNL Financials.
1 2 http://dx.doi.org/10.1787/888933362185
0
5
10
15
20
25
2006
2007
2008
2009
2010
2011
2012
2013
2014
2015
2016
2006
2007
2008
2009
2010
2011
2012
2013
2014
2015
2016
2006
2007
2008
2009
2010
2011
2012
2013
2014
2015
2016
2006
2007
2008
2009
2010
2011
2012
2013
2014
2015
2016
United States Euro Area United Kingdom Switzerland
% RWA
Other banks: Basel risk-weighted capital rulesTier 2 Additional Tier 1 Core Equity Tier 1 Min CET1
+ Additional Tier 1 + Tier 2 + Conservation buffer 2019 Requirements
0
2
4
6
8
10
12
2006
2007
2008
2009
2010
2011
2012
2013
2014
2015
2016
2006
2007
2008
2009
2010
2011
2012
2013
2014
2015
2016
2006
2007
2008
2009
2010
2011
2012
2013
2014
2015
2016
2006
2007
2008
2009
2010
2011
2012
2013
2014
2015
2016
United States Euro Area United Kingdom Switzerland
% Total assets
Other banks: Levarage ratio
Tier 2 Additional Tier 1 Core Equity Tier 1 Min Leverage
1. THE FINANCIAL MARKETS OUTLOOK
OECD BUSINESS AND FINANCE OUTLOOK 2016 © OECD 201646
Having prevented a collapse of the global financial system in 2008, unconventional
monetary policy continues and may now become counterproductive with:
negative rates hurting banks
investment decisions being distorted (discussed in detail below)
weak banks and companies being kept alive and non-performing loans (NPLs) not being
addressed (delaying the “creative destruction” phase required to restore productivity
growth).
The negative interest rates problem
Europe and Japan are growing too slowly and a number of central banks have imposed
negative interest rates (the ECB and the central banks of Switzerland, Denmark, Sweden,
and Japan). The theory is that this will force banks to do something else other than deposit
cash with the central bank, i.e. to lend to the real economy, and it may also help to weaken
the exchange rate. While it is always hard to know what would have happened without
negative rates, this policy certainly does not appear to be helping a great deal at this stage.
High Quality Liquid Assets (HQLA) are supposed to be at 70% of the ultimate Basel III
requirement of the Liquidity Coverage Ratio (LCR) rule from January 2016, and this rises to
100% by 2019. HQLA consist mainly of central bank reserves and sovereign bonds (and a few
high-grade corporate bonds and equities). QE has forced up the amount of central bank
reserves in bank portfolios (now carrying negative rates) and bond rates in most jurisdictions
are also very low or negative. It is hard to see how paying banks a negative return on forced
holdings helps the economy through the banking channel.10 In an environment of weak
demand for credit, banks have to offset the negative return on HQLA via higher rates or
increased fees for their clients, thereby exacerbating the already weak demand for loans.
The distance-to-default of banks
As if these problems were not enough, it must also be noted that many banks across
all regions are also exposed to the fall in oil prices and the potential defaults of borrowers,
which could add to the NPL problems noted in Box 1.1. The DTD of banks is falling once
more (shown in standard deviations from the default point in Figure 1.10).11
Box 1.1. Hypothetical illustration of the impact of negative interest rates on banks
A stylised example is shown in Figure 1.9. Hypothetical overheads, the loan loss ratio, deposit costs and the leverage ratio are as shown in the chart. HQLA are at 12% of total assets (TA).1 The two lines show the ROE and interest rate trade-off arithmetic. In the steeper solid grey line the loan rate is considered over a range from 1.5% to 5%, while the rate on HQLA is held constant at -1% per year. In this case only the highest lending rates for banks allow for a positive ROE, i.e. lending rates at greater than 4%. But even at 5% the ROE of 6% would be below the cost of capital. The problem of course is that overheads, deposit funding and loan loss provisions are always there as costs (in the example shown, banks have to make 3.9% on their assets just to break even).
Negative rates on HQLA and weak loan demand work against banks being able to make reasonable returns. In the flatter blue solid line the bank’s loan rate is held at the high 4% (e.g. the US prime rate is 3.5% and European rates are typically much lower), while the rate on HQLA starts at minus 1.5% and rises to plus 2% (rising 50 basis points at each interval). Paying more on deposits clearly helps: if -0.5% is paid the ROE breaks even (the bank does not lose money). At a positive return of 1% on HQLA the bank achieves 3.3% and 2%

1. THE FINANCIAL MARKETS OUTLOOK
OECD BUSINESS AND FINANCE OUTLOOK 2016 © OECD 2016 47
The average DTD of banks has fallen most in Asia and Latin America. In Asia (where
the supercycle reversal is most prevalent) the DTD is back to levels last seen in 2010. In
Latin America (also a large resources area) the DTD is at levels last seen in 2009. US banks
appear to be the strongest at this point. Nevertheless the situation bears watching closely.
Box 1.1. Hypothetical illustration of the impact of negative interest rates on banks (cont.)
allows an ROE of 5.5% to be earned. Fees are excluded from the calculation but everywhere these are rising (on ATM withdrawals, especially-out-of-network, on overdrafts and for many services) as banks pass on this adverse combination of the LCR and negative interest rates in an environment of weak loan demand.2
Of course the assumption of a loan loss rate of only 1% of TA does not apply to many of the banks in Europe. The 1% of assets would be roughly equivalent to 2% of loans, and this is a gross under-estimate in the case of Europe: the European Parliament recently reported a much higher NPL range based on European Banking Authority (EBA) numbers versus gross loans (e.g. 2.5% for the United Kingdom, 4.2% for France, 6.8% for Spain, 16.9% for Italy, 18.5% for Portugal, 20.6% for Ireland and over 40% for Greece).3 NPLs much higher than 1% of total assets would push all of the curves of Figure 1.9 into negative territory and such banks would need to be resolved to restore the chance of better growth. The use of public money to establish a “bad bank” to deal with NPLs has been constrained by Brussels regulations concerning state aid.
Figure 1.9 also shows the impact of reducing the LCR from 12% to 6%. This acts to offset the impact of negative interest rates and pushes up ROEs as banks would act to minimise their exposures. The regulation may have a good long-term rationale, but it is interacting with negative interest rates in a manner harming the role of banks in promoting recovery. The message would seem to be that negative rates should be removed as quickly as practicable or the LCR reduced and/or the regulatory timetable extended.
1. In a sample of large global banks operating in all major jurisdictions, these assets appear to be higher in the United States (around 15% excluding custody/clearing banks) but lower in European banks (12%) where negative rates apply. This ratio is set to move higher with full implementation. The calibration here based on 12% of total liabilities is roughly consistent with an ECB (2013) conceptual calculation.
2. At a recent OECD meeting the Austrian central bank presented econometric evidence for Europe that showed a systematic negative impact on bank profitability – reported here with permission from the author. See Redak (2016).
3. See European Parliament (2016).
Figure 1.9. Hypothetical bank return on equity trade-offs with negative rate assumptions
Note: High quality liquid assets (HQLA) = 12% of total assets; O/heads = 1.5% of total assets; Loan loss = 1% of total assets; Leverage ratio = 6%; Deposit rate = 1%.Source: OECD calculations.
1 2 http://dx.doi.org/10.1787/888933362196
-40%
-30%
-20%
-10%
0%
10%
20%
1.5% 2.0% 2.5% 3.0% 3.5% 4.0% 4.5% 5.0%
ROE %
Loan Return Rate %
HQLA reduced to 6% total liab. Rate HQLA rising -1.5% to +2%; loan rate @4%Loan rate rising (X Axis), HQLA rate -1% HQLA reduced to 6% total liab.

1. THE FINANCIAL MARKETS OUTLOOK
OECD BUSINESS AND FINANCE OUTLOOK 2016 © OECD 201648
Quantitative easing, negative interest rates and foreign exchange markets
One argument favouring negative interest rates noted earlier might be the hope for a
monetary policy transmission mechanism to depreciate the exchange rate. However, the current
environment is one where private sector portfolio reactions have become very unpredictable.
Japan announced negative rates in January 2016 and the yen surprisingly rose sharply
against the weaker US dollar (see Figure 1.3). In interconnected financial markets (and
nowhere is this more the case than in foreign exchange) there are too many moving parts.
Negative interest rates may lead to a powerful carry trade, essentially borrowing yen at
negative rates and buying the dollar outright. A central bank might buy JGBs in its reserves
and swap them into dollar assets. But if the trend in the dollar turns to depreciation, these
structures are unwound and can reinforce appreciation of the negative interest rate currency.
Other influences on currencies are simply more important than interest rates: notably
economic growth and, more recently, the change by Chinese authorities to manage the
currency versus a basket. The Federal Reserve changed its tone at the start of 2016 and
appears to have become more worried about the impact on the United States of a reversal of
the supercycle in the global economy. This caused the dollar to fall, commodity prices to
bounce and flows into emerging economies to stabilise and improve a little. Since the
exchange rate is the price of one currency in terms of another it stands to reason that QE
could, other things given, lead to depreciation. Hence QE policies in Europe and Japan
(implemented to support the economy) could do so via exchange rate depreciation. However,
this would not necessarily happen in the changed policy environment of 2016 following the
announcement of the Chinese to manage the renminbi versus a currency basket. The
depreciation of a large currency would cause the Chinese currency basket to rally and may
lead to Chinese responses (discussed in the next section). In the case of the yen market,
sources suggest that uncovered investors hurt by the rise in the yen are bringing their
investments back home (leading to further upward currency pressure) and some foreign
exchange reserves managers have been unwinding carry trade structures.
Figure 1.10. Average distance-to-default (DTD) for large banks, 1998-2016
Note: Europe refers to the European Union, Norway and Switzerland. The horizontal 3-standard-deviation line represents a minimal level of “safety” based on calibration from previous crises.Source: OECD calculations, Bloomberg.
1 2 http://dx.doi.org/10.1787/888933362209
-1
0
1
2
3
4
5
6
7
8
9
Dec
-99
May
-00
Oct
-00
Mar
-01
Aug-
01Ja
n-02
Jun-
02N
ov-0
2Ap
r-03
Sep-
03Fe
b-04
Jul-0
4D
ec-0
4M
ay-0
5O
ct-0
5M
ar-0
6Au
g-06
Jan-
07Ju
n-07
Nov
-07
Apr-0
8Se
p-08
Feb-
09Ju
l-09
Dec
-09
May
-10
Oct
-10
Mar
-11
Aug-
11Ja
n-12
Jun-
12N
ov-1
2Ap
r-13
Sep-
13Fe
b-14
Jul-1
4D
ec-1
4M
ay-1
5O
ct-1
5
Std. dev.
United States Europe Asia Latin America
1. THE FINANCIAL MARKETS OUTLOOK
OECD BUSINESS AND FINANCE OUTLOOK 2016 © OECD 2016 49
Emerging markets responses to the reversal of the supercycle and the L-shaped recovery, with a focus on China
Underlying real structural problems in emerging economies will continue to affect the
business and finance outlook until they are dealt with via reforms affecting the openness
of trade and investment, and which promote a greater role for domestic demand and the
services sectors. It was noted earlier that this may be a long time in coming due to the low
wages share in EME companies and the difficulty of dealing with over-investment issues.
The problem of net outflows from emerging markets
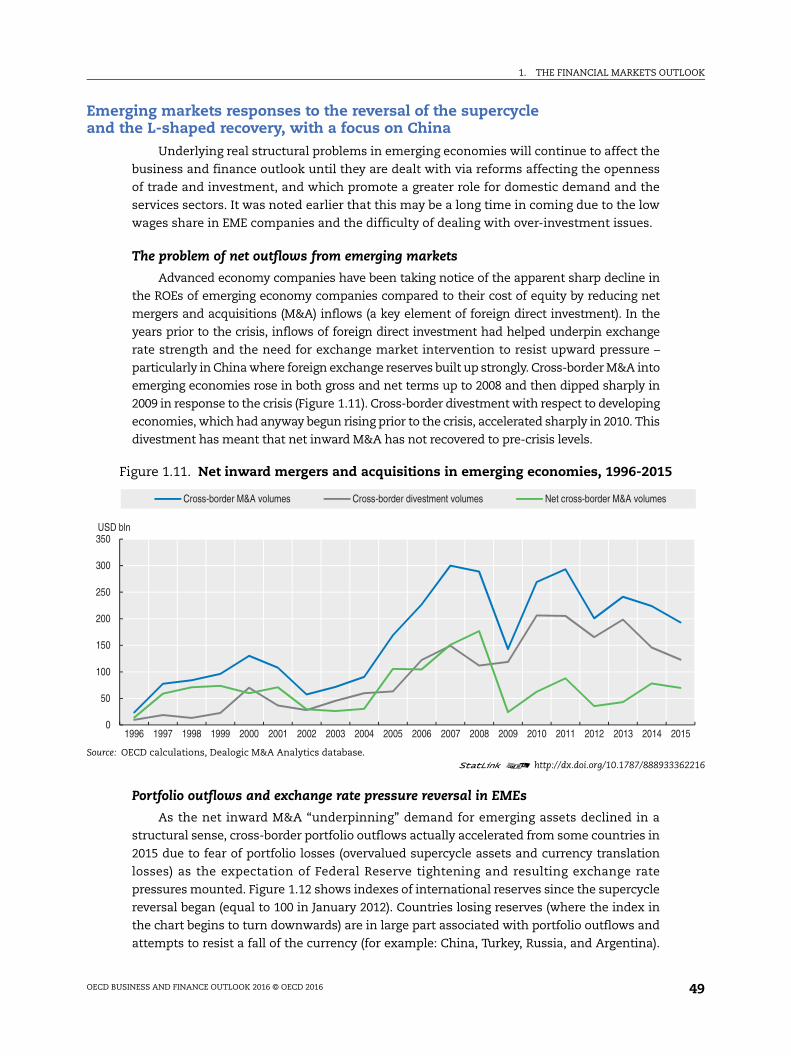
Advanced economy companies have been taking notice of the apparent sharp decline in
the ROEs of emerging economy companies compared to their cost of equity by reducing net
mergers and acquisitions (M&A) inflows (a key element of foreign direct investment). In the
years prior to the crisis, inflows of foreign direct investment had helped underpin exchange
rate strength and the need for exchange market intervention to resist upward pressure –
particularly in China where foreign exchange reserves built up strongly. Cross-border M&A into
emerging economies rose in both gross and net terms up to 2008 and then dipped sharply in
2009 in response to the crisis (Figure 1.11). Cross-border divestment with respect to developing
economies, which had anyway begun rising prior to the crisis, accelerated sharply in 2010. This
divestment has meant that net inward M&A has not recovered to pre-crisis levels.
Portfolio outflows and exchange rate pressure reversal in EMEs
As the net inward M&A “underpinning” demand for emerging assets declined in a
structural sense, cross-border portfolio outflows actually accelerated from some countries in
2015 due to fear of portfolio losses (overvalued supercycle assets and currency translation
losses) as the expectation of Federal Reserve tightening and resulting exchange rate
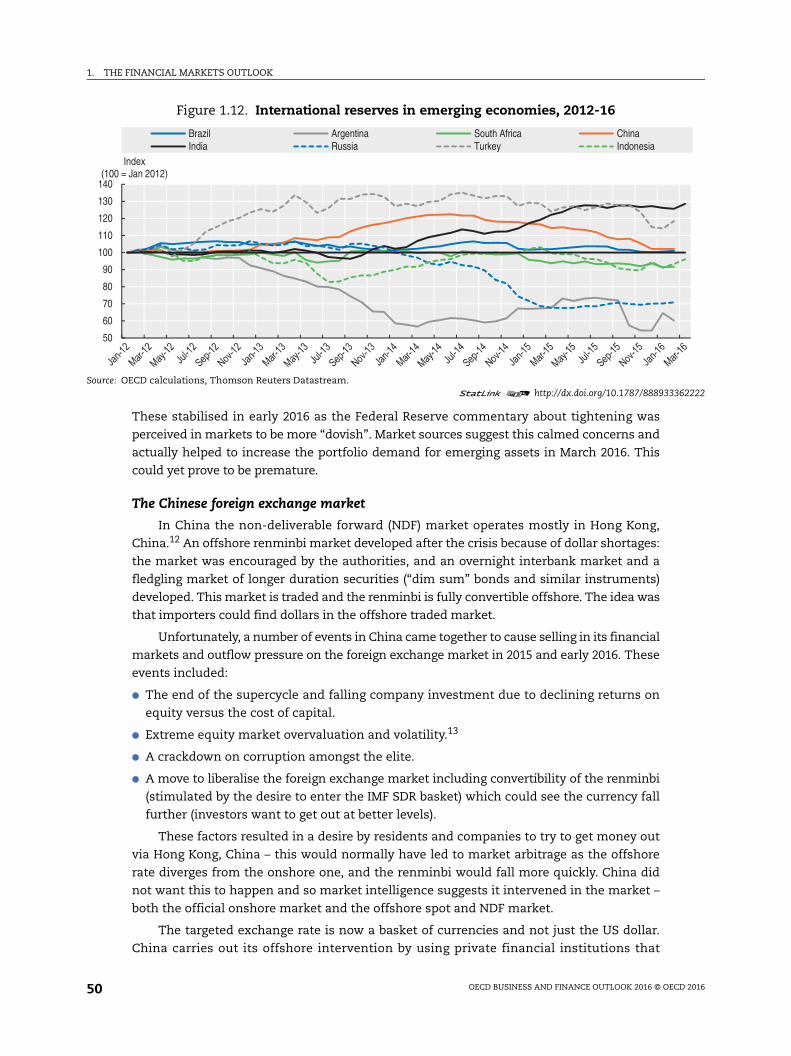
pressures mounted. Figure 1.12 shows indexes of international reserves since the supercycle
reversal began (equal to 100 in January 2012). Countries losing reserves (where the index in
the chart begins to turn downwards) are in large part associated with portfolio outflows and
attempts to resist a fall of the currency (for example: China, Turkey, Russia, and Argentina).
Figure 1.11. Net inward mergers and acquisitions in emerging economies, 1996-2015
Source: OECD calculations, Dealogic M&A Analytics database.1 2 http://dx.doi.org/10.1787/888933362216
0
50
100
150
200
250
300
350
1996 1997 1998 1999 2000 2001 2002 2003 2004 2005 2006 2007 2008 2009 2010 2011 2012 2013 2014 2015
USD bln
Cross-border M&A volumes Cross-border divestment volumes Net cross-border M&A volumes
1. THE FINANCIAL MARKETS OUTLOOK
OECD BUSINESS AND FINANCE OUTLOOK 2016 © OECD 201650
These stabilised in early 2016 as the Federal Reserve commentary about tightening was
perceived in markets to be more “dovish”. Market sources suggest this calmed concerns and
actually helped to increase the portfolio demand for emerging assets in March 2016. This
could yet prove to be premature.
The Chinese foreign exchange market
In China the non-deliverable forward (NDF) market operates mostly in Hong Kong,
China.12 An offshore renminbi market developed after the crisis because of dollar shortages:
the market was encouraged by the authorities, and an overnight interbank market and a
fledgling market of longer duration securities (“dim sum” bonds and similar instruments)
developed. This market is traded and the renminbi is fully convertible offshore. The idea was
that importers could find dollars in the offshore traded market.
Unfortunately, a number of events in China came together to cause selling in its financial
markets and outflow pressure on the foreign exchange market in 2015 and early 2016. These
events included:
The end of the supercycle and falling company investment due to declining returns on
equity versus the cost of capital.
Extreme equity market overvaluation and volatility.13
A crackdown on corruption amongst the elite.
A move to liberalise the foreign exchange market including convertibility of the renminbi
(stimulated by the desire to enter the IMF SDR basket) which could see the currency fall
further (investors want to get out at better levels).
These factors resulted in a desire by residents and companies to try to get money out
via Hong Kong, China – this would normally have led to market arbitrage as the offshore
rate diverges from the onshore one, and the renminbi would fall more quickly. China did
not want this to happen and so market intelligence suggests it intervened in the market –
both the official onshore market and the offshore spot and NDF market.
The targeted exchange rate is now a basket of currencies and not just the US dollar.
China carries out its offshore intervention by using private financial institutions that
Figure 1.12. International reserves in emerging economies, 2012-16
Source: OECD calculations, Thomson Reuters Datastream.1 2 http://dx.doi.org/10.1787/888933362222
50
60
70
80
90
100
110
120
130
140
Index(100 = Jan 2012)
Brazil Argentina South Africa ChinaIndia Russia Turkey Indonesia

1. THE FINANCIAL MARKETS OUTLOOK
OECD BUSINESS AND FINANCE OUTLOOK 2016 © OECD 2016 51
participate in those offshore markets and trade on behalf of China. To help stem the
pressure, China has imposed various additional controls on outflows in the last couple of
months of 2015. These include:
Suspending the right of onshore foreign banks to participate in the offshore market (DBS,
Standard Chartered, and Deutsche Bank).
Limiting the amounts individuals and companies can transfer.
Insisting on more screening by banks to ensure that amounts above USD 50 000 are
genuinely for the purposes of importing goods into China.
Suspending the structural reform process related to the currency.
At the same time that it is imposing outflow controls, China is liberalising measures
affecting capital inflows (to try to offset the outflow pressure). In particular, it has abolished
bond investment quotas on qualified foreign institutional investors (including insurance
companies, pension funds, commercial banks, endowment funds, and mutual funds). The
strategy has led to increased volatility: the spread between the onshore and offshore markets
is large at times and reserve loss has been quite significant. On 12 January 2016, their
intervention in the offshore market completely drained renminbi in the (relatively small)
market and pushed the overnight rate to over 60%.
Complicating quantitative easing strategies in Europe and Japan
The announcement in December 2015 that policy is now focused on a basket of
currencies and less so on the US dollar will enable the authorities to decouple monetary policy
from the US tightening process – should that process continue in 2016.14 With regard to other
major currencies this approach complicates things. For example, if the European Central Bank
(ECB) or the Bank of Japan (BoJ) used QE in 2016 and beyond, the currency might behave very
differently compared to the period prior to the new Chinese exchange rate management
regime. Whereas QE might have affected the exchange rate in the direction of depreciation
prior to 2016, under the new regime the ex ante pressure to appreciate the basket will lead to
a Chinese policy response to manage the basket. There appear to be two choices in this
respect: the renminbi could be depreciated versus the dollar to stabilise the basket; or the
Chinese could intervene in the cross rates (e.g. sell dollars to buy yen or euro to offset the
quantitative easing policy effects). The latter approach has advantages in the near term, since
China has large corporate debts in US dollars and HK dollars. Some of the outflows early in the
year have been Chinese corporates repaying these foreign currency debts, so that depreciating
the renminbi versus the dollar before this is done makes less sense.
The Chinese stock market
In the stock market, wealthy individuals and companies would like to sell some of
their stock and transfer money to the Hong Kong, China market before exchange rates
deteriorate further. To prevent confidence being dented by a collapse in prices, the
authorities have been using official funds to prop up the Shanghai stock market. This,
together with cross-border controls, has led to huge discrepancies between the prices of
the same stocks listed in both Shanghai and Hong Kong, China in the same currency. The
median of the daily stock price divergence of 69 such companies, shown in Figure 1.13, is
volatile, and there has always been a risk premium for the Chinese listings. These
premiums took a severe jump upwards in 2015 (from a 25% median premium to 75%) with
considerable differences amongst the stocks included.

1. THE FINANCIAL MARKETS OUTLOOK
OECD BUSINESS AND FINANCE OUTLOOK 2016 © OECD 201652
China monetary policy and spending responses
China has responded to the sharp slowing in the economy via credit and fiscal
expansion (in the areas of housing and infrastructure). Fixed asset investment is still running
at over 10% p.a. (double the stated GDP growth so that it is rising as a share of GDP). While
China’s medium-term plan is to move towards a greater consumption and services-driven
growth model, bold structural reforms are likely to be delayed due to the slowdown: the
internationalisation of the renminbi has already been halted somewhat; key internal prices
remain distorted (e.g. as in Figure 1.13); and Chinese industrial policy, which heavily involves
the role of the state, has contributed to global excess capacity (particularly in energy, steel,
other materials sectors, construction and solar photovoltaic, and automobiles) and will take
time to move to a different modus operandi.15
Dealing with excess capacity sectors requires a “creative destruction” phase: closing
down old industries and then building new ones guided by market signals and with a lesser
role of the state. But major reform now would risk slowing the economy further. Faced with
this challenge, the People’s Bank of China (PBOC) is stepping in (as central banks are also
doing in the United States, Japan and Europe).
As international reserves have fallen, domestic credit expansion and liquidity policies
have been turned on via reduced bank reserve ratios, interest rate cuts and other
measures.16
The China Development Bank (CDB) is continuing to play an important role in debt-
funded public spending in 2016, and has accelerated lending versus 2015. The focus for
2016 is on shantytown redevelopment (RMB 950 billion, up 26% from last year), and a
continuation of lending to railways (RMB 100 billion), water conservation (RMB 65 billion)
Figure 1.13. Shanghai and Hong Kong, China price ratio for 69 dual-listed stocks, 2012-16
Source: OECD calculations, Bloomberg.1 2 http://dx.doi.org/10.1787/888933362232
0.5
1
1.5
2
2.5
3
3.5
Price Ratio (Shanghai / Hong Kong,
China)
Quartile 25 Median Quartile 75

1. THE FINANCIAL MARKETS OUTLOOK
OECD BUSINESS AND FINANCE OUTLOOK 2016 © OECD 2016 53
and industrial upgrading (RMB 180 billion). The PBOC has loaned significant sums to the
China Development Bank via the relending facility for these projects in recent years,
creating claims on the CDB. These are equivalent to claims on the government. Market
sources suggest the PBOC could lend out claims on the CDB to other banks in worse shape
(for a spread) improving their liquidity since they could use the CDB claim for collateral for
their own borrowing. The money supply and domestic credit growth shown in Figure 1.14
is accelerating.
The problem with these approaches is that structural reform has not yet been carried
through and will likely take a long time. This may mean that policies in response to the
current crisis will not be sufficiently different from 2009, which exacerbated the excess
capacity situation and worsened credit problems in China.
Other emerging market economies’ responses
Other emerging markets have also eased monetary policy by cutting interest rates to
ensure that they do not lose competitiveness (e.g. India, Indonesia, Chinese Taipei, Turkey
and Hungary). Singapore, which manages its currency versus an effective exchange rate
basket, set the appreciation band to zero in April (from a previous undisclosed rising
appreciation band). Some countries have also stepped up the extent to which they use
capital flow measures. OECD research suggests that these measures are quite closely linked
with reducing pressure on foreign reserves in the exchange rate management process, but
are not particularly efficient at affecting variables associated with financial stability when
macro-prudential explanations are offered for their use.17
Figure 1.14. M2, international reserves and domestic credit in China, 2000-16
Source: OECD calculations, Thomson Reuters Datastream.1 2 http://dx.doi.org/10.1787/888933362241
0
5
10
15
20
25
30
35
-16
-6
4
14
24
34
44
54%YoY%YoY
International reserves M2 (RHS) Domestic credit (RHS)

1. THE FINANCIAL MARKETS OUTLOOK
OECD BUSINESS AND FINANCE OUTLOOK 2016 © OECD 201654
Perverse incentives for investors created by monetary policyInvestors have been herded into concentrated trades, many of which are illiquid, and
recent volatility reflects periodic attempts to exit them – particularly when there is any hint
of a withdrawal of the monetary policy “morphine” to which they have become addicted.
Financial fragility means that central banks will embark upon the normalisation of interest
rates only very slowly and the outlook for the next year or two in financial markets is one
of choppiness about trend modest returns, with persistent risks of extreme volatility.
Markets have had a way of forcing required policy adjustments in non-performing
economies, forcing them to deal with problems like inflation, fiscal deficits and external
crises. The problem here, however, is that over-investment and falling returns are located
in countries that are less market oriented – this interference with markets relays pressure
elsewhere. This is playing out with advanced-economy central banks taking on the results
of intersecting global and domestic issues, while the reaction of some key emerging
economies has been to move even further away from market forces.
Quantitative easing and low-interest-rate monetary policy can do little to correct over-
investment in global industrial sectors and may be combining with regulatory factors to
hurt banks in some advanced economies. These policies have also created incentives for
investors that may portend problems for the future. Very low rates have created a demand
for a kind of portfolio barbell: to match large allocations to private equity and low-cost
exchange-traded funds (ETFs) at one end, with a greater demand for capital market risk
assets based on leverage that pay higher short-term carry/cash flows (e.g. hedge and
absolute return funds, etc.) at the other end.18 In between is an allocation to equities and
bonds within which further herding of investors into concentrated positions is found: in
high-yield non-investment grade bonds; and in equities that focus on providing strong
dividends and buybacks.
Barbell of private equity and exchange-traded funds versus cash generating funds
Private equity has been one of the main ways that investors have responded to the
low-interest-rate and low-growth environment. A “time premium” has been given to
private equity funds because they specialise in realising long-term risk premiums. One
problem with mutual fund managers is that fees are high while cash rates are very low.
This has led to the strong growth of ETFs which give exposure to assets of the investor’s
choice for very low fees. ETFs allow investors to gain exposure to higher-return but less
liquid underlying assets, while the ETF shares promise daily liquidity.19 In Figure 1.15, the
alternative assets shown have risen since the crisis to an amount equal to 23% of the size
of pension fund and insurance company assets,20 with private equity and ETFs making up
13 percentage points of this.
Hedge funds and real estate investment funds tracked by the OECD are equivalent to
10% of institutional investor funds under management. Hedge funds promise absolute
returns benchmarked against cash. Real estate investment funds pay higher yields.
Underlying assets may, however, be more illiquid than clients would expect in a strong
redemption demand situation.
Private equity valuations have been stellar (driven by inflows) and they may be rich
when compared to what underlying investments might deliver in the current slow growth
environment. This is one of the most illiquid asset classes and it is not clear how investors
would fare if redemption demand strengthened. Similar comments apply to closed-end ETFs.

1. THE FINANCIAL MARKETS OUTLOOK
OECD BUSINESS AND FINANCE OUTLOOK 2016 © OECD 2016 55
These products offer daily liquidity while often referencing illiquid underlying securities.
In the period of high market volatility in August 2015 strong selling from closed-end funds
such as ETFs was a factor. With ETFs there are two market levels – that for the traded ETF
shares, where the normal buying and selling just transfers the underlying securities
without selling them on the open market, and the market for the underlying basket of
securities. In August 2015 the discounts (to the underlying basket) to get out of ETFs were
steep. When one-way selling emerges, the ETF providers are supposed to redeem ETF
shares to arbitrage the difference between the ETF value and the underlying stocks and
bonds. In August, the providers did not on average redeem ETF shares and sell the
underlying. They apparently judged that selling the underlying illiquid securities would
not have resulted in arbitrage profit, raising the question of what would happen in a more
sustained crisis without monetary policy “morphine”.
Figure 1.15. Alternative assets and pension and insurance company funds under management, 2002-15
Note: 2015 estimates for pension funds, insurance companies and real estate funds’ total assets.Source: FSB Global Shadow Banking Monitoring Report 2015, 2016 Preqin Global Private Equity Report, 2016 ETFGI monthly newsletter, BarclayHedge.
1 2 http://dx.doi.org/10.1787/888933362256
0
5
10
15
20
25
0
10000
20000
30000
40000
50000
60000
2002 2003 2004 2005 2006 2007 2008 2009 2010 2011 2012 2013 2014 2015
%USD, bln
Pension Funds Insurance Companies % Alt. Assets/Tot Instit. (RHS)
HF & RE Inv. Funds/Tot Instit. (RHS) Priv. Eq. & ETF/Tot Instit. (RHS)
0
2000
4000
6000
8000
10000
12000
14000
2002 2003 2004 2005 2006 2007 2008 2009 2010 2011 2012 2013 2014 2015
USD, bln
Real Estate Investment Funds Funds of Funds Hedge Funds ETFs & ETPs Private Equity Funds
1. THE FINANCIAL MARKETS OUTLOOK
OECD BUSINESS AND FINANCE OUTLOOK 2016 © OECD 201656
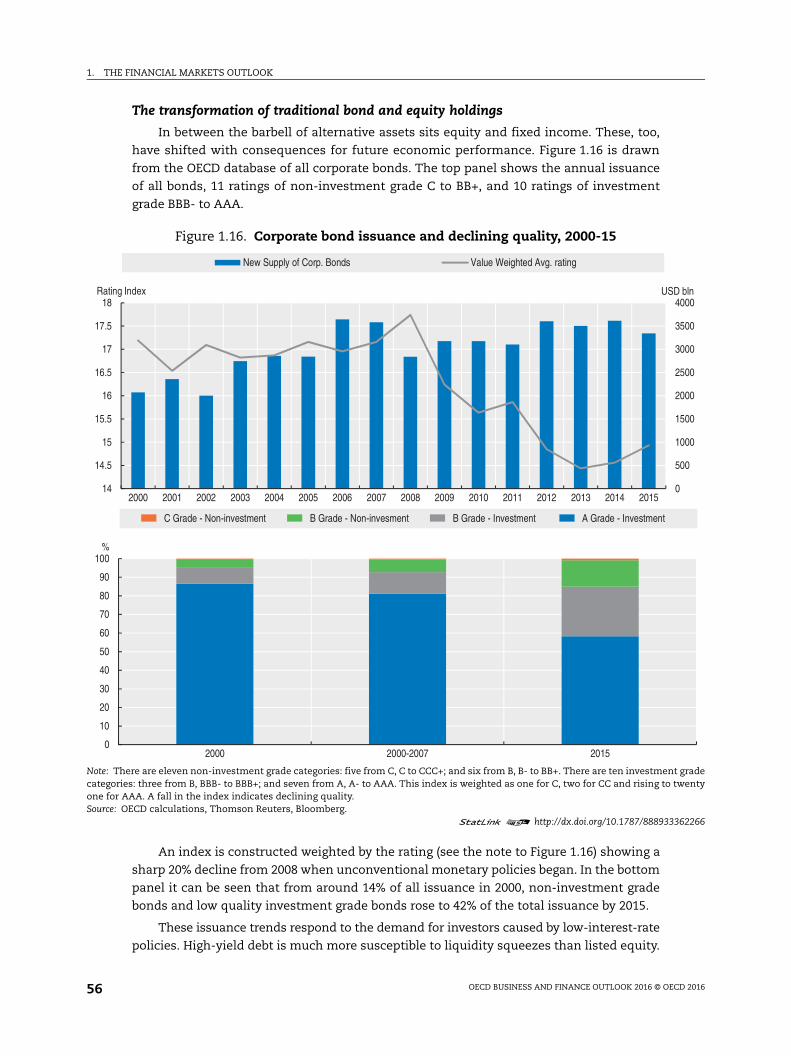
The transformation of traditional bond and equity holdings
In between the barbell of alternative assets sits equity and fixed income. These, too,
have shifted with consequences for future economic performance. Figure 1.16 is drawn
from the OECD database of all corporate bonds. The top panel shows the annual issuance
of all bonds, 11 ratings of non-investment grade C to BB+, and 10 ratings of investment
grade BBB- to AAA.
An index is constructed weighted by the rating (see the note to Figure 1.16) showing a
sharp 20% decline from 2008 when unconventional monetary policies began. In the bottom
panel it can be seen that from around 14% of all issuance in 2000, non-investment grade
bonds and low quality investment grade bonds rose to 42% of the total issuance by 2015.
These issuance trends respond to the demand for investors caused by low-interest-rate
policies. High-yield debt is much more susceptible to liquidity squeezes than listed equity.
Figure 1.16. Corporate bond issuance and declining quality, 2000-15
Note: There are eleven non-investment grade categories: five from C, C to CCC+; and six from B, B- to BB+. There are ten investment grade categories: three from B, BBB- to BBB+; and seven from A, A- to AAA. This index is weighted as one for C, two for CC and rising to twenty one for AAA. A fall in the index indicates declining quality.Source: OECD calculations, Thomson Reuters, Bloomberg.
1 2 http://dx.doi.org/10.1787/888933362266
0
500
1000
1500
2000
2500
3000
3500
4000
14
14.5
15
15.5
16
16.5
17
17.5
18
2000 2001 2002 2003 2004 2005 2006 2007 2008 2009 2010 2011 2012 2013 2014 2015
USD blnRating Index
New Supply of Corp. Bonds Value Weighted Avg. rating
0
10
20
30
40
50
60
70
80
90
100
2000 2000-2007 2015
%
C Grade - Non-investment B Grade - Non-invesment B Grade - Investment A Grade - Investment

1. THE FINANCIAL MARKETS OUTLOOK
OECD BUSINESS AND FINANCE OUTLOOK 2016 © OECD 2016 57
Rollover risk is rising, and more asset class flight from local corporate emerging market debt
is likely to be coming. There has been a superhighway into high-yield emerging market debt
on the way in, but it is not a dual carriageway, and the market could evaporate if faced with
a desire on the part of investors to get out at some point in the future. The primary markets
for junk bonds have already begun to close, and the secondary markets may well follow.
Flat capital spending and the demand for dividends and buybacks
The OECD has examined in great detail the investment and financial behaviour of
11 000 of the world’s biggest listed companies across 75 economies. Figure 1.17 shows a
summary picture of their corporate finance activity (expressed as a share of net sales).
Company operating cash flow and net borrowing, shown in the lines, fund the elements in
the bars: i.e. capital expenditure, dividends and buybacks and other net accumulation of
assets. The return on equity (ROE) less its cost (COE) is also shown (using the right-hand
axis).21 If the ROE less the COE is low or negative, investors would prefer not to have their
earnings retained for capital expenditure and instead returned to them as cash for
reallocation to consumption or other investments (including the leveraged alternative
investments referred to earlier).
Figure 1.17. Return on equity (ROE), capital costs and interest rates, 2002-15
Source: OECD calculations, Bloomberg.1 2 http://dx.doi.org/10.1787/888933362275
-2-1012345678910
-3-1.5
01.5
34.5
67.5
910.5
1213.5
1516.5
2002 2003 2004 2005 2006 2007 2008 2009 2010 2011 2012 2013 2014 2015
%% Net Sales
Advanced
-10
-5
0
5
10
15
20
25
-10
-5
0
5
10
15
20
25
2002 2003 2004 2005 2006 2007 2008 2009 2010 2011 2012 2013 2014 2015
%% Net Sales
Emerging
Capital Expenditure Dividend & Buybacks Net Asset Purchase & Other Financing FlowsNet Borrowings Operating Cashflow ROE - COE
1. THE FINANCIAL MARKETS OUTLOOK
OECD BUSINESS AND FINANCE OUTLOOK 2016 © OECD 201658
Some observations are worth noting:
Capital expenditure of companies as a share of net sales has been flat in advanced
economy companies since 2008. While not shown in Figure 1.17, the value added of these
companies per employee has also not risen (the productivity problem which is discussed
in detail in Chapter 2).
Dividends and buybacks have been rising in advanced economies since the crisis and have
reached about 60% of what companies spend on investment. Advanced economy companies
could raise this investment very easily without any need for external finance – but they do not
do this. Investors resist companies that want to use earnings to invest for the long term, and
they demand cash-like returns that are better than those available in actual cash and
investment grade bond markets. This works against companies wanting to take on long-run
projects needed to promote innovation and productivity – they would be punished by investors
for doing so. This is a direct result of attributing a zero time value to money via low interest rates.
Dividends and buybacks are less in emerging markets due to the state-driven investment
process. The return on equity in emerging markets is far below its cost, a sure reflection of
excess capacity (in sectors like steel, energy, other materials, automobiles and the like).
Investment is still running at double the rate in advanced economies (around 10% of net
sales). But it is capital-widening investment in the main, using existing technology, often
as a part of global value chains. As in advanced economies, productivity is not rising in
emerging market companies.
Concentrated sector borrowing
A counterpart of the world becoming more dependent on energy and materials sector
investment in the 2000s, has been a sharp increase in borrowing concentrated in these two
sectors. In the OECD 11 000 company database, energy sector debt issuance on average
tripled in both advanced and emerging economies in the post- versus the pre-crisis period
(Figure 1.18). The materials sector debt issuance doubled in advanced economies and rose
by an even more impressive four times in EMEs. Of the total debt of USD 3.1 trillion issued
by emerging market companies in the post-crisis period, 40% resides in the energy and
materials sectors. Of the total debt of USD 16.8 trillion issued by advanced economy
companies in the post-crisis period, 23% resides in the energy and materials sectors.
Debt issued by emerging economy companies is not well diversified across sectors. Of
the companies studied, 77% of the debt issued comes from just five of the 20 sectors
considered. These sectors are precisely those that are most subject to falling commodity
prices and the risk of company defaults. Falling commodity prices and debt concentrated
in these sectors is likely to add financial headwinds to growth: there are always financial
consequences to over-investment.
The “lift-off” issue for monetary policy in advanced economiesPolicy needs to restore “animal spirits” in the company sector by dealing with the global
misallocation of resources and excess capacity and by creating incentives for long-term risk
taking. When “animal spirits” recover to the point where “true” risk assets are desired in the
company sector, and investors are willing to forego short-term income for long-term capital
gain, there will be a significant asset allocation shift. Capital will move from cash return and
leveraged instruments to growth investments simultaneously within and across all asset
classes. This “lift-off” would lead to the end of secular stagnation. But how could this happen?

1. THE FINANCIAL MARKETS OUTLOOK
OECD BUSINESS AND FINANCE OUTLOOK 2016 © OECD 2016 59
“Inflation first” policies will delay a sustainable “lift-off” in rates
In the unlikely event that inflation comes first – say because unconventional monetary
policy in advanced economies and credit expansion in emerging markets are not
supported by measures to deal with structural problems – the outlook would not be too
encouraging. Central banks would be obliged to lift interest rates in response to inflation,
while growth of capital-widening investment using existing technology in the near term
would raise global supply without lifting productivity growth. This is what happened in
some emerging economies in response to the 2008 crisis. Any success would be short-lived
now just as it was then. The needed “creative destruction” phase on the supply side would
not happen. Just as some policies after the crisis worsened the excess capacity problems
and increased debt, the lack of structural adjustment now and the actual emergence of
inflation would ultimately cause the lift-off in interest rates to turn into a two-step process.
Near zero interest rates allow companies to carry excess debt, to borrow cheaply, to carry
out buybacks and to engage in unproductive investments that are based on a distorted cost of
Figure 1.18. Long-term debt issuance by companies, pre-crisis versus post-crisis
Note: Pre-crisis: 2002-07; post-crisis: 2008-15.Source: OECD calculations, Bloomberg.
1 2 http://dx.doi.org/10.1787/888933362281
0
500
1000
1500
2000
2500
3000USD, bln
Advanced
3,010
0
500
1000
1500
2000
2500
3000USD, bln
Emerging
Pre-crisis Post-crisis
1. THE FINANCIAL MARKETS OUTLOOK
OECD BUSINESS AND FINANCE OUTLOOK 2016 © OECD 201660
capital while waiting for the tide of aggregate demand to rise. The global output gap will never
close in a sustainable manner while the outstanding stock of unproductive and misallocated
investment remains in place. Rising interest rates under an “inflation first” scenario would
risk another financial crisis. The need for shedding excess capacity and debt would once more
become a priority. If a healthy “creative destruction” phase ensued, as higher interest rates
confronted companies with a realistic cost of capital and as structural policies were
implemented in advanced and emerging economies on the scale required, then the scene
would then be set to have more sustainable growth and normalised interest rates later on.
A “productivity first” corporate scenario
Rather than inflation first, it would be desirable to have a productivity first scenario.
Such a scenario is not encouraged at all by making the time value of money zero –
monetary policy is not the instrument needed at this point in time. But what policies would
actually address the productivity problem in the company sector? To answer this question
requires better knowledge of what is happening in the corporate world. In studying the
11 000 (non-financial and non-real estate) companies in the next chapter, some very
interesting facts emerge about those that have succeeded and those that have failed since
the crisis. These facts point the way to policies that might actually work.
Prior to the crisis, there was a group of high-productivity level companies (sometimes
referred to as being on the “frontier”), and a very long string of low-productivity level
companies that appeared not to be sharing in technology and growth.22 The crisis shook up
everything and led to two distinct groups of high-productivity companies in the post-2008
period: those in the high-level productivity group that remained there, but whose growth
in productivity has been negative (i.e. they are losing their shine); and, at the other extreme,
a separate group that has had rapid productivity growth. In between these two groups sits
the majority of companies with both lower productivity levels and only moderate growth.
The group exhibiting both high levels of productivity and high growth shows all the
signs of having been through a “creative destruction” phase: shedding businesses and
locations that are not working in the tougher post-crisis environment while acquiring
others that are more synergistic with their goals. However, there are simply not nearly
enough of these companies.
The following productivity chapter looks at the financial decisions that those dynamic
“creative destruction” companies took to succeed in the post-crisis environment – focusing
only on those where true one-way causality could be established. These companies had
four key interrelated corporate finance characteristics that investors need to take note of:
They expensed much more on research and development (R&D) than other companies,
which in turn requires risk taking and a long-term focus critical to the innovation process.
They did not increase borrowing compared to equity in the post-crisis period (while those
that did were in the low productivity groups). An equity focus enabled the successful
firms to focus on longer-term goals instead of altering their business model to try to
generate more short-term cash to meet debt obligations.
These same high-productivity companies had a buffer of free cash flow: i.e. their operating
cash flow was in excess of that needed for capital expenditure. Such companies can
maintain a focus on long-term goals in the face of short-term disruptions.
Those that succeeded used M&A (buying and selling business segments) to rationalise
what they were doing in the tougher more competitive post-crisis environment.

1. THE FINANCIAL MARKETS OUTLOOK
OECD BUSINESS AND FINANCE OUTLOOK 2016 © OECD 2016 61
Looking through the lens of what companies need to benefit from these four success
factors, the following sets of policies discussed in more detail in the next chapter, if
implemented, would create an environment where investors could become more optimistic
and would permit interest rates to rise without negative consequences for markets:
With respect to R&D: improved R&D fiscal incentives (the issue of designing tax incentives for
R&D that are consistent with broader tax policy efficiency is taken up in full in Chapter 3).
With respect to equity finance instead of debt: the removal of tax incentives that favour debt
over equity and the simplification of equity listing rules that increase costs relative to
private equity. Other equity market reforms that encourage initial public offerings are
also considered (see also Chapters 3 and 4).
With respect to increased free cash flow: crucial for a strong uplift of “animal spirits” are: more
open trade and investment regimes between countries; breaking down competitive
barriers to entry often granted by government rules and regulations; more flexible labour
market rules to allow companies to manage their cash flow when setbacks occur;
recapitalising banks, dealing with their NPL problems and getting the nexus right between
regulations and negative interest rates; and encouraging lower-cost non-bank finance.
With respect to M&A activity: breaking down cultural and regulatory barriers to cross-border
M&A.
The near-term financial markets outlookUnfortunately structural reform on the scale required is unlikely in the near term. This
means that “creative destruction” and a “lift-off” in rates is postponed. Central banks are
most likely to continue with low interest rates and the quantitative easing approach. It is
not the best environment to be raising interest rates and yet low rates delay the “creative
destruction” phase.
It is difficult to convince governments that the only choice is incremental-but-persistent
“creative destruction” when they are faced with unemployment – particularly in more rigid,
less market-oriented economies. Adding to the current stock of debt and supporting the
current “portfolio shift” towards illiquid securities and herding into crowded trades that
favour higher yields (even when leverage is required) does nothing to bring us closer to a bull
market “lift-off” in interest rates. It does increase the probability of a scenario where another
setback in growth and markets will be required to bring about the right mix of policy later on.
Some near-term financial implications are:
The zero or negative time value of money will continue to work against long-term risk
taking in the real economy (as opposed to financial risk taking via leveraged speculation).
The delay in the ending of unconventional monetary policy will lead to further easing in
emerging markets and related exchange rates distortions.
Exchange rate battles will continue: net negative terms of trade shocks will remain in play
for commodity exporters encouraging them to ease monetary policy and lower exchange
rates. As other countries will not want to lose competitiveness, they too will bias their own
monetary policy in the same direction (and possibly blunting positive terms-of-trade shocks
for commodity-importing countries that succeed in keeping their exchange rate lower).
Renewed emerging market portfolio outflows if Federal Reserve confidence in tightening
resumes, may lead other emerging markets to follow China and impose cross-border
controls. This would be to enable them to keep monetary policy easier than otherwise
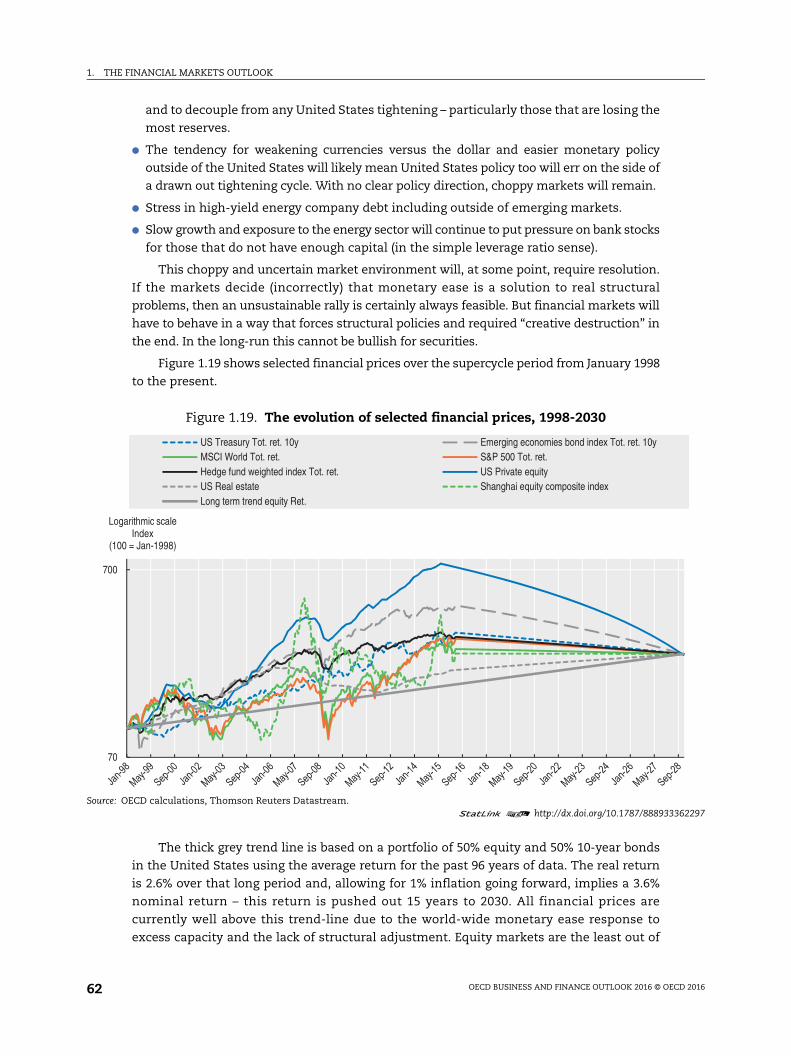
1. THE FINANCIAL MARKETS OUTLOOK
OECD BUSINESS AND FINANCE OUTLOOK 2016 © OECD 201662
and to decouple from any United States tightening – particularly those that are losing the
most reserves.
The tendency for weakening currencies versus the dollar and easier monetary policy
outside of the United States will likely mean United States policy too will err on the side of
a drawn out tightening cycle. With no clear policy direction, choppy markets will remain.
Stress in high-yield energy company debt including outside of emerging markets.
Slow growth and exposure to the energy sector will continue to put pressure on bank stocks
for those that do not have enough capital (in the simple leverage ratio sense).
This choppy and uncertain market environment will, at some point, require resolution.
If the markets decide (incorrectly) that monetary ease is a solution to real structural
problems, then an unsustainable rally is certainly always feasible. But financial markets will
have to behave in a way that forces structural policies and required “creative destruction” in
the end. In the long-run this cannot be bullish for securities.
Figure 1.19 shows selected financial prices over the supercycle period from January 1998
to the present.
The thick grey trend line is based on a portfolio of 50% equity and 50% 10-year bonds
in the United States using the average return for the past 96 years of data. The real return
is 2.6% over that long period and, allowing for 1% inflation going forward, implies a 3.6%
nominal return – this return is pushed out 15 years to 2030. All financial prices are
currently well above this trend-line due to the world-wide monetary ease response to
excess capacity and the lack of structural adjustment. Equity markets are the least out of
Figure 1.19. The evolution of selected financial prices, 1998-2030
Source: OECD calculations, Thomson Reuters Datastream.1 2 http://dx.doi.org/10.1787/888933362297
70
700
Logarithmic scale Index
(100 = Jan-1998)
US Treasury Tot. ret. 10y Emerging economies bond index Tot. ret. 10yMSCI World Tot. ret. S&P 500 Tot. ret.Hedge fund weighted index Tot. ret. US Private equityUS Real estate Shanghai equity composite indexLong term trend equity Ret.

1. THE FINANCIAL MARKETS OUTLOOK
OECD BUSINESS AND FINANCE OUTLOOK 2016 © OECD 2016 63
line. Unfortunately most of the other markets are far less liquid than listed equities. There
is likely to be illiquidity-related volatility in some of these markets. This volatility will be
greater if markets, in the end, have to force structural adjustment and it would be much
less with a “productivity first” scenario.
The equity market in 2015 had been discounting a very negative scenario for the global
economy and then corrected. Figure 1.20 shows an OECD indicator of equity market
valuation. While it is unfair to compare the market value of listed stocks in an individual
economy to that country’s GDP as a valuation tool, since with global value chains earnings
may come from any part of the world, this cannot be a problem for all stock exchanges
together when compared to world GDP. In late 2014 and the first half of 2015, global equity
markets together reached levels which have previously been associated with corrections.
In the second half of 2015 and early 2016, the correction in equity markets brought values
back into line with the historical valuation average. The markets appeared to stabilise at
this level, and then began to rally again without moving into the “cheap” region. It is
inconceivable that the market can sustainably rally on easy monetary policy alone. World
GDP led by productivity will need to move up with the equity market – this will require the
structural policies discussed in this and following chapters.
Notes
1. This theme is developed in full in OECD (2015a).
2. Handy Size (15 000-35 000 tonnes); Supramax (45 000-59 000 tonnes), Panamax (60 000-80 000 tonnes) and Capesize (100 000 tonnes). Capesize carry about 62% of the trade.
3. Large numbers of ships were built on the basis of the needs of the supercycle, and many of these now lie idle.
4. Figures for capital expenditure include depreciation. The sectors where capital expenditure is well in excess of depreciation include the supercycle-related sectors: energy, materials, utilities, and capital goods and transport.
5. See data appendix of Chapter 2 for definitions.
Figure 1.20. Global market capitalisation versus world GDP, 1999-2016
Source: OECD calculations, World Federation of Stock Exchanges, Thomson Reuters Datastream.1 2 http://dx.doi.org/10.1787/888933362300
30
40
50
60
70
80
90
100
110
120%

1. THE FINANCIAL MARKETS OUTLOOK
OECD BUSINESS AND FINANCE OUTLOOK 2016 © OECD 201664
6. The European Chamber of Commerce (2016) publishes estimates of excess capacity in eight severely affected sectors: steel, aluminium, cement, chemicals, refining, flat glass, shipbuilding, and paper and paper board.
7. See McKinsey and Company (2011) who predicted that ROEs would fall from 20% pre-crisis to 7% post crisis, roughly in line with their cost of equity.
8. See Warren (2105), for example.
9. See Blundell-Wignall and Atkinson (2010) for example.
10. In order to minimise this disincentive, Japan has introduced a 3-tier system whereby most of the bank reserves held at the central bank still receive a small positive interest rate and the increased portion of reserves due to QE continues to have a zero interest rate. Japanese banks have already met the 100% ultimate LCR requirement.
11. See Blundell-Wignall and Roulet (2013) for a definition of the DTD. The horizontal 3-standard-deviation line is shown because, historically, banks with a DTD above 3 prior to a crisis managed not to default.
12. These markets arise when currencies are not convertible and/or where extreme capital flow measures are used – they trade in US dollars as a parallel market.
13. Wealthy individuals, according to market intelligence, have participated in syndicates that ramp up equity markets and then sell to less sophisticated investors as they are drawn into the market.
14. The weights at the time of writing are US dollar 26.4%, euro 21.4%, Japanese yen 14.7%, HK dollar 6.6%, Australian dollar 6.3%, Malaysian Ringgit 4.7%, rouble 4.4%, sterling 3.9%, Singapore dollar 3.8%, Thai Bart 3.3%, Canadian dollar, 2.5%, Swiss franc 1.5% and NZ $ 0.7%.
15. This process led to duplication and excess capacity in the supercycle sectors discussed elsewhere in this Outlook. Political connections are important, and once local champions become too big to fail exit strategies become problematic. Historically, an unintended adverse consequence is that companies listed on the New York Stock exchange with better technologies have been forced into bankruptcy while local companies supported by local banks have not: e.g. in photovoltaic cells, massive over capacity resulted in Suntech and LDK (both listed in the United States) going bust. See Chen, Tain-Jy (2015).
16. Domestic credit growth is M2 growth minus reserves growth in Figure 1.14.
17. See OECD (2015a).
18. Supposedly less correlated with bonds and equities, though rarely so in practice.
19. The underlying assets may be illiquid and are not traded while a market is made in real time for the shares of the ETF. Zero fees are handled by securities lending.
20. These data are collected separately. While pension and insurance companies hold much of it, these are not taken from institutional investor asset allocations.
21. The cost of equity is the trend earnings growth for the company plus its dividend yield.
22. OECD (2015b) corroborates these results.
References
Blundell-Wignall, A. and Paul Atkinson (2010), “Thinking beyond Basel III: Necessary Solutions for Capital and Liquidity”, OECD Journal: Financial Market Trends, Vol. 2010/1, http://dx.doi.org/10.1787/fmt-2010-5km7k9tpcjmn.
Blundell-Wignall, A. and Caroline Roulet (2013), “Business models of banks, leverage and the distance-to-default”, OECD Journal: Financial Market Trends, Vol. 2012/2, http://dx.doi.org/10.1787/fmt-2012-5k4bxlxbd646.
Blundell-Wignall, A. and C. Roulet (2015), “Evaluating capital flow management measures used as macro-prudential tools”, OECD Journal Financial Trends, Vol. 2015/2, http://dx.doi.org/10.1787/fmt-2015-5jm0p44dlq6f.
Chen, Tain-Jy (2015), “The Development of China’s Solar Photovoltaic Industry: Why Industrial Policy Failed”, Cambridge Journal of Economics, March.
European Central Bank (2013), “Liquidity Regulation and Monetary Policy Implementation”, ECB Monthly Bulletin, April.
1. THE FINANCIAL MARKETS OUTLOOK
OECD BUSINESS AND FINANCE OUTLOOK 2016 © OECD 2016 65
European Chamber (2016), Overcapacity in China: An Impediment to the Party’s Reform Agenda, European Chamber of Commerce, China.
European Parliament (2016), Non-Performing Loans in the Banking Union: Stocktaking and Challenges, Brussels.
IMF (2015), “Managing Capital Outflows-Further Operational Considerations”, Staff Report for the IMF Executive Board.
McKinsey and Company (2011), Global Corporate and Investment Banking: an Agenda for Change.
OECD (2015a) OECD Business and Finance Outlook 2015, OECD Publishing, Paris, http://dx.doi.org/10.1787/9789264234291-en.
OECD (2015b), The Future of Productivity, OECD Publishing, Paris, http://dx.doi.org/10.1787/9789264248533-en.
Redak, V. (2016), “The Impact of Low and Negative Interest Rates on Bank Profitability and Business Models”, Presentation to the OECD Committee on Financial Markets (available from the author on request).
Warren, D.R. (2015), “Developments in Banking Law”, Review of Banking and Financial Law, Vol. 34. (pp 439-450, section V, on “Congress’s Rollback of the Dodd-Frank Swaps Push-Out Rule”).

From:OECD Business and Finance Outlook 2016
Access the complete publication at:http://dx.doi.org/10.1787/9789264257573-en
Please cite this chapter as:
OECD (2016), “The financial markets outlook”, in OECD Business and Finance Outlook 2016, OECDPublishing, Paris.
DOI: http://dx.doi.org/10.1787/9789264257573-6-en
This work is published under the responsibility of the Secretary-General of the OECD. The opinions expressed and argumentsemployed herein do not necessarily reflect the official views of OECD member countries.
This document and any map included herein are without prejudice to the status of or sovereignty over any territory, to thedelimitation of international frontiers and boundaries and to the name of any territory, city or area.
You can copy, download or print OECD content for your own use, and you can include excerpts from OECD publications,databases and multimedia products in your own documents, presentations, blogs, websites and teaching materials, providedthat suitable acknowledgment of OECD as source and copyright owner is given. All requests for public or commercial use andtranslation rights should be submitted to [email protected]. Requests for permission to photocopy portions of this material forpublic or commercial use shall be addressed directly to the Copyright Clearance Center (CCC) at [email protected] or theCentre français d’exploitation du droit de copie (CFC) at [email protected].