the evolution of performance measurement - the evolution of...presenters: qr code date: the...
TRANSCRIPT
Presenters:
QR Code
Date:
The Evolution of Performance Measurement
• Margaret Kelly, State Budget Director, Minnesota Management & Budget• Patrice Impey, General Manager Financial Services, CFO, City of Vancouver• Melinda Munro, Owner and Lead Consultant, Munro Strategic Perspective• Jay Stroebel, Deputy City Coordinator, City of Minneapolis, MN• Harry P. Hatry, Director, Public Management Program, Urban Institute,
Washington, DC
May 19, 2014

Logistics Scan the QR code to download the presentation This session is 1 hour, 40 minutes long. There will be time for Q/A at the end. Please use the microphones for Q/A
This session is worth 2 CPE credit Self‐scan for credits or see a GFOA staff person
Please complete the session evaluation

Our Speakerso Patrice Impey
• General Manager Financial Services, CFO, City of Vancouver
o Melinda Munro• Owner and Lead Consultant, Munro Strategic Perspective and formerly with the City of Vancouver
o Jay Stroebel• Deputy City Coordinator, City of Minneapolis, MN
o Harry P. Hatry• Director, Public Management Program, Urban Institute, Washington, DC

Session Roadmapo Patrice Impey and Melinda Munro
• Creating a performance measurement framework from scratch – Vancouver’s experience in getting started while learning from best practices
o Jay Stroebel• Evolution towards more intensive use of data for decision‐making.
o Harry Hatry• Recommendations for strengthening performance measurement and performance management

THE EVOLUTION OF PERFORMANCE MEASUREMENTTHE STORY OF VANCOUVER
Patrice Impey, City of VancouverMelinda Munro, Munro Strategic Perspectives
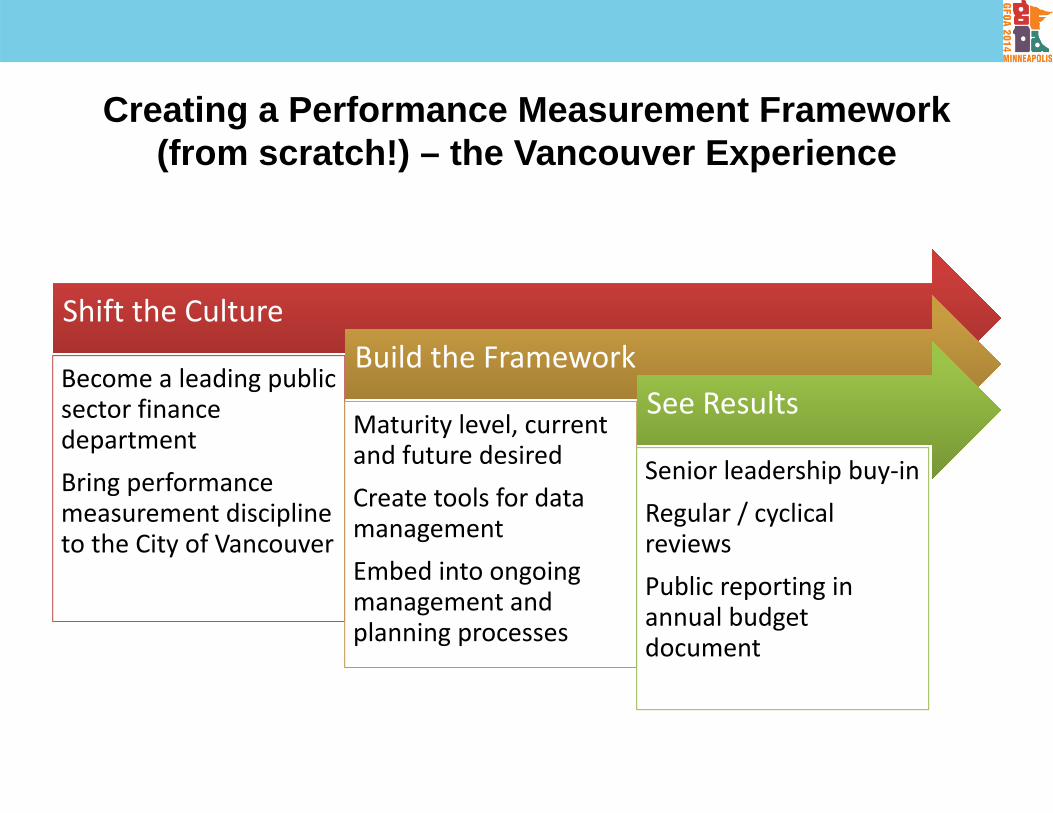
Creating a Performance Measurement Framework (from scratch!) – the Vancouver Experience
Shift the CultureShift the Culture
Become a leading public sector finance departmentBring performance measurement discipline to the City of Vancouver
Build the FrameworkBuild the Framework
Maturity level, current and future desiredCreate tools for data managementEmbed into ongoing management and planning processes
See ResultsSee Results
Senior leadership buy‐inRegular / cyclical reviewsPublic reporting in annual budget document
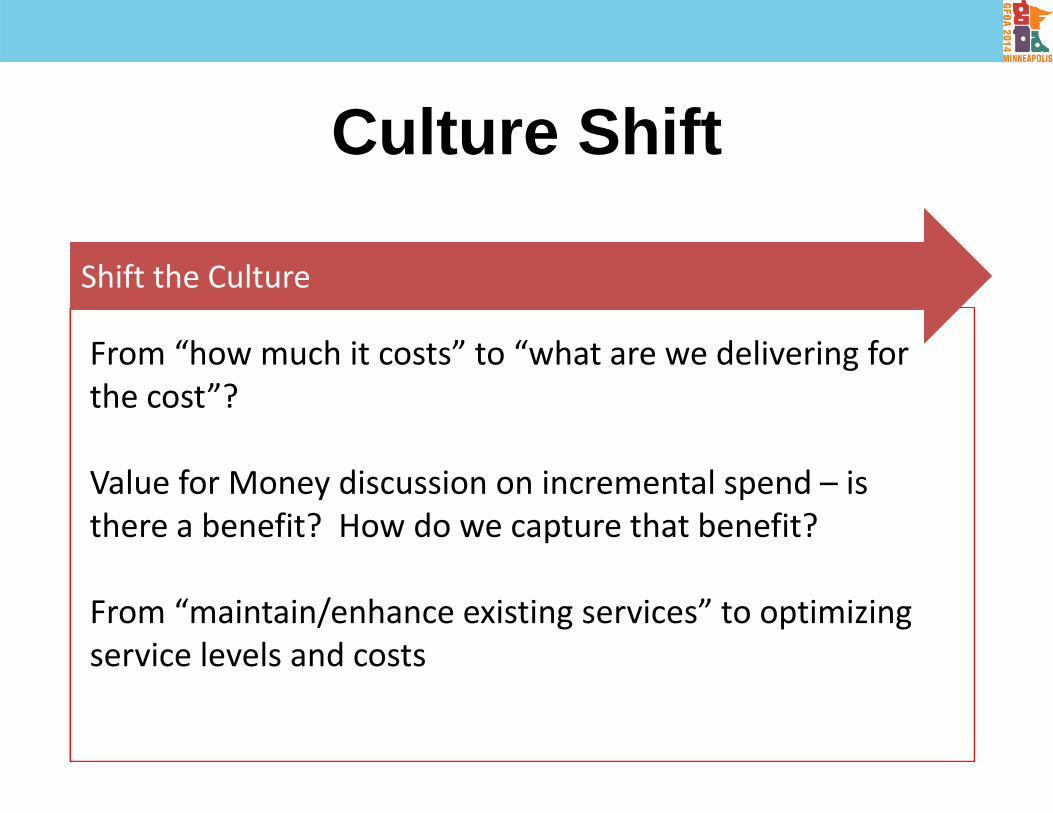
Culture Shift
Shift the CultureShift the Culture
From “how much it costs” to “what are we delivering for the cost”?
Value for Money discussion on incremental spend – is there a benefit? How do we capture that benefit?
From “maintain/enhance existing services” to optimizing service levels and costs
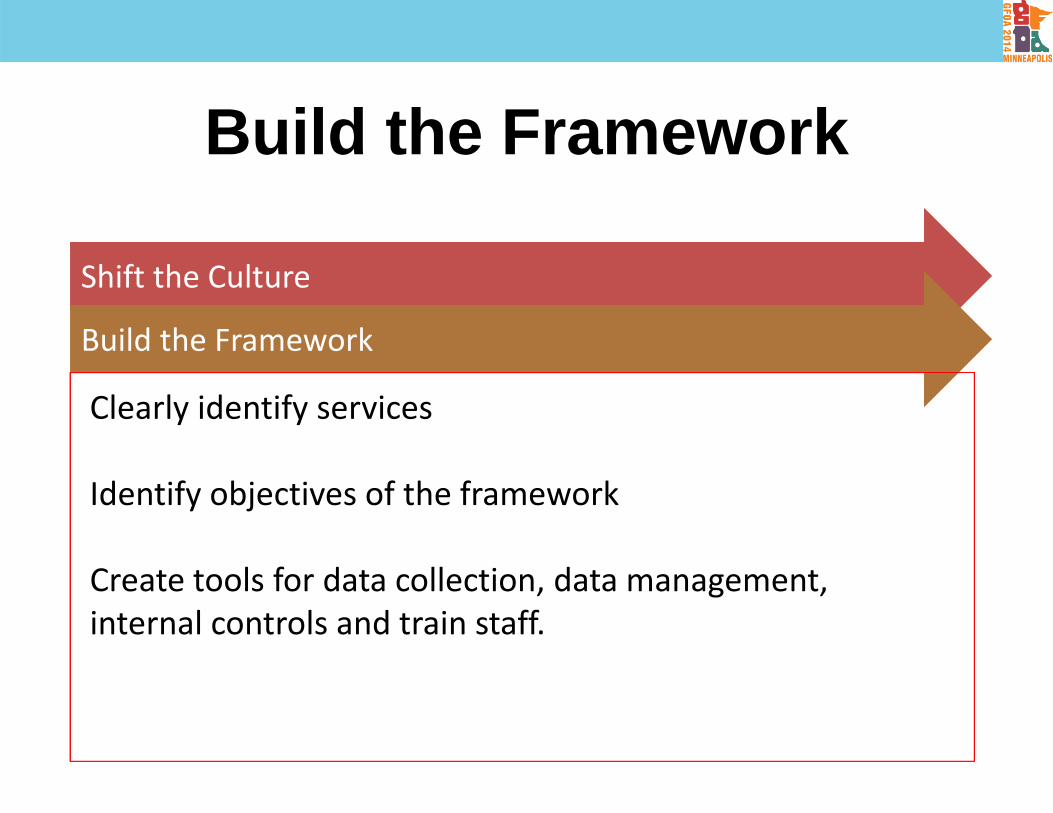
Build the Framework
Shift the CultureShift the Culture
Build the FrameworkBuild the Framework
Clearly identify services
Identify objectives of the framework
Create tools for data collection, data management, internal controls and train staff.
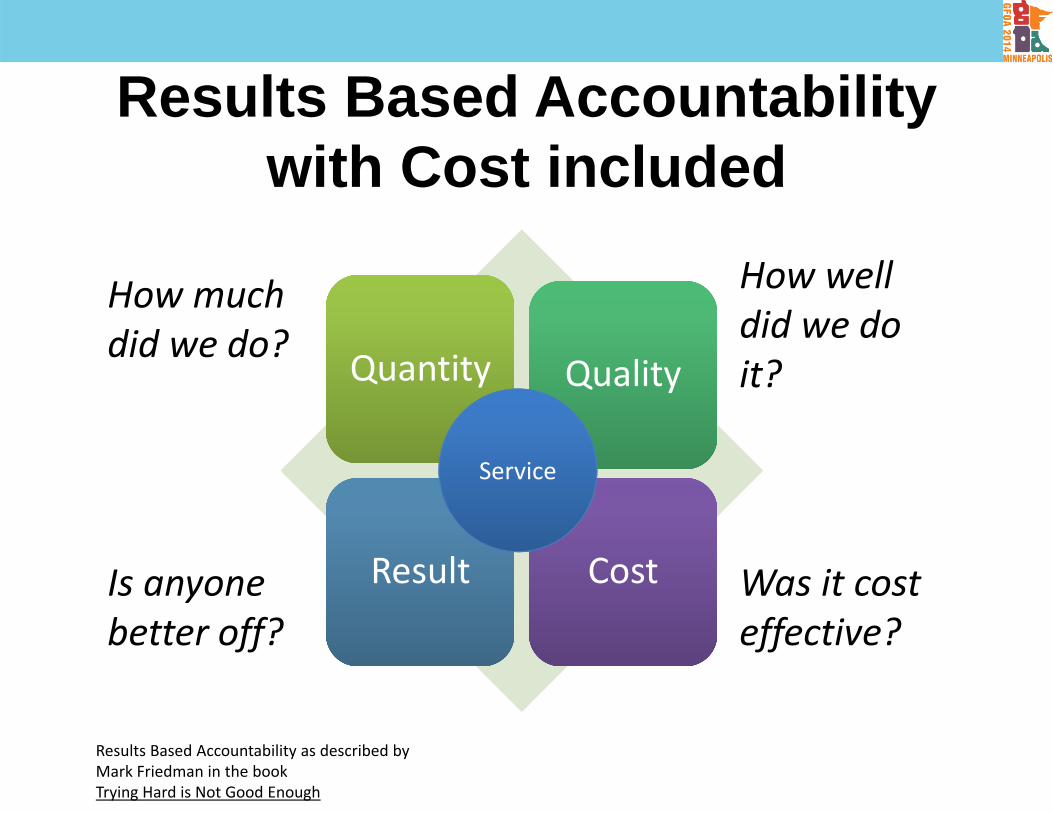
Results Based Accountability with Cost included
Quantity Quantity QualityQuality
Result Result Cost Cost
Service
How much did we do?
How well did we do it?
Is anyone better off?
Was it cost effective?
Results Based Accountability as described by Mark Friedman in the book Trying Hard is Not Good Enough
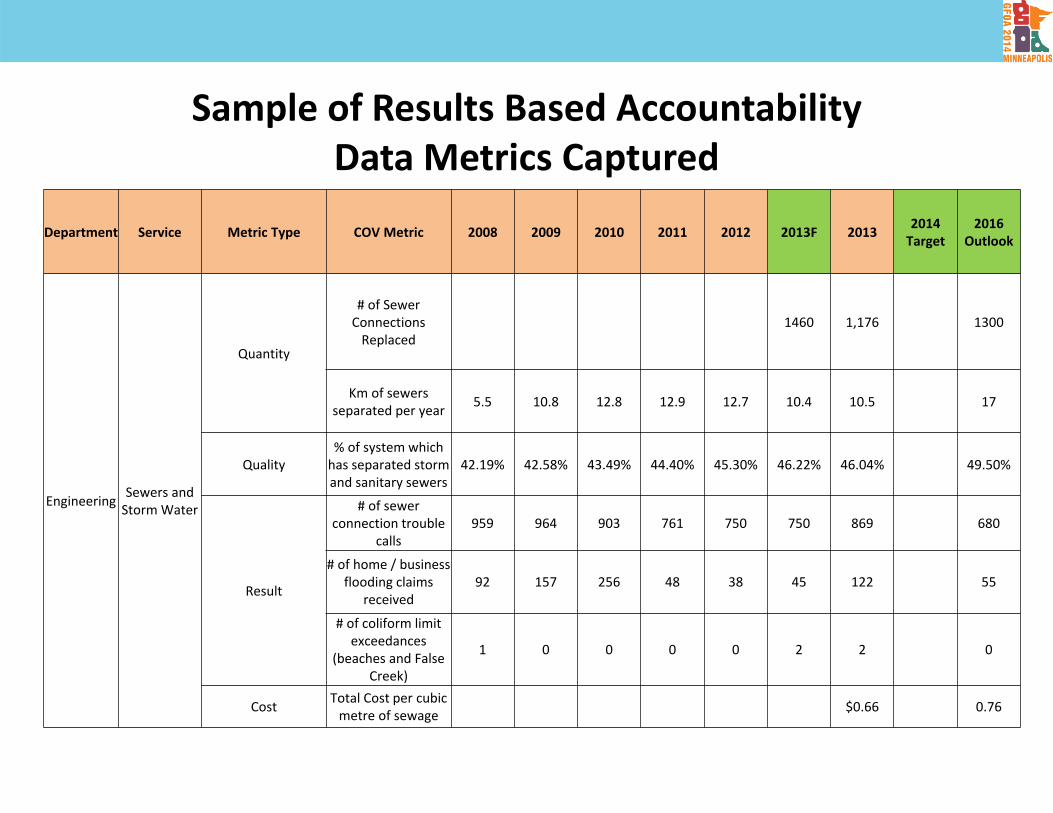
Department Service Metric Type COV Metric 2008 2009 2010 2011 2012 2013F 2013 2014 Target
2016 Outlook
Engineering Sewers and Storm Water
Quantity
# of Sewer Connections Replaced
1460 1,176 1,300 1300
Km of sewers separated per year 5.5 10.8 12.8 12.9 12.7 10.4 10.5 12 17
Quality% of system which has separated storm and sanitary sewers
42.19% 42.58% 43.49% 44.40% 45.30% 46.22% 46.04% 46.97% 49.50%
Result
# of sewer connection trouble
calls959 964 903 761 750 750 869 650 680
# of home / business flooding claims
received92 157 256 48 38 45 122 50 55
# of coliform limit exceedances
(beaches and False Creek)
1 0 0 0 0 2 2 0 0
Cost Total Cost per cubic metre of sewage $0.66 0.68 0.76
Sample of Results Based Accountability Data Metrics Captured
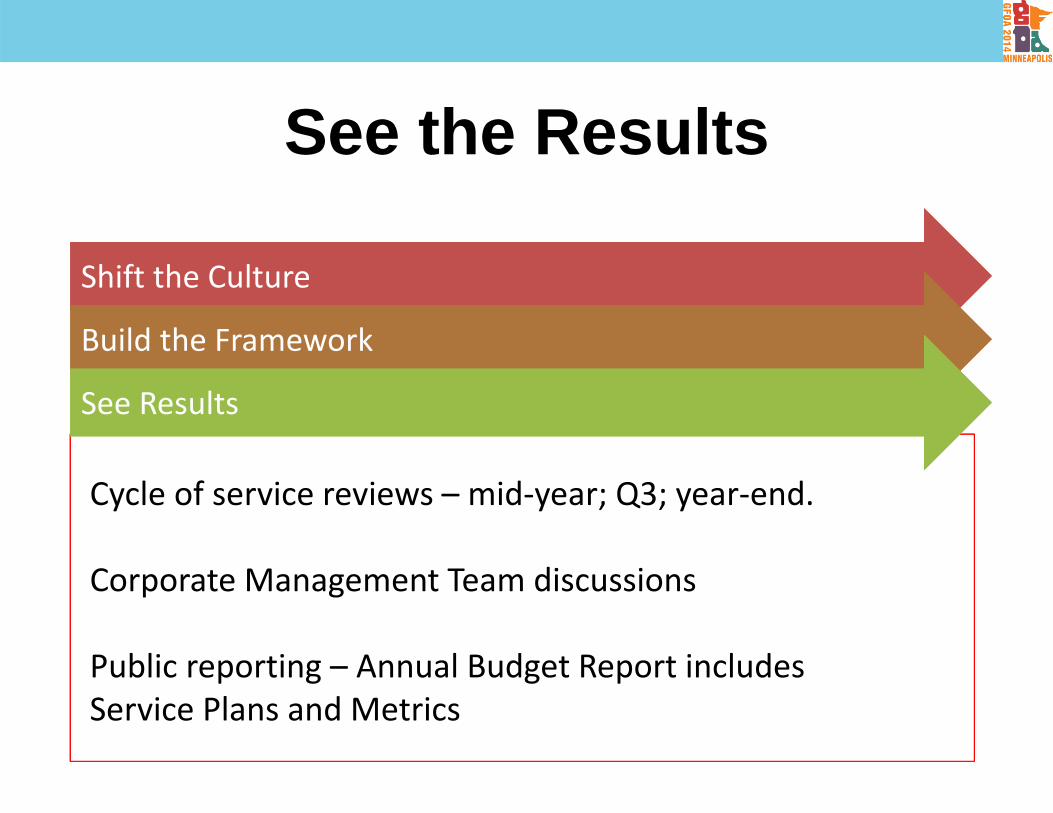
See the Results
Shift the CultureShift the Culture
Build the FrameworkBuild the Framework
Identify services clearly
Cycle of service reviews – mid‐year; Q3; year‐end.
Corporate Management Team discussions
Public reporting – Annual Budget Report includesService Plans and Metrics
See ResultsSee Results

Service A
Service B
HighLow
Excellent
Poor Today
Tomorrow
TodayTomorrow
Bringing Results to LifeBudgeting Impact
Service Results
Cost ($)
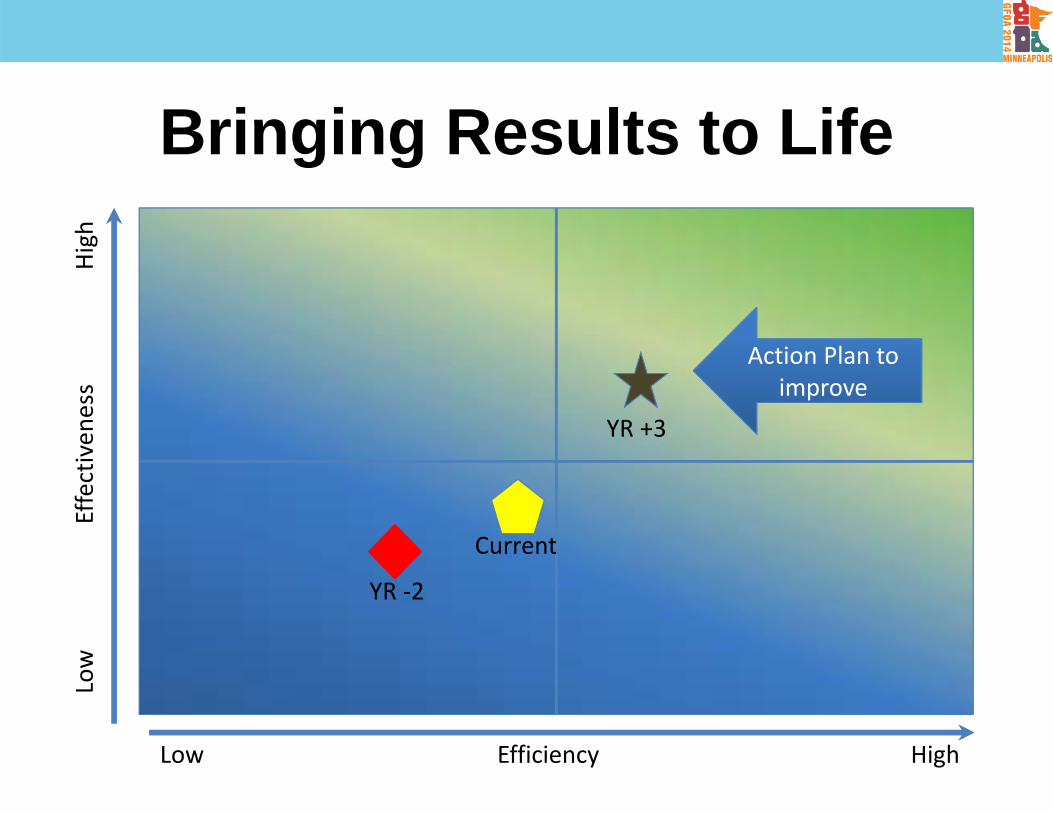
Bringing Results to LifeLow Effectiven
ess High
Low Efficiency High
YR ‐2
Current
YR +3
Action Plan to improve
Action Plan to improve

14
Issues – 10 Year Collisions with Injury Trend
15
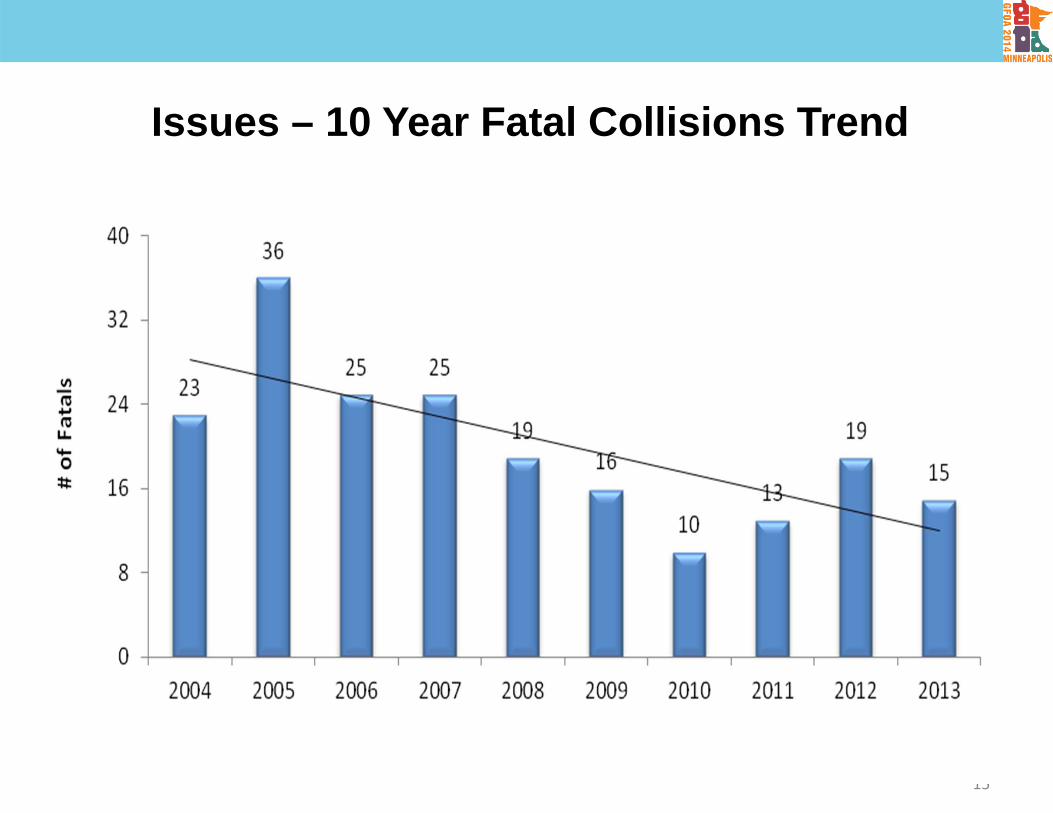
Issues – 10 Year Fatal Collisions Trend

16
Waterworks Key Metrics# of main breaks:
• Rate will be variable year to year partially due to weather. Overall consistent with 10 year average
• No catastrophic breaks in 2013

17
Waterworks Benchmark Results (National Water and Wastewater Benchmarking Initiative)
# of main breaks • Still well below the 2012 average rate of water main
breaks when compared to 19 benchmark cities

Adding Analytics
0
200
400
600
800
1000
1200
1400
0102030405060708090
100
2006 2008 2009 2010 2011 2012 2013
Number of MainBreaks
Average AnnualPrecipitation
Vancouver Water DashboardDepartment Service Metric Type Metric
Baseline (GCAP/Housing/2040 etc)
2008 2009 2010 2011 2012 2013F 2013 2016 Outlook2020 Target
Preferred Trend for Metric
(Up/Down/Neutral/NA)
Level of metric predictability
(High/Medium/Low)
Level of metric controllability
(High/Medium/Low)Reporting Schedule
Engineering Water Quality # of main breaks 64 87 68 65 48 50 68 50 Down Low Low Monthly
Engineering Water Quality# of Service Connection
Breaks471 370 529 599 617 630 437 650 Down Low Low Monthly
Engineering Water Quality% of samples with turbidity
within Health Canada acceptable range
88.98% 82.54% 96.94% 98.66% 98.68% 98.70% 98.60% 99.50% Neutral Medium Medium Monthly
Engineering Water QuantityWater Consumed Per
Capita (litres) ‐ Residential321 296 298 283 286 279
*available end of Q1
266 215 Down Medium Medium Quarterly
Engineering Water QuantityWater Consumed Per Capita (litres) ‐ Total
583 535 508 486 491 476 471 453 391 Down Medium Medium Quarterly
Engineering Water Quantity# of Water Connections
ReplacedNDA 1912 1930 1673 1350 1,558 1400 Neutral High High Monthly
Engineering Water Quantity Km of Water Pipe Replaced NDA 17.3 12.45 5.3 8.1 8.867 11 Up High High Yearly
2006 2008 2009 2010 2011 2012 2013F 2013
1224.2 1025.8 1090.6 1207 1068.5 1211.3 N/A 943.5
Annual Precipitation (Vancouver.weatherstats.ca)
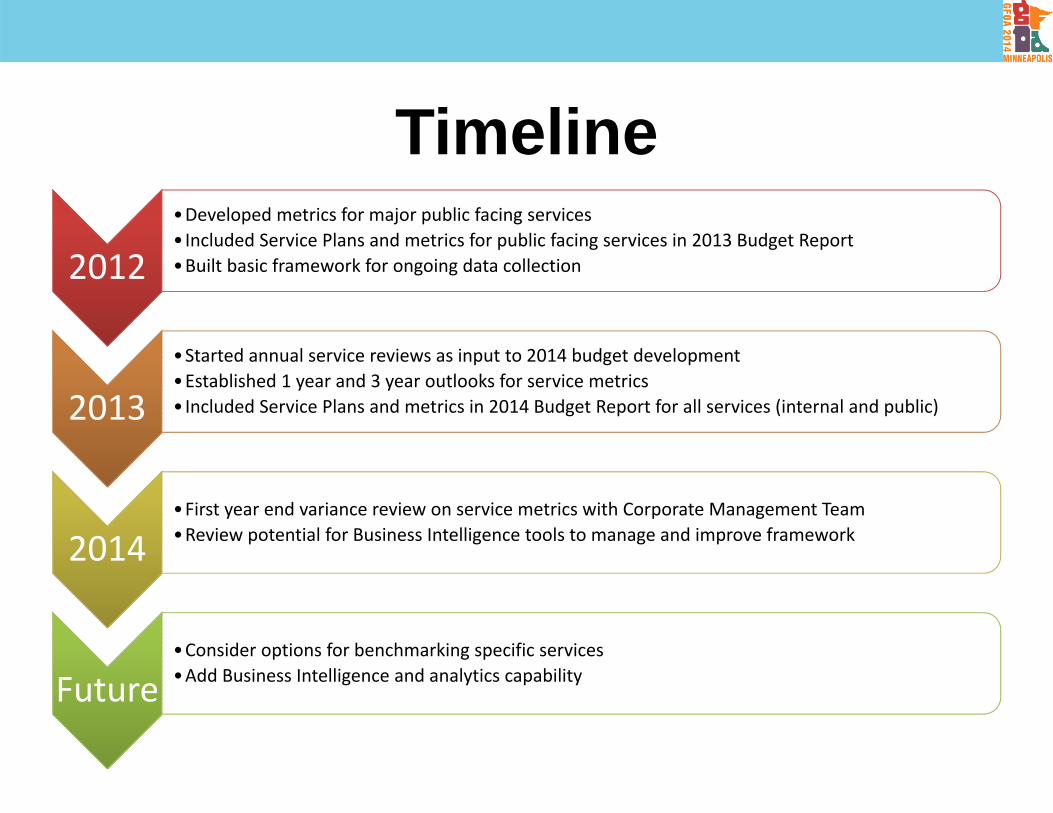
Timeline
20122012•Developed metrics for major public facing services•Included Service Plans and metrics for public facing services in 2013 Budget Report•Built basic framework for ongoing data collection
20132013•Started annual service reviews as input to 2014 budget development•Established 1 year and 3 year outlooks for service metrics•Included Service Plans and metrics in 2014 Budget Report for all services (internal and public)
20142014•First year end variance review on service metrics with Corporate Management Team•Review potential for Business Intelligence tools to manage and improve framework
FutureFuture•Consider options for benchmarking specific services•Add Business Intelligence and analytics capability

Take Home Messageso What to do
• Focus on the outcomes – performance measurement is most valuable when it improves outcomes
• Build the framework to be robust and reliable• Embed it in regular planning, review and budget processes• Use the data to tell the story
• Put it in context• Connect it to public policy
o What not to do• Don’t ignore the impact on operational staff time and effort – it can be substantial
• Don’t forget that it is a significant change effort

Contact informationPatrice Impey
CFO City of [email protected]
www.vancouver.ca
Melinda MunroMunro Strategic [email protected]
EVOLUTION OF PERFORMANCE MEASUREMENTMINNEAPOLIS’S EXPERIENCEJay StroebelCity of Minneapolis
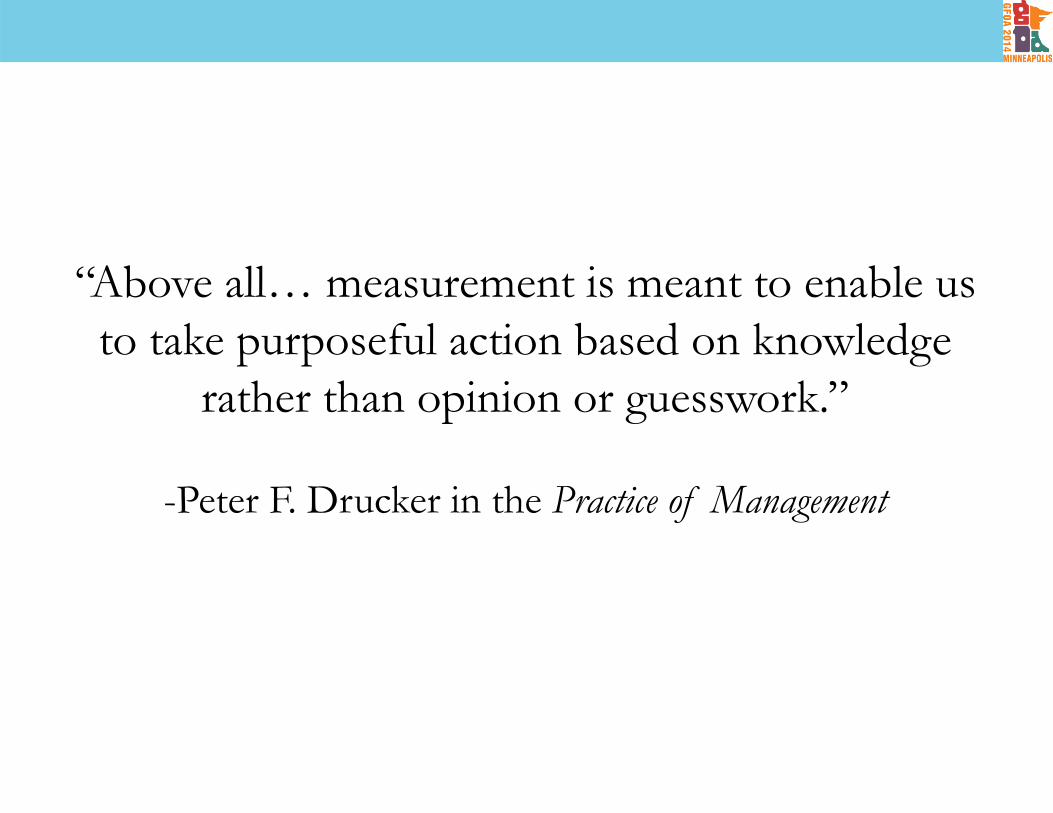
“Above all… measurement is meant to enable us to take purposeful action based on knowledge
rather than opinion or guesswork.”
-Peter F. Drucker in the Practice of Management
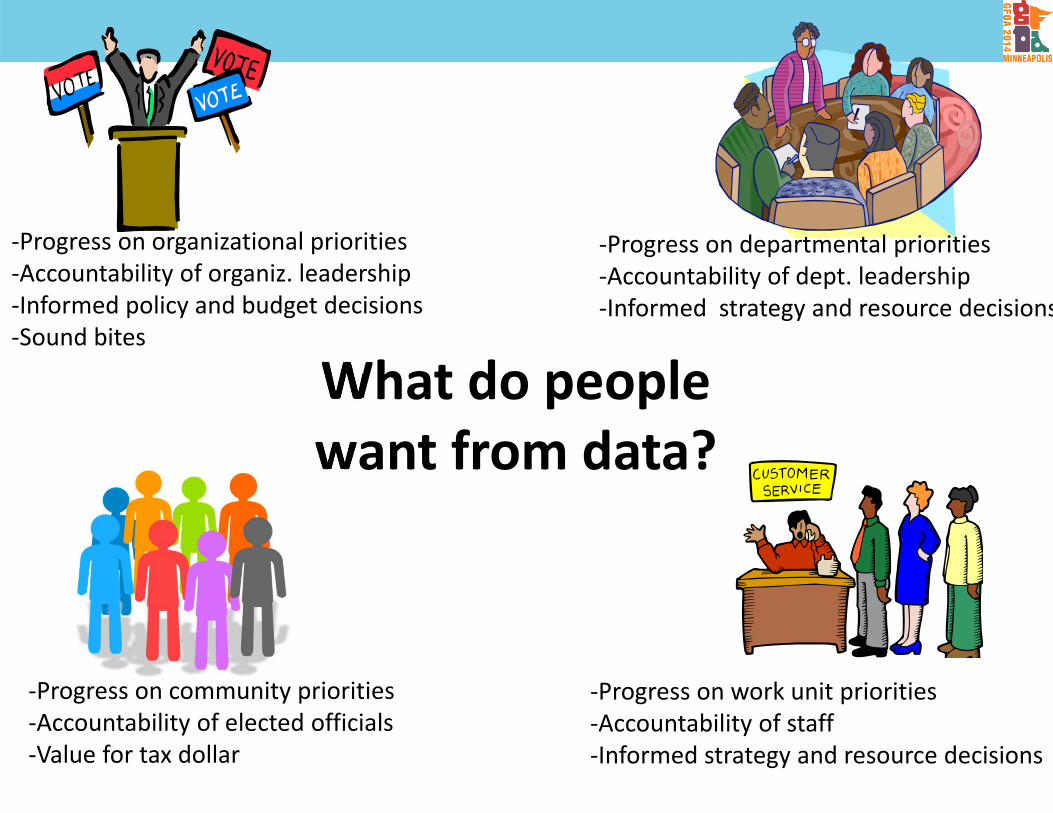
What do people want from data?
‐Progress on organizational priorities‐Accountability of organiz. leadership‐Informed policy and budget decisions‐Sound bites
‐Progress on departmental priorities‐Accountability of dept. leadership‐Informed strategy and resource decisions
‐Progress on community priorities‐Accountability of elected officials‐Value for tax dollar
‐Progress on work unit priorities‐Accountability of staff‐Informed strategy and resource decisions
Our approach – results management
Turn data into knowledge and knowledge into action Discuss the data Aligned direction Coordinated management systems Continuous improvement Results driven
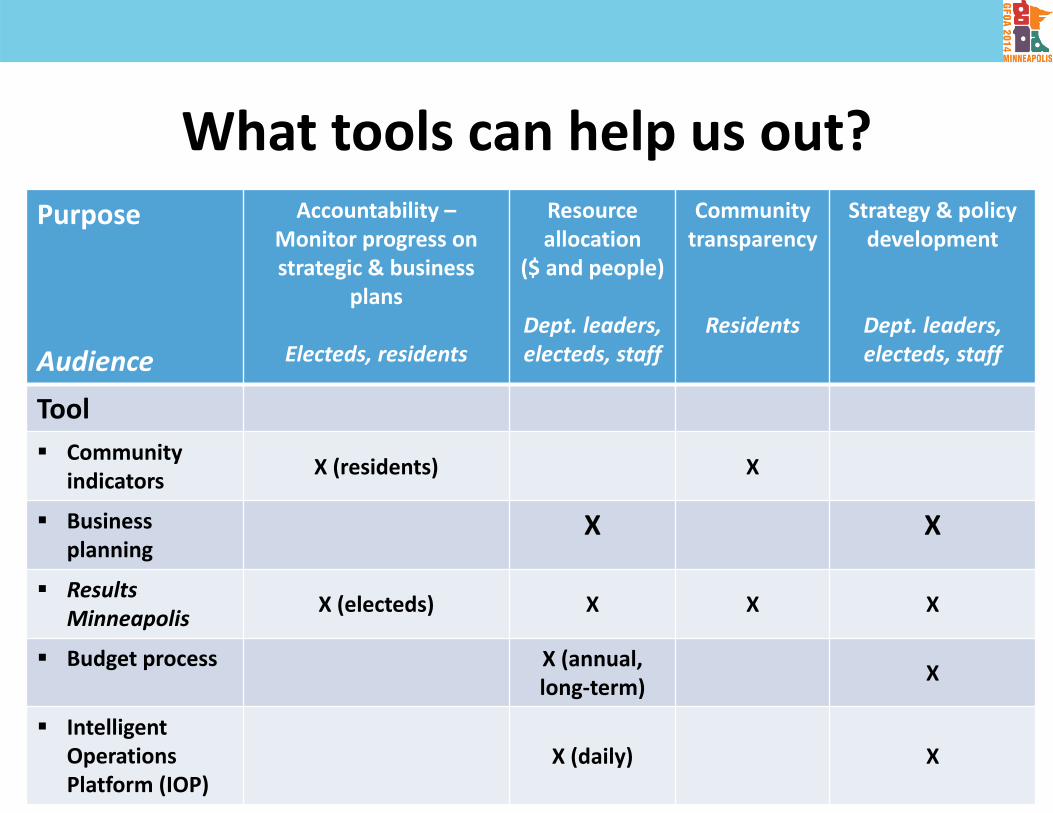
Purpose
Audience
Accountability –Monitor progress onstrategic & business
plans
Electeds, residents
Resource allocation
($ and people)
Dept. leaders, electeds, staff
Community transparency
Residents
Strategy & policy development
Dept. leaders, electeds, staff
Tool Community
indicators X (residents) X
Businessplanning
X X
Results Minneapolis X (electeds) X X X
Budget process X (annual,long‐term) X
IntelligentOperations Platform (IOP)
X (daily) X
What tools can help us out?

Tools to highlight Results Minneapolis Progress conferences Results management in action Value of drilling in
Budget process Intelligent Operations Platform (IOP)

Results Minneapolis progress conferences
Regular (weekly) discussions on data with departments and multi‐department topics, not to punish, but to monitor and make informed decisions
Informs and engages Mayor, City Council, department heads & other key leaders
Guides improved decision‐making (budget, strategy, etc.)
Highlights what’s working well and what’s not
Probing, informative and at all times constructive
Used in Minneapolis since summer 2006

Planning
Work
Performance reporting
Discuss performance
Continuous improvement
Results Management in ActionYouth Violence Prevention
282 293 283 298 378 379285 285 260 213 218
1,0181,217 1,233
1,801
2,274
1,624
1,2361,098
904 878 918
0
500
1,000
1,500
2,000
2,500
2002 2003 2004 2005 2006 2007 2008 2009 2010 2011 2012
Juveniles Involved in Violent Crime (arrestees and suspects)
Arrestee Suspect*
*Information from Computer Assisted Police Reporting System (CAPRS) queries where the beginning Suspect Age is listed between 1 and 17. (Example: The victim identified the suspect as being 16‐25 years of age, CAPRS shows the event age as 16, and this would be counted as a juvenile suspect.) Source: Minneapolis Police Department
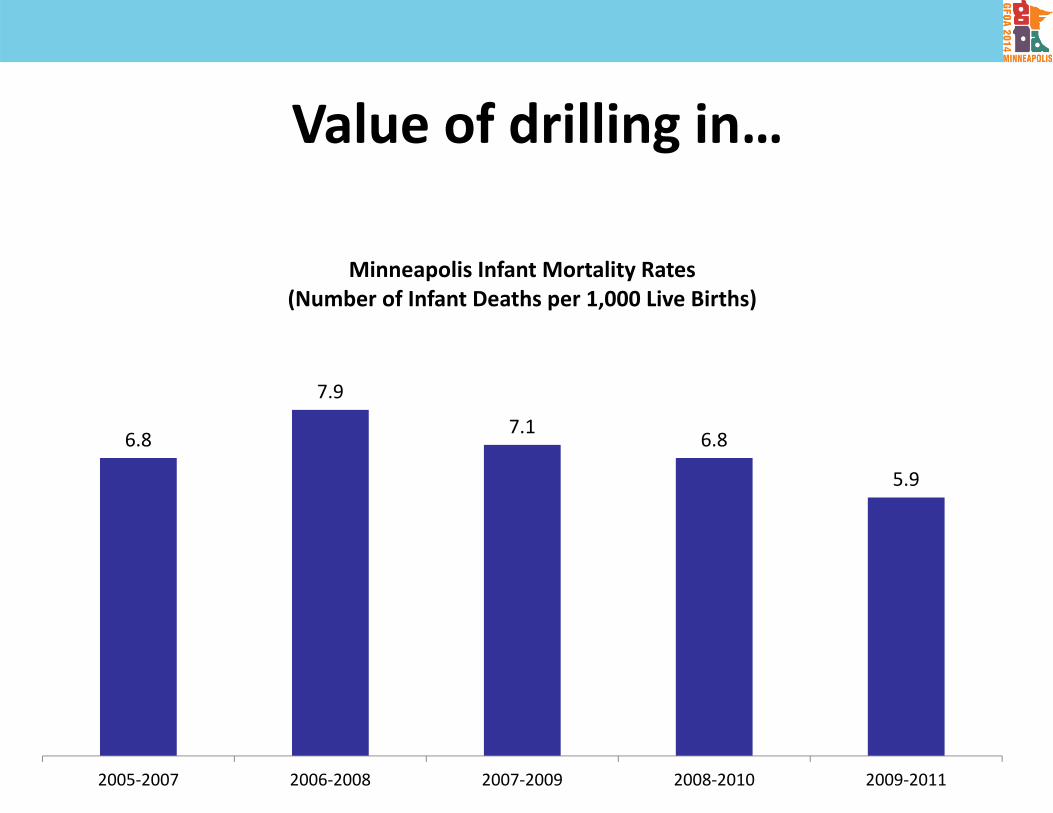
6.8
7.9
7.1 6.8
5.9
2005‐2007 2006‐2008 2007‐2009 2008‐2010 2009‐2011
Minneapolis Infant Mortality Rates (Number of Infant Deaths per 1,000 Live Births)
Value of drilling in…


6.8
7.9
3.9
11.1
4.3 5.
3
7.9
9.1
3.0
13.3
6.4
5.3
7.1 8.
0
2.3
12.9
5.6
4.5
6.8 7.1
2.3
10.9
8.5
3.6
5.9
1.9
1.5
10.1
7.1
3.5
0
2
4
6
8
10
12
14
Minneapolis American Indian Asian/Pacific Islander Black Hispanic White
Infant Mortality Rates by Race/Ethnicity(Number of Infant Deaths per 1,000 Live Births)
2005‐2007 2006‐2008 2007‐2009 2008‐2010 2009‐2011 2014 Target
Source: Minnesota Department of Health
Target 6.6

9.88.6
3.2
6.0
8.0
1.8
12.8
8.1
6.3
4.1
11.4
3.9
14.4
7.2
5.1 4.9
9.7
2.0
0
2
4
6
8
10
12
14
16
BlackUS‐Born
BlackForeign‐Born
HispanicUS‐Born
HispanicForeign‐Born
Asian/Pacific IslanderUS‐Born
Asian/Pacific IslanderForeign‐Born
Infant Mortality Rates by Mother's Race/Ethnicity and Country of Birth (Number of Infant Deaths per 1,000 Live Births)
2002‐2004 2005‐2007 2008‐2010
Source: Minnesota Department of Health

Tools to highlight Results Minneapolis Budget process Core elements Pavement Condition Index (PCI) example Health example Domestic assault conviction rate example
Intelligent Operations Platform (IOP)
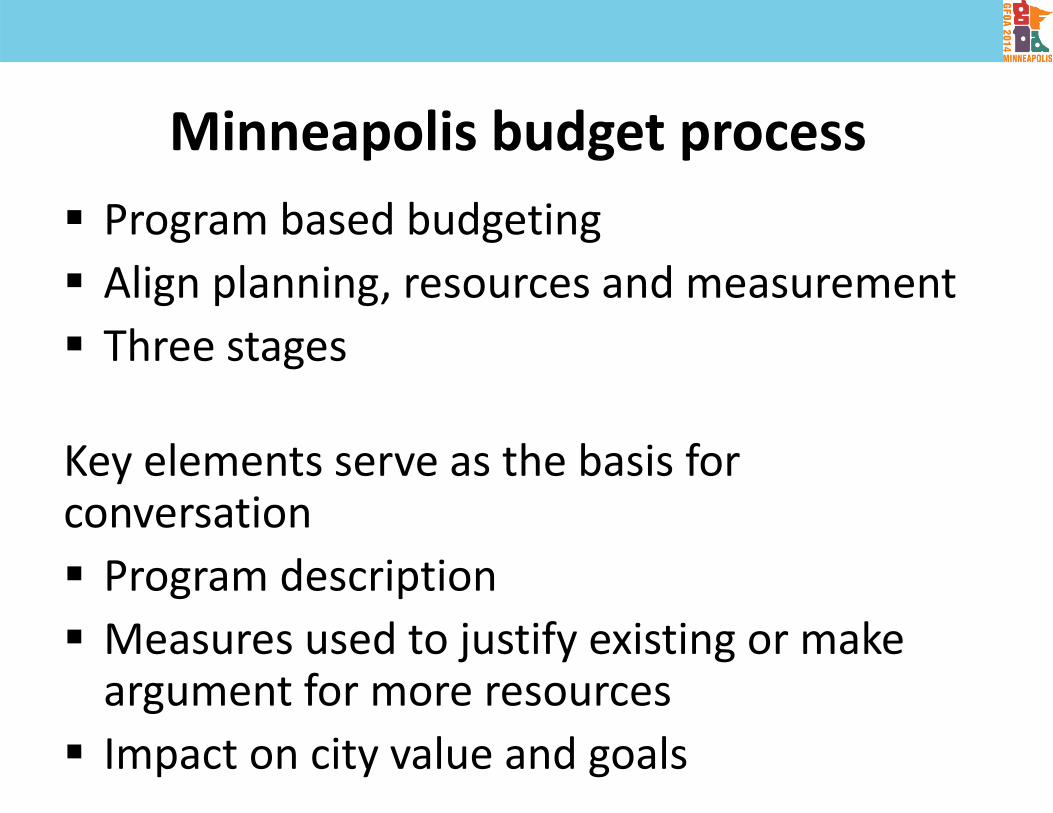
Minneapolis budget process Program based budgeting Align planning, resources and measurement Three stages
Key elements serve as the basis for conversation Program description Measures used to justify existing or make argument for more resources Impact on city value and goals
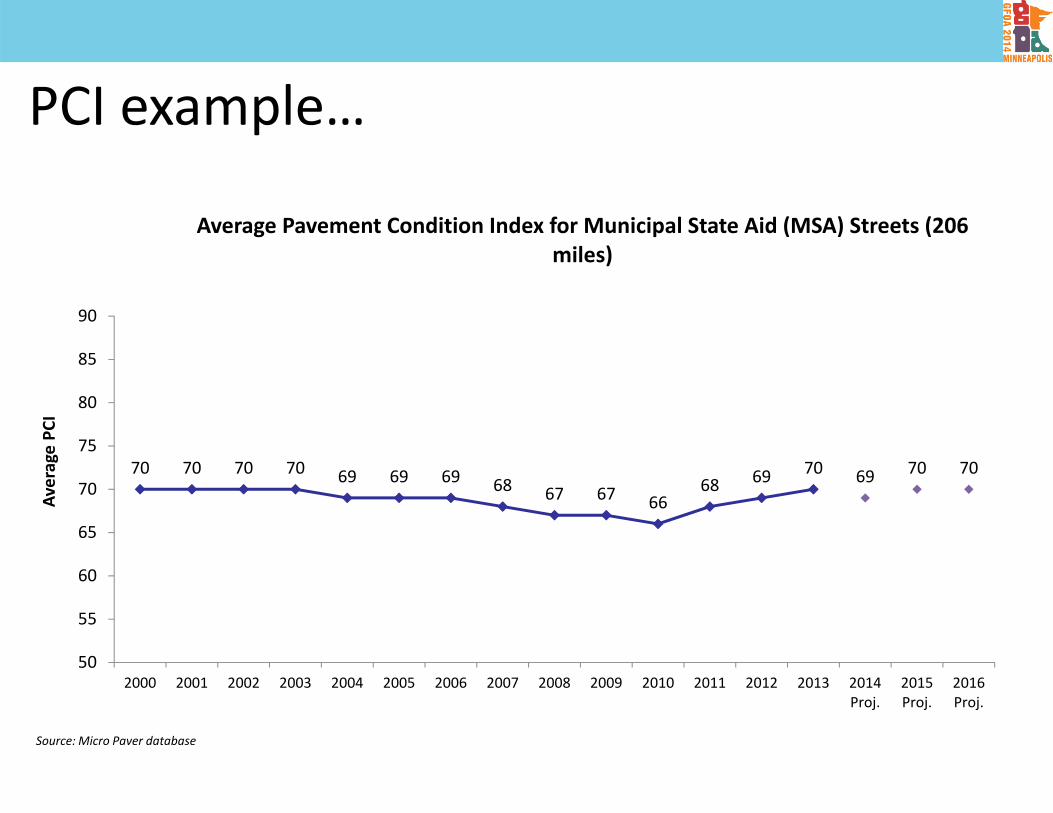
70 70 70 70 69 69 69 68 67 67 6668 69 70 69 70 70
50
55
60
65
70
75
80
85
90
2000 2001 2002 2003 2004 2005 2006 2007 2008 2009 2010 2011 2012 2013 2014Proj.
2015Proj.
2016Proj.
Average PC
I
Average Pavement Condition Index for Municipal State Aid (MSA) Streets (206 miles)
Source: Micro Paver database
PCI example…

83 82 81 80 79 78 77 76 7573 72 71 71 70 70 69 68
50
55
60
65
70
75
80
85
90
2000 2001 2002 2003 2004 2005 2006 2007 2008 2009 2010 2011 2012 2013 2014Proj.
2015Proj.
2016Proj.
Average PC
I
Average Pavement Condition Index for Residential Streets (631 miles)
Source: Micro Paver database
$15.3
$20.9$23.5
$30.8
$25.1
$36.0
$20.9
$15.2 $16.6
$32.7$34.9
$40.2$43.0
$45.1
$0.0
$5.0
$10.0
$15.0
$20.0
$25.0
$30.0
$35.0
$40.0
$45.0
$50.0
2010 2011 2012 2013 Approved 2014 Proposed 2015 Proposed 2016 Proposed 2017 Proposed 2018
Dollars in
Millions
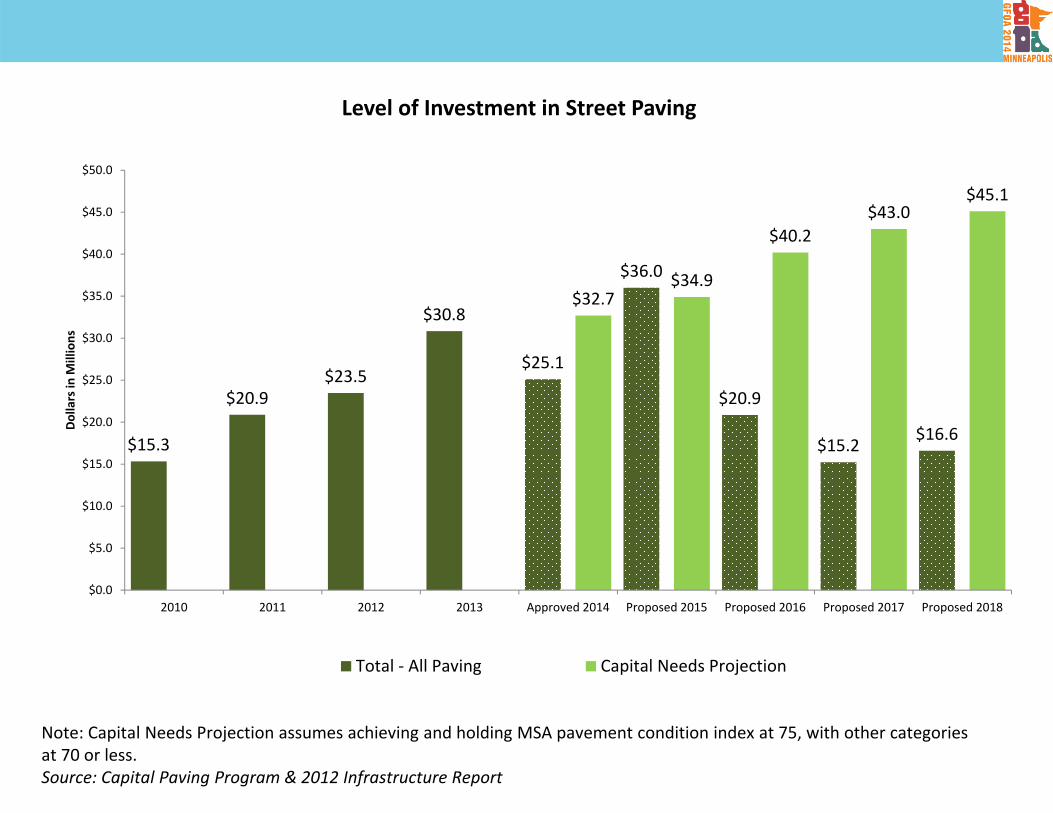
Level of Investment in Street Paving
Total ‐ All Paving Capital Needs Projection
Note: Capital Needs Projection assumes achieving and holding MSA pavement condition index at 75, with other categories at 70 or less.Source: Capital Paving Program & 2012 Infrastructure Report
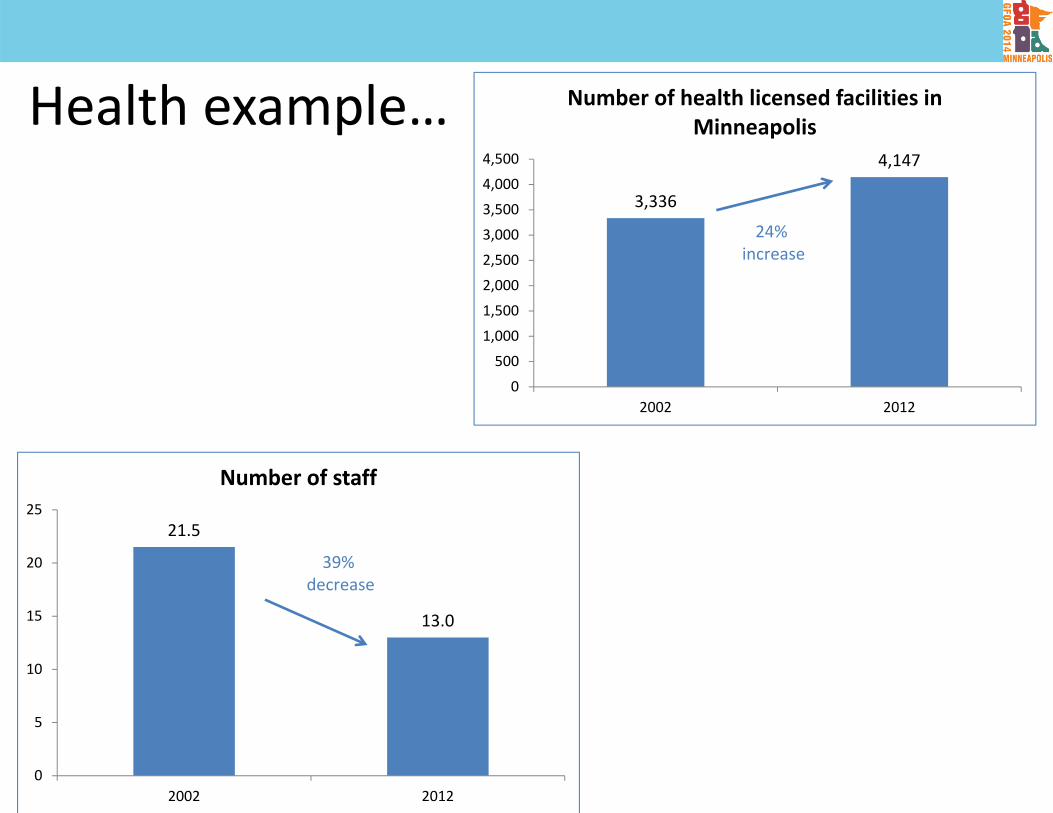
21.5
13.0
0
5
10
15
20
25
2002 2012
Number of staff
39% decrease
3,336
4,147
0
500
1,000
1,500
2,000
2,500
3,000
3,500
4,000
4,500
2002 2012
Number of health licensed facilities in Minneapolis
24% increase
Health example…
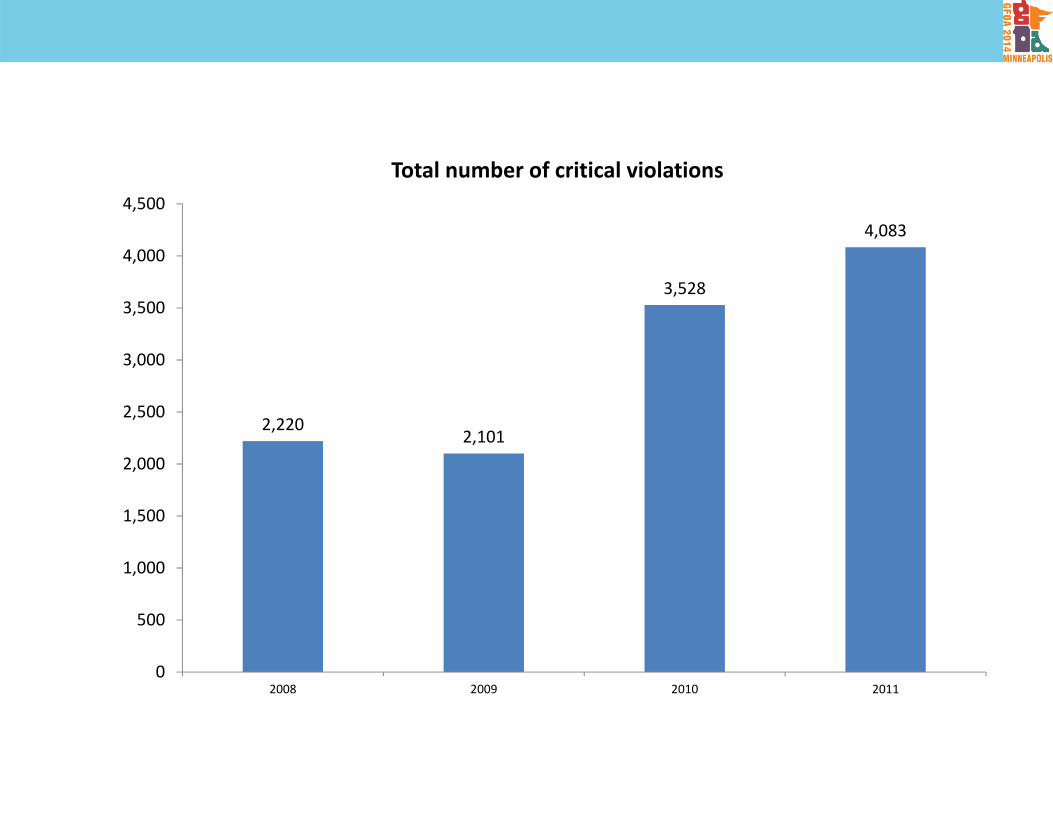
2,2202,101
3,528
4,083
0
500
1,000
1,500
2,000
2,500
3,000
3,500
4,000
4,500
2008 2009 2010 2011
Total number of critical violations

133147
220229
276
294
377
0
50
100
150
200
250
300
350
400
Toledo, OH Bloomington, MN Hennepin Cty Kansas City, MO Portland, OR St. Paul, MN Minneapolis
Number of facilities per inspector, 2012
FDA Recommended 180‐225

Domestic violence convictions example…
48%
58%54%
61%66%
72% 70% 72%
64%70%
0%
10%
20%
30%
40%
50%
60%
70%
80%
90%
100%
2005 2006 2007 2008 2009 2010 2011 2012 2013 2014Target
Conviction Rate on Domestic Violence Cases
Source: CAO

Tools to highlight Results Minneapolis Budget process Intelligent Operations Platform (IOP) Data model Analytics continuum

Next big step for Minneapolis
• Current tools, largely focused on• Rear‐view• Macro‐geography with some exceptions• One dimensional (based on data from one department)
• Intelligent Operations Platform (IOP)• Multi‐dimensional (pulling data from multiple sources)• Observe data on map, timeline and charts• Allows deeper drill down on specific areas• Use the analytical power of the tool
45

Intelligent Operations Platform
46
AdvancedAnalytics
AnomalyDetection
HotspotDetection
EventPlanning
Dashboards, Reports, Workflows with Secure Access
Alerting
Information Exchange
City Systems of Record
Public Works FireIncidents
PoliceIncidents
Non-CityAgencies
DID Events
Citizens311/911
TrafficAccidents
Reg SvcsPermits
IOP
Graffiti

Moving up the analytics continuum
47
• Event correlationHow can we
make it happen?
• Traffic impact• Weighted hotspot
What will happen?
• Pattern discoverer• Hotspot• Anomaly detection• GPS analysis
What happened and why?
• Dashboard• Scheduled report
How are things going?

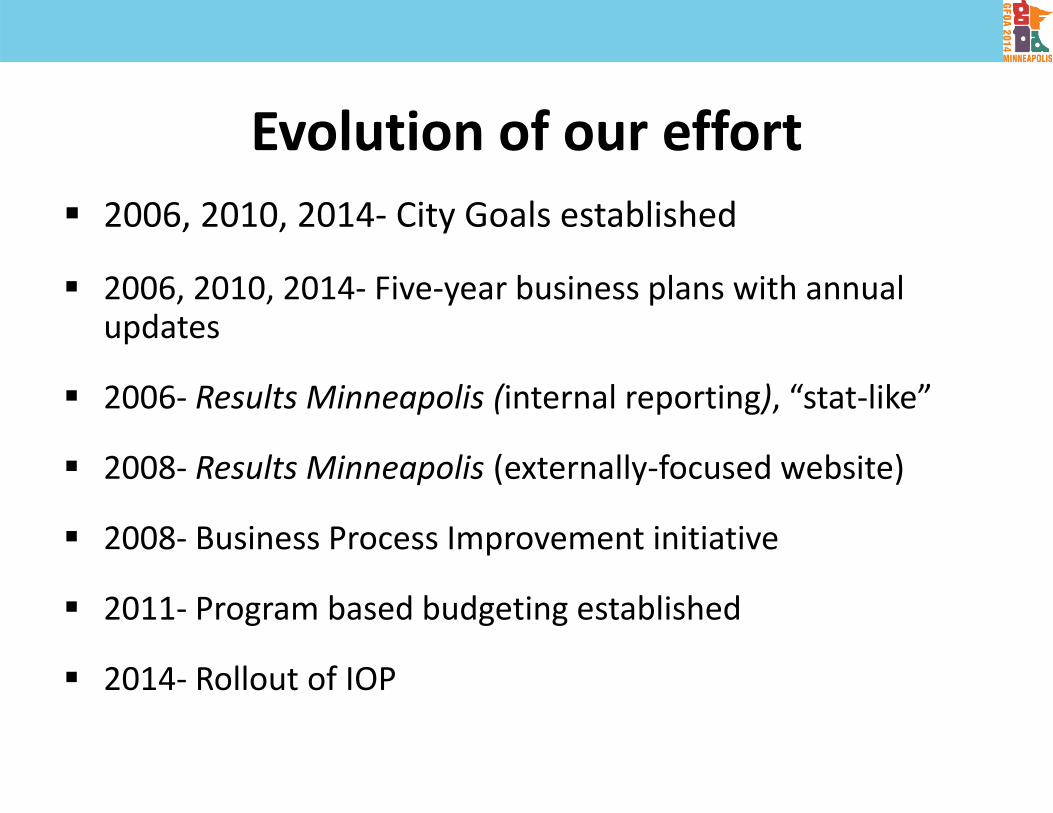
Evolution of our effort 2006, 2010, 2014‐ City Goals established
2006, 2010, 2014‐ Five‐year business plans with annual updates
2006‐ Results Minneapolis (internal reporting), “stat‐like”
2008‐ Results Minneapolis (externally‐focused website)
2008‐ Business Process Improvement initiative
2011‐ Program based budgeting established
2014‐ Rollout of IOP

Final observations Learn from others, but build a system that works for your circumstances
Leadership support and organizational champion(s) are essential
Growing interest in data from public and media Measuring is not enough, you must discuss the measures
Keep focus on results and accountability, but keep it constructive

Have a great stay in Minneapolis!
Jay StroebelDeputy City CoordinatorCity of Minneapolis
612‐673‐[email protected]
http://www.ci.minneapolis.mn.us/results/

Transforming Performance Measurement for the 21st
CenturyHarry Hatry
Urban Institute
May 19, 201452
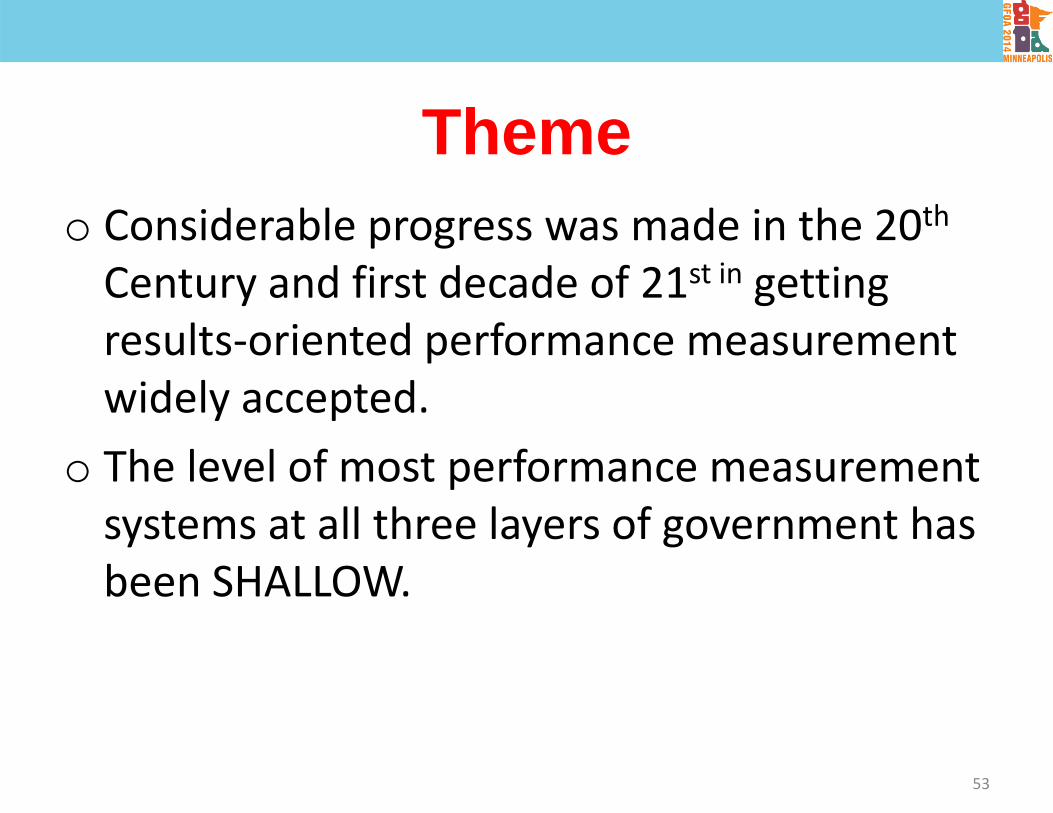
Themeo Considerable progress was made in the 20thCentury and first decade of 21st in getting results‐oriented performance measurement widely accepted.
o The level of most performance measurement systems at all three layers of government has been SHALLOW.
53
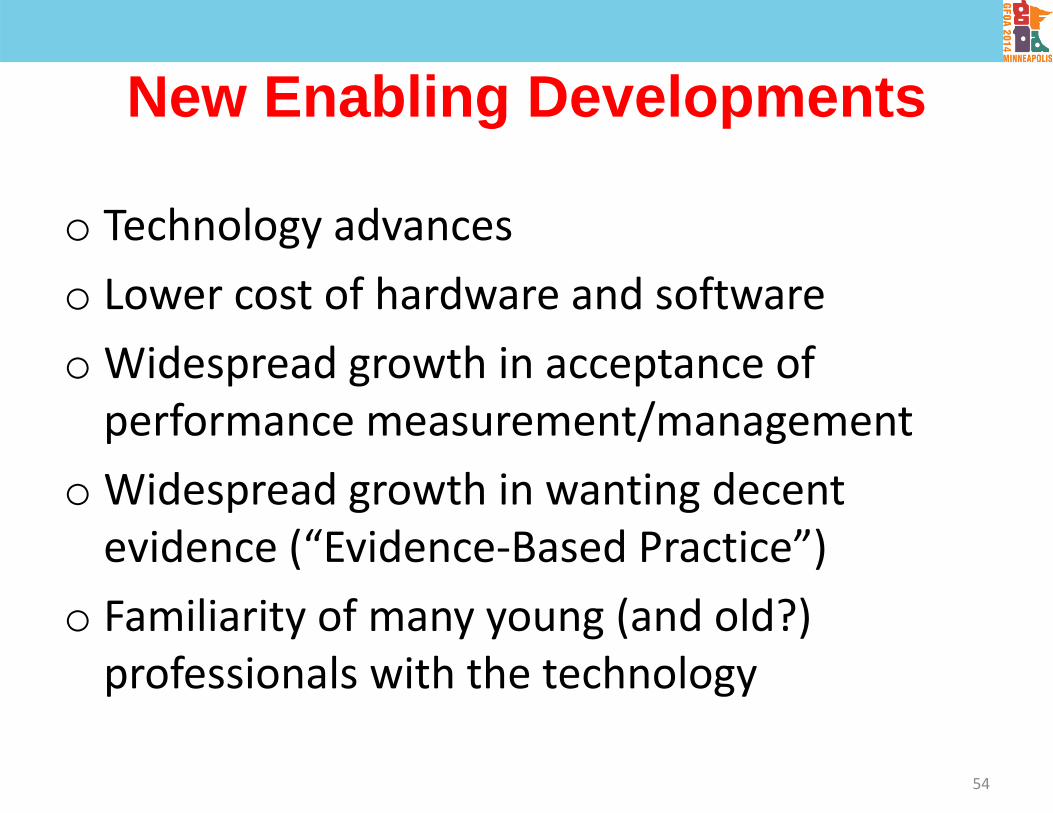
New Enabling Developments
o Technology advances o Lower cost of hardware and softwareo Widespread growth in acceptance of performance measurement/management
o Widespread growth in wanting decent evidence (“Evidence‐Based Practice”)
o Familiarity of many young (and old?) professionals with the technology
54

RecommendationsFor Strengthening PM Systems
o Determining what information will be useful and how to obtain it
o Analyzing that information
o Using the information
55

What Information and How to Obtain It—Part 1
1. Add more outcome indicators. These may require use of non‐traditional data collection procedures—such as outcome indicators that measure after‐service outcomes.
2. Include: outputs, intermediate outcomes, end outcomes, unit‐cost (preferably cost‐per‐unit of outcome). Distinguish which is which.
3. Disaggregate outcomes by customer and service characteristics.
56
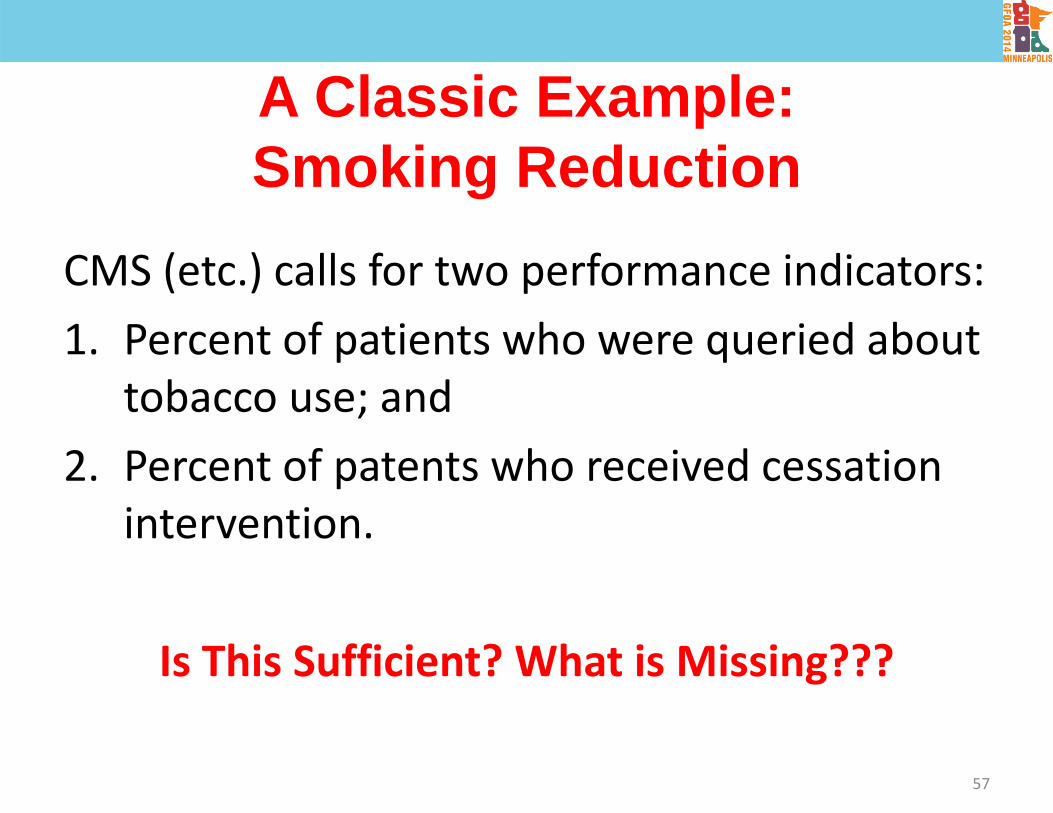
A Classic Example:Smoking Reduction
CMS (etc.) calls for two performance indicators:1. Percent of patients who were queried about
tobacco use; and2. Percent of patents who received cessation
intervention.
Is This Sufficient? What is Missing???
57

A Classic Example:Smoking Reduction
CMS calls for two performance indicators:1. Percent of patients who were queried about
tobacco use; and2. Percent of patents who received cessation
intervention.3. Percent of patients who report having
stopped smoking at a specific time after receiving the intervention
58

A Tool for Identifying Indicators
59

Examples of DisaggregationsCustomer characteristics: o Age, gender, and race/ethnicityo Location of residenceo Individuals or businesseso Difficulty/risk levelService characteristics:o Individual providers, such as districts, facilities, offices, contractors, teams, caseworkers
o Mode of service delivery, such as group vs. individual counseling
o Amount of service, e.g., number of sessions attended 60
61
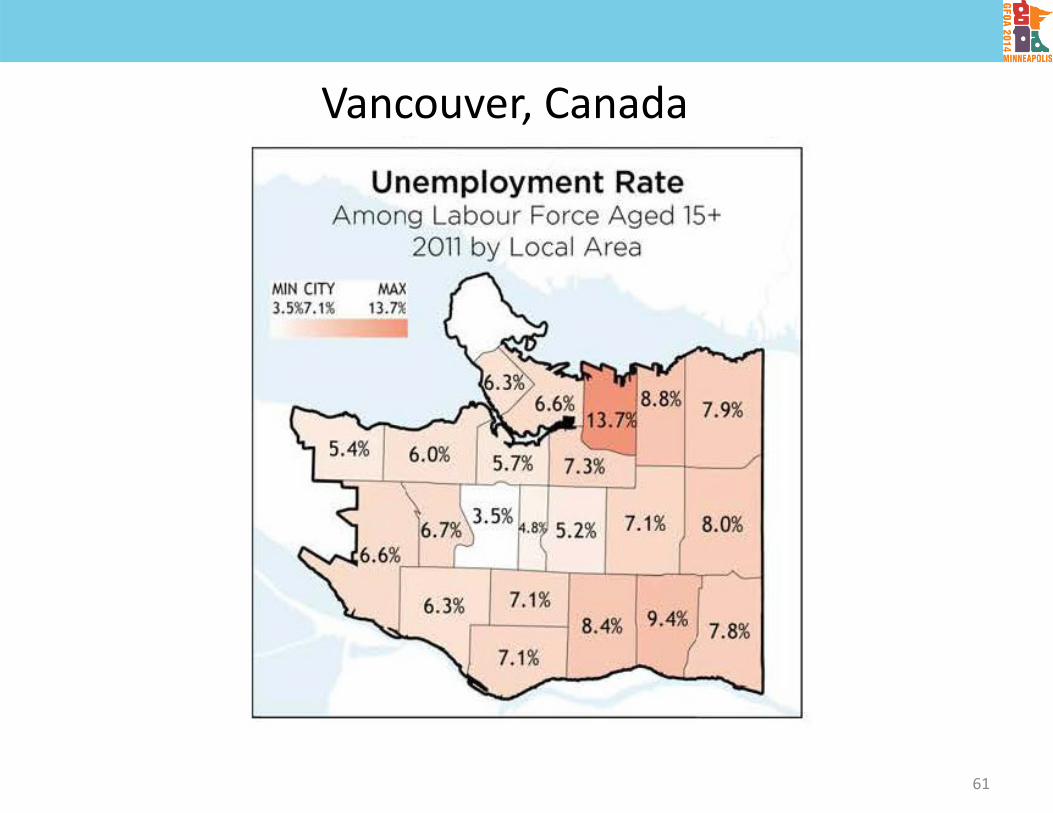
Vancouver, Canada

62
Sample Comparison of All Breakout CharacteristicsClients That Reported Improved Functioning after Completing Group Therapy
CharacteristicNumber ofClients
ConsiderableImprovement
(%)
SomeImprovement
(%)
LittleImprovement
(%)
NoImprovement
(%)
GenderFemaleMale
3143
1030
1940
5521
167
Age Group21–30 31–3940–4950–59
1328249
23212122
31322933
31363833
15111311
Race/EthnicityAfrican‐AmericanAsianHispanicWhite/Caucasian
2552024
3201521
20604029
32204038
1620513
Sessions Attended1–2 3–45+
132140
152423
83338
543330
231010
FacilityFacility AFacility B
4925
2416
2740
3536
148
CaseworkerTherapist ATherapist BTherapist CTherapist D
19181819
2611642
26391742
42335611
517225
All Clients 74 22 31 35 12
55 16
54 23
56 22
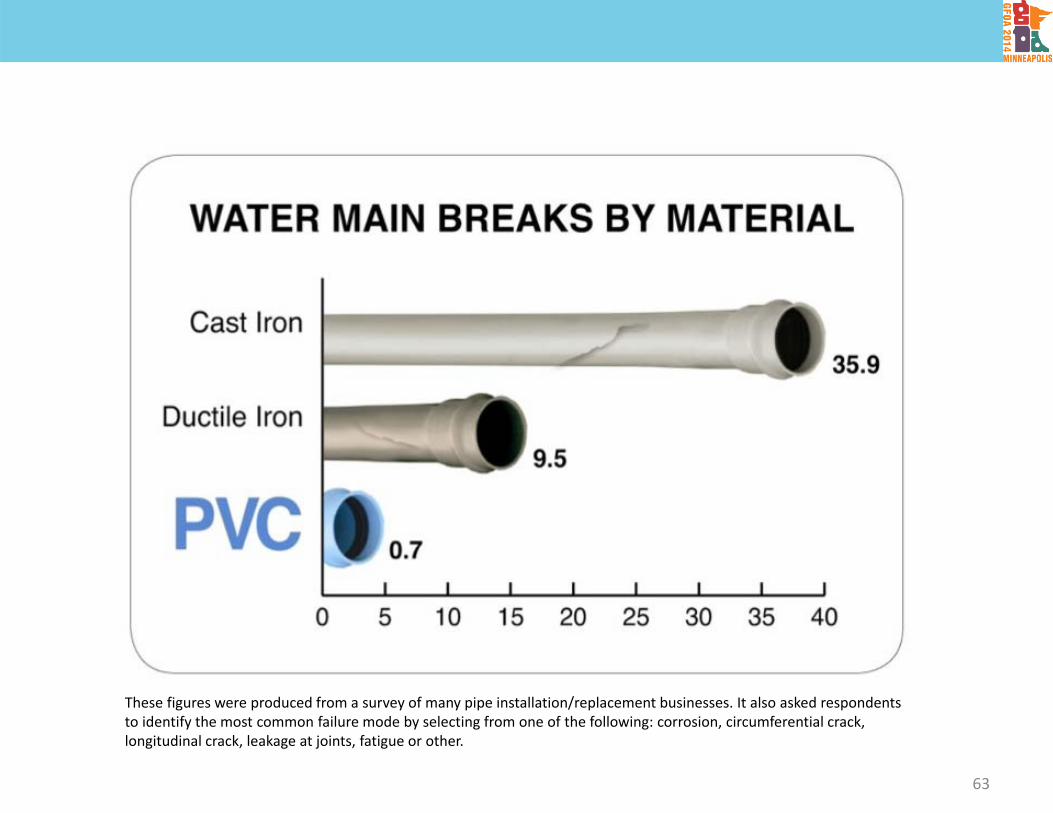
These figures were produced from a survey of many pipe installation/replacement businesses. It also asked respondents to identify the most common failure mode by selecting from one of the following: corrosion, circumferential crack, longitudinal crack, leakage at joints, fatigue or other.
63
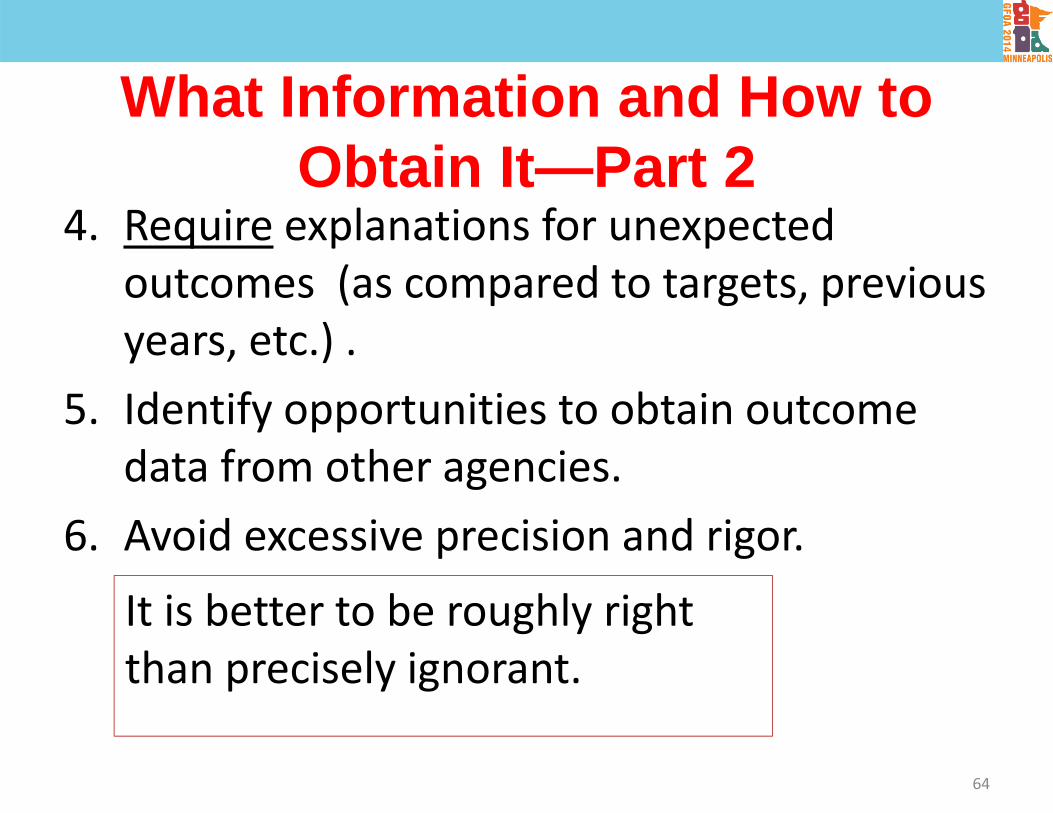
What Information and How to Obtain It—Part 2
4. Require explanations for unexpected outcomes (as compared to targets, previous years, etc.) .
5. Identify opportunities to obtain outcome data from other agencies.
6. Avoid excessive precision and rigor.
64
It is better to be roughly right than precisely ignorant.
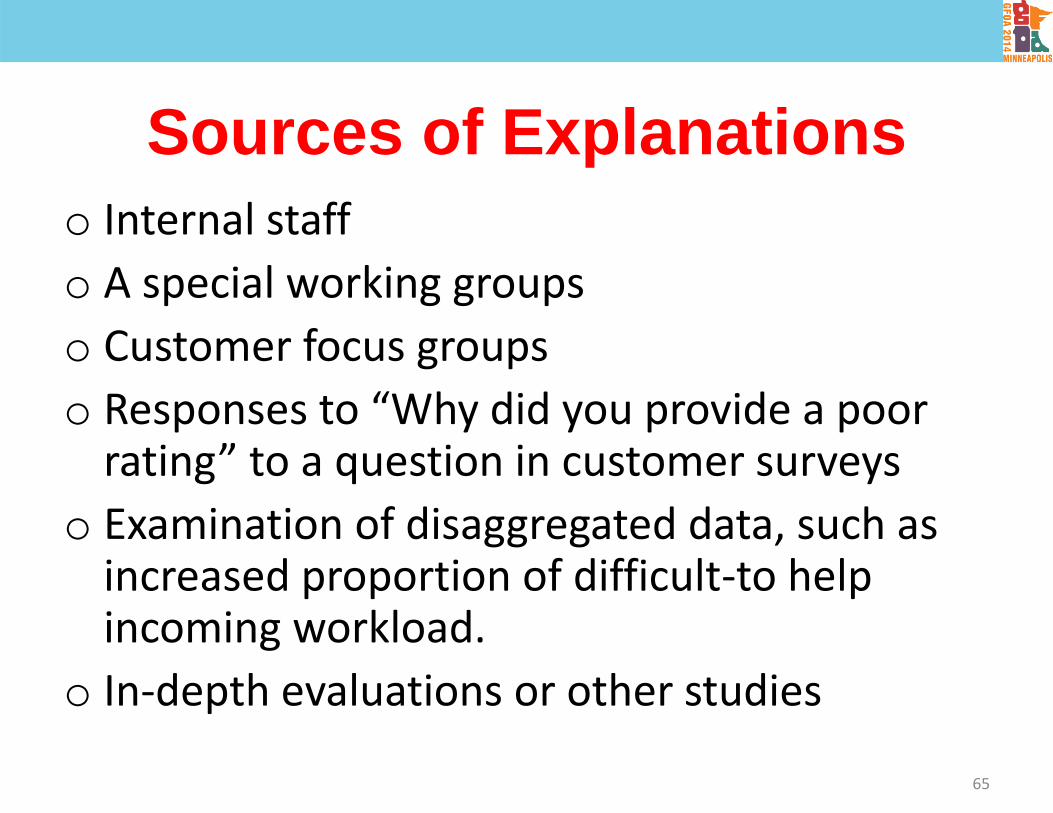
Sources of Explanationso Internal staffo A special working groupso Customer focus groupso Responses to “Why did you provide a poor rating” to a question in customer surveys
o Examination of disaggregated data, such as increased proportion of difficult‐to help incoming workload.
o In‐depth evaluations or other studies
65

Analyzing the Information 7. Assign someone to analyze, summarize, and
highlight the performance information for the manager.
8. Compare outcomes against: Targets Previous time periods (e.g., for time trends and seasonal effects) Customer characteristics/difficulty levels Service characteristics Outcomes of other comparable organizations
66
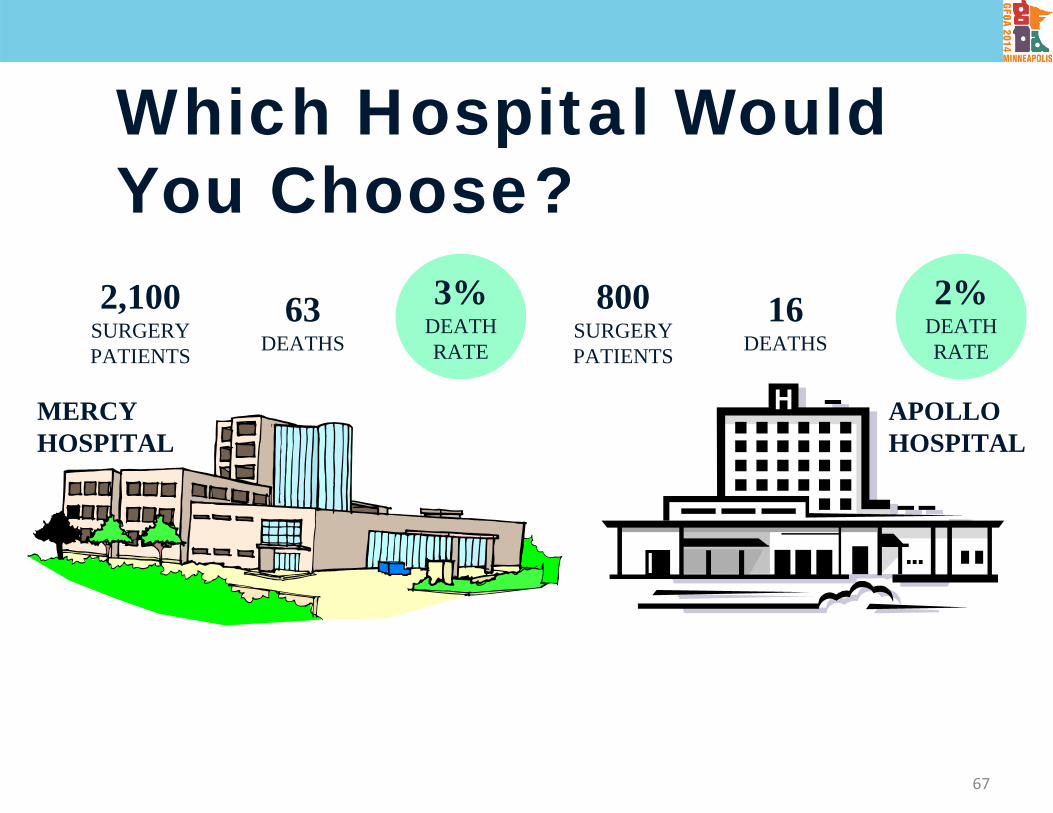
Which Hospital Would You Choose?
MERCY HOSPITAL
APOLLO HOSPITAL
2,100SURGERYPATIENTS
63DEATHS
3%DEATHRATE
800SURGERYPATIENTS
16DEATHS
2%DEATHRATE
67

68
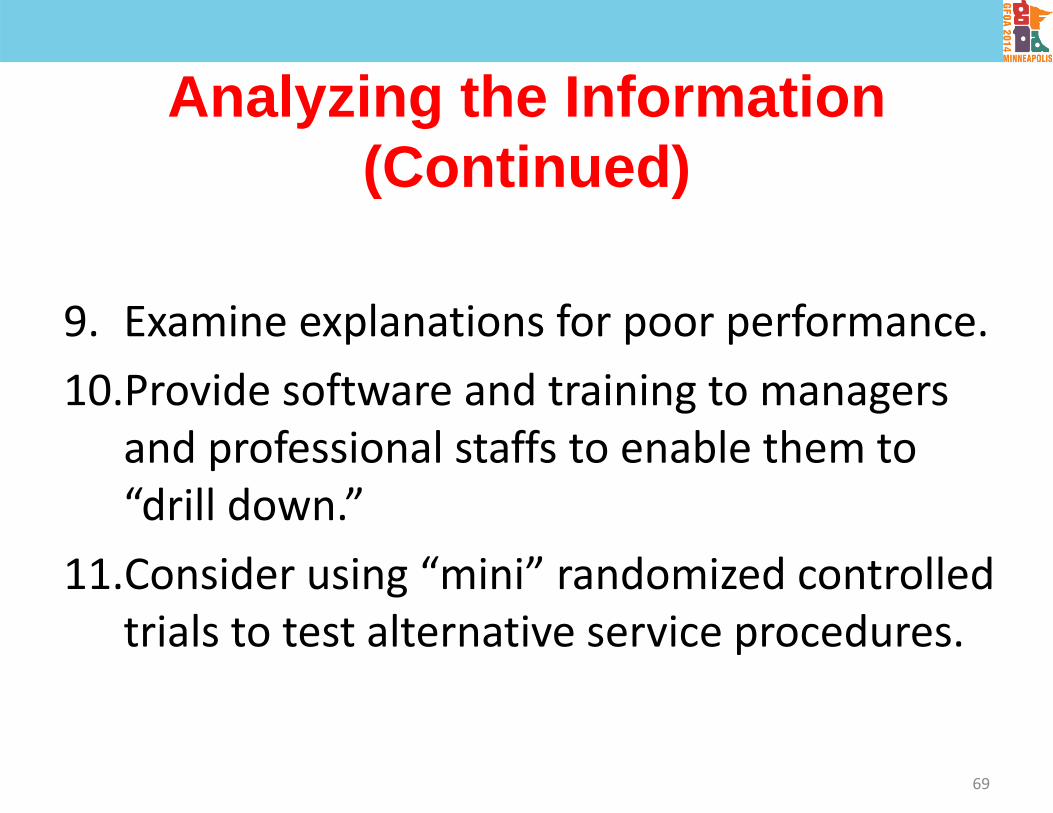
Analyzing the Information(Continued)
9. Examine explanations for poor performance. 10.Provide software and training to managers
and professional staffs to enable them to “drill down.”
11.Consider using “mini” randomized controlled trials to test alternative service procedures.
69

70
Exhibit 4Sample Two‐characteristic BreakoutPercent of Clients Employed Three Months after Completing Service
Education Level at Entry N Short Program Long Program
Total
Completed high school 100 62% employed(of 55 clients)
64% employed
(of 45 clients)
63%(of 100 clients)
Did not complete high school
180 26% employed(of 95 clients)
73% employed
(of 85 clients)
48%(of 180 clients)
Total 280 39%(of 150 clients)
70%(of 130 clients)
54%(of 280 clients)
Is action needed? Encourage clients who had not—rather than had—completed high school to attend the long program. Use these figures to help convince clients of the longer program’s success with helping clients secure employment.
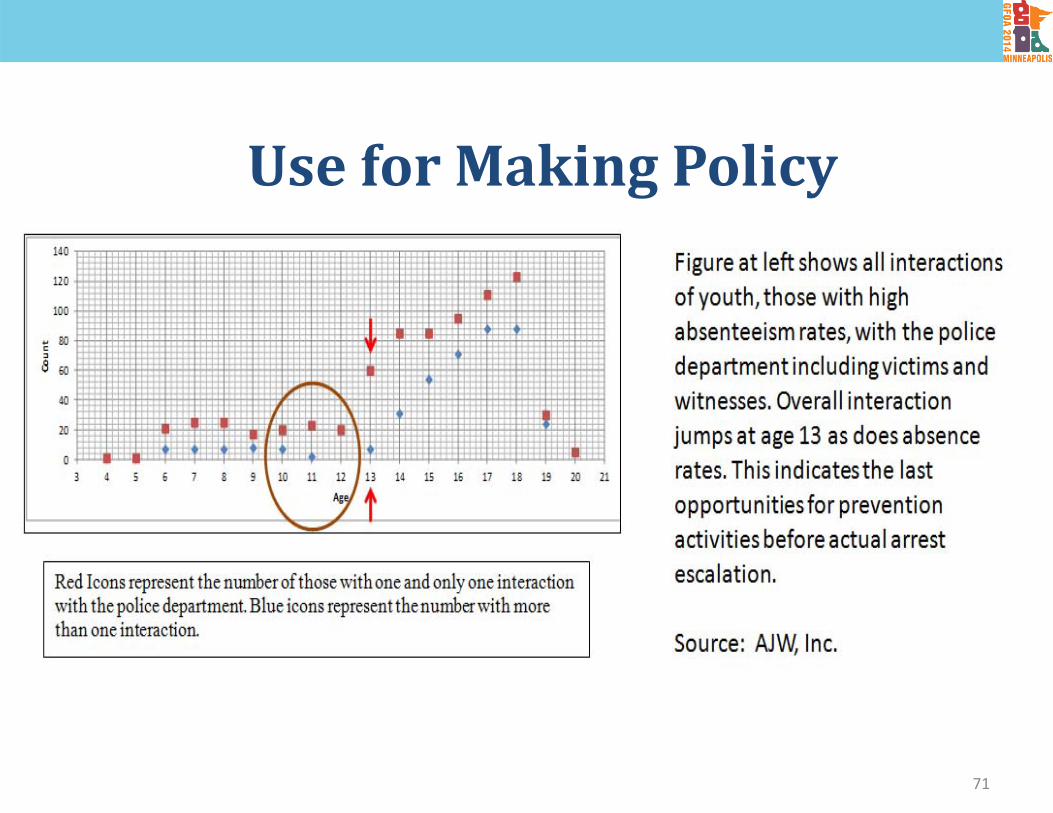
71
UseforMakingPolicy

Using Performance Information
12.Hold regular data‐driven performance reviewsand both high and at low management levels.
13.Enable managers to access performance data at any time.
14.Provide current performance data vs. targets to first line staff.
72

The power of senior‐led, data‐driven performance reviews
154149
143136
130
115
79
39
0
20
40
60
80
100
120
140
160
180
FY2006 FY2007 FY2008 FY2009 FY2010 FY2011 FY2012 FY 2013
Actual Probable
Treasury Department Agency Priority Goal and power of COO‐led Treasury Stat Reviews
Millions of P
aper Ben
efits
Issued
Actual Number of Paper Benefit Payments Issued
Delta = Savings of more than $100M annually from Treasury’s paperless imitative
Probable trajectory without intervention
Actual performance after becoming a priority goal
73

Implementation issueso Availability of user‐friendly softwareo Perceived cost of data collection from other than agency records, such as surveys of former customers
o Need for training for managers and staffs in: how to use the software; how to use the information from the software; & need for data accuracy
o Lack of interest by some officials and staffs74

For Further Information
Full report (Free) expected on Urban Institute website in about six weeks
website: http://www.urban.org
Harry HatryUrban Institute 202‐261‐5521
75

The Endo Questions?
76