the epidemiology of active tuberculosis disease … · the epidemiology of active tuberculosis...
TRANSCRIPT

Population Health Surveillance TeamPopulation and Public Health Program
PubliSHed OCTObeR 2012
The epidemiology of Active Tuberculosis Disease in the Winnipeg Health Region
2009 – 2011
FOREWARDWe are very pleased to present the first edition of the regional tuberculosis surveillance report. The aim of this edition is to provide decision-makers, clinicians and public health practitioners with information on the trends in active tuberculosis in the Winnipeg Health Region during the calendar years 2009 – 2011.
Monitoring and analyzing trends of tuberculosis and other infectious diseases across the Region is one of the core functions of the WRHA’s Population and Public Health Program. Timely, accurate and relevant surveillance information is essential for determining public health priorities, focusing prevention efforts and for improving the quality of programs and services aimed at reducing the incidence and impact of infectious diseases.
While tuberculosis remains a significant health problem in the Region, the numbers from the last three years suggest that things are getting better. However, there is still room for more improvement. Clearly, some groups in the Region are at greater risk of the disease than others. by documenting the disparities in the burden of tuberculosis in the Region, this report highlights the need for a sustained and coordinated effort to address the underlying social and economic causes of these disparities.
Tuberculosis is a complex disease; efforts to combat tuberculosis occur at different levels and involve many different stakeholders. Consequently, our Region’s approach to the ever-changing challenges of tuberculosis prevention and treatment has been evolving. in November 2010, the WRHA established an integrated Tuberculosis Services approach whereby multidisciplinary preventive, primary care, diagnostic, treatment and support services engage in a patient/client centered approach to provide care to all clients and their families and communities in a seamless coordinated fashion. This approach is further strengthened through ongoing collaboration with regional, provincial, and federal partners and stakeholders. These recent developments underscore the need for timely and relevant surveillance data to inform program planning and public health practice. This report is a first step towards meeting that need.
Sincerely,
Catherine Cook, Md, MSc, FCFPVice President, Population and Aboriginal Health
lori lamont, RN, bN, MPAVice President, interprofessional Practice and Chief Nursing Officer
The Epidemiology of Active Tuberculosis Disease in the
Winnipeg Health Region
Mandy Whitlock, MHScSouradet Shaw, MSc
debbie Nowicki, MScSalah Mahmud, Md, Phd, FRCPC
For the Population Health Surveillance Team
Population and Public Health ProgramWinnipeg Regional Health Authority
PubliSHed OCTObeR 2012
2009 – 2011
1 WRHA THe ePideMiOlOgy OF ACTiVe TubeRCulOSiS diSeASe iN THe WiNNiPeg HeAlTH RegiON
ACKNOWLEDGEMENTSThe production of this report would not have been possible without the contributions and cooperation of a great many people from different Winnipeg Regional Health Authority teams and programs, including the Tuberculosis Services team, information Systems team and leadership team of the Population and Public Health Program; and, integrated Tuberculosis Services.
The authors are grateful also to many other clinicians and public health practitioners internal and external to the Region for their thoughtful review of this report.
FOR FuRTHER INFORMATION
you can find this document at http://www.wrha.mb.ca/surveillance. For comments or inquiries concerning the material in this publication, contact [email protected].
Suggested citation:
The epidemiology of active tuberculosis disease in the Winnipeg Health Region,
2009-2011. Winnipeg Regional Health Authority, Population Health Surveillance Team,
Winnipeg, October 2012.
WRHA THe ePideMiOlOgy OF ACTiVe TubeRCulOSiS diSeASe iN THe WiNNiPeg HeAlTH RegiON 2
THE WINNIpEG HEALTH REGION (WHR)
Seven Oaks
River EastInkster
Transcona
St.Boniface
Point Douglas
River Heights
Downtown
St.Vital
St.James Assiniboia
Assiniboine South
Fort Garry
3 WRHA THe ePideMiOlOgy OF ACTiVe TubeRCulOSiS diSeASe iN THe WiNNiPeg HeAlTH RegiON
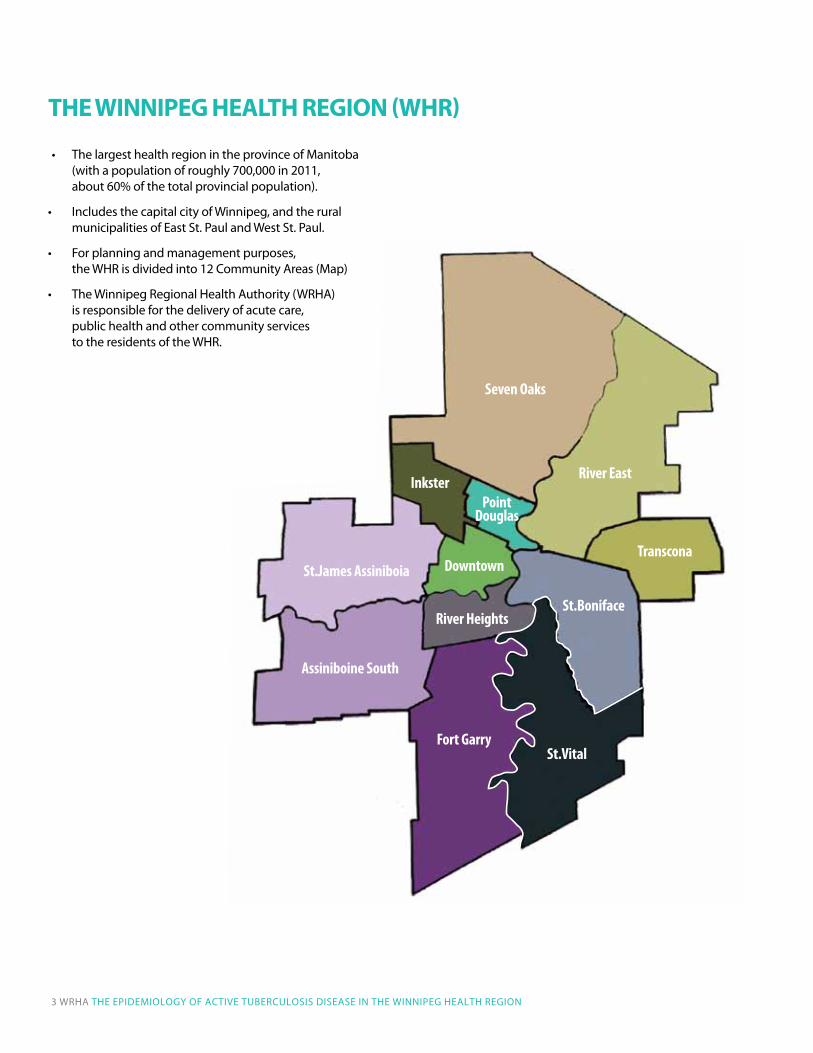
• ThelargesthealthregionintheprovinceofManitoba(with a population of roughly 700,000 in 2011, about 60% of the total provincial population).
• IncludesthecapitalcityofWinnipeg,andtheruralmunicipalities of east St. Paul and West St. Paul.
• Forplanningandmanagementpurposes, the WHR is divided into 12 Community Areas (Map)
• TheWinnipegRegionalHealthAuthority(WRHA) is responsible for the delivery of acute care, public health and other community services to the residents of the WHR.

eXeCuTiVe SuMMARy .......................................................................................................................5
iNTROduCTiON....................................................................................................................................6
MeTHOdS ...............................................................................................................................................6
data Sources and Case definitions .....................................................................................6
Statistical Methods ....................................................................................................................7
HigHligHTS ...........................................................................................................................................8
disease burden............................................................................................................................8
demographics Characteristics ........................................................................................... 10
Country of birth and ethnicity ........................................................................................... 11
Clinical Features ....................................................................................................................... 13
disease Risk Factors ................................................................................................................ 14
deaths among Tb Patients .................................................................................................. 15
iNTeRPReTATiON............................................................................................................................... 16
CONCluSiONS ................................................................................................................................... 17
ReFeReNCeS ....................................................................................................................................... 18
APPeNdiCeS ....................................................................................................................................... 19
Appendix A: Case definitions and Variable definitions ........................................... 19
Appendix b: Number of Pediatric Cases using WHR defintion ............................ 21
Table of Contents
WRHA THe ePideMiOlOgy OF ACTiVe TubeRCulOSiS diSeASe iN THe WiNNiPeg HeAlTH RegiON 4
Tuberculosis (Tb) is a significant public health problem worldwide, and remains an important cause of morbidity in the Winnipeg Health Region (WHR) and in Manitoba. This surveillance report presents a description of the distribution and determinants of active Tb disease in the WHR for calendar years 2009-2011. data used in this report were obtained from the electronic records of the Population and Public Health Program of the Winnipeg Regional Health Authority (WRHA).
As documented within, 220 cases of active Tb disease were reported among residents of the WHR; 90 cases in 2009, 73 cases in 2010, and 57 cases in 2011. The corresponding age-standardized rates (per 100,000) decreased from 13.0 in 2009 to 7.9 in 2011. This downward trend is encouraging, but because the number of Tb cases fluctuates substantially from year-to-year, it is not clear whether this heralds a long-term decline in disease incidence. The regional rates were similar to provincial rates, but much higher than the national rate (about 4.6 per 100,000 in 2010).
However, disease burden is not distributed equally within the region. Whereas the more affluent suburban areas of the WHR had rates that were very similar to the national rate, the inner core areas (Point douglas and downtown Community Areas [CAs]) had nearly 7 to10 times higher rates ranging from 24.6 per 100,000 in 2011 to 43.7 per 100,000 in 2009. The age-standardized Tb rates in the northern WHR (inkster and Seven Oaks CAs) were roughly three to four times the rates observed for the suburban areas.
in the WHR, Tb is primarily a disease of specific ethnic groups. Aboriginal people, who constitute about 10% of the WHR population, made up 31% of the total number of Tb patients reported between 2009-2011, and about three-quarters of Canadian-born patients reported in these years. Foreign-born individuals, who represent less than 20% of the WHR population in 2006, made up about 58% of all patients. The significant disparities in the burden of Tb documented in this report add to the growing concerns about the problem of socially-determined health inequities.
generally, the epidemiology and clinical features of Tb patients in the WHR were consistent with those observed elsewhere in Canada. Males were more likely to be affected than females, although females were more likely to be diagnosed at a younger age (37 years) than males (46 years). Overall, the Tb rates were highest in the 25-44 age group, and lowest among children under 15 years of age.
About one-fourth of patients in the WHR had non-respiratory Tb. For unclear reasons, non-respiratory Tb was more often diagnosed among foreign-born individuals than Canadian-born individuals while the reverse was true for respiratory Tb. Patients with non-respiratory Tb are less likely to spread the disease to others. However, there is often a delay in diagnosis and initiation of treatment of these patients. The percentage of patients with respiratory Tb who had a positive acid-fast bacillus (AFb) smear (41%) was comparable to that observed elsewhere in Canada. Of all patients, 17 (8%) individuals were known to be HiV-positive. The number of Tb patients who were not offered HiV testing as part of their case investigation decreased from 23 (26%) in 2009 to 1 (2%) in 2011.
demographic trends, such as increasing migration from endemic countries and a growing urban Aboriginal population, and persistent patterns of socio-economic disadvantage may have slowed progress in reducing Tb rates in the region. established strategies, such as early detection and treatment of Tb patients and public health case management, are key to Tb control. in addition, disease surveillance activities should be enhanced with epidemiological investigations aimed at understanding the characteristics and determinants of Tb transmission and progression to active disease in each high-risk population or neighborhood. The accessibility, acceptability and effectiveness of disease control activities should be continuously monitored. in addition to individual level interventions, complementary interventions aimed at addressing the socio-economic determinants of the disparities in the burden of Tb and other diseases are needed.
ExECuTIvE SuMMARy
5 WRHA THe ePideMiOlOgy OF ACTiVe TubeRCulOSiS diSeASe iN THe WiNNiPeg HeAlTH RegiON
Tuberculosis (Tb), an infectious disease caused by the bacillus Mycobacterium tuberculosis (MTb), is a significant public health problem worldwide, and remains an important cause of morbidity even in developed countries such as Canada.1
After decades of decline, incidence rates of active Tb disease have stabilized or even slightly increased in some Canadian jurisdictions.2 Changes in immigration profiles, persistent patterns of socio-economic disadvantage, the HiV/AidS epidemic, and the emergence of multi-drug resistant MTb are likely contributors to these trends. These issues will likely continue to pose significant challenges to Tb control efforts. extensive public health resources are required to prevent and manage Tb. in 2004, Tb-related expenditures in Canada were estimated at about $74 million ($47,300 per patient).3
Tb is typically transmitted from person to person via inhalation of the MTb bacilli. left untreated, 5-10% of individuals infected with MTb will progress to active Tb disease at some point in their lifetime. Although most commonly affecting the lungs, Tb disease can occur anywhere in the body, and concurrent respiratory and non-respiratory forms of the disease are possible. individuals who have non-respiratory Tb disease are generally not infectious to others.
Key Tb control measures include early detection and directly observed treatment of patients with active Tb; investigation of close contacts; targeted screening; preventive therapy for patients with latent Tb infection; health education; and interventions targeted at reducing health disparities.4 before September 2005, most Tb control activities in Manitoba were the responsibility of centralized (provincial) public health programs. September 2005 marked the beginning of regionalization of Tb services, with the management of Winnipeg-based Tb patients and contacts transferred to the WRHA. Further transition followed, first in November 2008, when the WRHA began providing consultation services for all Tb patients and contacts of individuals living on reserve in First Nations communities. The transition was completed in April 2011, with the transfer of all remaining Tb patient management services from the province to Regional Health Authorities, with the WRHA providing consultative services.
Continuous monitoring and reporting of Tb trends is essential for assessing disease burden, understanding its determinants, and for evaluating the effectiveness of Tb control programs. The objectives of this report are to describe the epidemiology of active Tb disease among residents of the WHR during calendar years 2009, 2010 and 2011, the years for which complete data are available.
Data SourceS anD caSe DefinitionS
in Manitoba, Tb is a notifiable disease under The Public Health Act.5 Reporting requirements and guidelines for patient management and contact investigation are outlined in the provincial Tuberculosis Protocol.4 laboratory and clinical case reports are submitted by laboratories and health care providers to Manitoba Health; and subsequently referred to Regional Health Authorities for follow-up. upon receipt of a referral, and for the duration of treatment, regional public health nurses collect standardized patient and contact information through client interviews, and by reviewing hospital and laboratory records and other relevant sources of information (e.g., the Manitoba Tuberculosis Registry). information collected on each patient includes socio-demographic information, such as ethnicity, country of birth and address of residence, as well as clinical information, such as results of radiological and microbial testing, infection and disease risk factors and disease site coded using the international Statistical Classification of diseases (iCd-10). data are entered into and maintained in the region’s Public Health information System (iPHiS) – a Web-based application that facilitates recording and tracking of information on patients with notifiable communicable diseases.
All clinical and confirmed cases of active Tb disease reported among WHR residents between January 1, 2009 and december 31, 2011 (N=220) were included in this analysis. Consistent with national case definitions, a confirmed case of active Tb was defined as an individual with MTb complex infection demonstrated on culture (see Appendix A for details). A clinical case was defined as an individual with evidence of active Tb disease but with no culture proof of MTb complex. Cases were considered to have occurred in the calendar year when the earliest evidence of Tb disease was detected (Appendix A). using the iCd-coded final diagnosis field in iPHiS, cases were classified as having respiratory (A15.* and A16.*) or non-respiratory (A17.*, A18.*, A19.*) disease. Patients with concurrent respiratory and non-respiratory Tb were classified as respiratory cases for the purpose of calculating overall incidence rates. in addition, analyses were performed to provide information on patients with concurrent respiratory and non-respiratory involvement separately from patients with either respiratory or non-respiratory infections.
INTRODuCTION METHODS
WRHA THe ePideMiOlOgy OF ACTiVe TubeRCulOSiS diSeASe iN THe WiNNiPeg HeAlTH RegiON 6
ethnicity was determined as per individual self-report. For the purpose of this report, Aboriginal is a collective term used to describe First Nations (Status and non-Status), Métis, and inuit peoples. Patients that were born outside of Canada (“foreign-born”) were grouped according to place of birth into one of the six standard WHO regions.6 Patients were assigned to Community Areas (CAs) using their postal code of residence at the time of diagnosis and the 2010 Manitoba postal code conversion file. A patient’s HiV status was defined at the time of diagnosis; a positive status refers to a positive HiV antibody test or other confirmatory laboratory test (e.g., viral load) at the time of Tb diagnosis. Appendix A includes further details on these variable definitions.
StatiStical MethoDS
Annual crude rates of active Tb disease (both laboratory-confirmed and clinical cases) were calculated using the corresponding year’s mid-point WHR population as the denominator. Population data were derived from the Manitoba Health insurance Registry and provided (in electronic format) by Manitoba Health in July 2011. Population counts for 2011 were not available at the time of analysis. Therefore, projected population counts were used for all rate calculations involving Tb patients diagnosed during calendar year 2011. For each neighbourhood cluster, and for every one-year age band, Poisson regression models were used to project 2011 population counts, based on population counts from 2006 to 2010 for each specific neighbourhood cluster and age band combination. Separate counts were projected for males and females.
Rates were age-standardized to the WHR population in 2000, and the associated 95% confidence intervals (95% Cis) were calculated assuming a Poisson distribution. The purpose of reporting 95% Cis is to provide a measure of the reliability of the estimated rates; the narrower the confidence interval, the more precise the rate estimate is likely to be. The incidence rate for each of the region’s twelve CAs was age-standardized using the total WHR population as the standard population, and the resulting rates were mapped using Arc-giS desktop Version 9.1 (eSRi 2011. Redlands, CA: environmental Systems Research institute).
7 WRHA THe ePideMiOlOgy OF ACTiVe TubeRCulOSiS diSeASe iN THe WiNNiPeg HeAlTH RegiON
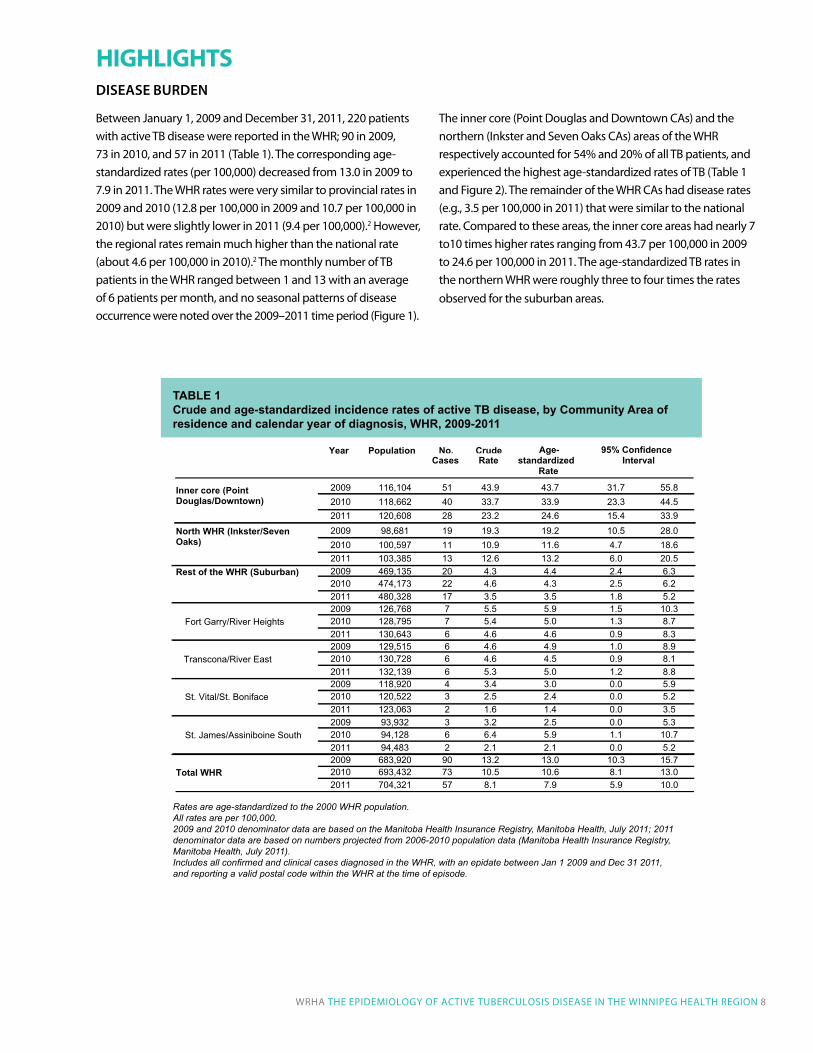
Rates are age-standardized to the 2000 WHR population.All rates are per 100,000. 2009 and 2010 denominator data are based on the Manitoba Health Insurance Registry, Manitoba Health, July 2011; 2011 denominator data are based on numbers projected from 2006-2010 population data (Manitoba Health Insurance Registry, Manitoba Health, July 2011). Includes all confirmed and clinical cases diagnosed in the WHR, with an epidate between Jan 1 2009 and Dec 31 2011, and reporting a valid postal code within the WHR at the time of episode.
Table 1 Crude and age-standardized incidence rates of active Tb disease, by Community area of residence and calendar year of diagnosis, WHR, 2009-2011
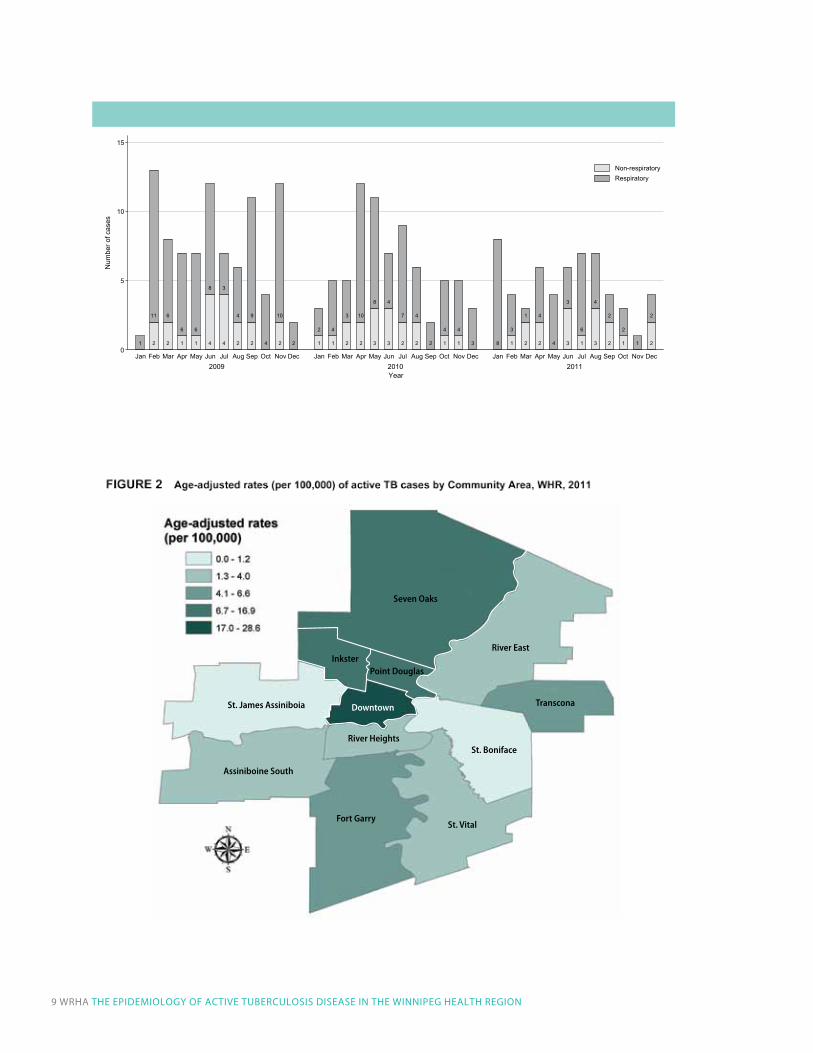
between January 1, 2009 and december 31, 2011, 220 patients with active Tb disease were reported in the WHR; 90 in 2009, 73 in 2010, and 57 in 2011 (Table 1). The corresponding age-standardized rates (per 100,000) decreased from 13.0 in 2009 to 7.9 in 2011. The WHR rates were very similar to provincial rates in 2009 and 2010 (12.8 per 100,000 in 2009 and 10.7 per 100,000 in 2010) but were slightly lower in 2011 (9.4 per 100,000).2 However, the regional rates remain much higher than the national rate (about 4.6 per 100,000 in 2010).2 The monthly number of Tb patients in the WHR ranged between 1 and 13 with an average of 6 patients per month, and no seasonal patterns of disease occurrence were noted over the 2009–2011 time period (Figure 1).
The inner core (Point douglas and downtown CAs) and the northern (inkster and Seven Oaks CAs) areas of the WHR respectively accounted for 54% and 20% of all Tb patients, and experienced the highest age-standardized rates of Tb (Table 1 and Figure 2). The remainder of the WHR CAs had disease rates (e.g., 3.5 per 100,000 in 2011) that were similar to the national rate. Compared to these areas, the inner core areas had nearly 7 to10 times higher rates ranging from 43.7 per 100,000 in 2009 to 24.6 per 100,000 in 2011. The age-standardized Tb rates in the northern WHR were roughly three to four times the rates observed for the suburban areas.
HIGHLIGHTS
WRHA THe ePideMiOlOgy OF ACTiVe TubeRCulOSiS diSeASe iN THe WiNNiPeg HeAlTH RegiON 8
Year Population No.Cases
CrudeRate
Age-standardized
Rate
95% Confidence Interval
2009 116,104 51 43.9 43.7 31.7 55.82010 118,662 40 33.7 33.9 23.3 44.5
Inner core (Point Douglas/Downtown)
2011 120,608 28 23.2 24.6 15.4 33.92009 98,681 19 19.3 19.2 10.5 28.02010 100,597 11 10.9 11.6 4.7 18.6
North WHR (Inkster/Seven Oaks)
2011 103,385 13 12.6 13.2 6.0 20.52009 469,135 20 4.3 4.4 2.4 6.32010 474,173 22 4.6 4.3 2.5 6.2
Rest of the WHR (Suburban)
2011 480,328 17 3.5 3.5 1.8 5.22009 126,768 7 5.5 5.9 1.5 10.32010 128,795 7 5.4 5.0 1.3 8.7Fort Garry/River Heights 2011 130,643 6 4.6 4.6 0.9 8.32009 129,515 6 4.6 4.9 1.0 8.92010 130,728 6 4.6 4.5 0.9 8.1 Transcona/River East 2011 132,139 6 5.3 5.0 1.2 8.82009 118,920 4 3.4 3.0 0.0 5.92010 120,522 3 2.5 2.4 0.0 5.2St. Vital/St. Boniface 2011 123,063 2 1.6 1.4 0.0 3.52009 93,932 3 3.2 2.5 0.0 5.32010 94,128 6 6.4 5.9 1.1 10.7St. James/Assiniboine South 2011 94,483 2 2.1 2.1 0.0 5.22009 683,920 90 13.2 13.0 10.3 15.72010 693,432 73 10.5 10.6 8.1 13.0Total WHR 2011 704,321 57 8.1 7.9 5.9 10.0
DiSeaSe BurDen
17
FIGURE 1 Epidemic curve of active TB cases by disease site, WHR, 2009-2011
1 2
11
2
6
1
6
1
6
4
8
4
3
2
4
2
9
4 2
10
2 1
2
1
4
2
3
2
10
3
8
3
4
2
7
2
4
2 1
4
1
4
3 8 1
3
2
1
2
4
4 3
3
1
6
3
4
2
2
1
2
1 2
2
0
5
10
15
Num
ber o
f cas
es
110201029002Jan Feb Mar Apr May Jun Jul Aug Sep Oct Nov Dec Jan Feb Mar Apr May Jun Jul Aug Sep Oct Nov Dec Jan Feb Mar Apr May Jun Jul Aug Sep Oct Nov Dec
Year
Non-respiratoryRespiratory
River East
St. Boniface
St. Vital
Seven Oaks
Point DouglasInkster
St. James Assiniboia
Assiniboine South
River Heights
Fort Garry
Downtown Transcona
9 WRHA THe ePideMiOlOgy OF ACTiVe TubeRCulOSiS diSeASe iN THe WiNNiPeg HeAlTH RegiON
3
TABLE 3Crude and age-standardized incidence rates of active TB disease, by sex and calendar year of diagnosis, WHR, 2009-2011
Year Population No.Cases
CrudeRate
Age-standardized
Rate95% Confidence
Interval
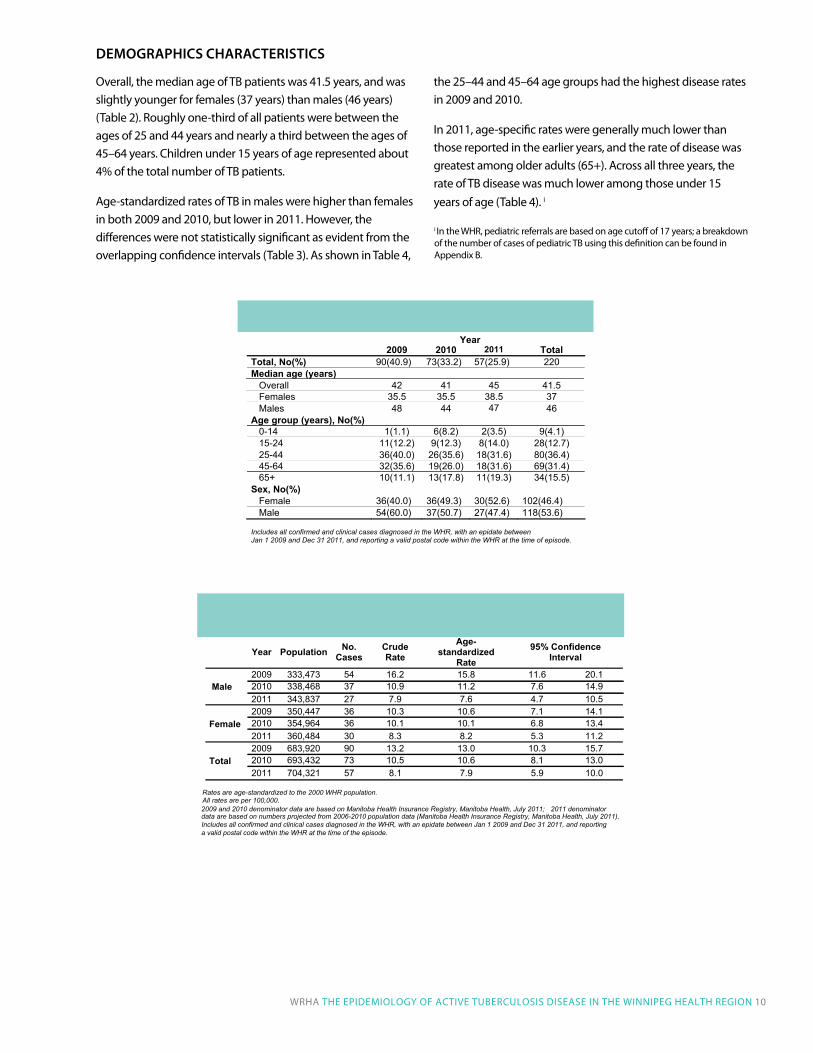
2009 333,473 54 16.2 15.8 11.6 20.12010 338,468 37 10.9 11.2 7.6 14.9 Male 2011 343,837 27 7.9 7.6 4.7 10.52009 350,447 36 10.3 10.6 7.1 14.12010 354,964 36 10.1 10.1 6.8 13.4Female2011 360,484 30 8.3 8.2 5.3 11.22009 683,920 90 13.2 13.0 10.3 15.72010 693,432 73 10.5 10.6 8.1 13.0Total2011 704,321 57 8.1 7.9 5.9 10.0
Rates are age-standardized to the 2000 WHR population. All rates are per 100,000.
2011 denominator population data (Manitoba Health Insurance Registry, Manitoba Health, July 2011).
Includes all confirmed and clinical cases diagnosed in the WHR, with an epidate between Jan 1 2009 and Dec 31 2011, and reporting a valid postal code within the WHR at the time of the episode.
2009 and 2010 denominator data are based on Manitoba Health Insurance Registry, Manitoba Health, July 2011; data are based on numbers projected from 2006-2010
Overall, the median age of Tb patients was 41.5 years, and was slightly younger for females (37 years) than males (46 years) (Table 2). Roughly one-third of all patients were between the ages of 25 and 44 years and nearly a third between the ages of 45–64 years. Children under 15 years of age represented about 4% of the total number of Tb patients.
Age-standardized rates of Tb in males were higher than females in both 2009 and 2010, but lower in 2011. However, the differences were not statistically significant as evident from the overlapping confidence intervals (Table 3). As shown in Table 4,
the 25–44 and 45–64 age groups had the highest disease rates in 2009 and 2010.
in 2011, age-specific rates were generally much lower than those reported in the earlier years, and the rate of disease was greatest among older adults (65+). Across all three years, the rate of Tb disease was much lower among those under 15 years of age (Table 4). i
WRHA THe ePideMiOlOgy OF ACTiVe TubeRCulOSiS diSeASe iN THe WiNNiPeg HeAlTH RegiON 10
2
TABLE 2Socio-demographic characteristics of active TB cases, WHR, 2009-2011
2009 2010 2011 TotalTotal, No(%) 90(40.9) 73(33.2) 57(25.9) 220Median age (years) Overall 42 41 45 41.5 Females 35.5 35.5 38.5 37 Males 48 44 47 46Age group (years), No(%) 0-14 1(1.1) 6(8.2) 2(3.5) 9(4.1) 15-24 11(12.2) 9(12.3) 8(14.0) 28(12.7) 25-44 36(40.0) 26(35.6) 18(31.6) 80(36.4) 45-64 32(35.6) 19(26.0) 18(31.6) 69(31.4) 65+ 10(11.1) 13(17.8) 11(19.3) 34(15.5)Sex, No(%) Female 36(40.0) 36(49.3) 30(52.6) 102(46.4) Male 54(60.0) 37(50.7) 27(47.4) 118(53.6)
Includes all confirmed and clinical cases diagnosed in the WHR, with an epidate between Jan 1 2009 and Dec 31 2011, and reporting a valid postal code within the WHR at the time of episode.
Year
i in the WHR, pediatric referrals are based on age cutoff of 17 years; a breakdown of the number of cases of pediatric Tb using this definition can be found in Appendix b.
DeMographicS characteriSticS

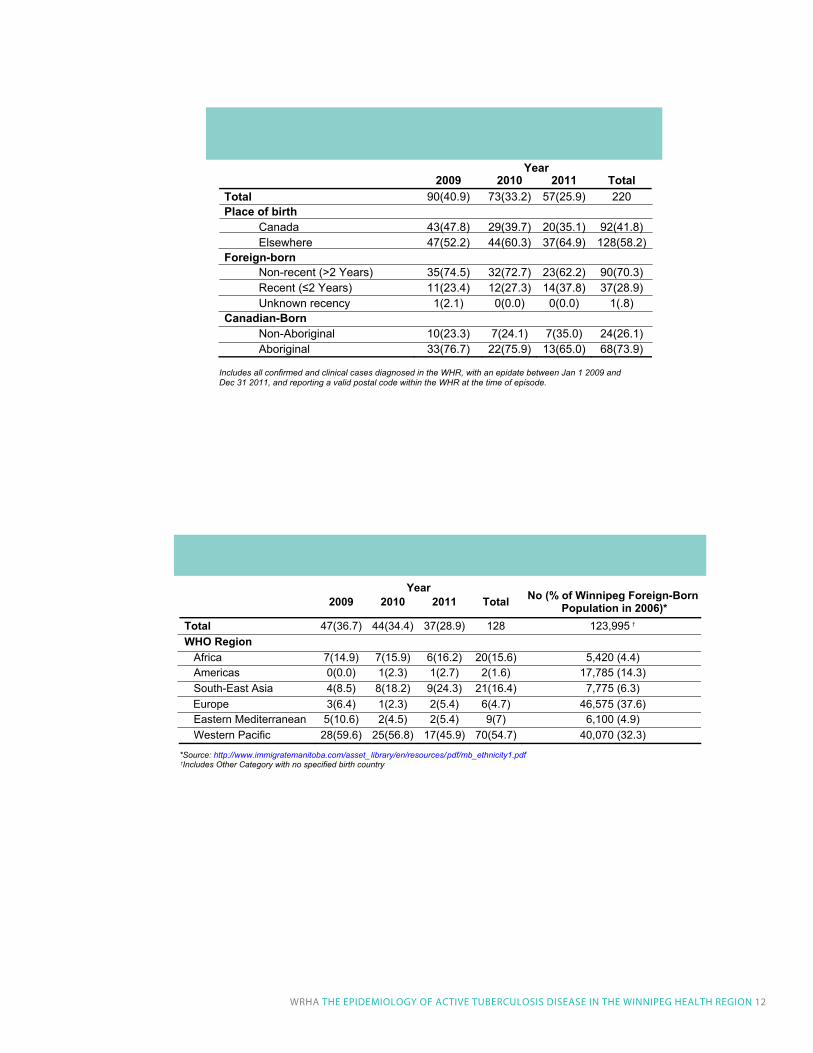
like elsewhere in Canada, Tb disproportionately affects two groups in the WHR: Aboriginal peoples and foreign-born individuals from Tb endemic countries. About 42% of Tb patients were Canadian-born with Aboriginal peoples making up the majority of these patients (Table 5). Aboriginal peoples, who constitute approximately 10% of the WHR population,7 made up 37% and 30% of the total number of patients in 2009 and 2010, respectively, and about three-quarters of Canadian-born patients in both years. However, they only represented 23% of patients reported in 2011. The figures in Table 5 suggest that much of the difference in the total number of patients reported in 2009 and 2011 can be attributed to a larger number of Aboriginal patients diagnosed in 2009 (33 compared to 13 in 2011). This could be due to a number of localized outbreaks that affected several First Nations reserves in northern Manitoba in 2009, and were possibly linked to First Nations communities in the WHR.
Foreign-born individuals, who represented less than 20% of the 2006 WHR population,8 made up about 58% of Tb patients (Table 5). Nearly three-quarters of the foreign-born patients were individuals who had resided in Canada for more than two years, reflecting the much larger number of these individuals compared to more recent immigrants. Overall, 55% of foreign-born patients were born in a Western Pacific country (e.g., China, Korea, Philippines, Vietnam), 16% were born in an African country, and 16% were born in a South-east Asian country8 (Table 6). For comparison, the 2006 breakdown of foreign-born residents in the WHR was as follows: 32% of foreign-born were born in a Western Pacific country, 4% were born in an African country, and 6% were born in a South-east Asian country. unfortunately, it was not possible to calculate incidence rates of Tb according to ethnicity, or region or country of birth because reliable up-to-date information on denominator counts (total number of Aboriginal people or immigrants residing in the WHR by country of birth) was not available.
TABLE 4Age-specific incidence rates of active TB disease by year, WHR, 2009-2011
Age Group No.Cases Population Incidence
Rate0-14 1 117,899 0.815-24 11 94,378 11.725-44 36 190,121 18.945-64 32 186,465 17.2
2009
65+ 10 95,057 10.50-14 6 118,829 5.015-24 9 96,120 9.425-44 26 191,710 13.645-64 19 190,249 10.0
2010
65+ 13 96,524 13.50-14 2 119,691 1.715-24 8 97,635 8.225-44 18 191,949 9.445-64 18 195,727 9.2
2011
65+ 11 99,319 11.1
All rates are per 100,000. 2009 and 2010 denominator data are based on the Manitoba Health Insurance Registry, Manitoba Health,
ator data are based on numbers projected from 2006-2010 population data (Manitoba HealthInsurance Registry, Manitoba Health, July 2011). Includes all confirmed and clinical cases diagnosed in the WHR, with an epidate between Jan 1 2009
and Dec 31 2011, and reporting a valid postal code within the WHR at the time of episode.
July 2011; 2011 denomin
11 WRHA THe ePideMiOlOgy OF ACTiVe TubeRCulOSiS diSeASe iN THe WiNNiPeg HeAlTH RegiON
country of Birth anD ethnicity
6
TABLE 5Number (%) of cases of active TB disease by place of birth and Aboriginal status, WHR, 2009-2011
Year2009 2010 2011 Total
Total 90(40.9) 73(33.2) 57(25.9) 220 Place of birth Canada 43(47.8) 29(39.7) 20(35.1) 92(41.8) Elsewhere 47(52.2) 44(60.3) 37(64.9) 128(58.2) Foreign-born Non-recent (>2 Years) 35(74.5) 32(72.7) 23(62.2) 90(70.3) Recent (≤2 Years) 11(23.4) 12(27.3) 14(37.8) 37(28.9) Unknown recency 1(2.1) 0(0.0) 0(0.0) 1(.8) Canadian-Born Non-Aboriginal 10(23.3) 7(24.1) 7(35.0) 24(26.1) Aboriginal 33(76.7) 22(75.9) 13(65.0) 68(73.9)
Includes all confirmed and clinical cases diagnosed in the WHR, with an epidate between Jan 1 2009 and Dec 31 2011, and reporting a valid postal code within the WHR at the time of episode.
8
TABLE 6 Number (%) of foreign-born active TB cases by year and region of birth, WHR, 2009-2011
2009 2010 2011 Total No (% of Winnipeg Foreign-Born Population in 2006)*
Total 47(36.7) 44(34.4) 37(28.9) 128 123,995WHO Region Africa 7(14.9) 7(15.9) 6(16.2) 20(15.6) 5,420 (4.4) Americas 0(0.0) 1(2.3) 1(2.7) 2(1.6) 17,785 (14.3) South-East Asia 4(8.5) 8(18.2) 9(24.3) 21(16.4) 7,775 (6.3) Europe 3(6.4) 1(2.3) 2(5.4) 6(4.7) 46,575 (37.6) Eastern Mediterranean 5(10.6) 2(4.5) 2(5.4) 9(7) 6,100 (4.9) Western Pacific 28(59.6) 25(56.8) 17(45.9) 70(54.7) 40,070 (32.3)
*Source: http://www.immigratemanitoba.com/asset_library/en/resources/pdf/mb_ethnicity1.pdf Includes Other Category with no specified birth country †
†
Year
WRHA THe ePideMiOlOgy OF ACTiVe TubeRCulOSiS diSeASe iN THe WiNNiPeg HeAlTH RegiON 12
9
TABLE 7 Number (%) of cases of active TB disease by year and certain clinical features, WHR, 2009-2011
Year2009 2010 2011 Total
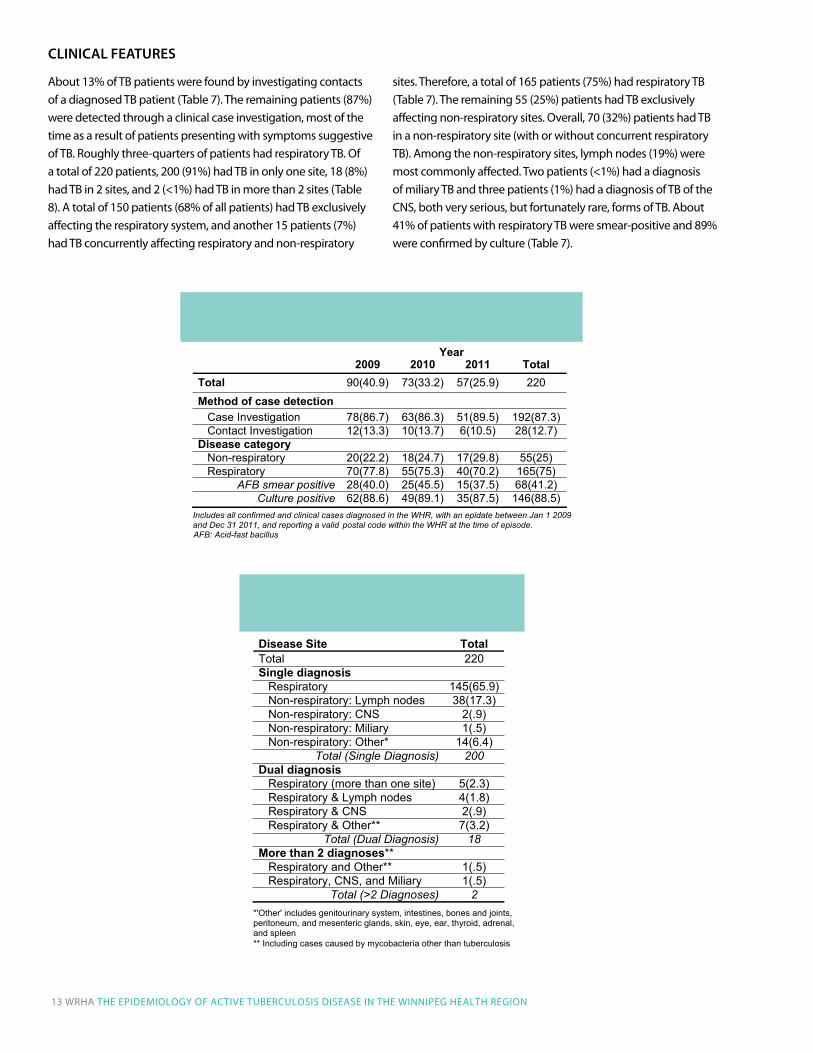
Total 90(40.9) 73(33.2) 57(25.9) 220Method of case detection Case Investigation 78(86.7) 63(86.3) 51(89.5) 192(87.3) Contact Investigation 12(13.3) 10(13.7) 6(10.5) 28(12.7)Disease category Non-respiratory 20(22.2) 18(24.7) 17(29.8) 55(25) Respiratory 70(77.8) 55(75.3) 40(70.2) 165(75)
AFB smear positive 28(40.0) 25(45.5) 15(37.5) 68(41.2)Culture positive 62(88.6) 49(89.1) 35(87.5) 146(88.5)
Includes all confirmed and clinical cases diagnosed in the WHR, with an epidate between Jan 1 2009 and Dec 31 2011, and reporting a valid postal code within the WHR at the time of episode. AFB: Acid-fast bacillus
10
TABLE 8Number (%) of cases of active TB disease by disease site, WHR, 2009-2011
Disease Site TotalTotal 220Single diagnosis Respiratory 145(65.9) Non-respiratory: Lymph nodes 38(17.3) Non-respiratory: CNS 2(.9) Non-respiratory: Miliary 1(.5) Non-respiratory: Other* 14(6.4)
Total (Single Diagnosis) 200Dual diagnosis Respiratory (more than one site) 5(2.3) Respiratory & Lymph nodes 4(1.8) Respiratory & CNS 2(.9) Respiratory & Other** 7(3.2)
Total (Dual Diagnosis) 18More than 2 diagnoses** Respiratory and Other** 1(.5) Respiratory, CNS, and Miliary 1(.5)
Total (>2 Diagnoses) 2 *'Other' includes genitourinary system, intestines, bones and joints, peritoneum, and mesenteric glands, skin, eye, ear, thyroid, adrenal, and spleen ** Including cases caused by mycobacteria other than tuberculosis
13 WRHA THe ePideMiOlOgy OF ACTiVe TubeRCulOSiS diSeASe iN THe WiNNiPeg HeAlTH RegiON
About 13% of Tb patients were found by investigating contacts of a diagnosed Tb patient (Table 7). The remaining patients (87%) were detected through a clinical case investigation, most of the time as a result of patients presenting with symptoms suggestive of Tb. Roughly three-quarters of patients had respiratory Tb. Of a total of 220 patients, 200 (91%) had Tb in only one site, 18 (8%) had Tb in 2 sites, and 2 (<1%) had Tb in more than 2 sites (Table 8). A total of 150 patients (68% of all patients) had Tb exclusively affecting the respiratory system, and another 15 patients (7%) had Tb concurrently affecting respiratory and non-respiratory
sites. Therefore, a total of 165 patients (75%) had respiratory Tb (Table 7). The remaining 55 (25%) patients had Tb exclusively affecting non-respiratory sites. Overall, 70 (32%) patients had Tb in a non-respiratory site (with or without concurrent respiratory Tb). Among the non-respiratory sites, lymph nodes (19%) were most commonly affected. Two patients (<1%) had a diagnosis of miliary Tb and three patients (1%) had a diagnosis of Tb of the CNS, both very serious, but fortunately rare, forms of Tb. About 41% of patients with respiratory Tb were smear-positive and 89% were confirmed by culture (Table 7).
clinical featureS
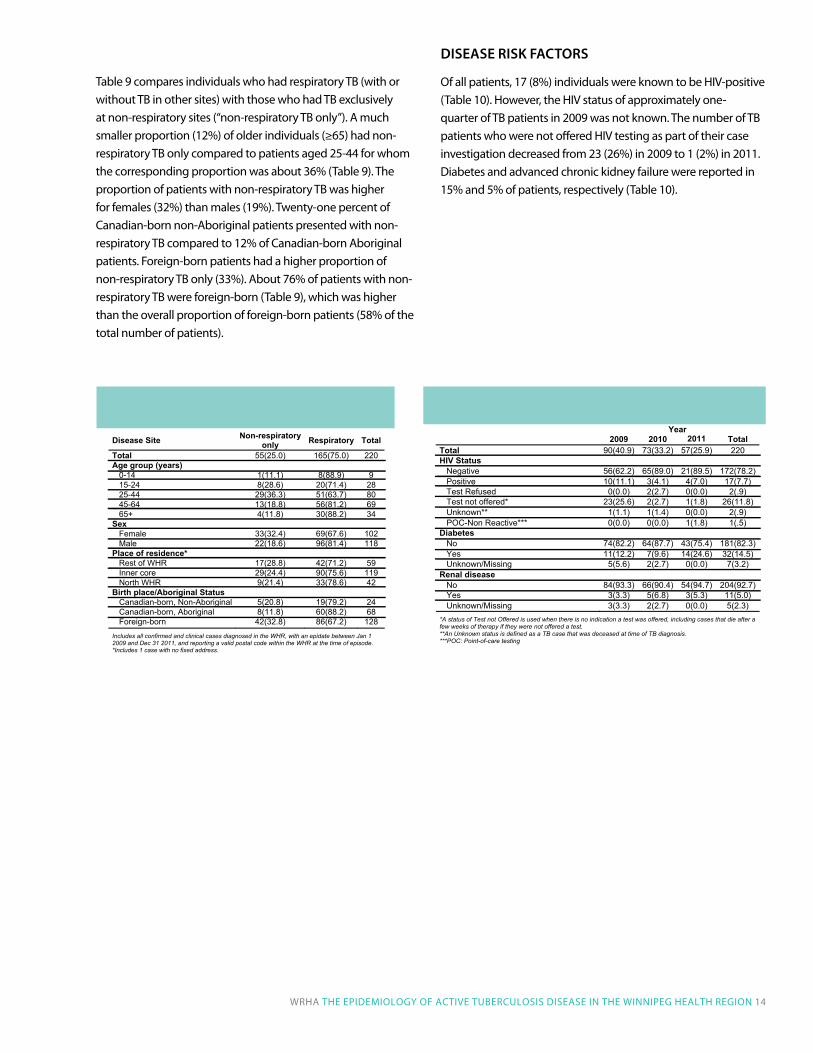
Table 9 compares individuals who had respiratory Tb (with or without Tb in other sites) with those who had Tb exclusively at non-respiratory sites (“non-respiratory Tb only”). A much smaller proportion (12%) of older individuals (≥65) had non-respiratory Tb only compared to patients aged 25-44 for whom the corresponding proportion was about 36% (Table 9). The proportion of patients with non-respiratory Tb was higher for females (32%) than males (19%). Twenty-one percent of Canadian-born non-Aboriginal patients presented with non-respiratory Tb compared to 12% of Canadian-born Aboriginal patients. Foreign-born patients had a higher proportion of non-respiratory Tb only (33%). About 76% of patients with non-respiratory Tb were foreign-born (Table 9), which was higher than the overall proportion of foreign-born patients (58% of the total number of patients).
DiSeaSe riSK factorS
Of all patients, 17 (8%) individuals were known to be HiV-positive (Table 10). However, the HiV status of approximately one-quarter of Tb patients in 2009 was not known. The number of Tb patients who were not offered HiV testing as part of their case investigation decreased from 23 (26%) in 2009 to 1 (2%) in 2011. diabetes and advanced chronic kidney failure were reported in 15% and 5% of patients, respectively (Table 10).
WRHA THe ePideMiOlOgy OF ACTiVe TubeRCulOSiS diSeASe iN THe WiNNiPeg HeAlTH RegiON 14
13
TABLE 10 Number (%) of cases of active TB disease by calendar year and disease risk factors, WHR, 2009-2011
Year2009 2010 2011 Total
Total 90(40.9) 73(33.2) 57(25.9) 220HIV Status Negative 56(62.2) 65(89.0) 21(89.5) 172(78.2) Positive 10(11.1) 3(4.1) 4(7.0) 17(7.7) Test Refused 0(0.0) 2(2.7) 0(0.0) 2(.9) Test not offered* 23(25.6) 2(2.7) 1(1.8) 26(11.8) Unknown** 1(1.1) 1(1.4) 0(0.0) 2(.9) POC-Non Reactive*** 0(0.0) 0(0.0) 1(1.8) 1(.5)Diabetes No 74(82.2) 64(87.7) 43(75.4) 181(82.3) Yes 11(12.2) 7(9.6) 14(24.6) 32(14.5) Unknown/Missing 5(5.6) 2(2.7) 0(0.0) 7(3.2)Renal disease No 84(93.3) 66(90.4) 54(94.7) 204(92.7) Yes 3(3.3) 5(6.8) 3(5.3) 11(5.0) Unknown/Missing 3(3.3) 2(2.7) 0(0.0) 5(2.3) *A status of Test not Offered is used when there is no indication a test was offered, including cases that die after afew weeks of therapy if they were not offered a test. **An Unknown status is defined as a TB case that was deceased at time of TB diagnosis. ***POC: Point-of-care testing
12
TABLE 9Number (%) of cases of active TB disease by disease site and socio-demographic characteristics, WHR, 2009-2011
Disease Site Non-respiratoryonly Respiratory Total
Total 55(25.0) 165(75.0) 220Age group (years) 0-14 1(11.1) 8(88.9) 9 15-24 8(28.6) 20(71.4) 28 25-44 29(36.3) 51(63.7) 80 45-64 13(18.8) 56(81.2) 69 65+ 4(11.8) 30(88.2) 34Sex Female 33(32.4) 69(67.6) 102 Male 22(18.6) 96(81.4) 118Place of residence* Rest of WHR 17(28.8) 42(71.2) 59 Inner core 29(24.4) 90(75.6) 119 North WHR 9(21.4) 33(78.6) 42Birth place/Aboriginal Status Canadian-born, Non-Aboriginal 5(20.8) 19(79.2) 24 Canadian-born, Aboriginal 8(11.8) 60(88.2) 68 Foreign-born 42(32.8) 86(67.2) 128
Includes all confirmed and clinical cases diagnosed in the WHR, with an epidate between Jan 1 2009 and Dec 31 2011, and reporting a valid postal code within the WHR at the time of episode. *Includes 1 case with no fixed address.
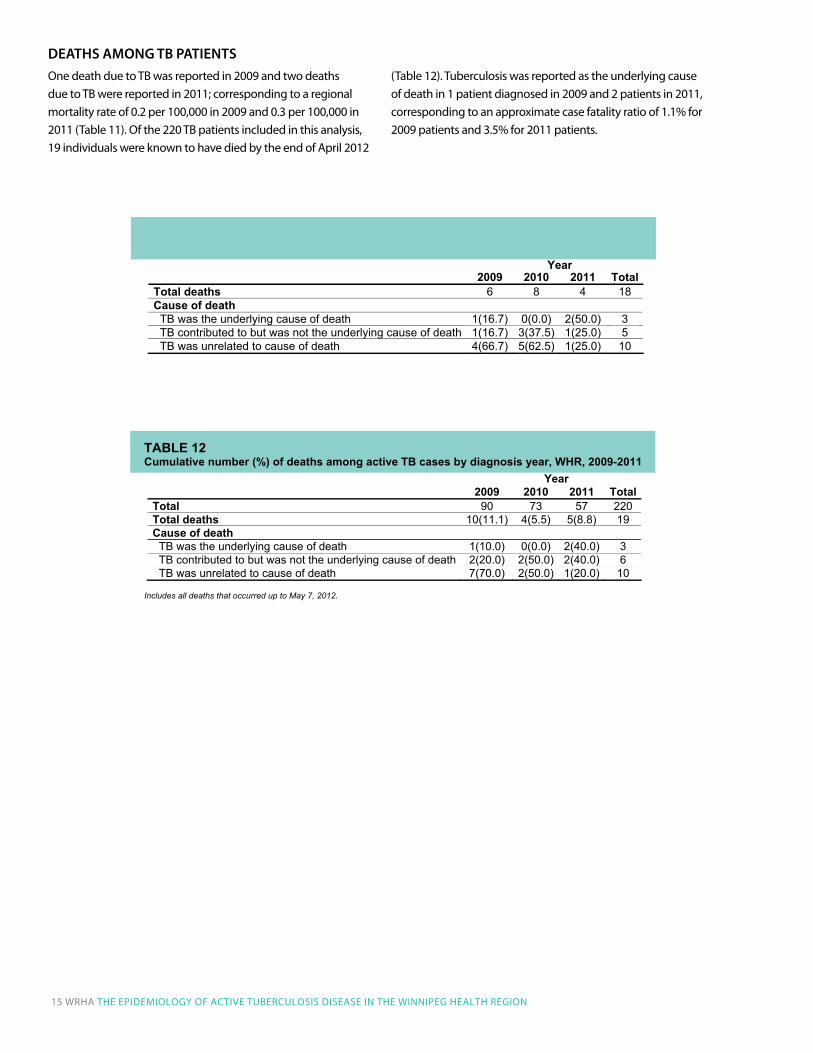
One death due to Tb was reported in 2009 and two deaths due to Tb were reported in 2011; corresponding to a regional mortality rate of 0.2 per 100,000 in 2009 and 0.3 per 100,000 in 2011 (Table 11). Of the 220 Tb patients included in this analysis, 19 individuals were known to have died by the end of April 2012
(Table 12). Tuberculosis was reported as the underlying cause of death in 1 patient diagnosed in 2009 and 2 patients in 2011, corresponding to an approximate case fatality ratio of 1.1% for 2009 patients and 3.5% for 2011 patients.
15
TABLE 11Number (%) of deaths among active TB cases by year of death, WHR, 2009-2011
2009 2010 2011 TotalTotal deaths 6 8 4 18Cause of death TB was the underlying cause (0)7.61(1 htaed fo 0.0) 2(50.0) 3 TB contributed to but was not the underlying cause of death 1(16.7) 3(37.5) 1(25.0) 5 TB was unrelated to cause of death 4(66.7) 5(62.5) 1(25.0) 10
TABLE 12Cumulative number (%) of deaths among active TB cases by diagnosis year, WHR, 2009-2011
2009 2010 2011 TotalTotal 90 73 57 220Total deaths 10(11.1) 4(5.5) 5(8.8) 19Cause of death TB was the underlying cause of (0 )0.01(1 htaed 0.0) 2(40.0) 3 TB contributed to but was not the underlying cause of death 2(20.0) 2(50.0) 2(40.0) 6 TB was unrelated to cause of death 7(70.0) 2(50.0) 1(20.0) 10
Includes all deaths that occurred up to May 7, 2012.
Year
Year
DeathS aMong tB patientS
15 WRHA THe ePideMiOlOgy OF ACTiVe TubeRCulOSiS diSeASe iN THe WiNNiPeg HeAlTH RegiON
WRHA THe ePideMiOlOgy OF ACTiVe TubeRCulOSiS diSeASe iN THe WiNNiPeg HeAlTH RegiON 16
in this report, we describe the trends, distribution and determinants of active Tb disease reported among WHR residents during 2009 through 2011, the years for which complete data are available. information on long-term trends of Tb was not available from the regional communicable diseases surveillance system. even for 2009 – 2011 patients, information was not readily available for some important variables. For instance, information on migration status for foreign-born individuals and on the specific ethnicity of Aboriginal peoples was not systematically gathered. Furthermore, it was not possible to calculate incidence rates of Tb according to ethnicity, or region or country of birth because reliable up-to-date information on denominator counts (i.e., total number of Aboriginal people or immigrants residing in the WHR by country of birth) was not available. Finally, the patient numbers in certain subgroup analyses were small; comparisons based on small numbers should be interpreted with caution as they tend to be unreliable. despite these limitations, this report includes important observations that are discussed below.
Over the last decade, Manitoba has consistently reported higher rates of active Tb than the national rate.2 in 2009 and 2010, the rates of reported active Tb in the WHR were similar to the overall provincial rates. However, in 2011, the regional rate was slightly lower than the provincial average and lower than the regional rate observed in 2009. After decades of steady decline, annual rates of active Tb in Manitoba (and the WHR) have hovered around 10 per 100,000. This is twice the annual national rate which has averaged about 5 per 100,000 over the last 7 years or so.2 The recent downward trend is encouraging, but because the number of Tb patients fluctuates substantially from year-to-year it is not clear whether this heralds a long-term decline in disease incidence.
However, Tb disease burden is not distributed equally within the region. Whereas the more affluent suburban areas of the WHR had rates that were very similar to the national rate, the inner core and northern parts of the WHR had disease rates that were 3-10 times the national rate. The residents of these areas are more likely to belong to population groups at higher risk of socio-economic disadvantage: Aboriginal peoples, and immigrants and refugees. like elsewhere in Canada, these populations are disproportionately affected by Tb.9 Nationwide, disease rates among Aboriginal people were nearly six times that of the overall Canadian population.2 in the WHR, Aboriginal people, who constitute about 10% of the WHR population,7 made up 31% of the total number
of patients reported between 2009-2011, and about three-quarters of Canadian-born patients reported in these years.
The higher rates of Tb in Aboriginal populations may reflect the increased prevalence of risk factors for Tb infection and progression to active disease, such as diabetes, advanced chronic kidney failure and HiV/AidS. Overall, 15% of the Tb patients in this report were identified as having diabetes and 5% were identified as having advanced chronic kidney failure. The prevalence of diabetes among First Nations peoples in Manitoba is estimated at about 10%,10 compared to 5.2% for the whole region. Similarly, the age-standardized incidence of chronic renal failure among Aboriginal people is reported to be two and a half to four times higher than the national rate.11
The prevalence of HiV, one of the strongest risk factors for Tb, is rising among Aboriginal peoples.12 The WHO estimated HiV prevalence in incident Tb cases in Canada in 2007 to be 5.7%.13 in this report, 8% of all patients were known to be HiV-positive. Compared to 2009, there was a significant drop in the percentage of patients that were not offered HiV testing (from 26% in 2009 to 2% in 2011).
More importantly, the social determinants of health (e.g., poverty, homelessness, poor housing conditions and overcrowding; social and geographic isolation; and inaccessible or inadequate health care services) have been long recognized as the root causes of the Tb epidemic in Aboriginal people and other disadvantaged populations.13
Although we did not examine these factors in this report (due to lack of reliable data during the period covered by this report), accumulated evidence from other jurisdictions suggest that these factors are equally important to the Aboriginal population in the WHR, and possibly to other disadvantaged populations such as immigrants and refugee populations.
Although the foreign-born population comprised about 20% of the WHR population in 2006,8 they made up about 58% of the reported Tb patients. Nationwide, foreign-born individuals made up 66% of the total number of Tb patients reported in 2010.2 Historically, immigrants and refugees represented a smaller proportion of the population in Manitoba compared to larger provinces. However, as the rate of international migration to Manitoba continues to increase, both the number of foreign-born Tb patients and the proportion they represent of all patients are expected to increase, especially as migrants to Manitoba (and the WHR) tend to originate from high-incidence regions such as the Western Pacific and Africa.
INTERpRETATION
CONCLuSIONS Tb remains a significant public health problem in the WHR despite encouraging downward trends. demographic trends, such as increasing migration from endemic countries and a growing urban Aboriginal population, and persistent patterns of socio-economic disadvantage may have contributed to slowed progress in reducing Tb rates. in the WHR, Tb is now primarily a disease of certain neighborhoods and specific ethnic groups (Aboriginal people and immigrants and refugees from high-incidence countries). The extreme disparities in the burden of Tb documented in this report add to the growing concerns about the problem of socially-determined health inequities.
established strategies, such as early detection and treatment of Tb patients and public health and clinical management, are key to Tb control. The accessibility, acceptability and effectiveness of disease control activities should be continuously monitored. To accomplish this goal, disease surveillance, program evaluation and research activities should be enhanced to gain further understanding of the characteristics and determinants of Tb transmission and progression to active disease in each high-risk population or neighborhood. This should involve working in partnership with patients, families and communities to understand their experiences and to identify best practice strategies for preventing disease transmission, early detection of disease and for those individuals identified with infection or disease how best to assist them to successful treatment completion. in addition to individual level interventions, complementary interventions aimed at addressing the socio-economic determinants of the disparities in the burden of Tb and other diseases are needed.
Overall, the epidemiology and clinical features of Tb patients in the WHR were consistent with those observed elsewhere in Canada. Males were more likely to be affected than females, although females were more likely to be diagnosed at a younger age (37 years) than males (46 years). generally, the Tb rate was highest in the 25–44 age group, and lowest among individuals aged 0–14 years. The percentage of patients with respiratory Tb and a positive acid-fast bacillus (AFb) smear (41%) was comparable to that observed elsewhere in Canada.
About one quarter of WHR patients had non-respiratory Tb. For unclear reasons, non-respiratory Tb was more often diagnosed among foreign-born individuals than Canadian-born individuals while the reverse was true for patients with respiratory Tb. This is consistent with what is observed in other provinces,14 but the causes of this pattern are not clear. in one study, the excess non-respiratory Tb was only seen among “Asian” immigrants.15 Compared to those with respiratory Tb, patients with non-respiratory Tb are less likely to spread the disease to others. However, there is often a delay in diagnosis and initiation of treatment in these patients.
in the WHR, a relatively high percentage of Tb patients (13%) were detected through contact investigation. The corresponding national figure was 9% in 2007.9 Nineteen percent of patients in Manitoba were detected through a contact investigation in that same year, more than double that identified nationally.9 The difference could be due to higher percentage of Aboriginal patients in Manitoba as Aboriginal patients are two to three times more likely to be detected through a contact investigation compared non-Aboriginal patients.9 The higher percentage of patients detected through contact investigation and the occurrence of Tb clusters in some Aboriginal communities (within and outside the WHR) suggest that ongoing disease transmission remains a concern in these communities. On the other hand, foreign-born patients are typically less likely to be detected by contact investigation as most of these patients likely had a reactivation of Tb infection acquired in the birth country.16
17 WRHA THe ePideMiOlOgy OF ACTiVe TubeRCulOSiS diSeASe iN THe WiNNiPeg HeAlTH RegiON
WRHA THe ePideMiOlOgy OF ACTiVe TubeRCulOSiS diSeASe iN THe WiNNiPeg HeAlTH RegiON 18
Stop Tb Partnership. global Plan to Stop Tb 2006–2015:
World Health Organization; 2006.
Public Health Agency of Canada. Tuberculosis in Canada,
2010 Pre-Release Ottawa, Canada; 2012.
Menzies d, Oxlade O, lewis M. Costs for tuberculosis care in
Canada. Montreal; 2006.
Manitoba Health. Tuberculosis (Tb) Protocol. Winnipeg,
Manitoba: Manitoba Health; 2009.
The Public Health Act, C.C.S.M. c. P210. in. Canada; 2006.
WHO Regional Offices. World Health Organization, 2012.
(Accessed december 9, 2011, at http://www.who.int/about/
regions/en/index.html).
Statistics Canada. 2006 Aboriginal Population Profile for
Winnipeg. Ottawa, Canada: Statistics Canada; 2010. Report
No.: 978-1-100-14819-9.
Manitoba labour and immigration, Manitoba Culture
Heritage and Tourism. ethnicity Series: A demographic
Portrait of Manitoba, Volume 1 Foreign-born Population;
2010.
Public Health Agency of Canada. Tuberculosis in Canada
2007. Ottawa, Canada; 2009.
Manitoba Health. diabetes in Manitoba 1989 to 2006:
Report of diabetes Surveillance. Winnipeg, Canada:
Manitoba Health; 2009.
Public Health Agency of Canada. The Canadian Tuberculosis
Standards 6th edition. Ottawa, Canada; 2007.
Public Health Agency of Canada. HiV/AidS among
Aboriginal people in Canada. Ottawa, Canada; 2010.
World Health Organization. global tuberculosis control:
epidemiology, strategy, financing: WHO report 2009
geneva, Switzerland; 2009. Report No.: WHO/HTM/
Tb/2009.411.
long R, Njoo H, Hershfield e. Tuberculosis: 3. epidemiology
of the disease in Canada. Canadian Medical Association
Journal 1999; 160: 1185-90.
Cowie Rl, Sharpe JW. Tuberculosis among immigrants:
interval from arrival in Canada to diagnosis. A 5-year study
in southern Alberta. Canadian Medical Association Journal
1998; 158: 599-602.
greenaway C, Sandoe A, Vissandjee b, et al. Tuberculosis:
evidence review for newly arriving immigrants and
refugees. Canadian Medical Association Journal 2011; 183:
e939-e51.
REFERENCES1.
2.
3.
4.
5.
6.
7.
8.
9.
10.
11.
12.
13.
14.
15.
16.
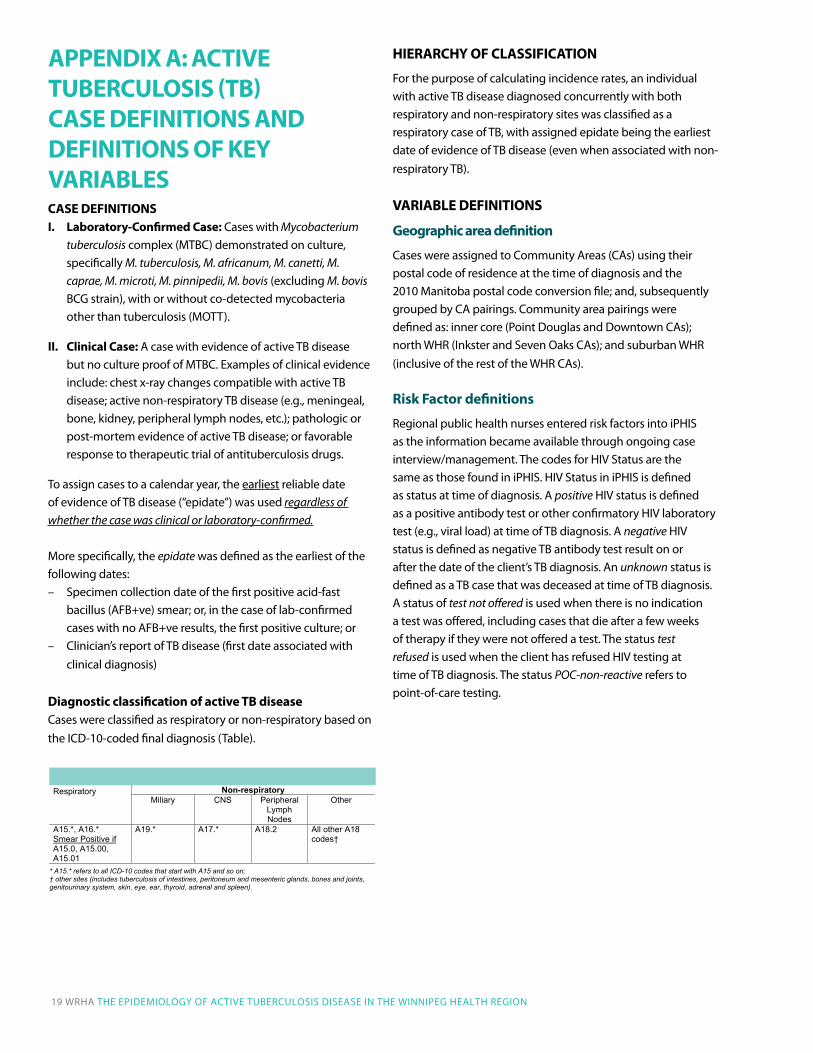
AppENDIx A: ACTIvE TuBERCuLOSIS (TB) CASE DEFINITIONS AND DEFINITIONS OF KEy vARIABLES CASE DEFINITIONSI. Laboratory-Confirmed Case: Cases with Mycobacterium
tuberculosis complex (MTbC) demonstrated on culture, specifically M. tuberculosis, M. africanum, M. canetti, M. caprae, M. microti, M. pinnipedii, M. bovis (excluding M. bovis bCg strain), with or without co-detected mycobacteria other than tuberculosis (MOTT).
II. Clinical Case: A case with evidence of active Tb disease but no culture proof of MTbC. examples of clinical evidence include: chest x-ray changes compatible with active Tb disease; active non-respiratory Tb disease (e.g., meningeal, bone, kidney, peripheral lymph nodes, etc.); pathologic or post-mortem evidence of active Tb disease; or favorable response to therapeutic trial of antituberculosis drugs.
To assign cases to a calendar year, the earliest reliable date of evidence of Tb disease (“epidate”) was used regardless of whether the case was clinical or laboratory-confirmed.
More specifically, the epidate was defined as the earliest of the following dates: – Specimen collection date of the first positive acid-fast
bacillus (AFb+ve) smear; or, in the case of lab-confirmed cases with no AFb+ve results, the first positive culture; or
– Clinician’s report of Tb disease (first date associated with clinical diagnosis)
Diagnostic classification of active TB diseaseCases were classified as respiratory or non-respiratory based on the iCd-10-coded final diagnosis (Table).
HIERARCHy OF CLASSIFICATION
For the purpose of calculating incidence rates, an individual with active Tb disease diagnosed concurrently with both respiratory and non-respiratory sites was classified as a respiratory case of Tb, with assigned epidate being the earliest date of evidence of Tb disease (even when associated with non-respiratory Tb).
vARIABLE DEFINITIONS
Geographic area definition
Cases were assigned to Community Areas (CAs) using their postal code of residence at the time of diagnosis and the 2010 Manitoba postal code conversion file; and, subsequently grouped by CA pairings. Community area pairings were defined as: inner core (Point douglas and downtown CAs); north WHR (inkster and Seven Oaks CAs); and suburban WHR (inclusive of the rest of the WHR CAs).
Risk Factor definitions
Regional public health nurses entered risk factors into iPHiS as the information became available through ongoing case interview/management. The codes for HiV Status are the same as those found in iPHiS. HiV Status in iPHiS is defined as status at time of diagnosis. A positive HiV status is defined as a positive antibody test or other confirmatory HiV laboratory test (e.g., viral load) at time of Tb diagnosis. A negative HiV status is defined as negative Tb antibody test result on or after the date of the client’s Tb diagnosis. An unknown status is defined as a Tb case that was deceased at time of Tb diagnosis. A status of test not offered is used when there is no indication a test was offered, including cases that die after a few weeks of therapy if they were not offered a test. The status test refused is used when the client has refused HiV testing at time of Tb diagnosis. The status POC-non-reactive refers to point-of-care testing.
WRHA Tuberculosis Report, 2012
1
A PP E NDI X A Active Tuberculo sis (T B) Case Definiti ons and Definition s of Key Variables CA SE DE F I NI T I ON S I. Laboratory-Confirme d Case: Cases with Mycobacterium tuberculosis complex (MTBC)
demonstrated on culture, specifically M. tuberculosis, M. africanum, M. canetti, M. caprae , M. microti, M. pinnipedii, M. bovis (excluding M. bovis BCG strain), with or without co-detected mycobacteria other than tuberculosis (MOTT).
II. Clinical C ase: A case with evidence of active TB disease but no culture proof of MTBC.
Examples of clinical evidence include: chest x-ray changes compatible with active TB disease; active non-respiratory TB disease (e.g., meningeal, bone, kidney, peripheral lymph nodes, etc.); pathologic or post-mortem evidence of active TB disease; or favorable response to therapeutic trial of antituberculosis drugs.
To assign cases to a calendar year, the earliest reliable date of evidence of TB disease (“epidate”) was used regardless of whether the case was clinical or laboratory-confirmed. More specifically, the epidate was defined as the earliest of the following dates:
– Specimen collection date of the first positive acid-fast bacillus (AFB+ve) smear; or, in the case of lab-confirmed cases with no AFB+ve results, the first positive culture; or
– Clinician’s report of TB disease (first date associated with clinical diagnosis) Diagnostic classification of active TB disease Cases were classified as respiratory or non-respiratory based on the ICD-10-coded final diagnosis (Table).
ICD10 Codes by Diagnostic Classification
Non-respiratory Respiratory Miliary CNS Peripheral
LymphNodes
Other
A15.*, A16.*Smear Positive if A15.0, A15.00, A15.01
A19.* A17.* A18.2 All other A18 codes†
* A15.* refers to all ICD-10 codes that start with A15 and so on; † other sites (includes tuberculosis of intestines, peritoneum and mesenteric glands, bones and joints, genitourinary system, skin, eye, ear, thyroid, adrenal and spleen).
HEIRARCHY OF C L ASSIFICATION For the purpose of calculating incidence rates, an individual with active TB disease diagnosed concurrently with both respiratory and non-respiratory sites was classified as a respiratory case of TB, with assigned epidate being the earliest date of evidence of TB disease (even when associated with non-respiratory TB).
19 WRHA THe ePideMiOlOgy OF ACTiVe TubeRCulOSiS diSeASe iN THe WiNNiPeg HeAlTH RegiON
WRHA THe ePideMiOlOgy OF ACTiVe TubeRCulOSiS diSeASe iN THe WiNNiPeg HeAlTH RegiON 20
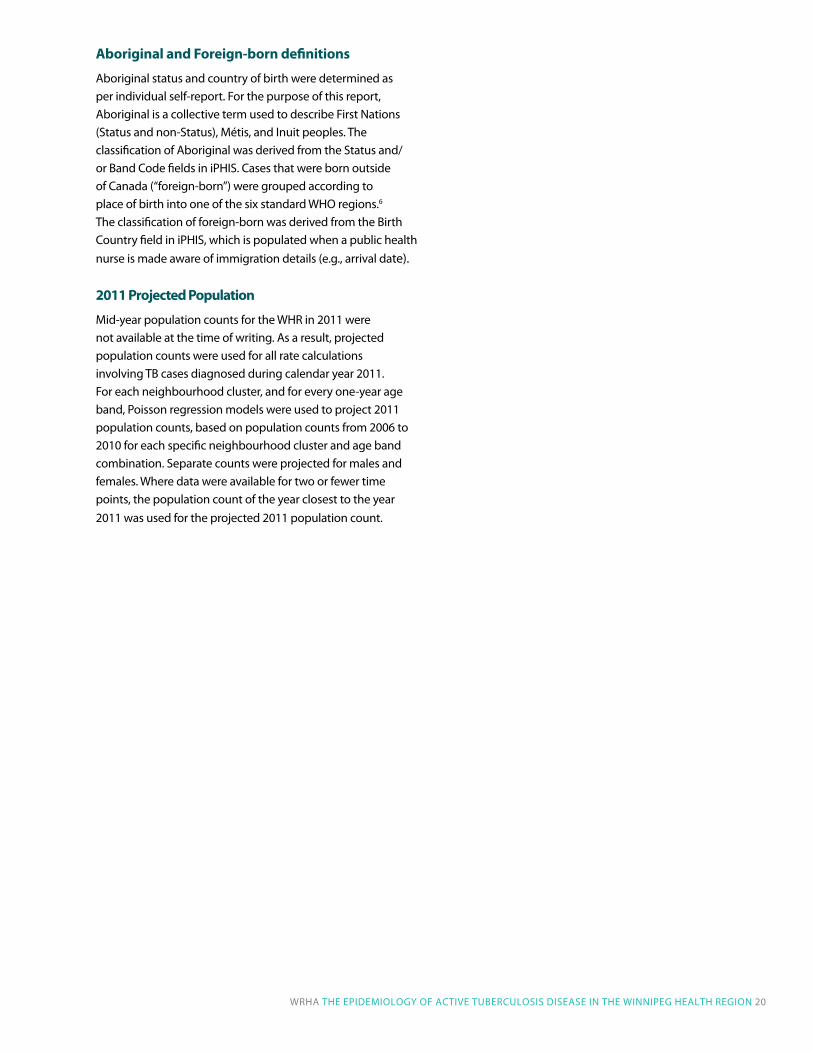
Aboriginal and Foreign-born definitions
Aboriginal status and country of birth were determined as per individual self-report. For the purpose of this report, Aboriginal is a collective term used to describe First Nations (Status and non-Status), Métis, and inuit peoples. The classification of Aboriginal was derived from the Status and/or band Code fields in iPHiS. Cases that were born outside of Canada (“foreign-born”) were grouped according to place of birth into one of the six standard WHO regions.6 The classification of foreign-born was derived from the birth Country field in iPHiS, which is populated when a public health nurse is made aware of immigration details (e.g., arrival date).
2011 projected population
Mid-year population counts for the WHR in 2011 were not available at the time of writing. As a result, projected population counts were used for all rate calculations involving Tb cases diagnosed during calendar year 2011. For each neighbourhood cluster, and for every one-year age band, Poisson regression models were used to project 2011 population counts, based on population counts from 2006 to 2010 for each specific neighbourhood cluster and age band combination. Separate counts were projected for males and females. Where data were available for two or fewer time points, the population count of the year closest to the year 2011 was used for the projected 2011 population count.
21 WRHA THe ePideMiOlOgy OF ACTiVe TubeRCulOSiS diSeASe iN THe WiNNiPeg HeAlTH RegiON
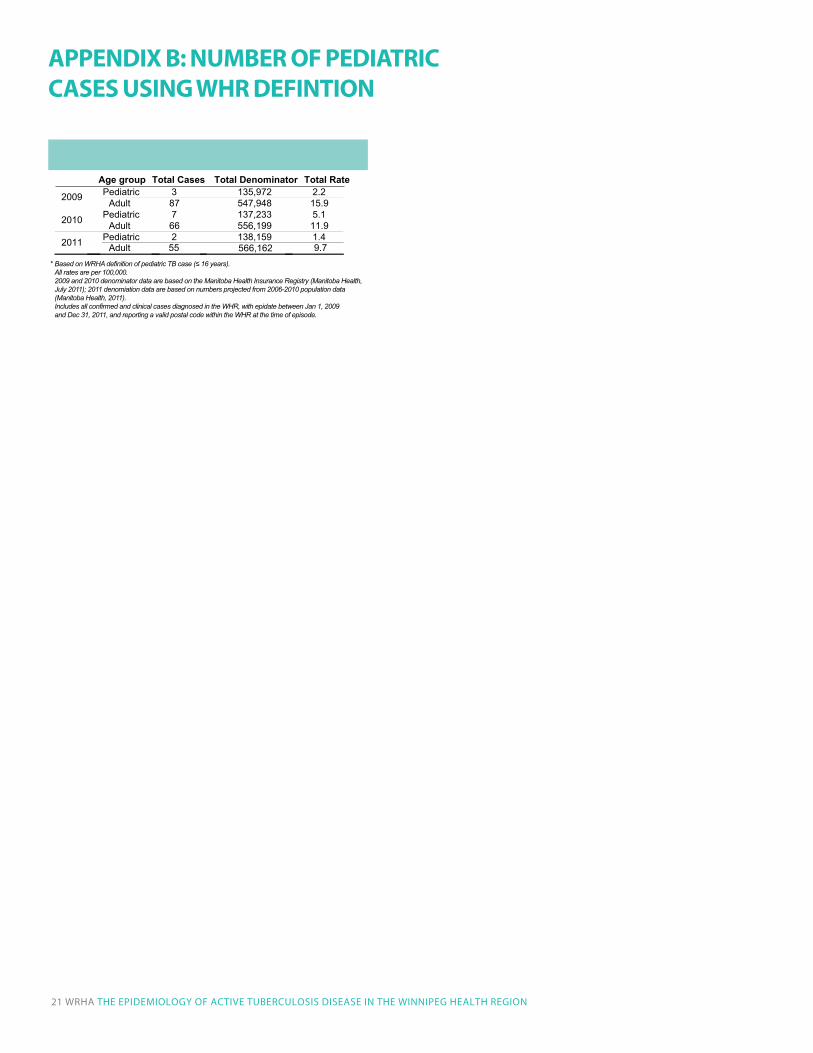
3
Pediatric (≤16 years) and adult (17+) incidence rates of TB by year
Age group Total Cases Total Denominator Total Rate Pediatric 3 135,972 2.2 2009 Adult 87 547,948 15.9 Pediatric 7 137,233 5.1 2010 Adult 66 556,199 11.9 Pediatric 2 138,159 1.4 2011
(WHR, 2009-2011)*
Adult 55 566,162 9.7Based on WRHA definition of pediatric TB case (≤ 16 years).All rates are per 100,000.2009 and 2010 denominator data are based on the Manitoba Health Insurance Registry (Manitoba Health, July 2011); 2011 denomiation data are based on numbers projected from 2006-2010 population data (Manitoba Health, 2011). Includes all confirmed and clinical cases diagnosed in the WHR, with epidate between Jan 1, 2009 and Dec 31, 2011, and reporting a valid postal code within the WHR at the time of episode.
*
AppENDIx B: NuMBER OF pEDIATRIC CASES uSING WHR DEFINTION


Population Health Surveillance TeamPopulation and Public Health Program