the end-users as starting point for designing dynamic ... · 2.5 inclining block rate (ibr) pricing...
TRANSCRIPT

- 1 -
The end-users as starting point
for designing dynamic pricing
approaches to change household
energy consumption behaviours.
Report for Netbeheer Nederland, Projectgroep Smart Grids (Pg SG).
March 2013
Dr. S.C.Breukers and Dr. R.M.Mourik
DuneWorks B.V.

- 2 -
When citing from this document, please refer to it as follows:
Breukers, S. and Mourik, R. (2013) The end-users as starting point for designing dynamic pricing approaches to
change household energy consumption behaviours. Report for Netbeheer Nederland, Project group Smart
Grids (Pg SG). Arnhem: March 2013.

- 3 -
Table of Contents
Executive summary ......................................................................................................................... - 5 -
1. Introduction: background, scope and focus ............................................................................. - 13 -
1.1. Background ........................................................................................................................ - 13 -
1.2 Scope and focus ................................................................................................................. - 14 -
1.3 Method and considerations ............................................................................................... - 14 -
2. Dynamic pricing ........................................................................................................................ - 17 -
2.1 Time of Use (ToU) pricing .................................................................................................... - 17 -
2.2 Critical Peak Pricing (CPP) ................................................................................................... - 18 -
2.3 Critical Peak Rebate (CPR) ................................................................................................... - 18 -
2.4 Real-time pricing (RTP) ........................................................................................................ - 19 -
2.5 Inclining Block Rate (IBR) pricing ........................................................................................ - 19 -
2.6 Dynamic pricing and Conservation .................................................................................... - 20 -
2.7 Responsiveness to dynamic pricing.................................................................................... - 20 -
2.8 Shifting demand, shifting loads .......................................................................................... - 21 -
2.9 Load shifting and/or reducing? .......................................................................................... - 24 -
3. Essential components of a dynamic pricing approach:, technology and feedback .................. - 25 -
3.1 Technology .......................................................................................................................... - 25 -
3.2 Automation and remote control ........................................................................................ - 26 -
3.3 Feedback ............................................................................................................................ - 28 -
3.4 Pricing and feedback .......................................................................................................... - 30 -
3.5 Effective load shifting and combination of pricing, technologies and feedback ................ - 31 -
3.6 Pre or post-paid energy ...................................................................................................... - 32 -
4 Behavioural change.................................................................................................................... - 34 -
4.1 From routines to intentional behaviours (and back) .......................................................... - 34 -
4.2 Behaviours and potential load shifting .............................................................................. - 35 -
5. The end-user as a starting point ............................................................................................... - 38 -
5.1 Segmentation: as the second-best option ........................................................................ - 39 -
5.2 Improving segmentation .................................................................................................... - 42 -
6. The Dutch context & role of DSOs ............................................................................................ - 50 -
6.1 Role of DSOs in the Netherlands ......................................................................................... - 51 -
7. Conclusions: lessons, recommendations and remaining dilemma’s ........................................ - 53 -

- 4 -
7.1 Top 10 Lessons ................................................................................................................... - 53 -
7.2 Towards a DSO-led decentralised approach? ..................................................................... - 53 -
7.3 Remaining dilemma’s and suggestions for further research: ............................................. - 55 -
References : .................................................................................................................................. - 58 -
Annex 1: European examples of dynamic pricing ........................................................................ - 64 -
Annex 2: Load flexibility for different appliances ........................................................................ - 76 -
Annex 3: Dynamic pricing approaches tailored to 6 segments ................................................... - 81 -
Annex 4: Findings from Dynamic Pricing pilots, studies and reviews .......................................... - 88 -

- 5 -
Executive summary
Introduction
The increasing deployment of intermittent resources, decentralised generation, and the expectation
of further electrification pose a number of challenges to DSOs and TSOs in relation to the balance of
supply and demand. The increasing interest in demand reduction and demand shifting has resulted
in discussions about how dynamic pricing can be used to best encourage household end-users to
change their energy behaviours - more specifically to shift (and reduce) energy consumption. If end-
users can be incentivised to decrease their energy consumption during peak hours, this may prevent
the need to extend the grid and thus save considerable costs. As for end-users, dynamic price
incentives may provide them with insight in their own energy consumption patterns and related
costs. It may help them in gaining or maintaining control over their energy consumption, saving costs,
getting reassurance that behavioural changes have worked, getting support in motivating other
household members to reduce energy consumption, accomplishing other benefits like increased
comfort, indoor climate, health impacts, and social aspects. In addition, becoming more aware of the
varying price of electricity may encourage the uptake of a more pro-active role as energy users and
producers. For society at large, reduction and shifting may serve environmental goals (e.g. when it
allows for more decentralised renewable energy generation) and the societal goal of maintaining the
stability of the energy system.
Research aim and focus
Having a strong interest in demand shifting, and a (less strong) interest in demand reduction, Dutch
DSOs have questions on how to best design a dynamic pricing approach in such a manner that it
encourages household end-users to change their energy behaviours. The initial research question
therefore has been formulated as follows:
Which dynamic pricing approaches (being a combination of a dynamic price incentive, technology
and feedback) work best for which end-users and under what circumstances in the Netherlands?
This study focuses on electricity, demand shifting and reductions. This report is based on a review of
existing studies, reviews and pilots that report on the impact of price incentives to shift and/or
reduce energy consumption at the household residential level. This review aims at learning what
type of approaches work best, for whom, in which context and under what conditions. Regarding the
conditions, we focus on what would work in the Dutch context and what role DSOs could and/or
should take. In addition to this report we have also developed a step-wise approach for designing a
demand-management approach that consists of several building blocks which can be combined in
various ways, depending on the end-user characteristics. Rather than designing the invention around
a chosen price incentive or technology, we turn the process around and take the end-users as a
starting point in the process of designing a dynamic pricing approach. This step-wise end-user
centred approach and an accompanying background document have been published in Dutch as

- 6 -
separate documents next to this report.
Dynamic pricing approaches
Dynamic pricing is a means to an end - or to several ends - like for instance to balance supply and
demand; to prevent the need for grid extension; to achieve end-user energy saving; to raise
awareness; to more actively engage end-users and decentralized producers. A dynamic approach
consists of the following three elements: the pricing mechanism (e.g. ToU, CPP, CPR, RTP described
briefly below); supportive technology and feedback.
In this study we reviewed several forms of dynamic pricing:
Time of Use (ToU) tariffs are recurring daily and aim at encouraging people to use energy during
periods of the day when overall energy consumption is lower. In principle, ToU is not aimed at
reducing overall energy demand, merely at shifting the demand from one period to another. The
peak hours are invariable and known a long time in advance by the end-users. A day can have
one or more peak periods during which the prices are set higher in comparison to the prices for
the rest of the day. Two to four levels of prices may be distinguished (peak, partial peak, off-peak,
and weekend tariff) and in addition, prices may also vary according to the season.
Critical Peak Pricing (CPP) schemes offer lower year-round tariffs during non-peak hours in
exchange for substantially higher tariffs during critical peak hours. Critical peak periods or event
days occur at times of increased wholesale prices due to heightened consumption (e.g. very hot
or cold days) or when the stability of the system is jeopardized (e.g. risk of black-outs). The
maximum number and length of critical peak periods is agreed upon with the end-user in
advance. However, the exact moments when critical peaks occur cannot be set in advance as
these depend on market and weather conditions.
With Critical Peak Rebate (CPR) schemes the end-user is refunded at a predetermined tariff for
any reduction in consumption relative to what the utility expected the household to consume
during a few critical peak hours a year (usually during very hot summer afternoons, or very cold
winter evenings).
Real-time pricing (RTP) means that the end-user pays a price that is tied to the electricity price
on the wholesale market. To encourage consumption reduction during high price periods and
reduce risk of high bills, end-users can be informed when wholesale prices reach a certain
threshold.
Inclining Block Rates (IBR) currently is the least common scheme. As the name indicates,
Inclining Block Rates offer block-wise increasing rates. Prices increase step-wise as consumption
increases - so the more one uses, the higher the price per unit. This pricing mechanism has been
proposed as a complement to e.g. ToU or CPP and serves mainly conservation goals.
Technology, the second element, covers a wide range of supportive and feedback devices, of which
smart meters and In-House-Displays can be considered as ‘must-haves’ in combination with dynamic
pricing. An important technology is the In House Display (IHD) which provides feedback in a variety
of forms and has been shown to significantly improve the response from end-users. Other useful
technologies include ambient displays like energy orbs, smart apps, websites, email services, but also
very simple devices like paper mailings, fridge magnets or stickers and water saving showerheads. In
addition, more complex technologies can support behavioural changes in response to pricing,

- 7 -
including all sorts of smart appliances that can be programmed to respond to (changes in)
information and/or remote-controlled.
The third element of a pricing approach is feedback, which is part of any approach that aims at
encouraging end-users to change their energy consumption behaviour. In this study we distinguish
between feedback intended to communicate changes in the price and feedback to communicate
consumption patterns and volumes.
Letting go of a one-size-fits-all approach
In this study we explicitly diverge from studies that state that the combination of ToU, CPP, CPR, with
multiple enabling technologies and feedback technologies generate the highest peak clipping and
load shifting. Such 'full court' approach basically is a one-size-fits-all approach that uses as many
technologies and feedback options as available in order to reach as many different people as possible.
This is unlikely to deliver the cost-efficient approach and since the brunt of the costs eventually
comes down on society, it is undesirable from a societal perspective.
There are several more reasons why a ‘one-size-fits-all’ approach is not advisable when aiming at
energy consumption reduction or shifting.
- ‘one-size-fits-all’ approaches usually focus on providing financial incentives, assuming that
people are mainly economically motivated to participate. However, there is plenty of evidence
that people are not predominantly motivated by financial gains, but can also have other
motivations that relate to environmental goals, health, comfort, etc.
- Research on energy DSM aimed at energy consumption reduction has shown that approaches
that target individual behaviour only - without addressing the social and physical environment in
which behaviours are embedded - have not been very successful in achieving lasting behavioural
changes. In the case of dynamic pricing, attention for the characteristics of the house, the
appliances, as well as the social processes within a household are relevant to take account of.
- The risk of rebound during or after the pilot is larger if individuals are targeted with financial
incentives only. No social norms are addressed; no pro-social behaviour is likely to occur (which
is needed if the longer-term goal is to facilitate the transition to a more sustainable energy
system).
- Studies show that often a small percentage of the participants is responsible for the response,
while it remains unclear why and how they responded and why the rest did not. On average 30%
of households were responsible for 80% of the load shifting.
Top 10 lessons
Based on our review of pricing mechanisms, technology, feedback, behaviour and segmentation the
following top 10 lessons could be drawn:
1. For the near future Time of Use with several pricing variations a day, combined with Critical Peak
Pricing for several additional days annually is the most promising dynamic pricing intervention
for the Netherlands.

- 8 -
2. Focusing on load shifting only creates the risk of overall load increase. If e.g. the off-peak price is
too low compared to the peak price this can create an increase in consumption.
3. The theoretical load shifting and reduction potentials tell us little about the actual occurrence of
the shifting and reduction. That depends on the end-user. Lifestyle had a strong influence on the
actual occurrence of shifting or reduction behaviours.
4. People are not motivated by pricing incentives only. Environmental motives, "the desire to
contribute", control, comfort, ease and wellbeing are important motivators as well.
5. A one-size-fits-all approach reaches a maximum of 30% of end-users, with very different
responses within this 30%. If the aim is to also reach the remaining 70%, a differentiated
approach is needed.
6. Time of Use interventions target habitual behaviours. Critical Peak Pricing and Critical Peak
Rebate focus on conscious and less frequent behaviours.
7. Load shifting can be achieved without technology (using only fridge magnets and calendars).
Additional technology such as e.g. an In House Display however increases the response rate.
8. End-users highly value easy aids such as calendars, magnetic stickers and detailed frequent
energy bills.
9. Different end-user segments need different tailored interventions consisting of a specific
combination of dynamic pricing mechanism, technology and feedback.
10. A tailored approach and voluntary participation are very important to avoid discrimination (and
sabotage).
Designing a comprehensive and tailored dynamic pricing approach
Understanding what motivates behavioural changes (both intentional and routine behaviours) and
consequently the responsiveness of households to pricing signals, the potential flexibility of certain
loads in households, and how such changes can be made durable is important when designing an
effective dynamic pricing approach. Different end-users are likely to have different attitudes,
motivations, behaviours, capabilities, knowledge and other resources - which will affect how they
respond to and participate in dynamic pricing interventions. Ideally, these different end-users should
be targeted in ways that fit their needs, preferences, knowledge, capabilities etc. This would entail
that real needs and real behaviours of real households are included in a segmentation, to understand
how their attitudes, motivations, awareness, capabilities, sociodemographic variables, home and
appliances play a role in maintain a certain way of life. To understand how a particular lifestyle brings
with it certain patterns and volumes of energy consumption it is important to know how people
wash, eat, clean, care, relax, move, sleep etcetera. Segmentation offers a first step towards tailoring
a pricing approach to the motivations, behaviours and needs of a group of end-users that share
relevant characteristics - thereby increasing the chances that these end-users will respond. Such a
comprehensive segmentation includes several crucial elements:
Attitude, motivation, awareness, capabilities, behaviours
Sociodemographic variables
House-related characteristics

- 9 -
Appliances
Presence patterns
Household dynamics: timing and negotiable (read flexible) use
Segmentations that address all these elements do not exist to our knowledge. Nevertheless, first
steps to segment lifestyles have been undertaken. A Swiss segmentation study addressed attitudes,
motivations, awareness, reported actual behaviours and a number of sociodemographic variables.
The resulting segments, although not translatable one-to-one to the Dutch context, do offer end-
user profiles that we can expect to occur in the Netherlands in different percentages and possibly
with nuance differences. This resulted in different dynamic pricing approaches for each of the
following six segments:
Segment 1: Idealistic savers
Segment 2: Selfless inconsistent energy savers
Segment 3: Thrifty energy savers
Segment 4: Materialistic energy consumers
Segment 5: Comfort-oriented indifferent energy consumers
Segment 6: Problem Conscious welfare oriented energy consumers
To design tailored dynamic pricing interventions that consist of a combination of segments, pricing
mechanism, technology and feedback we designed a toolbox, see figure 1 below. Each element in the
toolbox is a building block that can be chosen or not. Each column represents the building blocks that
can be chosen within the categories: pricing mechanism, technology and feedback. The combination
of selected building blocks create a basic design for a tailored dynamic pricing intervention aimed at
a specific segment.
IBR
CPP
CPR
RTP
ToU
none
IHD
Energylamp
Smart meter
App
Magnetic sticker
Automation
Remote control
Post
Website
Colour change
Emoticons
Graphic
Tailored tips
Sound
€/kWhUse kWh
Reduction kWh
CO2 emmission
Emoticons
Graphic
Numbers
CO2 reduction
Reduction €
Use €
Per appliance
Per space
Comparative
Benchmark
Invoice detail.
Tailored tips
Goal setting
Historic
Per activity
PRICING Mechanism
TECHNOLOGYPrice related Use related Frequency,.
Level, type
FEEDBACK: FEEDBACK: FEEDBACK:
Toolbox

- 10 -
Figure 1: toolbox to design tailored interventions
As an example of how a dynamic pricing approach can be designed, we used six segments from a
Swiss study by Sütterlin et al (2011) to design 6 tailored dynamic pricing interventions. Table 1 and
figure 2 demonstrate how choices for building blocks from the toolbox are made for one segment
(‘Idealistic savers’).
Segment 1 Idealistic savers
General
Considerations
This group shows most efforts to save energy, and already does a lot in terms of
reduction. Driven by idealism, these people are willing to make financial sacrifices and
impose restrictions to themselves even if it means loss of comfort. This customer is
knowledgeable and consists largely of highly educated women.
Preferred
behaviour
Both routine behaviour and efficiency measures
Main motivation This group could be motivated to shift their consumption but from an environmental
motivation.
Choices related to
Pricing
Mechanism
Saving and shifting will not be financially motivated (no emphasis should be put on
money) and a price incentive may not be the best incentive. If a price incentive is used, a
combination of ToU, possibly with CPP, is a good option to visualise energy shifting
options. Because this segment is not financially motivated, RTP is probably not suitable
(because you still need to respond strongly to price). You could also simply CPP (and
focus on shifting only).
Choices related to
technology
Since this group is highly educated and well informed, different technologies can be used
to support further behavioural change. The use of technology should be functional for this
group. Almost all options are ticked in the toolbox because these people want information
to be provided both at home and at work on PC, smart phone, IHD. This group does not
like ceding control (especially to a party that is less environmentally conscious and
idealistic than themselves). Remote control by third parties is not an option; automation
is possible if this group can control it themselves.
Choices related to
Feedback
Detailed and differentiated information is desired. Because this group is well informed, it
is well able to interpret the information. Text, graphics, and / or lamp signals when price
changes are options. Tailored advice needs to be focused on shift options. Important for
this target group: who gives feedback and how reliable they find this party.
Table 1: Considerations made in choice for dynamic pricing approach (price incentive,
technology and feedback) for Segment 1.

- 11 -
IBR
CPP
CPR
RTP
ToU
none
IHD
Energylamp
Smart meter
App
Magnetic sticker
Automation
Remote control
Post
Website
Colour change
Emoticons
Graphic
Tailored tips
Sound
€/kWhUse kWh
Reduction kWh
CO2 emmission
Emoticons
Graphic
Numbers
CO2 reduction
Reduction €
Use €
Per appliance
Per space
Comparative
Benchmark
Invoice detail.
Tailored tips
Goal setting
Historic
Per activity
PRICING Mechanism
TECHNOLOGYPrice related Use related Frequency,.
Level, type
FEEDBACK: FEEDBACK: FEEDBACK:
Pricing Approach segment 1
Figure 2: Dynamic pricing approach for segment 1 (the blue blocks)
The role of the Dutch DSOs: towards a DSO-led decentralised approach?
The role of DSOs in the Netherlands differs from the role of DSOs in most other EU countries.
Because of the separation between transport and supply, the DSOs have been created as public
organizations responsible for balancing demand and supply.
A tailored pricing intervention requires a lot of detailed personal data from individual households
and a comprehensive segmentation asks for a lot of private and sensitive information from
households. It is unlikely that end-users provide such information easily - for several reasons, one
being the perception that the privacy and security of their data cannot be safeguarded.
Rather than trying to create an elaborate and costly centralised data system that ‘guarantees’ the
safety and protection of privacy and other end-user interests, it may be a better idea to keep end-
user data and information decentralised. That would also better fit with a future situation in which
end-users become more actively engaged in smart grid technologies. And it would make it easier for
DSOs not to compromise their task of furthering of the public interest as a priority when working
closely with parties that have very different priorities (e.g. the enormous interest in selling as much
smart and intelligent devices as possible collide with cost-efficiency for end-users as a priority). In a
decentralised data en information management system, the end-users’ active role would become key.
Such a system ensures that personal information needed for the segmentation as well as household
metering data remain with the end-user and with no one else. This also resonates with other studies
that discuss the options of full end-user control and ownership over (metering) data.
The role of the DSO could be to design a tool that provides to the end-users several segment-
descriptions with accompanying price-technology-feedback combinations with an explanation of

- 12 -
critical issues and potential risks and benefits. Or the toolbox could allow for a household to fill in
their personal data and the tool would subsequently advise the best fit in terms of combination of
pricing mechanism, technology and feedback. This would allow households to choose the segment
that fits their situation best. Next, the households could ask the DSO or retailer for this dynamic
pricing intervention combination (perhaps with options to adapt elements further to be in line with
one's personal situation). The toolbox would enable this interaction between households and DSO
and/or retailer. In addition, it would do so in such a manner that personal data and information stay
with the end-user. The end-user keeps control over his/her data, the choice of segment and the
choice for a price intervention.
The role of a DSO in rolling out well-tailored dynamic pricing interventions could thus lie in
facilitating the development of such toolboxes and the segmentation (that serves as a starting point).
However, the DSO should not undertake this without strategic alliances. For credibility and
trustworthiness, it would be good to collaborate with an independent organisation that
intermediates between DSO, energy suppliers, other relevant stakeholders and end-users, whereby it
is clear that this intermediary serves the societal interest and ensures fair play.

- 13 -
1. Introduction: background, scope and focus
1.1. Background
In the face of increasing intermittent resources, decentralised generation, the expectation of further
electrification creates an unprecedented pace of change within the electricity supply industry
worldwide (IEA DSM (www.ieadsm.org)). These changes pose a number of challenges to in particular
DSOs and TSOs in relation to the balance of supply and demand. Many studies investigate options to
change the current system where electricity is provided ‘on demand’ in response to the energy needs
of end-users. To secure grid balance, energy production and demand need to become more
integrated and the concept of smart grids is being deployed worldwide. At the same time, smart
meters find their way to an increasing number of households which gives rise to questions as to why
we have smart meters when the rates are still dumb (Faruqui and Palmer, 2011). The increasing
interest in demand reduction and demand shifting has resulted in discussions about how to best
encourage household end-users to change their energy behaviours and more specifically how to
motivate households to shift (and reduce) energy consumption. If end-users can be incentivised to
decrease their energy consumption during peak hours, this may prevent the need to extend the grid
and thus save considerable costs. Therefore, DSOs and TSOs regard dynamic pricing primarily as a
useful tool for peak shifting (peak clipping) rather than overall consumption reduction
(conservation). In view of the current centralised supply system and their wish to use the distribution
infrastructure cost-effectively, DSOs and suppliers regard peak shifting as more important on the
short term than average load reduction or conservation (Landis+Gyr, 2009).
For end-users at the household level, dynamic or time-dependent price incentives offer a way to save
money and to gain more insight in their own energy consumption patterns and related costs. Cost
savings can result not only from reduced energy consumption, but also from shifting consumption.
Dynamic pricing may also help end-users becoming more aware of the varying price of electricity
and taking a more pro-active role as energy users and producers (e.g. in case of decentralised
applications like rooftop PV panels; or when they offer electricity storage capacity in the future -
Electric Vehicles). For society at large, shifting may serve environmental goals (e.g. when it allows for
more decentralised energy generation) and the common societal goal of maintaining the stability of
the energy system. A mass roll-out of dynamic pricing would involve a paradigm shift in thinking
about the use and production of electricity among many household end-users and supply side
stakeholders. We are used to set electricity prices that change on a yearly basis. Electricity prices at
the APX index are currently not reflected at all in consumer prices, nor are the varying costs of
transport. Suppliers could offer dynamic tariffs for delivered electricity and DSOs can vary the
transport-tariffs. A cost-reflective approach can bring about awareness of the fact that a reliable
electricity supply brings along costs; or that, if supply and demand are well balanced real-time, this

- 14 -
could potentially also result in lower electricity costs. The focus of this study is on electricity and
options for behavioural change by means of Demand Response through the use of dynamic pricing.
Having a strong interest in demand shifting, and a (less strong) interest in demand reduction, Dutch
DSOs have questions how to best design a dynamic pricing approach so that it encourages household
end-users to change their energy behaviours. The Dutch DSO branch organisation Netbeheer
Nederland and the authors have formulated the initial research question as follows:
Which dynamic pricing approaches (being a combination of a dynamic price incentive, technology
and feedback) work best for which end-users and under what circumstances in the Netherlands?
Price-incentives are a central element in this study. Other approaches that do not include a price
incentive (e.g. complementary currencies) therefore receive less attention because they fall outside
the scope of the initial questions - not because they a priori considered less useful.
1.2 Scope and focus
First of all, this report is based on a review of existing studies, reviews and pilots that report on the
impact of price incentives to shift and/or reduce energy consumption at the household residential
level. This review aims at learning more about what type of approaches work best, for whom, in
which context and under what conditions. Regarding the conditions, we focus on what would work in
the Dutch context and what role DSOs could and/or should take. Second, on the basis of this learning,
and on the basis of discussions with the Dutch DSO branch representatives and practitioners active in
starting dynamic price pilots, we have developed a step-wise approach towards designing a demand-
management approach that consists of several building blocks which can be designed and combined
in various ways. These building blocks include dynamic price-incentives, supportive technologies, and
feedback. Third, in addition to this, we also pay brief attention to the process of designing such an
approach, and the role(s) that Dutch DSOs can take and what considerations appear important. The
second and third parts result in a toolbox for practitioners and will be made available in Dutch
language.
This report reviews relevant literature, thereby trying to focus on those elements around behaviour
and behavioural change in relation to dynamic pricing that so far have not been addressed in a
satisfactory way. In addition, we will also address the building blocks of the toolbox, and conclude
with lessons, a recommended direction for DSOs (to further explore) and remaining dilemma’s and
unsolved issues that need further research and/or piloting.
1.3 Method and considerations
We started with a review of empirical evidence and conclusions from existing studies, cases, pilots,
experiences, and assesses these outcomes in order to arrive at conclusions and recommendations

- 15 -
that are grounded in sound empirical evaluation.
The following questions served as a basic guideline while conducting the research:
What possibilities exist to use dynamic pricing (in combination with smart meters) to effectively
change energy behaviours at the household level?
Incentives and interventions can aim at demand reduction and/or demand shifting: do these two
present a trade-off or a win-win?
What are effective combinations of incentives, technologies and feedback?
What role(s) can/should the DSO play in the design and implementation of interventions that
aim at changed behaviours to achieve demand reduction and shifting?
What issues around trust and privacy need to be addressed?
What specific Dutch context factors make some approaches more appropriate for the Dutch
context than others?
Relevant findings were first collected in a large overview (summarised in Annex 4). However, while
doing so, we became aware that several studies (and reviews of studies and pilots) present
conclusions that give rise to questions. Several reviews gather and summarize outcomes of studies,
pilots etc. (see Annex 4) without giving due attention to the manner in which these outcomes have
been arrived at. Several studies can be suspected for presenting overly optimistic interpretations of
pilot results, which easily happens due to a number of reasons (Klopfert and Wallenborn 2011):
Studies and reviews that extensively report on failure and on disappointing results of pricing
pilots are less widely available than the positive ones. One could argue that this relates to the
overall positive outcomes of pricing pilots. However, a more realistic explanation would be that
pilot initiators are more interested in sharing successes than in sharing project ‘failures’.
Self-selection of participants results in distortions. If only very motivated participants participate
(instead of using a representative sample) then the pilot results lead to over-optimistic
conclusions
Many studies do not even report what the response rate was to their pilot; this makes it difficult
to place outcomes in perspective (e.g. impact of intervention on saving and/or shifting).
Most studies do not account for the Hawthorne effect, which involves that people behave
differently when they know that they are being studied; it increases their motivation to achieve
the task that is being investigated compared to situations where participants do not feel being
observed. A way around this is e.g. first only installing a smart meter to observe any changes in
behaviour before actually implementing other interventions. The Hawthorne effect is likely to
play an increasingly diminishing role as the duration of pilots increases.
Most studies do not account for drawback effects: when an intervention is new, people respond,
but as the newness wears off over time, the response of people diminishes. So in the short term
an intervention may appear very successful, but in the longer term people are likely to fall back
to their old behaviours. (Important is to evaluate the persistence of behavioural change after a
period longer than one year; in addition ways must be found to make the new behaviours into

- 16 -
routines - so that it doesn’t matter that the newness wears off).
Surveys held before or afterwards may invite socially acceptable answers from respondents (a
way around this can be to address the same item with very different questions).
Many pilots have been done in the US and transferability of those conclusions to European
contexts is problematic because of differences in climatic circumstances.
An important limitation of most pilots and studies is that they focus on whether price incentives
have had an impact in terms of saving or shifting, not addressing the question how end-users
decrease their energy use if they do so.
These are not just issues of interest to researchers, they have a crucial impact on how the outcomes
of studies are being valued and translated into recommendations. In our view, many pilots and
projects start with a focus on economic incentives in combination with technology, intended to bring
about changes in end-user behaviour. By taking a techno-economic starting point, and assuming that
a part of the end-users will and a part of the end-users will not respond to financial incentives (the
dynamic prices), these studies seem to ignore the fact that end-users can have various motivations to
change their behaviour - a financial motivation being one of these. Most studies conclude with
recommendations to design a one size fits all dynamic price approach which then in practice may
turn out to be not effective nor cost-efficient.
In our review, we explicitly search for a better understanding of why and how end-users change their
behaviour. Rather than starting an intervention with selecting instruments (price incentive,
technology, and feedback), we propose to turn the process around and take the end-users as a
starting point in the process of designing a dynamic pricing approach. When we know more about
the end-users, their needs, motivations and behaviours, we are better able to design a dynamic
pricing approach that also fits their interests and needs (Breukers et al, 2009).
We will however start with an introduction to dynamic pricing mechanisms, load shifting, then
continue with essential components of a dynamic pricing approach (technology and feedback), and
then discuss behavioural change and how to put the end-user centre stage to any pricing
intervention. We continue with a reflection on the Dutch context and the role of the Dutch DSOs and
conclude with recommendations, lessons learnt, and remaining dilemma's.

- 17 -
2. Dynamic pricing
Price incentives aim to achieve a shift and/or a decrease in overall energy consumption. When these
incentives vary according to time (e.g. hour of the day, season, critical peak periods), it is called time-
dependent or dynamic pricing. Dynamic pricing became first relevant in areas with summer and
winter peaks in demand combined with supply constraints where the demand during critical hours
needed to be reduced and shifted to off-peak hours (California, Ontario, North-eastern parts of the
USA and parts of Australia) (Darby 2006). For other countries, increasing issues with balancing
demand and supply and expected expansion of micro generation inform the recent heightened
interest in dynamic pricing.
Generally, DSOs and energy suppliers regard dynamic pricing first and foremost as a potentially
effective means to achieve a better balancing between demand and supply and realising security of
supply. Next, for DSOs that have a clear public task (like the state-owned DSOs in the Netherlands)
the overall societal aims in terms of increasing energy efficiency, energy conservation and facilitating
the deployment of renewable energy that ask for strategic load shifting to high supply hours are also
aims that can be supported by dynamic pricing. Several studies and reviews conclude that these
pricing schemes all have the potential to result in a shift in demand and in a reduction in demand
(Faruqui and Palmer, 2011; 2012; Stromback et al, 2011). Dynamic pricing can be coupled to
automatic and remote control of appliances (e.g. washing machine, dishwasher, thermostat). The
dynamic tariff can apply to both the energy-price of suppliers and/or the price of transporting the
energy by the DSO or TSO. The most common forms of dynamic prices are briefly presented below.
2.1 Time of Use (ToU) pricing
Time of Use (ToU) tariffs are recurring daily and aim at encouraging people to use energy during
periods of the day when overall energy consumption is lower. In principle, ToU is not aimed at
reducing overall energy demand, merely at shifting the demand from one period to another. The
peak hours are invariable and known a long time in advance by the end-users. A day can have one or
more peak periods during which the prices are set higher in comparison to the prices for the rest of
the day. Two to four levels of prices may be distinguished (peak, partial peak, off-peak, and weekend
tariff) and in addition, prices may also vary according to the season (Stromback et al, 2011:83,84).
Annex 1 lists several trials conducted in Europe with ToU pricing - in Northern Ireland, UK, France,
Germany and Norway. The realised peak reductions in these pilots vary from 0 to 12%.
Many studies only focus on the achieved peak reduction, but some also metered the increase during
partial peak or off-peak periods. For example in a large roll-out of ToU in the region of Trento in Italy,
the morning peak moved from 7-8 o’clock to the partial peak period of 6.45-7.15 but this peak was
less high than the previous peak, which means that the remaining demand was shifted to off-peak
periods. In this case there was no overall reduction of consumption (Torriti 2012).

- 18 -
2.2 Critical Peak Pricing (CPP)
Critical Peak Pricing (CPP) schemes offer lower year-round tariffs during non-peak hours in exchange
for substantially higher tariffs during critical peak hours. Critical peak periods or event days occur at
times of increased wholesale prices due to heightened consumption (e.g. very hot or cold days) or
when the stability of the system is jeopardized (e.g. risk of black-outs). The maximum number and
length of critical peak periods is agreed upon with the end-user in advance. However, the exact
moments when critical peaks occur cannot be set in advance as these depend on market and
weather conditions. Usually, households are informed a day in advance of an expected critical day
(Stromback et al, 2011:83). The number of critical peak days vary from 1 to 18 a year (San Diego Gas
& Electric Company 2010).
Often CPP is the winner over other pricing mechanisms in terms of reduction and shifting potential,
but this should be placed in perspective since CPP only is accomplishing this during the peak days
while ToU schemes are at work seven days a week (Stromback et al, 2011). CPP also raises questions
about fairness, e.g. for those who are less well able to shift during critical peaks (e.g. people who
need to stay at home and cannot not use during CPP event days) - which is why it is usually voluntary.
One European example of the use of CPP is the TEMPO Tariffs pilot that EDF started as an experiment
in France in 1989- 1996 and which recruited some 400,000 end-users. The programme combines ToU
with CPP and has been quite successful with an overall national peak reduction of 4%. ToU in
combination with CPP can achieve a load shifting up to 30% (for a limited number of days and hours
a year) and supplemented with load control this percentage has in cases (outside of Europe) risen to
50%. In Sweden this percentage of 50% has also been reached - thanks to electric heating and water
heaters that provided significant flexible loads and thus good opportunities for shifting.
2.3 Critical Peak Rebate (CPR)
With Critical Peak Rebate (CPR) schemes the end-user is refunded at a predetermined tariff for any
reduction in consumption relative to what the utility expected the household to consume during a
few critical peak hours a year (usually during very hot summer afternoons, or very cold winter
evenings). Like with CPP, the maximum number and length of critical peak periods is often agreed
upon in advance. And like with CPP, the exact timing cannot be predicted as it depends on market
dynamics but usually end-users are notified a day in advance of a critical day. (Stromback et al,
2011:83). Because with CPR participants benefit from participation, unlike with CPP where
participants can be financially 'punished', this scheme may be more appealing to end-users. It is also
a relatively new form of pricing which has not yet been used in a large number of pilots.
In Europe the need for load shifting during a limited set of hours in a year is less felt than in countries
with great climatic differences and either extremely hot or cold days and therefore CPP and CPR have
not seen a wide roll-out in Europe. One exception being France where the TEMPO project combined
CPP with ToU tariffs. scheme. In addition CPP and CPR are particularly useful when there is a

- 19 -
significant flexible load (e.g. air conditioning (AC) and electric heating that can be turned off during
peak hours, and in Europe these technologies are less widely used then in countries such as the US,
Australia and New Zealand. Consequently, most findings of CPP and CPR pilots are from outside of
Europe - with peak shifts of up to 38%. Effects have been shown to be lasting during long-term pilots
(Stromback et al, 2011).
2.4 Real-time pricing (RTP)
Real-time pricing (RTP) means that the end-user pays a price that is tied to the electricity price on
the wholesale market. To encourage consumption reduction during high price periods and reduce
risk of high bills, end-users can be informed when wholesale prices reach a certain threshold (e.g. by
an text message alert) so that they need not check the prices continuously (Stromback et al,
2011:83). RTP has also been trialled as day-ahead real time pricing which poses fewer technical
challenges. to be truly effective RTP schemes need to be connected to smart appliances (price to
device) that automatically respond.
RTP means that the end-user pays a price of electricity on the wholesale market reflects. He/she pays
a price linked to the price of electricity on the APX. It is especially useful if the end-user can receive a
signal (e.g. an SMS alert) when prices exceed a certain threshold - so that the end-user need not
keep their eyes on the prices all day. RTP has also been tested as a day-ahead RTP which is
technically less challenging. A limited number of pilots that have not produced robust results show
the following percentages (Frontier Economics and Sustainability First, 2012; Stromback et al, 2011):
13% reduction on the basis of peak 3 European pilots
10% peak reduction on the basis of 12 American pilots
In a US pilot where one group participated in ToU and CPP pricing, and the other group in RTP, the
latter showed a weaker response (the peak reduction in the RTP pilot was 17% versus 20% peak shift
in the ToU and CPP pilot). RTP is experienced as complex by end-users which may have influenced
the lower results with the RTP pilot (Frontier Economics and Sustainability First, 2012). A pilot study
in Norway with 81 participants gave non-significant results (Frontier Economics and Sustainability
First, 2012). Like with CPP/CPR, automation of remote controllable appliances is likely to enhance the
response - particularly in case of flexible loads like AC or electric heating. (Frontier Economics and
Sustainability First, 2012).
2.5 Inclining Block Rate (IBR) pricing
This scheme is the least common scheme. Prices increase in steps as consumption increases. This
pricing mechanism has been proposed as a complement to e.g. ToU or CPP and serves mainly
conservation goals. As the name indicates, Inclining Block Rates offer block-wise increasing rates.
As a household consumes more, the rates increase. The first block is the cheapest, sometimes even

- 20 -
free, and subsequent blocks are increasingly expensive. IBR is mainly seen as an incentive to
encourage reduction. The few pilots, for example in California and Japan showed that a small group
of end-users with a very high consumption showed most response. In Belgium, and IBR system is in
place since 2001, with the aim to help low-income consumers to keep their spending on energy
within limits. However, it has had little effect on the consumption of the poorer households, because
they appeared not to be aware of the existence of this mechanism (CREG, 2010).
2.6 Dynamic pricing and Conservation
Most dynamic pricing schemes mainly focus on realising a displacement of the demand to off-peak
periods, but some such as the inclining block rate also aim for overall reduction. A review of 5 large
studies conducted mainly in the North-West of Europe concludes that: “(…) in best cases a
consumption reduction of 2-4% can be expected in the short term. This corresponds to around 15 to
30 Euros saved per year for an average European household (3,500 kWh at 0,20€ per kWh). The best
cases include a smart meter that is linked to an IHD (direct feedback) or to accurate billing, with
energy efficiency advice.” (Wallenborn & Klopfert 2010:21). In US pilots, we see similar savings
percentages (EPRI 2008). ToU schemes in general will not explicitly aim at reduction, although
consumers can become more energy-literate and reduce their energy consumption in the process.
With CPP and CPR there is a larger reduction to be expected because often the energy which is not
consumed during these critical hours or days is unlikely to be fully compensated for with
consumption at other times. E.g. if the air-conditioning or electric heating is turned off for a few
hours, this will not be compensated for at other times. There is also a potential danger of increased
consumption as a result of dynamic pricing, as the Italian Trento ToU project demonstrated. The off-
peak tariff was so low that even with increased consumption the energy bill of households still
showed cost-savings, whilst their comfort level had increased. An increase of 13% had been
witnessed (Torriti 2012).
2.7 Responsiveness to dynamic pricing
The responsiveness of end-users depends, first of all, on the characteristics and resources of the end-
users themselves (more about that in the following sections below), the shift able loads in their
households (e.g. electric heating and AC offer good opportunities with minimal loss of comfort), and
it depends on the duration of the periods of high pricing as well as the ratio between peak and off-
peak prices (Faruqui and Palmer 2011; Stromback et al, 2011). Faruqui and Palmer (2012) have
indicated that the response on increasing tariffs follows an ‘arc of price responsiveness’ which means
that the amount of demand response rises with the price ratio but at a decreasing rate. A New
Zealand study among 400 households showed that end-users who decreased electricity consumption
did increase their response to inclining lower tariffs during off-peak periods but that their response
did not differ when faced to pay 8 or 18 cent per KWh in peak period (Thorsnes et al, 2012). The

- 21 -
optimal ratio between peak and off-peak tariff for different segments is a topic for further piloting
and research.
In addition, for both CPR and CPP, the responsiveness of participants increases when the change in
tariff is announced timely (e.g. a day rather than an hour in advance) and when the duration of the
price change is not too long (4-6 hours rather than 6-10 hours) (EPRI 2008). In combination with
remote control of appliances the responsiveness can double.
2.8 Shifting demand, shifting loads
Figure 3 and table 2 below look at ‘load management’ options from a supplier or DSO point of view,
summarizing the ways in which load may be managed and with different purposes (from matching
renewable production to reducing peak demand). These load management options can be realised
using dynamic pricing, sometimes in combination with automated, utility- or household remote
control. We will not discuss forms of load management that have not been piloted in Europe or that
are technologically extremely challenging, nor will we discuss load management forms that
predominantly need the involvement of large energy-users (e.g. industries). Our focus lies on
strategies aimed at changing household demand patterns, that can in principle be readily
implemented - and then our specific focus is on better understanding behavioural aspects related to
those demand patterns. This means that the use of pricing mechanisms in this study is mostly
focused on peak clipping or load shifting.
The six load management options fall into three main categories (http://bee-
dsm.in/DSMTheory_1.aspx):
Load management programmes that aim at redistributing energy demand to spread it more
evenly throughout the day.
Conservation programmes aimed at reducing energy use.
Strategic load growth programmes aimed at increasing energy use during some periods, e.g.
to encourage the use cost-effective electrical technologies or the direct use of intermittent
sources.
Peak clipping (figure 3) is an option that can be used to meet extreme demand on critical peak hours
or days, in combination with CPP and CPR. Often the avoided electricity consumption realised with
CPP and CPR is not consumed at other moments, because it often involves the turning off of high
flexible loads such as air-conditioning or electric heating. An overall reduction of consumption can of
course also contribute to peak clipping. Strategic conservation is focused on the permanent
reduction of consumption in both peak and off-peak periods and can be realised by a combination of
ToU and inclining block rates. Valley filling is an option that has the purpose of flattening out the load,
in principle industry with a base load that runs continuously already demonstrate a flat load. In the
future valley filling will be an option to maximise the use of intermittent renewable sources that
produce during those valley hours, e.g. solar. Real Time Pricing will be a logical pricing mechanism for
this option.

- 22 -
Flexible load shape is the most complex option and will be an option for the future where many
intermittent renewable sources, storage options such as EV and heat pumps, micro-CHP, and smart
appliances interact with an household demand and ask for a on a need basis direct response from
the household. Real Time Pricing will then most likely be used as dynamic pricing mechanism in
combination with utility control of storage and demand technologies. Strategic load growth occurs
only when specific technologies are added to the household mix such as EV or automation, and
these can then be used to also allow for flexible load management.
Figure 3: overview of load shifting options

- 23 -
Type of shift
Definition & relevance for households?
Which price mechanism & why
Implications for technology, feedback and remote control?
Peak clipping:
Peak shaving and clipping both aim at a non-shiftable reduced electricity consumption in critical peak periods (when overall demand is high). Relevant for households.
CPP, CPR potentially with ToU
This option is traditionally accompanied by remote utility control and needs remotely accessible appliances (e.g. thermal and cooling)
Valley Filling:
Encouraging an increase of energy use during off-peak periods (in order to make the production and supply system more efficient, e.g. to use intermittent renewable generation or to increase cost-effectiveness of certain energy intensive technologies). Currently more relevant for large energy users but in the future with micro grids and decentralised generation on household level households will also benefit from valley filling.
ToU, RTP, and to a lesser extent CPP, CPR
This option requires a relatively dynamic price information to allow for cost-effective use, or a link to renewable generation information. Automation can facilitate the effective response of appliances. But households can also manually shift demand, e.g. tumble dryers, washing machines and charging of EV.
Load Shifting:
Regular moving of demand from times of high to times of low demand (resulting in demand increase during off-peak hours and demand decrease during peak hours) Relevant for households.
ToU most effective, in combination with CPP, CPR
This option allows for most influence of household members to respond through changes in behaviour, and not necessarily with assistance of automation.
Strategic
Conservation:
Overall and constant reduction in
consumption
In principle dynamic
pricing is not the first option to achieve strategic conservation. tailored tips, tricks, installation of energy efficient appliances and changing of routine behaviour is more suited.
Automation can help to
achieve strategic reduction by controlling thermal devices such as the fridge, AC, thermostat and regularly turning devices off (without compromising comfort or hygiene)
Strategic Load Growth:
Strategic load growth allows for an overall increase of load level because of the installation of automation or additional technologies such as EV that will also allow for a more flexible load shape to develop. The load growth can, just as is the case with valley filling, also take place strategically during specific moments of the
day or certain days to match generation by intermittent and renewable sources such as windy or sunny days or moments. For large users and in future with increased integration of EV and renewable also for households.
RTP or a new version of CPP is the best option to encourage temporary load growth
functions most effectively with automated remote control unless the predictability of the need for increased demand is increased.
Flexible Load Shape:
This entails the ability of the demand side to respond to sudden generation changes in real time by providing reserve - e.g. when wind produced electricity is lower due to forecast errors. For households and companies that have reserve capacity (e.g. electric vehicles; decentralized energy generation)
RTP, CPP, CPR In combination with EV, decentralized energy generation.
Table 2: different forms of load management

- 24 -
2.9 Load shifting and/or reducing?
From the perspective of DSOs there is the tendency to focus on shifting only, because net stability is
the priority concern that DSOs need to address for the short, medium and longer term. However, a
single focus on shifting only can have severe perverse effects, as two examples show. First, the top-
down mandatory enrolment of a ToU in Trento, Italy, aimed at shifting only. This shifting was
achieved, but the end-users increased their overall energy consumption while lowering their bill.
While overall costs decreased, an overall increase in consumption of 13% (!) and new peaks and large
shoulders resulted (Torriti 2012). An OECD study among 10,000 households in different EU countries
also showed how incentives that solely aimed at shifting resulted in cases in overall increases in
energy consumption, for instance because people decided to run half-filled washing machines during
times of low tariffs. While for energy suppliers, this inefficient behaviours may not be a crucial issue,
for Dutch DSOs that also aim at furthering the common interest of attaining a more sustainable
(hence more efficient) energy system, such outcomes should of course be prevented.

- 25 -
3. Essential components of a dynamic pricing approach:, technology and
feedback
Dynamic pricing is a means to an end - or to several ends - like for instance to balance supply and
demand; to prevent the need for grid extension; to achieve end-user energy saving; to raise
awareness; to more actively engage end-users and decentralized producers. A dynamic approach
consists of the following three elements: the pricing mechanism, supportive technology and
feedback. Pricing mechanisms (e.g. ToU, CPP, CPR, RTP) have been discussed above. Below we turn to
the elements technology and feedback.
3.1 Technology
As for technology, this covers a wide range of supportive and feedback devices, of which smart
meters and In-House-Displays can be considered as absolute ‘must-haves’ in combination with
dynamic pricing. An important technology is the In House Display (IHD) which provides feedback in a
variety of forms and has been shown to significantly improve the response from end-users
(Stromback et al, 2011). Other useful technologies include ambient displays like energy orbs, smart
apps, websites, email services, but also very simple devices like paper mailings, fridge magnets or
stickers (figure 4) and water saving showerheads.
Figure 4: Example of a sticker indicating the time bands (CER 2011: 56)
A crucial precondition to work with dynamic pricing is the presence of smart meters. Both national
and EU energy policy aim for a widespread roll-out of smart meters. In fact the latest EU directives
stipulates that a European roll-out of 80% of the smart meters by 2020 is mandated
(Directive 2012/27/EU). The smart meter is a needed for actual and real-time metering of the energy
consumption patterns. This allows for the design of a tailored feedback that takes account of the
particularities of the household. The smart meter makes a two-way communication possible

- 26 -
between households and utilities or suppliers, depending on which party is responsible for the roll-
out of the smart meter. In the Netherlands the DSOs are responsible for the roll-out. However,
households have the opt-out option whereby they the smart meter is installed in their homes but
administratively disconnected, which entails that the smart meter is not sending data out of the
home to any third party. The household itself can still make use of the data by means of technologies
such as e.g. usb energy sticks or wireless plug systems.
Smart meters are promoted by policies that aim at achieving energy efficient behaviours and
encouraging end-users to become more active participants in the energy market. While information
feedback is considered useful to inform end-users on their current and past energy consumption and
associated costs, the addition of dynamic pricing is considered potentially useful to encourage a shift
in demand. Some ask rhetorically what the use would be of having smart meters with dumb rates
(Faruqui and Palmer, 2011). Others however, point out that meters nor rates in themselves will cause
changes in consumer behaviour. Based on their review of 6 large Northern European studies, Klopfert
and Wallenborn indicated that a 2-4% reduction in electricity consumption can be achieved through
combinations of smart meters and feedback (including dynamic prices), but only when consumers
have opted for its use. No such effect is observed when smart meters are installed without the
explicit agreement of consumers (Klopfert & Wallenborn; 2011). Frontier Economics has investigated
the costs and benefits of smart meter roll-out in Germany and concluded that full-scale mandatory
rollout of smart meters in Germany is not cost-efficient. Instead it is suggested to install the meters
only in those households where the saving potential is highest and where the residents themselves
think installation is worthwhile. In addition, a variety of factors may play a role depending on the
particular housing characteristics, appliances and equipment, size of the house and consumption
patterns. The benefits of any given technology option will differ for different households (Frontier
Economics, 2011). This conclusion highlights the need for a segmentation approach to the roll-out of
the smart meter and the accompanying dynamic pricing. Even if there is a large theoretical potential
for energy saving and shifting in households, the extent to which this potential can be realized
depends on which households are willing to participate actively and respond to information and
incentives by reducing and/or shifting their consumption. Working with estimations on how ‘average’
households will respond are of no use, because the actual saving potential can vary from household
to household. We will discuss segmentation in detail in section 4.
3.2 Automation and remote control
More complex technologies that support behavioural changes in response to pricing include all sorts
of smart appliances that can be programmed to respond to (changes in) information and/or remote-
controlled. The following two types of automation can be distinguished:
1. remote-controlled end-user appliances, not involving any further agreement of the end-user
other apart from his/her agreement to participate
2. through the use of interfaces (smart thermostats or websites), which allow end-users to

- 27 -
choose the extent to which they want their appliances to respond to price signals.
In principle, the advantages of automation and remote control is that it allows for very quick
responses and controllable levels of reduction, that it is available when system emergencies occur
unplanned and when households are unable to take action (e.g. when away or asleep). At the same
time, there is no evidence showing that with this second type of automation, the extent of
participation to critical events is any lower than when appliances were remote-controlled (Stromback
et al 2011).
Well-known examples of automation in combination with pricing come from countries were AC or
electric heating is widespread (e.g. the state-wide California pricing pilot and the SMUD pilot in the
US (SPP 2004) which then are programmed to respond to peak periods. Most cases on which figure 5
below is based, stem from such countries.
Figure 5: Impact of automation on peak clippings (Stromback et al 2011: 58)
(nr of trials without automation: CPP: 69; CPR 16; ToU 215; RTP 15; nr of trials with automation: CPP 29; CPR 11; ToU 35;
RTP 10)
These levels of response to CPP and CPR will most likely not be reached in Europe, since the climatic
circumstances and the availability of flexible loads with great potential are different. Automation

- 28 -
systems can also include lighting, white goods and entertainment equipment, which is most likely the
automation form that would fit the European countries with moderate climates without temperature
extremes and without electric heating. Automation can include very low-cost options like for
instance using a time-clock that makes sure that the fridge turns of 15 minutes at set intervals.
However, it can also include high-cost options when smarter appliances have to be purchased and/or
made suitable for remote-control, and become part of full Home Energy Management systems,
security systems, with couplings to personal computers (PCs), smart phones or pads.
A crucial precondition for effective use of automation is that the end-user understands the
technology and appreciates it. In addition several studies highlight the concerns consumers have to
hand over control over their energy demand to third parties. In fact on average throughout European
countries, the majority of consumers do not wish to hand over control to a utility. In the Netherlands,
this amounts to 53 percent of the respondents that said no to utility control (Accenture, 2010 a,
2010b; Ryan & Blackmore, 2008).
Since automation and other technologies are intended largely to interact with the end-users and are
intended to be integrated in their homes, this interaction should fit the needs, wishes and
capabilities of the end-users. Different (segments of) people are likely to appreciate technologies
differently. In addition, people may change their appreciation - changing from an initial hesitant
attitude to a more enthusiastic one or changing from enthusiasm to weariness with a particular
technology. An important question in this light is for instance how to keep the IHD interesting for
users over time (Van Dam et al, 2010). Hence, the choice of technology needs to be tailored to the
changing needs of end-users to achieve optimal effectiveness. And to achieve this tailoring,
segmentation is key.
3.3 Feedback
Feedback intended to support reductions in energy consumption has gained a lot of attention in
research (Darby, 2006; 2010; Mourik, 2011; Stromback et al 2011). Feedback is part of any approach
that aims at encouraging end-users to change their energy consumption behaviour. Traditionally, we
can distinguish between direct, indirect and associative feedback (Darby, 2006). Direct feedback
consists of information that is readily available on request (that is to say that this instantaneous
responds to changes in the energy metabolism, and as the results of shows). Learning from this
feedback takes place through the process of reading this feedback or by having to pay for energy.
The advantage of this form of feedback is that it directly shows the impact of behavioural changes.
Indirect feedback is characterised by a time delay - it is suitable to show the effects of changes in the
heating consumption. Unintended feedback results from (associative) learning, for example when
the bill increases after buying a new device or when the installation of own generation / micro
generation encourages people to read their meter (more often). In addition, we distinguish between
feedback intended to communicate price changes and feedback to communicate (changes in)

- 29 -
consumption patterns and volumes.
A study on effective feedback to encourage behavioural change towards energy consumption
reduction (Mourik 2001) concludes with recommendations that are relevant as well when designing
a dynamic pricing intervention - whereby the relevance will however depend on the characteristics
of each segment. The lessons are summarised as follows (Mourik 2011):
1. Need for a smart meter and user interface, which can be an In-House-Display, a smart phone
App or an ambient technology (e.g. changing light colours)
2. Feedback lasts at least 3 months but preferably is permanent: for any programme to be able to
change routine behaviours, a minimum of 3 months is necessary to have the potential to make
the ‘new’ behaviour lasting. The longer the intervention, the better the chances that the new
behaviour lasts
3. The feedback is direct, without time-delay. Direct feedback allows people to walk around in the
house and experience how turning devices on or off as well as other behavioural changes affect
energy usage. This helps to make energy visible and to set priorities with regard to behaviours
that can be changed and how that will affect energy usage.
4. The feedback is detailed, providing Information about devices, spaces, people and functions (e.g.
cooking, heating, entertainment). Pilots showed that the more detail is provided, the more
effective the feedback is in changing energy behaviours. Detail helps end-users to estimate how
devices, actions, and people contribute to the overall energy usages, which allows them to start
discussing this and set priorities.
5. The feedback is historical, normative and involves goal setting. Historical feedback shows usage
in the course of time, preferably in months. This can be compared with the other months in the
same year or with the same months in previous years. If a normative element is added - showing
usage of similar users in the same period - effectiveness is further enhanced. It should be up to
the end-user to define who count as similar users. Feedback can become even more effective if
end-users set a goal and get feedback about the extent to which they are successful in achieving
this goal.
6. The feedback is positive, graphical and symbolic: the most appreciated display of feedback is a
combination of graphical and textual information. Graphs are preferred to show historical
feedback. Feedback is best positive, not providing too much Information of what has not been
achieved but rather emphasising remaining saving potentials. Symbols like smiley or polar bears
that look happy or not depending on energy consumption have shown to be effective.
7. There is a combination of user-interfaces (device media/locations) at different spots in a
household displaying different Information in combination with particular media. Direct simple
feedback where householders can respond directly is particularly effective when show non home
displays (fixed or mobile). Background information, information on patterns and changes in these
is best provided on a website or via the bill. Certain spaces/rooms may also affect the acceptance
of feedback - e.g. a display near the front door that shows the thermostat temperature and that
tells which lights are still on, is considered helpful as the hallway is a spot where people consider
what is working, what is on/off in the house. The couch in the living room however is more a
place to relax and there people do not want to be incentivized by a display that encourages them
to take action.

- 30 -
8. The feedback system is being continuously improved and updated: a danger of feedback systems
is that they disappear into the background because they no longer provide new information, are
not considered aesthetic, are not inviting much interaction with the end-users. Feedback systems
should be developed as very interactive systems that deliver information that is constantly
renewed and updated (like with a computer or smart phone) and that is of increasing complexity.
9. There is maximum interaction possible with the meter and/or display which results in new
routines around the feedback system. Keeping the end-users engaged is a huge challenge for a
decrease in engagement will make the feedback less effective. However, if checking and using
the system is so easy then it can become a new routine. Coupling the system to other systems
that ask for regular interaction can help (e.g. security system or smart Phone with daily briefs).
10. A supportive social environment ensures that there is no constant negotiation on underlying
norms : The social environment needs to be supportive in order to make the changed behaviour
last. This starts with the household itself: if some members do not participate in the initiative,
the feedback will be less effective overall because this de-motivates the participating members
of the Household. The display and the feedback are tailored to the situation and wishes of each
household (member) : A household is not a homogenous group. Men and women often differ in
their attitude towards energy, their responsibilities within the household. In addition, there are
generational differences in attitudes and motivation. It is important that diverse user can get
feedback that meets their needs and wishes. Communicating consumption patterns can in
general be done in Euro’s, not only when end-users are financially motivated but also when this
is the most tangible unit for people - easier to understand than CO2 or kWh.
11. The feedback also gives personal advice and is coupled to other interventions: the most
successful feedback gives personal advice to each household member. In addition, the feedback
is supported by other interventions like financial incentives, audits, campaigns.
12. There is no negative impact on (perceived) comfort and ease-of-use. When end-users have the
idea that behavioural change negatively affects comfort and ease, they will be less motivated to
change their behaviours. The most successful feedback and communication will show that
changes will result in an increase rather than a decrease in comfort and ease.
3.4 Pricing and feedback
Different pricing incentives will ask for different types of feedback (feedback related to price changes
and feedback related to consumption changes) during the times the price is applicable to, and
feedback on. RTP needs real time feedback on consumption and on price changes. This can be
provided by means of ambient technologies such as light bulbs that start to flicker or change colour
when prices increase and consumption is 'too' high. In addition, users must be enabled to study their
historical usage as well to see what the impact of their changed behaviour has been on consumption
and price. For ToU, the feedback should at least show the attained reduction or shifting in response
to the peak and off-peak tariffs. Some people may want to check this on a daily basis, for others find
a monthly overview sufficient. In addition simple technologies such as stickers or magnets with an
overview of the ToU periods are very valuable to remind people. For ToU the feedback will need to
be provided long enough for new routines to rise. When new routines have become embedded, the

- 31 -
frequency of feedback can be decreased. Providing feedback whenever consumption is increasing
again during peak hours, can be useful as well. Feedback that informs individual household members
of their achievements can be useful, so that they are all enabled to make a well-informed decision
about the best options for reduction and/or shifting.
The more stable the price incentive over time, the more simple the feedback can be. When pricing
incentives are not frequent, and even not fixed in advance (e.g. CPP, CPR), text message alerts, or
other reminders and prompts via email or facebook will work well. The more frequent the feedback
on consumption is needed, the more complex the necessary technology will be: e.g. smart
appliances, real-time feedback, remote control, energy orbs etc.
3.5 Effective load shifting and combination of pricing, technologies and feedback
In some studies results demonstrate that the more combinations are made between pricing
mechanisms, technologies en feedback the higher the response of people (in terms of the achieved
shift and the number of people that respond). Faruqui et al (2010) for example demonstrated after
analysis of multiple large pricing pilots in the US that the combination of ToU, CPP, CPR, with multiple
enabling technologies and feedback technologies generated the highest peak clipping and load
shifting. See figure 6 below. However, this is easily explainable since with such a 'full court' approach
a large section of different segments can be reached. As such the rule ‘more is better’ may apply
when all segments are targeted with a one-size-fits-all approach - using as many technologies and
feedback options as available in order to reach as many different people as possible. However, this
will not deliver the most cost-efficient approach and since the brunt of the costs eventually comes
down on society, it is undesirable from a societal perspective. A New Zealand's pilot that targeted a
particular segment (high incomes, high age, new houses) found that ToU worked fine in combination
with only energy saving tips and a monthly bill that showed the realised shifts during peak-periods
per day (Thornes et al. 2012).

- 32 -
Figure 6: effective combinations of pricing mechanism and technology (source: Faruqui & Sergici,
2009)
With these lessons in mind, a next step is to consider what elements are relevant when designing the
feedback components in a dynamic pricing approach. When addressing messaging and channels (IHD,
billing, website, smart phones, email), different technologies come up which will appeal more or less
to particular end-users. This will also be discussed in the section on segmentation.
3.6 Pre or post-paid energy
Next to price incentive, technology and feedback, the type of payment can be useful to consider.
Here we can distinguish between post-paid and pre-paid systems. In the Netherlands post-payment
is most common. This can also involve long-term contracts whereby end-users sign-up for receiving
electricity for a set price for the duration of a couple of years. Prepayment systems have gained
popularity in Northern Ireland recently. These keypads or pay-as-you-go meters (Darby 2006) allow
households to pay for electricity as they use it - instead of paying quarterly bills. Credit can be topped
up when needed and apps have been launched to make this more user-friendly. In 2006, savings due
to the use of key-pad meters were estimated at 3%. In 2009, 30% (230,000) of all electricity
customers in Northern Ireland were using the keypad prepayment meters1. Of these, 58% are low-
1 with new connections continuing at a rate of 2000 per month

- 33 -
income, 32% middle or higher incomes, including 17% more wealthy consumers. Other countries
that have prepayment systems adopted include the UK, Australia, Argentina, South Africa and
Belgium. In the UK, prepayment meters are popular among very low income households, because it
gives them budgeting control and avoids worries about bills and becoming indebted - which
outweighs disadvantages such as the risk of self-disconnection and self-rationing. A large scale
survey (Electricity Association 2001) showed that 85% preferred this method of payment, even when
the respondents were aware of it being more expensive than alternatives (which is the case in the
UK). In Flanders, Belgium, each household receives a free amount of electricity; senior and disabled
citizens get an additional amount as part of a social tariff provision. While electricity suppliers have
no obligation to deliver to households that do not pay their bills, the DSOs have the social obligation
to serve end-users in their area that are unable to stay with their existing supplier or find a new one.
EANDIS is such a ‘social supplier’ and installs prepayment meters that operates with a budget meter
card, for each new end-user it takes on in this manner. The social electricity provision is such that
households cannot completely self-disconnect (Owen and Ward 2010: 23).
Currently, two prepayment meters are in use. The first type, non-smart token meters (e.g. UK) work
as follows: customers buy a token from a Pay point for a fixed amount (say £5). When the token is
inserted into the meter, the meter operates with the energy credit/debt value on the token but does
not gain any other information. These meters have to be manually re-set (requiring a supplier visit)
when tariffs change (e.g. in the UK). The second type are the semi-smart keypad meters (e.g.
Northern Ireland), where customer buys credit from a Pay point for a fixed amount (say £5) which is
added to the key or card or embedded in a vend code (keypad meters). When the card or key is
inserted into the meter, (or the code is typed into the keypad) the meter operates with the monetary
credit/debt values and also receives any updates needed to tariff rates. It is these semi-smart meters
that allow for offering a wide range of ToU tariffs.
In the Netherlands, both Eneco and Essent have done trials with prepaid electricity.2 Both
companies have however decided to discontinue their trials. A keypad meter like the one in Northern
Ireland is very user-friendly with displays that can provide feedback in several ways and formats,
depending on the end-user preferences. In addition, credit can be topped up in various ways - by
phone, at pay points, or online. In Northern Ireland the prepayment scheme, originally intended for
fuel-poor households, has become a commonly chosen payment scheme.
2 Newspaper TROUW 19.11.2007
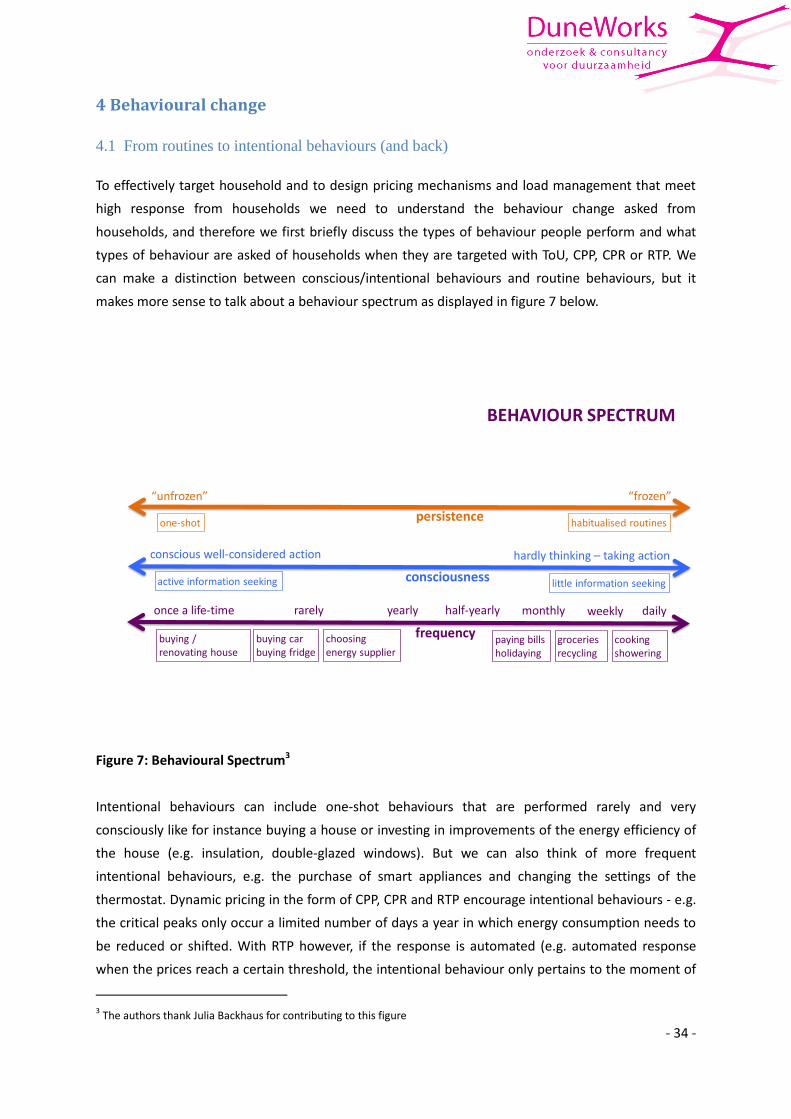
- 34 -
4 Behavioural change
4.1 From routines to intentional behaviours (and back)
To effectively target household and to design pricing mechanisms and load management that meet
high response from households we need to understand the behaviour change asked from
households, and therefore we first briefly discuss the types of behaviour people perform and what
types of behaviour are asked of households when they are targeted with ToU, CPP, CPR or RTP. We
can make a distinction between conscious/intentional behaviours and routine behaviours, but it
makes more sense to talk about a behaviour spectrum as displayed in figure 7 below.
frequency
consciousness
persistence
dailyweeklymonthlyhalf-yearlyyearlyrarelyonce a life-time
cookingshowering
groceriesrecycling
paying billsholidaying
choosing energy supplier
buying carbuying fridge
buying / renovating house
hardly thinking – taking actionconscious well-considered action
little information seekingactive information seeking
“frozen”“unfrozen”
habitualised routinesone-shot
BEHAVIOUR SPECTRUM
Figure 7: Behavioural Spectrum3
Intentional behaviours can include one-shot behaviours that are performed rarely and very
consciously like for instance buying a house or investing in improvements of the energy efficiency of
the house (e.g. insulation, double-glazed windows). But we can also think of more frequent
intentional behaviours, e.g. the purchase of smart appliances and changing the settings of the
thermostat. Dynamic pricing in the form of CPP, CPR and RTP encourage intentional behaviours - e.g.
the critical peaks only occur a limited number of days a year in which energy consumption needs to
be reduced or shifted. With RTP however, if the response is automated (e.g. automated response
when the prices reach a certain threshold, the intentional behaviour only pertains to the moment of
3 The authors thank Julia Backhaus for contributing to this figure

- 35 -
deciding to automate the response).
Routine behaviours are the recurring, habitual behaviours that affect how we do our daily things
(cooking, washing, caring, working, etc). We can change unconscious routines by making them
conscious first. Then an intentional behavioural change is possible which subsequently needs time
become a new habit. Examples are changing the moment of dishwashing to other set times of the
day or evening; or changing routines in showering - showering less long, less frequent or using less
hot water. ToU asks for changes in routine behaviours as end-users are encouraged to permanently
perform (different) behavioural patterns at different times of the day/night. People need at least 3
months to get used to new (dishwasher, washing machine, cleaning, entertainment, eating) routines
during which (and preferably longer than that) reminders and prompts are crucial (Abrahamse et al,
2007; Darby, 2006; Fischer & Duscha, 2008; Janssen et al, 2007;Martiskainen, 2007). In addition since
it involves the changing and settling of new routines, the effectiveness of ToU increases over time:
people unfreeze their old ways of doing, adopt new ways of doing which over time become
established routines. They may even purchase necessary appliances like for instance timers to help
them control the energy usage of certain appliances (Filippini 2011; Thornes et al 2011; Torriti 2012).
Generally speaking, investment and intentional behaviours are easier to perform compared to
changing routines (Breukers et al., 2009; Mourik et al., 2009; PwC2009). When changing routines,
people find turning off the lights easier than using dishwasher and washing machine more efficiently.
Turning appliances off is an even more difficult routine to adopt. Decreasing temperatures or
decreasing level of coolness (in summer) is done less easily as this is perceived as directly impacting
on the need for comfort. And turning off the stand-by mode is done even less frequently as it affects
the perceived need for convenience and control (people often worry that that programmed settings
are lost when turning the appliance really off) (DEFRA, 2007). Hence, there appears to be a negative
relation between changing routine energy behaviour and the need for comfort and convenience. This
also has consequences for the effectiveness of price incentives that target demand shifting through
routine behavioural changes.
4.2 Behaviours and potential load shifting
Table 3 summarises the theoretical potential for load shifting and the reduction for different types
of loads (appliances and practices) of households. Annex 2 provides for each appliance a more
detailed argumentation.

- 36 -
Appliance “Household
Practice or
need”
Flexibility in
terms of
potential
load shifting
Options
for
reduction
Flexibility in
terms of
Willingness to
shift and
reduce
Automation/
remote
control?
tumble dryer
Washing &
cleaning
+
+ -
=/-
washing machine Washing &
cleaning
+
+ +/-
++
dish-washer
Washing &
cleaning
+
-
+
+/-
cooking (if electric)
Eating & drinking +/-
-
-
-
water cooker,
microwave, espresso
machine, coffee
grinder, blender, oven
Eating & drinking + -
-
-
fridge and freezer Eating & drinking +
++ ++ ++
lights inside the house
Comfort -
++ -
++
outside lighting
Safety +
- + ++
TV’s Leisure +
- - -
music installations Leisure +/-
- -
games Leisure +/-
- - -
PC’s, tablets,
Leisure/
administration
+/- - - -
hair-dryer; el
toothbrushes, el
razors, etc.
Care +/-
- -
stand-by
Ease +
- +
Vacuum cleaner; do-
it-yourself and
garden-related
machines (e.g. lawn-
mower, drilling
machine, terrace
heater)
Cleaning and
maintenance of
the house,
balcony and/or
garden.
Hobby
+
- + -
Table 3: options for load shifting and reduction for different types of household demand.

- 37 -
Understanding what motivates behavioural changes (both intentional and routine behaviours) and
consequently the responsiveness of households to pricing signals and the potential flexibility of
certain loads in a household and how such changes can be made durable is important when
designing a dynamic pricing approach. Segmentation offers a first steps towards designing and
tailoring a pricing approach to the motivations, behaviours and needs of the end-users. A
segmentation approach ideally addresses the following components:
- housing characteristics and appliances available
- patterns of presence and absence of the residents
- attitudes, motivations and actual behaviours of the residents
- socio-demographic factors such as age, income, education, gender
This is further discussed in the section below.

- 38 -
5. The end-user as a starting point
There are several reasons why a ‘one-size-fits-all’ approach is not advisable when aiming at energy
consumption reduction or shifting.
- ‘one-size-fits-all’ approaches usually focus on providing financial incentives, assuming that
people are mainly economically motivated to participate. However, there is plenty of evidence
that people are not predominantly motivated by financial gains, but can also have other
motivations that relate to environmental goals, health, comfort, etc. Two pilots in Sweden
(Lindskoug,2006) showed that the majority of participants had other than economic motivations;
they were environmentally motivated, wanted ‘to contribute’, or were interested in the
challenge presented to them.
- Research on energy DSM aimed at energy consumption reduction has shown that approaches
that target individual behaviour only - without addressing the social and physical environment in
which behaviours are embedded - have not been very successful in achieving lasting behavioural
changes (Breukers et al, 2009). In the case of dynamic pricing, attention for the characteristics of
the house, the appliances, as well as the differences between social processes within a
household are relevant to take account of. The introduction of dynamic prices in combination
with an IHD that provides information on energy consumption, can trigger very different
reactions in a household and can even cause conflicts to occur (e.g. Hargreaves et al 2010).
- The risk of rebound is larger if individuals are targeted with financial incentives only. No social
norms are addressed, no pro-social behaviour is likely to occur (which is needed if the longer-
term goal is to facilitate the transition to a more sustainable energy system). The likely result is
that when the incentive is withdrawn, the individuals that responded will fall back into their ‘old’
behaviours - because their motivation was related only to their direct self-interest. If the
incentive stays in place (which is the case with dynamic pricing), there is the risk of rebound:
money saved will be invested in other energy-consuming activities - because the motivation is
not based on pro-social values, nor on any broader consideration of societal interest related to
energy- and environmental issues.
- Studies show that often only a small percentage of the participants is responsible for the
response, while it remains unclear why they did and the rest did not respond. On average 30% of
households were responsible for 80% of the load shifting (Faruqui et al., 2010). Using
segmentation can help to gain more insight in this and design interventions that also reach the
remaining 70%.
In line with an acknowledgment of multiple motivations and diverse (options for) behaviours, a
dynamic pricing intervention may focus on facilitating one or more of the following end-user tasks
(Foster and Mazur-Stommen, 2012):
becoming aware and learning about one’s energy consumption
gaining or maintaining control over one’s energy consumption
saving costs
being reassured that previous actions or investments have worked

- 39 -
getting support in motivating other household members to reduce energy consumption.
accomplishing other benefits like increased comfort, indoor climate, health impacts, social
aspects
5.1 Segmentation: as the second-best option
Different end-users are likely to have different attitudes, motivations, behaviours, capabilities,
knowledge and other resources - which will affect how they respond to and participate in dynamic
pricing interventions. Ideally, these different end-users should be targeted in ways that fit what their
needs, preferences, knowledge, capabilities etc. How to do that? Approaching individual end-users
would enable us to find out what sort of intervention fits best with the needs of these end-users.
However, interventions are often of a scale that does not allow for this individual approach in
practice. In such situations, segmentation can offer a ‘second-best’ solution, as it allows for tailoring
an approach to the needs of a group of end-users that share relevant characteristics. Then a dynamic
pricing approach can be tailored to the particular characteristics of such a segment (targeting diverse
motivations, norms, knowledge and capabilities, resources and behaviours/practices).
5.1.1. Segmentation: load profiles and socio-demographics
Segmentation is not totally new to dynamic pricing pilots. For instance, segmentations preceding the
launch of dynamic pricing pilots addressed the characteristics of the house, the appliances and
technologies present in this house. However, such segmentation have not paid attention to the
people who actually live in this house (Stromback et al, 2001). Often, segments are constructed
around particular ‘load profiles’ in order to match the envisaged pricing approach and technologies
with the appliances and technologies in the household. While this is useful to estimate the
theoretical technical potential of saving and shifting, this is not giving us any information on whether
the people targeted will perform the behavioural changes needed to realize these potentials in full,
and in practice the actual response is lower than the theoretical potential.
Apart from segmentation beforehand to distinguish diverse ‘load profiles, segmentation on socio-
demographic factors has also been used. Segmentations have been performed in order to explain
pilot results - trying to correlate end-user responses to their socio-demographic characteristics. The
Irish CER trial (see annex 1) made use of segmentation, investigating whether particular societal
groups had responded in different ways to the ToU tariffs. They did so by using an existing and widely
used demographic classification (http://www.mrs.org.uk) and performing surveys before and after
the trial. It was found that the level of energy usage reduction declines as the socio-economic class
declines. This is however also related to the level of overall household consumption which tends to
be larger in high-income households. For peak reduction these relations could not be established
with equal clarity. Factors such as employment status and home ownership also impacted overall and
peak reductions (CER 2011:83). The CER trial addresses segments, but does not pay attention to
actual motivations and behaviours of the people targeted. In another European trial, the EDRP study

- 40 -
(see annex 1), there was limited evidence of how different population segments (e.g. based on
geographic location or on an existing UK demographic classification called Mosaic) were affected by
the interventions. The effects found were e.g. that smaller households were more likely to reduce
overall energy consumption and to shift consumption from the evening peak period (EDRP, 2011).
Using a database with registered data of 50,000 households including socio-economic information of
the householders, building-specific information (building type, year, size etc.) and meter readings on
heat consumption (space and water) and electricity consumption (lighting and appliances) revealed
the following correlations between users, buildings and energy consumption (Gram-Hanssen, 2011).:
- The number of household members is the strongest predictor of electricity consumption; income
is the second most important and the size of the home the third.
- Variables like age and education of the inhabitants explain consumption only to a small degree
- Living together with more people is more energy efficient (the trend towards more single person
households drives increases in energy consumption).
- Even when comparing households in detached houses of the same size and with the same
income, huge variations in the electricity consumption appear. Income and household size
together only explain one third of the variation in electricity consumption.
So while household size and income are the strongest predictors for electricity consumption, they still
only account for one third of differences in consumption. Furthermore, heat consumption is much
more dependent on the energy efficiency of the building (house-related characteristics), while
electricity consumption is more dependent on end-user practices (including number, size and use of
appliances) (Gram-Hanssen, 2011).
A recent study among more than 4,000 US households concluded that lifestyle factors reflecting
social and behavioural patterns associated with air conditioning, laundry usage, personal computer
usage, climate zone of residence and TV use explained 40% of the variation in electricity
consumption (Sanquist et al, 2012). Sanquist et al define lifestyle as : "...patterns of consumption
influenced by decisions at various points across the lifespan, such as what profession to engage in,
where to live, when (or whether) to marry and have children, and more proximal choices regarding
what to purchase and how and when to operate energy consuming equipment. This
conceptualization suggests that analysis of life-style and energy consumption needs to encompass
not only the traditional demographic segmentation elements, but also information about what
people own and how they use it" (2012:1). In a Swedish study, large differences in electricity
consumption were found between households that had very similar profiles with respect to electric
space heating systems and number of household members and perceptions and experience with ToU
mechanism (Bartusch et al, 2012). A study amongst more than 1000 respondents found that the use
and duration of appliances related to cleaning and entertainment accounted for a large part of the
variance in electricity consumption between otherwise similar households (income, age, dwelling)
(Bedir et al, 2013).
What can be concluded from the above is that differences in end-user practices and energy
consumption of households can only to a limited degree be explained by the socio-demographic
factors that the usual segmentation studies use. These include factors such as age, education,
income, environmental attitude, household size etc. While such segmentations can help to find out

- 41 -
how to tailor a communication strategy to different segments (e.g. the sort of information, level of
detail, media used to communicate) these segmentations do not predict actual behaviour.
5.1.2 Attitude, motivation, behaviours
A desk-research on energy saving showed that for the majority of households, a main reason to start
with energy consumption reduction is financial, the second is environmental (Mourik, 2011). The
primarily environmentally motivated segments have shown to be the ones that also realised indirect
energy saving - in their consumption behaviours regarding food, mobility and waste (Hargreaves et
al., 2010). As such these segments are less prone to performing the rebound behaviour discussed
above. Pilots aimed at shifting demand that inquired into motivations, showed that not only costs
but contributing to security of supply and contributing to societal/environmental problem solving
were also important motivations for the targeted segments, e.g. richer and older segments (Thornes
et al. 2012). In addition, the motivation to contribute to security of supply is probably not a
motivator that will resonate with the average European citizen, since in Europe black outs and brown
outs are less common. A Swiss study showed that environmentally aware segments were put off
when they were encouraged to save money by saving energy. Similar situations occur for some well-
to-do households (Sütterlin et al, 2011). In addition, a segment that is environmentally motivated to
shift consumption is likely to have difficulties if the organisation that offers the pricing intervention is
doing this from a commercial point of view only (Curtius et al, 2012). This would mean that the
Dutch DSOs will be well positioned to target this segment, as long as the DSOs societal aim and non
for profit character is well highlighted.
A consumer survey in Austria, Germany, Liechtenstein and Switzerland showed that 77% of
the 837 respondents indicated a willingness to contribute with demand shifting - e.g. by having the
washing machine work on other times of the day (Curtius et al. 2012). These respondent were not
fully representative for the average population in these countries, with a bias towards males and
middle aged people. Perceived or experienced decreases in comfort and well-being are a huge
barrier to behavioural change (Peters et al, 2010). The following groups of needs appear to be an
important consideration for people when encouraged to save energy (in order of appearance):
control (over costs and energy saving), comfort, wellbeing (health, safety, social relations/contacts),
desire to behave environmentally responsible; and ease (Caird & Roy, 2007; ON World, 2010b;
PikeResearch, 2009; Zwiers, 2010). Of course this is a generic picture: the extent to which and ways
in which these needs are relevant differs for different (segments of) people. Likely these groups of
needs play an important role when people consider to shift their energy consumption.
A pilot among a couple of thousands of Dutch end-users showed that the perception of
energy saving behaviour is an important predictor of the actual performance of that behaviour - next
to the attitude one has towards energy saving. If people have a positive attitude towards energy
saving this is more likely to result in actual saving behaviour compared to a situation where this
positive attitude is absent (Van der Sluis et al., 2011). However, this does not mean that a pro-
environmental or pro-energy saving attitude will always translate in energy saving behaviours. For

- 42 -
example, while generally, people with a higher education tend to be more concerned about the
environment and understand the need to save energy, this does not translate into energy saving
behaviours (Axel-Nilssen 2003). This is the (in)famous attitude-behaviour gap: pro-environmental
attitudes do not necessarily translate into pro-environmental behaviours. Saving energy in many
cases goes against the energy intensive lifestyles that people are locked into. For instance,
environmentally aware parents may still choose to pick up their kids from school by car because of
time pressure (due to their busy urban working lives) or safety considerations. Energy consumption
at the household level is not so much driven by environmental attitudes and awareness, but rather
by ‘actual and perceived’ needs (Anker-Nilssen, 2003; Mourik, 2011). The meaning people give to
energy consumption or saving is connected with how they live: often the search for time, comfort
and convenience has a larger impact on household energy consumption - independent of economic
or environmental attitudes (Anker-Nilssen 2003; Klopfert and Wallenborn, 2011). Facilitating
behavioural changes is not just about creating awareness, changing attitudes and intentions towards
more sustainable behaviour. It is also about changing the social, institutional, physical and
technological contexts in which these behaviours are embedded. Social norms around comfort and
convenience for instance can change over time (e.g. car use and car ownership in cities).
5.2 Improving segmentation
Extravagant
consumption
Average Consumption Thrifty consumption
Motivated & capable +++ ++ +
Motivated ++ + +/-
Capable + +/- 0
Neither motivated,
nor capable
+/- 0 0
Table 4: Potential savings in different households (Klopfert and Wallenborn, 2011)
Table 4 by Klopfert and Wallenborn (2011) shows potential savings as the result of a combination
of consumption patterns and motivation. According to this table, the highest potential lies with end-
users that are 1) extravagant and motivated, and 2) average, motivated and capable. The authors
argue that a third dimension needs to be taken into account. This is the dimension of lifestyle.
However, they see no way of including that since no clear classification or segmentation of lifestyles
is available. So if any type of intervention aims at changing consumption patterns, it needs to address
lifestyles (in all their diversity) as well.
This would entail that that real needs and real behaviours of real households are included in a
segmentation, to understand how attitudes, motivations, awareness, capabilities, sociodemographic
variables, home and appliances play a role in supporting a certain way of living. To understand how a
particular lifestyle brings with it a certain patterns and volumes of energy consumption it is
important to know how people wash, eat, clean, relax, move, sleep etcetera. First steps have been

- 43 -
taken to understand and segment lifestyles, in a Swiss segmentation study addressed attitudes,
motivations, awareness, reported actual behaviours and a number of sociodemographic variables
(Sütterlin et all, 2011). The segmentation is based on an inquiry that is representative for the Swiss
population, whereby respondents were asked about their attitudes, behaviours, preferences.
The segmentation study by Sütterlin et all (2011) aims at identifying the saving potential - it does not
focus on shifting. The resulting segments, although not translatable one-to-one to the Dutch context,
do offer end-user profiles that we can expect to occur in the Netherlands in different percentages
and possibly with nuance differences. They include motivation, capabilities, consumption patterns as
well as lifestyle elements (e.g. attitudes in combination with actual behaviours). In fact, they match
rather well with some other segmentation exercises performed in the Netherlands (van Dam, 2013).
Therefore, these segments offer the best possible starting point available for designing a dynamic
pricing intervention (including technology, feedback) aimed at shifting and reducing household
electricity consumption in the Netherlands. We briefly summarise the six segments that were
identified, the percentages are relevant only for the Swiss situation, but Dutch research has found
strong similarities with segments found in Dutch pilots (Van Dam, 2013; Mourik, 2011b):
Segment 1: Idealistic savers (15.6%)
This group shows most efforts to save energy, both through routine behaviour and efficiency
measures. Driven by idealism, these people are willing to make financial sacrifices and impose
restrictions to themselves even if it means loss of comfort. They support policies that put a price on
the energy intensity of products within a product category. They believe that they can make a
difference, in a positive sense.
Segment 2: Selfless inconsistent energy savers (26.4%)
This group also shows significant energy-saving activities. At the same time, they are not very
consistent: although they do believe that they can make a difference, they are quite inconsistent in
terms of energy efficiency measures at home - because at that level they do very little.
Segment 3: Thrifty energy savers (14%)
The thrifty savers are into energy-saving as long as this does not bring them any negative financial
consequences. This also applies to their acceptance of policies: these should not ask for any
additional financial efforts from end-users. Their motivation is not primarily intrinsic- but relates to
financial necessity and social pressure.
Segment 4: Materialistic energy consumers (25.1%)
The materialists do little to save energy, but are open to energy efficiency measures for the house.
They are not very positive about policies if these have financial implications for them. The main
motivation for energy saving behaviour is financial.

- 44 -
Segment 5: Comfort-oriented indifferent energy consumers (5.3%)
The comfort oriented are the least likely to energy saving behaviour. They do not care about the
potential societal problems that the increasing energy consumption entails. They do not feel
responsible and energy consciousness is nil. Their behaviour is driven by the search for personal
comfort. This group of people is opposed to restrictive policies and interventions that discourage this
behaviour.
Segment 6: Problem conscious welfare-oriented energy consumers (13.6%)
This segment is not enthusiastic about saving energy. Although they are aware of the consequences
of their behaviour and also believe that energy-saving behaviour can make a difference, do not they
feel called to action. This is possibly because they think that their ability to save energy is very limited.
Although oriented towards comfort, they also feel a certain social pressure to do something about
the energy situation.
For each of these 6 segments we can ask questions like the following ones:
- what are important motivations for a specific segment (e.g. financial, environmental, social)
- what do we know about their behaviour and where can we see opportunities for change (and
should the focus be on reduction and/or shifting). This could mean that pricing is not the first
motivator and a pricing mechanism can even have adverse effects.
- what is this segment willing to shift in terms of activity, and what not?
- what does this imply for the choice of a dynamic pricing mechanism?
- what does this imply for the choice of technologies?
- what does this imply for the choice of feedback messages and media?
Answers to these questions can help to design tailored dynamic pricing interventions that consist of
a combination pricing mechanism, technology and feedback. Figure 8 below shows a toolbox (to be
read horizontally) offering building blocks. Each element in the toolbox is a building block that can be
chosen or not. Each column represents the building blocks that can be chosen within the categories:
pricing mechanism, technology and feedback. The combination of selected building blocks create a
basic design for a tailored dynamic pricing intervention aimed at a specific segment. Figure 9 shows
how such a basic design could look like for segment 1, based on considerations as elaborated in box 1.

- 45 -
IBR
CPP
CPR
RTP
ToU
none
IHD
Energylamp
Smart meter
App
Magnetic sticker
Automation
Remote control
Post
Website
Colour change
Emoticons
Graphic
Tailored tips
Sound
€/kWhUse kWh
Reduction kWh
CO2 emmission
Emoticons
Graphic
Numbers
CO2 reduction
Reduction €
Use €
Per appliance
Per space
Comparative
Benchmark
Invoice detail.
Tailored tips
Goal setting
Historic
Per activity
PRICING Mechanism
TECHNOLOGYPrice related Use related Frequency,.
Level, type
FEEDBACK: FEEDBACK: FEEDBACK:
Toolbox
Figure 8: toolbox to design tailored interventions
Segment 1: “Idealistic Savers”
General Considerations
This group shows most efforts to save energy, and already does a lot in terms of reduction. Driven by idealism,
these people are willing to make financial sacrifices and impose restrictions to themselves even if it means loss of
comfort. This customer is knowledgeable and consists largely of highly educated women.
Preferred behaviour
Both routine behaviour and efficiency measures
Main motivation
This group could be motivated to shift their consumption but from an environmental motivation.
Choices related to Pricing Mechanism
Saving and shifting will not be financially motivated (no emphasis should be put on money) and a price incentive
may not be the best incentive. If a price incentive is used, a combination of ToU, possibly with CPP, is a good
option to visualise energy shifting options. Because this segment is not financially motivated, RTP is probably not
suitable (because you still need to respond strongly to price). You could also simply CPP (and focus on shifting
only).
Choices related to technology
Since this group is highly educated and well informed, different technologies can be used to support further
behavioural change. The use of technology should be functional for this group. Almost all options are ticked in
the toolbox because these people want information to be provided both at home and at work on PC, smart
phone, IHD. This group does not like ceding control (especially to a party that is less environmentally conscious
and idealistic than themselves). Remote control by third parties is not an option, automation is possible if this

- 46 -
group can control it themselves.
Choices related to Feedback
Detailed and differentiated information is desired. Because this group is well informed, it is well able to interpret
the information. Text, graphics, and / or lamp signals when price changes are options. Tailored advice needs to
be focused on shift options. What is important for this target group: who gives feedback and how reliable do
they think this party is?
Box 1: Consideration that underlie the choices of building block for segment 1
IBR
CPP
CPR
RTP
ToU
none
IHD
Energylamp
Smart meter
App
Magnetic sticker
Automation
Remote control
Post
Website
Colour change
Emoticons
Graphic
Tailored tips
Sound
€/kWhUse kWh
Reduction kWh
CO2 emmission
Emoticons
Graphic
Numbers
CO2 reduction
Reduction €
Use €
Per appliance
Per space
Comparative
Benchmark
Invoice detail.
Tailored tips
Goal setting
Historic
Per activity
PRICING Mechanism
TECHNOLOGYPrice related Use related Frequency,.
Level, type
FEEDBACK: FEEDBACK: FEEDBACK:
Pricing Approach segment 1
Figure 9: Dynamic pricing approach for segment 1 (the blue blocks)
Annex 3 elaborates the tailored dynamic pricing interventions for all six segments, demonstrating
how this toolbox can be used.
Of course, for any particular project in the Netherlands, further tailoring can and needs to be done
based on issues like house characteristics, appliances, presence-patterns and particular other local
characteristics. Next, further tailoring and fine-tuning is possible in the choice of dynamic prices,
technologies and feedback. Below we briefly elaborate on these issues that need to be addressed as
well.
House characteristics
The influence of the house, it’s energy quality and the appliances in the house is significant.
A survey showed that in general, people are more willing to invest in more energy-efficient
appliances than investing in measures like insulation and double glazing (Logica CMG, 2009). Such
preferences are however likely to differ for different segments.
There is a positive correlation between home-ownership, age and type of house: the older the
residents, and the larger the home is, the more appliances a household owns (OECD, 2010). The type

- 47 -
of appliances differ with the level of education, the higher the education the more PCs a household
owns. Research shows that the influence of behaviour on energy consumption is larger than the
influence of the house-characteristics. Identical energy-efficient houses can show a consumption
that differs with a factor 2 - caused by differences in behaviours (Darby, 2006).
Tenants often have less options to install appliances that can support reduction or shifting. Remote
controlled HR-E boilers are the responsibility of Dutch housing corporations, and the same goes for
generation.
Appliances
In recent years many appliances have become much more energy efficient, and high consuming
appliances have been replaced. However, the savings acquired by using more efficient appliances is
nullified by the tendency to purchase ever more appliances (Nationale Denktank, 2009; TNO, 2008).
Appliances’ potential to realise demand shifting lies in the shifting of their usage to off-peak periods,
or the turning off during peak periods. In addition, smart appliances or appliances with a
timer/thermostat can be programmed such that they temporarily use less electricity (e.g. the fridge
during peak hours). ‘Thermostatic demand’ is regarded as a demand that is potentially highly flexible:
the demand of an average fridge can be shifted during peak hours with some 30% (Zehir, 2012) -
which is significant if we consider that almost all households have a fridge that is on every day. Other
opportunities for shifting are offered by appliances’ batteries that can be loaded during off-peak
periods - and used during peak hours.
An additional value of shifting loads through different appliance-use is that it can also contribute to a
better integration of decentralized renewables - by adjusting the energy use period of the appliances
to moments of high generation by wind, solar, either remote controlled or with a timer.
The potential flexibility of many appliances is already accounted for in several studies. What these
studies fail to address sufficiently is the use and timing of use of appliances - e.g. the example of
watching TV in the evening which is non-negotiable for many. Timing of usage is strongly affected by
timing of activities (presence) and lifestyles. Some use-moments are non-shiftable because it entails
too much of a disruption for a households’ routine or because the use at that specific moment is
considered necessary.
Presence patterns
This refers to the presence at home of household members during the day and evening. In as far as
this increases their (theoretical) flexibility to reduce or shift consumption during these periods, it will
affect the effectiveness of price incentives. Some researchers claim that electricity demand loads are
determined predominantly by the timing of daily practices of such people travel to work and children
to school, cooking and eating (Devine-Wright et al, 2009; Torriti, 2012). Average presence profiles
differ across segments, but also from country to country. In Italy, the presence of people during the
day for example is higher than the European average (Torriti, 2012). This makes their flexibility to
respond to price incentives (without automated control) larger than in other countries. The French

- 48 -
cook and eat around eight o’clock in the evening, the Dutch usually cook and eat earlier. All these
activities, including sleep, work, housework, eat, relax, watch TV affect the flexibility and thus
response to price incentives. Very little research has been done on how people change the usage of
particular appliances in response to DSM incentives. A UK survey showed that less than 20% of those
individuals who cook or watch TV between 7 and 9 PM, would be willing to postpone these activities
till after 9 PM (Platchkov et al, 2011). A qualitative inquiry in the UK confirmed this, where
respondents indicated that changes to these kind of lifestyle practices that relate to a particular
‘natural rhythm’ of a household are non-negotiable - referring exactly to cooking and watching TV
after work (Hargreaves et al, 2010).
Across Europe, eight o’clock PM is television time for a large part of the population. That time is
sacred and often responsible for up 3GWh. A huge potential but only theoretical because many
people need their comfort and relaxation at that time, not earlier or later. Activities in the morning
peak periods differ from evening peak period activities, both in content and in the way they are
valued. In the morning activities can be started after which the absence of the residents is not an
issue (washing, dishwasher). An Italian study of a ToU pilot in Trento (Torriti, 2012) showed a greater
willingness to shift the activities in the morning than in the evening. This has been confirmed by
findings in a RTP US study on the willingness to pay for electricity related to the willingness to
experience higher temperature ( because allowing the temperature setting of the AC to be changed
by remote control (a higher temperature rise was considered acceptable in the morning in
comparison to the evening. This RTP pilot concluded that there are probably 6 tot 10 relevant timing
slots in which people are more or less willing the shift or reduce their energy use (Violette et al.,
2010).
Household dynamics
Each household has its own dynamic or moral economy: the history and social practices from which
norms and values, habits and routines, thoughts, motivations and wishes and needs in relation to
comfort, cleaning, caring, leisure practices have developed. The household members very often
grows into this more economy without noticing, with each member having a specific role and
opinion. The household dynamics usually are not under discussion, expect when a disruptive event
such as a new baby, a move, a high energy bill happens. Each household views the energy
consumption through their personal moral economy lens. Therefore, when a tailored dynamic pricing
intervention is developed it is crucial to pay attention to this household dynamics because different
household members can respond differently.
Main elements of a comprehensive segmentation
Recapitulating the discussion above, we can now summarise the crucial elements of a
comprehensive segmentation (which intends to design tailored dynamic pricing interventions).
Attitude, motivation, awareness, capabilities, behaviours
Sociodemographic variables

- 49 -
House-related characteristics
Appliances
Presence patterns
Household dynamics: timing and negotiable (read flexible) use

- 50 -
6. The Dutch context & role of DSOs
Consumers in the Netherlands (and elsewhere) are familiar with some dynamic pricing mechanisms,
e.g. Time of Use is common when booking holidays, hotels and airline tickets that differ in price
according to day of the week, season. When it comes to critical peaks and pricing around such peaks,
this is a less familiar thing for the Dutch. Also unusual are calls from national government to reduce
or shift energy consumption to prevent power black-outs - as has been done in countries with more
extreme climatic conditions. Dutch households are likely to be less aware of the possibility of
interruptions in energy supply. A need to shift energy consumption in order to maintain a proper
balance between supply and demand is something most Dutch people are not likely to be familiar
with at all.
Due to large differences in climate conditions, results of dynamic pricing programmes in the US and
Canada (Faruqui and Palmer, 2011) are not easily translated to the Dutch context. Nor can the results
from Italy, which has seen a massive uptake of household Air Conditioning systems and an
accordingly rise in electricity consumption (Battle and Rodilla 2008). In the Netherlands there is no
widespread use of AC nor a widespread use of electrical heating (like in Scandinavian countries), so
these potentials for shifting and reduction are absent. Dutch households typically use gas for cooking
and heating which limits options to shift and reduce electricity usage in comparison to households in
countries where electrical heating and cooking is more commonplace.
As for the gas-defined usage, the options for shifting and reduction lie to large extent in one-off
behaviours like changing the thermostat settings, investment behaviours to reduce the leakage of
warmth, and to a small extent to changing routine behaviours (showering, baths, and cooking in the
Dutch situation). Like in Ireland, the majority of Dutch households do not use electricity for heating
nor AC for cooling, the main options for electricity reduction and shifting therefore relate to routine
behavioural changes in the areas of lighting, TV, PC-use, gaming, use of the oven, dishwasher, fridge,
freezer, washing machine, all other electrical appliances. Investment/intentional behaviours involve
the purchase of new appliances, software or games that affect the time spent behind the computer,
and the setting of timers on e.g. the fridge (programming devices to turn off at certain moments
during the day or night). In the Netherlands, many people come home from work at around 18.00.
They cook and eat dinner, and enjoy some leisure time in the following hours. The loads that related
to these activities between 18.00-21.00 are difficult to shift.
The Dutch are quite active on social media (including) Twitter. Many people are also used to touch on
a service like SMS alerts. This offers opportunities for providing feedback to support behavioural
changes and feedback to communicate (changes in) tariffs. Like elsewhere in Europe, the ageing of
the Dutch population is a trend that will affect presence patterns and peak demand patterns and
changes in/proliferation of new appliances in and around the house in the Netherlands. Other
relevant trends are developments like teleworking (working from home) and increasing
unemployment as a result of the crisis which affect presence patterns and hence future options for

- 51 -
reduction and shifting.
The initial mandatory roll-out of the smart meter was not pushed through due to strong resistance
from consumer organisations and privacy watchdogs (Elburg, 2009). This has raised issues around
who is entitled to read and process user data, who owns these and how access is granted. Several
changes followed, e.g. at present the smart meter can only be read 6 times a year and people have
the right to administratively opt-out in which case the meter readings do not leave the house.
Currently, the smart meter is being rolled-out in pilots to learn about the best strategies and end-
user acceptance. In 2015 a more massive roll-out is planned which is to incorporatie the lessons
learnt in the pilots. In addition many smart grid pilots are initiated to learn about end-users response
and technical aspects. The lessons learnt are however not widely shared or disseminated.
Cooperation and knowledge sharing between DSOs, retailers and other stakeholders is taking place
on a rather limited scale and offers room for improvement.
6.1 Role of DSOs in the Netherlands
Faruqui et all (2012) mention the following benefits of dynamic pricing and smart meters:
- avoided or deferred resource costs (including generation capacity and, to a lesser extent,
transmission and distribution capacity)
- reduced wholesale market prices,
- improved fairness in retail pricing (i.e., providing a better match between the costs that
customers impose on the system and the amount they are billed)
- customer bill reductions, facilitating the deployment of both distributed resources (such as solar
electric systems ) and end-use technologies (such as plug-in electric vehicles)
- environmental benefits (through possible emissions reductions)
The question is who benefits from these effects, on what terms and to what extent? And how
transparent is the envisaged distribution of costs and benefits? And what role Dutch DSOs are to
play in this area? DSOs can introduce dynamic tariffs on the electricity transport-cost parts of the
energy bill. Energy suppliers can do this for the delivered electricity.
Because of the separation between transport and supply in the Netherlands, Dutch DSOs have a
different position compared to their colleagues in most other EU countries. The Dutch DSOs have
been created as public organizations responsible for balancing demand and supply.
It is questionable whether most Dutch end-users are aware of the separation between transport and
supply and of the public role that DSOs are now supposed to fulfil. The fact that Dutch DSOs are
public organizations, does not necessarily mean that they are regarded as a more trustworthy. The
Dutch government does not have a good record when it comes to safeguarding citizens’ privacy.
However, trust in DSOs affects the credibility to end-users of information provided and it likely also
affects the extent to which end-users are willing to participate in dynamic pricing interventios. It is
important for DSOs to learn how they are being viewed by end-users.

- 52 -
Several relevant questions that can be asked from an end-user-point of view include:
- What are risks of being disconnected (related to the smart meter)?
- Does “administratively off” ensures that metering information can indeed not be exchanged?
- Are measures taken sufficient to guarantee security and privacy protection of end-users?
- To what extent do end-users have opt-out options from dynamic pricing schemes?
- What sort of access do they have to their own data?
- How is the public interest that DSOs claim to represent, defined?
- What other interests do DSOs, energy suppliers and others have and how does this affect how
DSO engage and communicate with end-users?
- Is there a more ‘neutral’ organization or an organization that represents consumers that
endorses the information provided by DSOs?
- How transparent is the market that is arising around the marketing of smart metering technology
(a billion-euro-market), feedback technologies and ICT, related consultancy, and energy-sector
parties interested in customer retention, network balancing, etc.?
Dutch DSOs need to consider these type of questions that can arise. If there is a lack of clarity on
roles, responsibilities this can thwart end-user acceptance and commitment.

- 53 -
7. Conclusions: lessons, recommendations and remaining dilemma’s
7.1 Top 10 Lessons
Based on our review of pricing mechanisms, technology, feedback, behaviour and segmentation the
following top 10 lessons could be drawn:
1. For the near future Time of Use with several pricing variations a day, combined with Critical Peak
Pricing for several additional days annually is the most promising dynamic pricing intervention
for the Netherlands.
2. Focusing on load shifting only creates the risk of overall load increase. If e.g. the off-peak price is
too low compared to the peak price this can create an increase in consumption.
3. The theoretical load shifting and reduction potentials tell us little about the actual occurrence of
the shifting and reduction. That depends on the end-user. Lifestyle had a strong influence on the
actual occurrence of shifting or reduction behaviours.
4. People are not motivated by pricing incentives only. Environmental motives, "the desire to
contribute", control, comfort, ease and wellbeing are important motivators as well.
5. A one-size-fits-all approach reaches a maximum of 30% of end-users, with very different
responses within this 30%. If the aim is to also reach the remaining 70%, a differentiated
approach is needed.
6. Time of Use interventions target habitual behaviours. Critical Peak Pricing and Critical Peak
Rebate focus on conscious and less frequent behaviours.
7. Load shifting can be achieved without technology (using only fridge magnets and calendars).
Additional technology such as e.g. an In House Display however increases the response rate.
8. End-users highly value easy aids such as calendars, magnetic stickers and detailed frequent
energy bills.
9. Different end-user segments need different tailored interventions consisting of a specific
combination of dynamic pricing mechanism, technology and feedback.
10. A tailored approach and voluntary participation are very important to avoid discrimination (and
sabotage).
7.2 Towards a DSO-led decentralised approach?
The research question that we have addressed in this report was as follows: Which dynamic pricing
approaches (being a combination of a dynamic price incentive, technology and feedback) work best
for which end-users and under what circumstances in the Netherlands?
The preceding sections have discussed how to design a tailored pricing intervention (combining price
incentive, technology and feedback) that takes the end-user seriously. In addition, we addressed the

- 54 -
situation in the Netherlands and the role that the Dutch DSO can take. However, section 6 also raised
some end-user issues regarding privacy, acces to and ownership of data. A tailored pricing
intervention requires a lot of detailed personal data from individual households and a
comprehensive segmentation asks for a lot of private and sensitive information from households. It is
unlikely that end-users provide such information easily - for several reasons, one being the
perception that the privacy and security of their data cannot be safeguarded.
Rather than trying to create an elaborate and costly centralised data system (Curtius et al. 2012) that
‘guarantees’ the safety and protection of privacy and other end-user interests, it may be a better idea
to keep end-user data and information decentralised. That would also better fit with a future
situation in which end-users become more actively engaged in smart grid technologies. And it would
make it easier for DSOs not to compromise their task of furthering of the public interest as a priority
when working closely with parties that have very different priorities (e.g. the enormous interest in
selling as much smart and intelligent devices as possible collide with cost-efficiency for end-users as
a priority). In a decentralised data en information management system, the end-users’ active role
would become key. Such a system ensures that personal information needed for the segmentation as
well as household metering data remain with the end-user and with no one else. This also resonates
with other studies that discuss the options of full end-user control and ownership over (metering)
data (e.g. Wallenborn and Klopfert, 2011).
The DSO could take up a role in designing a tool that provides to the end-users several segment-
descriptions with accompanying price-technology-feedback combinations with an explanation of
critical issues and potential risks and benefits. Or the toolbox could allow for a household to fill in
their personal data and the tool would subsequently advise the best fit in terms of combination of
pricing mechanism, technology and feedback. This would allow households to choose the segment
that fits their situation best. Next, the households could ask the DSO or retailer for this dynamic
pricing intervention combination (perhaps with options to adapt elements further to be in line with
one's personal situation). The toolbox would enable this interaction between households and DSO
and/or retailer. In addition, it would do so in such a manner that personal data and information stay
with the end-user. The end-user keeps control over his/her data, the choice of segment and the
choice for a price intervention. This approach of actively including end-users entails an
institutionalisation of end-user involvement and commitment.
The role of a DSO in rolling out well-tailored dynamic pricing interventions could thus lie in
facilitating the development of such toolboxes and the segmentation (that serves as a starting point).
However, the DSO should not undertake this without strategic alliances. People consider information
more credible when the source of information is considered impartial. While people might consult
and even trust their energy supplier or a company that provides energy efficiency products and
services, endorsement from scientists, consumer - or environmental organisations might be
important when positioning energy saving products and services (Logica 2007). For credibility and

- 55 -
trustworthiness, it would be good to collaborate with an independent organisation that
intermediates between DSO, energy suppliers, other relevant stakeholders and end-users, whereby it
is clear that this intermediary serves the societal interest and ensures fair play.
7.3 Remaining dilemma’s and suggestions for further research:
Several of the dilemma’s and other issues that need further research have been touched upon in the
main text. For some issues - e.g. related to consumer access and ownership of data and information -
we have suggested solutions. However, additional research or pilots are needed to further elaborate
these ideas for solutions.
We still understand too little about how and why people reduce or shift
Surveys that accompany trials and pilots give little insight into how households change their
behaviours, which household members take on what roles, how changes are negotiated or not, etc.
Qualitative research that provides insights is still limited (e.g. Hargreaves et al, 2010)
Lifestyles and social practices
Households that are comparable demographically and technically, show very different behavioural
responses which reflects different lifestyles, histories and social practices. Feedback or incentives are
being interpreted and negotiated through the particular lifestyle-lens and acted upon accordingly
(feedback is more than ‘just information’ and “there is no guarantee (…) that the meanings intended
by the communicator are those understood by the recipients” (Hargreaves et al, 2010:6112). In
addition segmentation assumes a world of individuals while it also makes sense to look at historically
developed social practices and norms (e.g. with respect to hygiene and washing/showering;
regarding dress standards and heating/AC, on comfort and heating) and how this can be an entry
point for change. Lastly segmentation is based on the assumption of coherent individual attitudes
and beliefs. It does not allow for internal inconsistencies or multiple identities (e.g. the same person
can be man, father, researcher, tennis-player, party-crasher and each of these identities might bring
along slight differences that also result in different behavioural choices).
Rebound
When people are only incentivized on their motivation to save money, then a rebound effect is more
likely to take place compared to a situation where environmentally motivation (pro-social values)
plays a role. However, unintended or indirect rebounds pose a more complex challenge that is not
easily solved.
Engagement with the IHD
Since engagement with the IHD is important for end-users to remain committed to decrease and
shift energy usage, it is important to learn more about how this engagement can be maintained.

- 56 -
Persistence
Many studies have something to say about persistence and point out that savings persist in cases
over the course of a two-year pilot (Faruqui and Palmer, 2012; Stromback et al 2011; Foster and
Mazur-Stommen 2012). However, post-pilot inquiries or ongoing inquiries after full-scale roll-out,
into the persistence of behavioural changes have been done, which leaves questions unanswered as
to whether seemingly persistent behavioural changes really last.
Equity issues
To what extent are particular segments affected disproportionately by a particular dynamic pricing
approach? We can think of low-income households, who may have fewer, older and less efficient
appliances and therefore less room to shift or reduce. But also households were most people are
away during day-time in comparison to households with people at home all day.
Some shifting activities, e.g. programming the fridge thermostat in such a manner that less electricity
is used during peak hours, need to be performed before the peaks occur (Zehir 2012). The only way
for people who are not at home (or are otherwise unable to perform several manual actions during
off-peak periods) is to work with remote control. However, this asks for additional technology and
costs. Some segments may be financially disadvantaged over others because of this. These and other
socio-demographic factors are important to consider. While some studies argue that poor
households are not disproportionately affected by dynamic pricing (Faruqui and Palmer, 2011) others
state that pilots show mixed results. High income families often have two working parents -with
more absence unless one of them works at home. This affects their ability to shift. Low income
segments often already cut down on their energy cost to save money and have fewer options to
change routines to reduce electricity (fewer and less efficient/older appliances) and energy (low
quality social housing) and they have fewer scope to invest in more efficient appliances or efficiency
improvements of the house (and split incentives) (Brandon & Lewis 1999). Even if this segment
would respond to and profit from price incentives that target shifting , the question rises if they
might end up using less energy than is needed to maintain a very basic level of well-being and health.
Housing corporations have an important role to play in improving the quality of social housing and
decreasing consumption while at the same time ensuring no increases in bill.
Future of gas in the Netherlands?
In case of a future spread of household heat-pumps, this may raise the flexibility of load. Like with air
conditioners, the demand is flexible to the degree that end-users are willing to accept small
decreases in comfort during peak periods (Frontier Economics and Sustainability First, 2012).
Who has access, to what sort and form of data, to what extent? Privacy issues
Do end-users have access to their data? In what form, to what extent? Who else has access? How
can privacy of the end-user be protected and by whom? What can be learn from mistakes made in
the past?

- 57 -
Correlation between motivations and effectiveness of pricing mechanisms
Research into concrete motivations for concrete Dutch segments is lacking. Especially the impact of
motivations around comfort and their influence of the effectiveness of certain dynamic pricing
mechanisms needs further research. E.g. a load shifting that demands a permanent behavioural
change can be experienced as diminishing comfort and therefore not accepted.
Theoretical and real load flexibility
The real flexibility of promising loads such as e.g. television watching or dishwashing need to be
investigated in real life for different segments. Are people actually willing to shift their television time
or dishwasher cycles? What do these people need to make this shift? In practice much of the
theoretical load flexibility is not existing because people feel they cannot shift their activities due to
needs, norms and capacity.
The role of social media and feedback?
The role of social media in delivering feedback and the role of tablets and smart phones is not
sufficiently understood.
Moral economies and negotiating household practices
Feedback could play a role in the discussions within households about the household's energy
consumption practices and could mediate between different members 'needs and wishes.

- 58 -
References :
Abrahamse, W. et al., (2007). The effect of tailored information, goal setting, and tailored feedback
on household energy use, energy-related behaviours, and behavioural antecedents. Journal of
Environmental Psychology 27 (2007) 265-276
Accenture (2010). Engaging the New Energy Consumer. Accenture perspective- operational
imperatives for energy efficiency.
Accenture (2010). Understanding consumer preferences in energy efficiency. Accenture end-
consumer
Anker-Nilssen P. (2003), “Household energy use and the environment – a conflicting issue”, Applied
Energy, 76, pp. 189-196.
Bartusch, C., Wallin, F., Odlare, M., Vassileva, I., Wester, L. (2011) Introducing a demand-based
electricity distribution tariff in the residential sector: Demand response and customer perception
Energy Policy 39: 5008–5025.
Battle, C., Rodilla, P. (2008) ELECTRICITY DEMAND RESPONSE TOOLS:STATUS QUO AND
OUTSTANDING ISSUES. IIT Working Paper IIT-08-006A
Bedir M.; Hasselaar E.; Itard L. (2013) Determinants of electricity consumption in Dutch Dwellings.
Energy and Buildings 58, 194-207
Brandon, G.; Lewis, A. (1999). Reducing Household energy consumption: a qualitative and
quantitative field study. Journal of Environmental Psychology (1999) 19, 75-85
Breukers, S., Mourik, R., Heiskanen, E. et al (2009) Interaction Schemes for Successful Energy Demand
Side Management. Building blocks for a practicable and conceptual framework. Deliverable 5 of the
FP7 CHANGING BEHAVIOUR project. www.energychange.info/deliverables
Caird, S.; Roy, R.; (2007). Consumer adoption and use of household energy efficient products. Final
report People-centred ecodesign project: Energy Efficiency study.
CER (2011) Electricity Smart Metering Customer Behaviour Trials (CBT) Findings Report. CER11080a
Dublin: The Commission for Energy Regulation.
Curtius H.C., Kunzel, K.; Loock, M. (2012). Generic customer segments and business models for smart
grids. Empirical evidence from a cross-European country study. Der Mark, International Journal of
Marketing, Published online 14 February 2012.

- 59 -
CREG (2010) STUDIE betreffende “de haalbaarheid van de invoering van een progressieve prijszetting
van elektriciteit in België” Brussel: Commissie voor de Regulering van de Elektriciteit en het Gas
(CREG).
Darby, S. (2006): The Effectiveness of Feedback on Energy Consumption. A Review for Defra of the
literature on metering, billing and direct displays. University of Oxford. Environmental Change
Institute.
Darby, S. (2010). Literature review for the Energy Demand Research Project. University of Oxford.
Environmental Change Institute.
DEFRA (2007). Public Understanding of Sustainable Energy Consumption in the Home. (2007): A
research report completed for the Department for Environment, Food and Rural Affairs by Brook
Lyndhurst.
Devine-Wright P, Rydin Y, Guy S, Hunt L, Walker L, Watson J, et al. 2009 Powering our lives:
sustainable energy management and the built environment. Final Project Report. London:
Government Office for Science.
DIRECTIVE 2012/27/EU OF THE EUROPEAN PARLIAMENT AND OF THE COUNCIL
of 25 October 2012 on energy efficiency, amending Directives 2009/125/EC and 2010/30/EU and
repealing Directives 2004/8/EC and 2006/32/EC
EDRP (2011), Energy Demand Response Project : A final analysis, AECOM, Energy Demand Response
Project. Report commissioned by Ofgem on behalf of DECC, retrived from :
http://www.ofgem.gov.uk/Sustainability/EDRP/Pages/EDRP.aspx
EFFLOCOM (2004) Energy efficiency and load curve impacts of commercial development in
competitive markets. Description of the EFFLOCOM Pilots. EU/SAVE 132/01
Electricity Association (2001) Affording Gas and Electricity: Self Disconnection and
Rationing by Prepayment and Low Income Credit Consumers and Company Attitudes to Social Action
Final report based on data and analysis by Centre for Management under Regulation, University of
Warwick; Centre for Competition and Regulation, University if East Anglia
EPRI (2008). Price Elasticity of Demand for Electricity: A Primer and Synthesis. An EPRI White Paper
for the Energy Efficiency Initiative. principal Authors: B. Neenan; J. Eom, Palo Alto, CA: 2007, 1016264
- 60 -
Faruqui, A.; Sergici, S. (2009) Household response to dynamic pricing of electricity- a survey of the
experimental evidence. The Brattle Group.
Faruqui, A.; Harris, D.; Hledik, R. (2010) Unlocking the €53 billion savings from smart meters in the EU:
How increasing the adoption of dynamic tariffs could make or break the EU’s smart grid
investment Energy Policy, Volume 38, Issue 10, October 2010, Pages 6222-6231
Faruqui, A., Hledik, R., Palmer, J. (2012) Time-Varying and Dynamic Rate Design. Global Best Practice
Series. RAP Energy Solutions and The Brattle Group.
Faruqui, A., Palmer, J. (2012) The Discovery of Price Responsiveness A Survey of Experiments
involving Dynamic Pricing of Electricity Ahmad Faruqui Principal with The Brattle Group Jenny Palmer
EDI Quarterly 4(1):15-18
Faruqui, A., Palmer, J. (2011) “Dynamic Pricing and its Discontents,” Regulation, Fall 2011.
Filippini, M.(2011) Short- and long-run time-of-use price elasticities in Swiss residential electricity
demand. Energy Policy 39:5811–5817.
Fischer, C. (2007). “Chapter 31: Consumer Feedback: A Helpful Tool for Stimulating Electricity
Conservation?” Proceedings: SCP Cases in the field of Food, Mobility, and Housing; Workshop of the
Sustainable Consumption Research Exchange (SCORE!) Network. Paris, France. June 4-5.
Foster B., and Mazur-Stommen, S. (2012) Results from Recent Real-Time Feedback Studies.
Washington: ACEEE, February 2012. Report number B122.
Fraunhofer-Institute for Solar Energy Systems ISE (2011) Intelliekon. Achieving Sustainable Energy
Consumption with Smart Metering, Communication and Tariff Systems. funded by the Federal
Ministry for Education and Research (BMBF)
Frontier Economics (2011) Economic Potential of Smart Electricity Meters in Germany. Analysis
commissioned by Yello Strom GMBH. January 2011
Frontier Economics & Sustainability First (2012) Demand Side Response in the domestic sector- a
literature review of major trials. Final Report, London, August 2012. Undertaken by Frontier
Economics and Sustainability First, for the UK Department of Energy and Climate Change
Gram-Hanssen, K. (2011) Households' energy use – which is the more important: efficient
technologies or user practices? World Renewable Energy Congress 2011 Sweden; 8-13 May Linköping,
Sweden.

- 61 -
Hargreaves, T., Nye, M., Burgess, J. (2010) Making energy visible: A qualitative field study of how
householders interact with feedback from smart energy monitors. Energy Policy 38 (2010) 6111–
6119
Janssen E., Jonkers, R. Gelissen, R. (2007). Effectiviteit van feedback bij huishoudelijk energieverbruik.
Voorstudie ten behoeve van optimalisering van de feedback bij de slimme meter. ResCon Onderzoek
en Consultancy, Haarlem.
Klopfert, F., Wallenborn, G. (2011) Empowering consumers through smart metering, a report for the
BEUC, the European Consumer Organisation, 22 December 2011.
Lindskoug, S. (2006). Consumer reactions to peak prices. Elforsk raport 06:40. June 2006
Landys+Gyr (2009) Energy Efficiency created from Informed End-Users: A summary of the empirical
evidence. Landys+Gyr, Switzerland
Logica (2007) Turning concern into action: Energy efficiency and the European consumer.
Martiskainen, M. (2007), Affecting consumer behaviour on energy demand. Final report to EDF
Energy. March 2007, Sussex Energy Group, SPRU- Science and Technology Policy Research, University
of Sussex.
Mourik, R.M. et al. (2009). Conceptual framework and model: Synthesis report tailored for policy
makers as target group. A practical and conceptual framework of intermediary demand-side practice.
Deliverable 6 of the CHANGING BEHAVIOUR project. Available
at www.energychange.info/deliverables
Mourik, R.M., 2011a. Zonder slimme meter geen effectieve energiebesparing…maar de slimme
meter alleen is niet genoeg. Een deskresearch naar de Effectiviteit van Energiegerelateerde feedback
met of zonder slimme meter. Particulieren en kleinzakelijke doelgroep. In opdracht van Liander. Mei
2011
Mourik, R.M., 2011b. Een segmentering voor de slimme meter uitrol. In opdracht van AgentschapNL.
Juli 2011.
OECD (2010). Environmental policy and household behaviour. A synthesis report. Working Party on
National Environmental Policies. Environment directorate; Environment policy committee.
ON World (2010b). Home Energy Management. Early Adopter Perspectives. Q4 2010.

- 62 -
Owen, G., Ward, J., (2007) Smart meters in Great Britain: the next steps? Published by Sustainability
First. Sponsored by Accenture, Ampy Metering, Centrica, EdF Energy, Energy Saving Trust, E.ON UK,
National Grid, Ofgem, RWE npower, Scottish Power
Owen, G., Ward, J., (2010) Smart pre-payment in Great Britain. Published by Sustainability First.
Sponsored by Centrica, EdF Energy, E.ON UK, Onstream, Consumer Focus, Energy Saving Trust,
National Energy Action, Landis & Gyr, PRI, The Brattle Group, and Ofgem. March 2010
Peters, J. et al., (2010). Demand Response Customer Perceptions and Behaviour Study. Research into
Action, Inc. Presented at the Behavior, Energy and Climate Change Conference BECC, November 16,
2010.
Pike Research (2009). Executive Summary: Home Energy Management. Energy Information Displays:
In-Home Display Devices, Web Dashboards, and Mobile Applications.
Platchkov, L., Pollitt, M.G., Reiner, D., and Shaorshadze, I. (2011) 2012 EPRG Public Opinion Survey:
Policy Preferences and Energy Saving Measures. Available at
http://www.econ.cam.ac.uk/dae/repec/cam/pdf/cwpe1149.pdf (Accessed 02/04/12
PwC (2009). Waar haalt u de energie vandaan? Onderzoek naar het energiegedrag van Nederlandse
huishoudens.
Ryan, B., Blackmore, K. (2008) In-Home Displays Spike Interest in Energy Usage and Efficiency. Energy
Insights.
San Diego Gas & Electric Company (2010) Critical Peak Pricing fact Sheet.
Sanquist, T. F.; orr, h.; Shui, B.; Bittner, A.C. (2012) Lifestyle factors in U.S. residential electricity
consumption. Energy Policy 42, 354-364.
Schleich J., Klobasa M., Brunner M., Gölz S., Götz K. & Sunderer G. (2011), Smart metering in
Germany and Austria – results of providing feedback information in a field trial, Working Paper
Sustainability and Innovation No. S 6/2011, Fraunhofer ISI, Karlsruhe. Retrieved at:
http://www.isi.fraunhofer.de/isi-de/service/presseinfos/2011/pri11-13.php
Seale, H. and Grande, O. (2011) Demand Response from Household Customers: Experiences from a
Pilot Study in Norway. IBEE Transactions on Smart Grid, Volume 2, No. 1, March 2011
SPP. (2004). California Statewide Pricing Pilot. Overview and Results.

- 63 -
Sütterlin, B., Brunner, T. , Siegrist, M. (2011) Who puts the most energy into energy conservation? A
segmentation of energy consumers based on energy-related behavioral characteristics. Energy Policy
39: 8137–8152
Stromback, J., Dromacque, C., Yassin, M.H. (2011) Empower Demand. The potential of smart meter
enabled programs to increase energy and systems efficiency: a mass pilot comparison. Helsinki:
VaasaETT, Global Energy Think Tank.
Thorsnes, F. Williams, J., Lawson, R. (2012) Consumer responses to time varying prices for electricity
Energy Policy 49: 552–561
Torriti, J. (2012) Price-based demand side management: Assessing the impacts of time-of-use
tariffs on residential electricity demand and peak shifting in Northern Italy. Energy 44:576-583
Van Dam, S.S.; Bakker, C.A.; van Hal, J.D.M. (2010). Home Energy Monitors: impact over the medium-
term. Building Research & Information (2010) 38 (5), 458-469
Van Dam, S.; Kobus, C.B.A. (2013 forthcoming) Understanding Archetypical Users, Their Utilization of Home Energy Management Systems, and the Practices That Emerge. Working paper.
Van Elburg, H. (2009) Smart Metering and in-home energy feedback; enabling a low carbon lifestyle.
ECEEE 2009 Summer Study.
Van der Sluis, M.; Hesselink, A. Jonkers, R. (2011). Energieadvies op maat via gebruik van slimme
meters. Determinanten- en effectenonderzoek.
Violette, B. (2010). Residential energy demand in a real time pricing program. Navigant. Presented at
the Behavior, Energy and Climate Change Conference BECC, November 16, 2010.
Zehir, M.A.; Bagriyanik, M. (2012) Demand side management by controlling refrigerators and its
effect on consumers. Energy Conversion and Management 64, 238-244.
Zwiers, R. (2010). Home Energy Management: een kwalitatief onderzoek naar eisen en wensen van
toekomstige gebruikers. Energie Kennis Centrum Hanzehogeschool Groningen.

- 64 -
Annex 1: European examples of dynamic pricing
pricing mechanism
Number of participants
Overall consumption reduction
Peak reduction Peak-to-off-peak differential (approx)
1.Electricity Smart
Metering Customer
Behaviour Trials
(CBT (2009-2010)
ToU 2,920 2.5% 8.8- 11.3 % 143-271%
2a EDRP EDF project
ToU 194 2.3-4%1 Varied, between 4% (weekdays) to 8% (weekends)
165%
2b EDRP SSE project ToU 1,352 2.5-3.6 %2 up to 0,5%3 180-210%
3 TEMPO EDF ToU and CPP From 800 in 1989 to 20,000 in 1995 to >300,000 after 2004
cuts in total national peak consumption by 4%; the total peak load reduction that has reportedly been achieved through the Tempo program is 450 MW - due to an average peak load reduction of 45 percent from participants on red days (and 15 percent on white days).
126-286 %
7. PowerShift 2003-2004
ToU 100 None 2% increase compared to control group
Very little (1-2 % compared to the control group)
267%
4. Norway DSR ToU 40 - Participants with standard
electric water heaters:
average reduction during
morning peak load of 1kW
per hour.
Participants with hot water
space heating systems:
average reduction during
morning peak load of 2.5
kW per hour.
-
5. Elforsk pilot Sweden
CPP 93 - The load was cut back to an average of at least 50% during high price instances.
-
6. Intelliekon ToU (of 2000, part was provided a ToU tariff)
9.7% 2% 250%
7. Norway effloccom - Varied -
1.
This percentage of saving counts for all 1,979 participants of the whole trial (Wallenborn & Klopfert 2011); no percentage is available for the ToU sample that consisted of 194 participants 2.
This percentage counts for the total of 2,7887 participants of the whole trial (Wallenborn & Klopfert 2011); no percentage is available for the ToU sample that consisted of 1,352 participants 3 Foster and Mazur-Stommen 2012

- 65 -
1.Electricity Smart Metering Customer Behaviour Trials (CBT), Northern Ireland (CER 2011)
Duration 18 months (July 2009- December 2010). Month 1-6: collection of energy consumption benchmark date Month 7-18 (Jan 1st 2010-Dec 2010): actual trial
Scope: National-wide pilot of TOU rates and informational interventions.
Aims: “ascertain the potential for smart metering technology, when combined with time of use tariffs and different DSM stimuli, to effect measurable change in consumer behaviour in terms of reductions in peak demand and overall electricity use” and to identify a “Tipping Point” that is a point at which the price of electricity will significantly change usage. (CER 2011:4)
Recruitment, response, segmentation used, control group, representativeness Test and Control Groups: participants divided into trial and control groups. Trial groups were asked to trial different ToU tariffs and DSM stimuli. The control group kept their normal electricity supplier tariff, did not receive DSM stimuli and were asked to continue consuming electricity as normal. Pre-and post-surveys were held among trial-participants. To the trial 5,375 were initially recruited and of this number, 5,028 were still in when allocation started in November 2009. Participant recruitment followed an ‘opt-in’ approach, with an average response rate of 30%. The trial group was representative of the national sample.
Interventions (pricing mechanism; technology; feedback) ToU rates: 4 tariffs offering different unit prices for night time, day time and peak times; and a weekend tariff. Aims of cost neutrality and cost reflectivity in the design of the ToU: - The ToU tariff would be neutral in comparison with the standard tariff to ensure that ‘average’ end-users who did not change their consumption patterns were not penalised financially .
- The trial-participants were guaranteed that they would not pay more than if they had been on the normal tariff. - The base ToU tariff was to reflect the underlying cost of energy transmission, distribution, generation and supply as per standard tariffs. - The ToU structure (time bands) would be based on system demand peaks. - Tariffs would be based on the cost inputs used in the 2009/10 regulated tariffs Feedback and technology: Smart meters were installed prior to the benchmark period. IHD showing near-real-time information on electricity consumption and costs and historical consumption
information Budgeting feature with default and self-entry options; Bi-monthly enhanced electricity bill and a monthly enhanced bill (enhance parts of the bill: information on
estimated costs of running select appliances, energy saving tips, weekly average costs of electricity, an explanation of changes in consumption, a list of online resources for further information)
a fridge magnet outlining the time bands and the tariffs per band, customized for each tariff group; a sticker providing details of the time bands
Overall Load Reduction (OLR) incentive: a financial incentive to reduce use 10% below actual historical consumption
Achievements: Response to tariffs and DSM stimuli
- The deployment of ToU tariffs and DSM stimuli reduced overall electricity use by 2.5% and peak consumption by 8.8%;
- The combination of bi-monthly bill, energy usage statement and IHD was more effective than other DSM stimuli. It resulted in a peak shift of 11.3%;
- Households with higher consumption levels tend to deliver greater reductions.
- Shifting mostly takes place from peak to post-peak; and in general from peak to night usage.
- Of the tariff groups that were trialled, no single one in combination with DSM stimuli stands out as more
effective than the others.
- The peak and overall load reductions detected for all the stimuli tested proved to be statistically significant. An exception is the overall load reduction detected for the bi-monthly bill and detailed energy statement

- 66 -
stimulus, although the peak load reduction for this stimulus was statistically significant;
- No evidence was found for a tipping point (demand for peak usage is estimated as being highly inelastic relative to price)
Demographic, behavioural and experiential conclusions
- 82% of the participants change their electricity use in response to the trial, with 74% indicating major changes in their households
- 75% thought the magnet was useful and 63% found the sticker useful;
- the IHD was found effective in supporting peak reduction (91% indicated the IHD as an important support) and supporting shifts to night rates (87% found it an important support).
- Barriers to peak reduction relate to the difficulty participants had with connecting behavioural changes to bill reduction. Their perceptions may have involved exaggerated expectations of savings and exaggerated expectations of consequences if reduction is not achieved;
- Barriers to shifting to night usage relate to safety and convenience.
- The OLR incentive was recalled by 58%. The communications, reasonableness of the target and effectiveness of the OLR incentive in motivating change were rated as very good.
- No secondary benefits were identified in increased awareness of general energy
- efficiency or in relation to efficiency investments for the home;
- The trial has made participants more aware of energy usage (54% agreed) which is in line with the recorded reduction in usage. 18% stated that there had been no impact on the way their household uses electricity;
- Households headed by individuals with higher education or social grade achieved higher levels of reduction compared to those with lower levels. This was partly related to the typically higher consumption levels of these households. Therefore, the impact of education or social grade on the ability to gain benefit from the tariffs is limited
- The impact of the tariffs on households that are entitled to receive Free Electricity Allowance – e.g. elderly, people that get invalidity or disablement benefits - showed that these exhibited the same levels of changes as other households (they do not appear to be disadvantaged)
- Fuel poor households (that lack financial means to adequately heat their homes) also benefit from the
deployment of time of use tariffs.
-
Remarks: Savings were not distributed equally across demographic groups. Households with higher initial consumption
and more formal education, higher incomes or more children under 15 had higher savings. Not clear how savings were achieved Interesting: comparability to Netherlands: no use of electricity for heating, no AC penetration This is one of the largest and statistically most robust trials to date.
2. The Energy Demand Research Project (EDRP) was a large project in the UK to test consumers’
responses to different forms of information about their energy use. The primary purpose was to
investigate consumer behaviour. Four energy suppliers conducted trials in the period from 2007 to
2010; two of these interventions made use of dynamic pricing and focused on shifting, in addition to
reduction. These two trials (conducted by suppliers EDF and SSE) tested time-of-use (TOU) tariffs for
electricity in combination with smart meters and other interventions (advice, historic and real-time
feedback, and incentives to reduce overall consumption). These trials showed effects on shifting load
from the peak period, with bigger shifts at weekends than on weekdays. Estimates of the magnitude
of shifting effect vary with trial but were up to 10%.
2 a. EDRP EDF trial ToU tariffs for electricity (EDRP, 2011; Foster and Mazur-Stommen 2012)
Duration: between 2007 and 2010
Scope: 194 participants (of a total of 1,979 participants, 194 were offered ToU Tariffs (the rest did not receive any dynamic pricing incentive)).

- 67 -
Aims: Aim of the ToU as part of this intervention was to shift peak consumption
Recruitment, response, segmentation used, control group, representativeness With one exception, all trial groups had smart meters and received more accurate billing, including the control group. There were 7 trial groups could with subdivisions between households with electricity-only accounts (received electricity smart meters) and households with dual fuel accounts (who received electricity and gas smart meters). 194 were offered ToU Tariffs and the control group consisted of 187 participants. Participants were recruited from EDF’s customer base in London and the southeast of England. To be eligible customers were required to have 4 meter readings in the 12 months prior to the start of the trial – but this was reduced to 2 meter readings due to the shortage of customers fulfilling the original specification. Several categories were excluded from participation (e.g. EDF staff; customers making use of consumption reduction products or services; etc) Estimated annual energy consumption resulted into low, medium and high estimated annual consumption households. Further stratification divided recruits using the following variables:
Prepayment users Fuel poor (based on a model that predicts the likelihood of a geographical area spending 10% of more
of their salary on fuel bills). Green: customers on a green tariff or have a very high propensity to be a green customer based on a
lifestyle code. Grey: customers of 55 years or older. High consumption Low consumption (was amalgated with the fuel poor)
The sampling frames for each trial group were randomised. However, for the „time of use‟ variable tariff trial, only medium baseline consumption households were recruited. The variable tariff trial group was difficult to recruit to because customers did not understand the principle of load-shifting and did not believe that the company would want to help them save money. EDF had to provide the recruitment agency with a special training session specifically on this intervention.
Interventions (pricing mechanism; technology; feedback)
ToU rates: The peak period was 16:30-19:30, night period was 23:00-06:00 and off-peak period was 06:00-16:30 and 19:30-23:00. The peak tariff was 161-169% of the off-peak tariff. Night tariff was 56-65%, depending on region. The off-peak tariff was between 8.41 and 9.03 pence per unit (excluding VAT). Feedback and technology: In addition to ToU tariffs, participants were supplied with:
- Smart meters
- Accurate billing
- IHD (Real Time Display)
- Energy efficiency advice, sent by post
-
Achievements: Estimates of the magnitude of shifting effect were up to 10%, with stronger effects in weekends compared to weekdays (EDRP 2011). However, Foster and Mazur-Stommen (2012) mention peak reductions of 8% in weekends and some 4 % during weekdays. Peak electricity consumption increased with additional household members under the age of 16; and with paraffin/oil/no heating in comparison to electric/gas heating. It was also higher for households in South East England. Overall, EDF found that differences in energy consumption between trial and control groups were more clear-cut for smaller households (one or two people). This finding should be viewed cautiously because the analysis did not take account of baseline data, but it is in keeping with the load-shifting results. Survey results:
- 38% of consumers in the ToU tariff trial sample were aware of the real-time display in their home, which was the lowest awareness amongst the trial groups in this study (this might have been caused by the fact that the IHD was more basic than that provided to some other groups. Consumers on the ToU tariff also rated the usefulness of the visual display below the ratings given by three of the four other trial groups).
- 65% of survey respondents in the ToU trial sample agreed or strongly agreed that the smart meter technology had enabled them to plan or budget their energy use. This compared to an average across samples of 55% of consumers that agreed or strongly agreed with the statement.
Remarks: EDF found a small but significant difference between trial and control group. AECOM, who analysed the data
as well, found a large reduction in energy use, taking into account the control group and baseline

- 68 -
consumption, but it was not statistically significant (or meaningful) because the sample size was too small for households where both in-trial and pre-trial data were available. The effect on overall consumption is therefore unproven but plausible.
the IHD provided was more basic than in the other trials and the survey revealed that it was less likely that customers would be aware of its existence; those who were aware rated it as being less useful.
2b. EDRP SSE trial in UK (EDRP, 2011; Foster and Mazur-Stommen 2012; Frontier Economics and Sustainability First, 2012)
Duration: 2007-2010
Scope: 1,352 participants
Aims: Aim of the ToU as part of this intervention was to shift peak consumption
Recruitment, response, segmentation used, control group, representativeness SSE used its national customer base of 1.4 million customers. Participating households were stratified demographically in order to ensure that treatment and control groups were similar. Within trial groups, households were stratified according to being aware of the trial and committed to energy consumption reduction. In some trial conditions, only the Aware and Committed groups were used.
ve said that they were committed to reducing energy.
As the initial recruitment rates for the Aware and Committed groups were between 3% and 10%, the recruitment methods were adapted (e.g. withdrawing the recruitment questionnaire; changes in the correspondence; systematically following up letters with telephone calls; accepting a statement of commitment from customers by telephone rather than a written commitment).
Interventions (pricing mechanism; technology; feedback) ToU was based on electricity tariffs varying with time of day, season and day of the week (weekday vs weekend). Peak period:16:00-19:00; night period: 00:30-07:30; off-peak period: 07:30-16:00 and 19:00-00:30. Low Season: March-October. Off-peak tariff was between 10.29 and 10.88 pence per unit (excluding VAT), varying with region. The peak tariff was 180-190% of the off-peak tariff (for both weekdays and weekends) and the night tariff was 50-60%. High Season was November-February and the off-peak tariff was between 10.87 and 11.46 pence per unit. The peak tariff was 180% of the off-peak tariff at weekends and 210% on weekdays; the night tariff was 50-60%. Feedback and technology
- booklet
- monthly bills with graphs
- incentive to reduce consumption
- IHD and web information.
Achievements: Load shifting in the SSE trial was smaller than for the EDF trial. Peak demand reductions were small, some 0,3 % on weekdays, and 0,5% in weekends (Foster and Mazur-Stommen 2012) - Groups without web information and without a real-time display shifted more load away from peaks – suggesting that too many interventions increase complexity which reduces the response. - The percentage of usage in the peak period was higher in the high season compared to the low season. - The percentage of consumption that alls in the peak period is reduced by the incentive to shift but by only a small amount – from 19.8% to 19.5%. - The percentage shift from peak to night electricity usage is estimated as 8.5-10.1%, based on peak season consumption at night (overall shift from peak is not estimated). Survey results: Survey data from participants with smart meters (and/or RTDs) in the SSE trial found that the most frequent
reason for joining the trial was to save money, and the next most frequent motivation was to help the environment.125
The energy advice booklet had a high recall rate (80%), and consumers were more likely to say it was quite

- 69 -
or very useful, and to still refer to it, if they owned an RTD. Early survey evidence on the recall of additional billing data was low (32% recalled something different
about their bills). Use of the website by consumers with smart meters was low, at 9%. Satisfaction with and recall of smart meters was higher for credit and prepayment consumers (who had an
RTD) than for consumers without an RTD. Respondents rated cost information above energy information on RTDs, and the traffic light display was
rated the most useful feature. 40% of consumers aware of the incentive to shift reported that they had shifted their electricity demand and
saved money, 33% reported they had shifted their demand but not saved money, and 28% reported that they had not shifted their demand.
Consumers without the incentive to shift or reduce demand reported that the night rate would have to be 19-32% cheaper than the peak day rate in order to encourage them to shift their demand.
Remarks: The report stated that the limited impact might be due to the limited awareness of the intervention and a perception that it was overly complex.

- 70 -
3. TEMPO tariffs in France. (EFFLOCOM, 2004; Faruqui, Hledik and Palmer, 2012; Frontier Economics and Sustainability First, 2012; Stromback et al, 2011)
Duration: 1989-1992 (experimental stage), 1993-1995 (tariff launch), and generalisation after 1995.
Scope: Tempo was first tested by French utility EDF in 1989 and then offered to its residential customers starting from 1995. • Experimental stage: 800 consumers. • Launch (1993 onwards): 20,000 by 1995. • Generalisation: there were more than 300,000 domestic tempo customers in 2004.
Aims: the purpose was to study the effect of dynamic tariff on electricity consumption patterns.
Recruitment, response, segmentation used, control group, representativeness Different customer classes were identified according to their heating system, typically:
- electric space heating
- electricity space heating and wood-burning fire place
- dual energy system (electricity + oil)
- heat pumps
- without electric space heating. 800 customers were recruited in 6 different geographic regions (Alsace, Lorraine, Massif-Central, Rhône Alpes, Poitou-Charente, Ile de France). After generalization, opt-in is for consumers that choose to be on the tempo tariff. These end-users are in principle prepared to change their behaviour in order to save costs (FE and SF, 2012)
Interventions (pricing mechanism; technology; feedback) Combination of ToU and CPP: The number of days of each type is known in advance but the type of any particular day is announced only at the end of the preceding day. CPP pricing: The year is divided into three types of days: 300 blue days (the least expensive) (weekend days were always blue) 43 white days (medium price) 22 red days (the most expensive). ToU rates: Each day is divided into two fixed periods: peak hours (day) and off-peak hours (night). The colour of the day is chosen by the national operating system at the end of each day for the next day. Once the colour of the next day is decided, the signal is transmitted to the customer and displayed both on their meter and on a small box which can be plugged into any power socket. The box also indicates the day’s colour and the current hourly rating. This system of “traffic light” coupled with various energy control systems offer a cheap and efficient way to inform participants. For the launch (1993 onwards), four different combinations were offered: the standard tempo tariff; dual energy tempo, for households with a dual-energy boiler, which can switch source automatically
depending on the current price; thermostat tempo which adjusts heating depending on the current price; and comfort tempo, which manages end uses (e.g. space and water heating and large electric appliances). Feedback and technology: For launch (1993 onwards): A smart meter displaying the same information as the notification device, as well as the consumption per
tariff period. A notification device which can be plugged into a power socket which displays the colour of the day and the
current hourly rating. It also provides advance notification of the colour for the next day from 8pm. • Energy control systems that enabled consumers to programme their demand (and communicate this to
appliances) according to current prices and their specified indoor temperature. • information booklets, a start-up visit and advice from a tempo specialist, and option to receive a report after
one year to set out the billing differences under the tempo tariff.
Achievements: The total peak load reduction is 450 MW, which is due to an average peak load reduction of 45% on red days and 15 % on white days (Faruqui, Hledik and Palmer 2012. Load shifting from peak to off-peak hours was 1.3

- 71 -
times higher on white than blue days, and higher again for red days. The main consumption reductions on white or red days are due to reduced electric heating. Consumers either used fireplaces or accepted a lower temperature. Consumption reductions on white and red days were stable over the years. Customers’ satisfaction level: a survey showed the following results: – 84% of the customers were quite or very satisfied with this option, – 59% told that they had made savings (average or substantial for ¾), – 53% considered the option as slightly restrictive or entirely unrestrictive, – 87% understood the tariff principle very well. The Tempo tariffs, launched in 1989, are appropriate for large households with electric heating. 22 years after its launch it still cut total national peak consumption by 4% (Stromback et al, 2011:63)
Remarks: The level of price responsiveness is much higher than in most other pricing pilots in different parts of the world. Faruqui,Hledik and Palmer (2012) state that this might be due to the program’s long history, its extensive customer education program (including in-home visits), and the wide range of load control technologies and
informational devices that are provided.
4. PowerShift, Northern Ireland (Gill and Owen, 2007; Frontier Economics and Sustainability First, 2012)
Duration:2002-2003
Scope: 100 keypad (prepayment) consumers on the ToU tariff, and an additional control group of 100 keypad consumers with the flat rate tariff.
Aims: study the response of Keypad users to ToU tariffs
Recruitment, response, segmentation used, control group, representativeness In 2009, 30% of consumers in Northern Ireland used keypad prepayment meters. Eligible to participate in the ToU tariff group were prepayment consumers with a Keypad meter with an IHD, which allowed them to monitor their current load, tariff rates, the number of units used at each rate, previous costs and remaining credit. Customers are offered the option to switch to the Power shift tariff - by means of one phone call - and and they can opt out again if they wish to in the same manner.
Interventions (pricing mechanism; technology; feedback) The trial tested a time-of-use (ToU) tariff with low, medium and high price periods. The hours of operation for these differed between weekdays and weekends. Weekdays: Midnight to 8am – green (low) 8am-4pm – amber (medium) 4pm-7pm – red (high) 7pm-midnight – amber (medium) Saturdays and Sundays : Midnight – 8am – green (low) 8am-7pm – amber (medium) 7p m-midnight – green (low) The applicable rates (including VAT) are : 6.56p/kWh - low (40% lower than standard keypad) 9.84p/kWh - medium (10% lower than standard keypad) 17.50p/kWh - high (60% above standard keypad) Technology and feedback - Keypad meter - IHD - A leaflet with advice on how to avoid using some appliances during peak hours; estimates of the cost of using specific appliances (tumble dryer, washing machine, and electric shower) during the different periods compared to the standard rate.

- 72 -
Achievements : Keypad consumption already was 6.4% in 2005-2006 lower compared to average overall domestic electricity consumption in Northern Ireland. Consumers on the ToU tariff lowered peak consumption (1-2 %) relative to the control group, but their overall usage slightly increased. Still, their bills went down. So the participants saved money, not energy.
Remarks: Because consumers were positive about the trial, some 1000 additional customers were recruited to the Powershift concept in 2007.
5. Norway Demand Side Response (DSR) Pilot Study (2010) (Seale, H. and Grande, O., 2012).
Duration: 1 year, 2013
Scope: 40 households, from the same geographic area and with hourly electricity metering above a certain quality.
Aims:
Recruitment, response, segmentation used, control group, representativeness
- households were not randomly selected
- 10% had hot water space heating with an electric boiler. The remaining 90% used standard capacity electric boilers.
Interventions (pricing mechanism; technology; feedback)
- ToU tariff (a morning and evening peak period on weekdays)
- direct control (during peak periods only).
- 2 information meetings to inform participants about the pilot (e.g. peak hours, pricing, and the possibilities
for demand shifting)
- communication material: information on the benefits of demand response.
- hourly metering with use of existing automatic meter reading technology.
- 3 magnets to place on appliances, displaying morning and afternoon peak hours. Under the direct control regime, a response of electric water heaters was automated during peak periods. Installation costs for remote load control were 80-375 € per participant.
Achievements: Survey results showed that participants evaluated the pilot positively. Their main interest was in personal
economic benefit, followed by reduced consumption of electricity. Participants accepted remote load control, provided it didn’t affect their comfort negatively. The average reduction during morning peak load was 1kW per hour for participants with standard electric
water heaters, and 2.5kW per hour for participants with hot water space heating systems. Several participants adapted their behaviour to the ToU tariff, by investing in energy control systems; buying firewood in winter; and manual efforts
Remarks A larger average peak load reduction was achieved compared to a previous pilot. This was understood as indicating that in this trial participants were manually reducing peak load, as well as reducing load via direct control. The reminder magnet might have been helpful in this regard (was not included in previous pilot) (however, sample size (40 participants) is small.)

- 73 -
6. Elforks pilot 2 in Sweden (Lindskoug, 2006)
Duration: the 2003/2004 and 2004/2005 winter seasons
Scope: the first winter season, 53 customers of Skånska Energi participated; in the second winter season the trial was extended with 40 additional customers of Vallentuna Energi
Aims: an overarching aim of the project is to address the (increasing) risk of capacity shortage in the Swedish electricity supply system during periods of extremely cold weather.The aim of the pilots was to demonstrate approaches that lead to an electricity demand reduction at a national level at times of high spot prices. The need for the measures to be profitable for the parties involved is an important starting point. The goal of Partial Project 2 was to examine the price sensitivity of customers with various heating alternatives.
Recruitment, response, segmentation used, control group, representativeness To get around the problem of Hawthorne effect (participants are likely to behave differently when they know that
they are being studied), the trials were introduced as an offer from the electricity supplier to take part in a commercial assessment using a new pricelist - and as such conceals the marked research aim. For both cases, a random 200 customers was approaches with an offer.
Interventions (pricing mechanism; technology; feedback) Critical Peak Pricing: The trials were carried out using relatively moderate price differences compared to the extreme pricing levels expected in a future capacity loss situationThe trial tested price as a control method to persuade customers to shift load. A special price list was prepared for the trials. This price list allows the electricity supplier to apply a higher charge for a maximum of 40 hours. For the rest of the year the deduction is made from the customer’s regular fee. The higher electricity price was in the 3-10 SEK per kWh interval. The customer was notified the day before of the time and level of peak price via text message or e-mail. The price list is designed to guarantee cost neutrality relative to the regular price list as long as the customer doesn’t affect any changes. In the 2003/2004 winter, 15 critical peak moments (amounting to 39 hours of high prices) took place. The winter
of 2004/2005 saw high price notifications to Skånska Energi’s customers for a total of 37 hours on 14 occasions, and 39 hours on 15 occasions for Vallentuna Energi’s customers. Feedback and technology - text message or e-mail - advice on how to temporarily reduce electricity usage and which actions have significant impact, depending on heating alternatives and systems.
Achievements: The results from the trials show conclusively that a price sensitivity exists toward temporary price levels in the 3-10 SEK per kWh interval. The technical results, questionnaires and in-depth interviews show a consistent picture of the customer’s generally large willingness, ability and persistence to reduce electricity usage during times of high prices. The load was cut back to an average of at least 50% during high price instances. Another important conclusion from the project is that the results have been achieved without having to install
new technology at the customer end. The price interval of 3-10 SEK per kWh for a maximum of 40 hours a year has been sufficient to achieve sizeable load reduction. The load reduction has not become significantly greater at notified prices of 5 and 10 SEK/kWh compared to 3 SEK/kWh. The results of the interviews summarised: - It was felt that the trials have gone well. - Participants had varying motivations for participating: economic profitability; both economically profitable and interesting; good from an environmental perspective; a challenge to see how much could be saved by reducing power usage. - Realising changes was not viewed as troublesome or time-consuming - No major drawbacks were experienced in connection with lowering electricity usage. - The response to the level of reimbursement varied between the households. But overall, it was remarkable that the amount of profit wasn’t all that counted. The feeling of being able to help, doing something beneficial to the environment was important as well. - Despite many not having a clear idea of how they saved, they were happy with the trial.
- A continuation with this type of tariff was viewed positively. - Households were ready to finance and install some form of control equipment themselves. - Large-scale roll-out was not considered to present any major problems.

- 74 -
Remarks:
7. Intelliekon (Fraunhofer-Institute for Solar Energy Systems ISE, 2011; Schleich et al 2011)
Duration: preparations started in 2008; the ToU trial only lasted only 3 months
Scope: a trial included over 2000 households - of which part was provided ToU incentives
Aims: to examine household behavioural responses to feedback instruments; to gather valuable data on energy saving due to feedback and smart meters
Recruitment, response, segmentation used, control group, representativeness Recruitment: of customers who already had a smart meter installed or would get one. More than 2000
households were motivated to take part, including people of different ages, genders, household sizes and living conditions. Over half of the sample received feedback on their energy consumption for more than a year. They could choose between a web portal or written feedback (monthly). People of this sample were surveyed three times during the trail - addressing their attitudes and motives towards feedback and energy saving as well as their evaluation of the feedback. The other households received a smart meter, but they did not get any feedback on their consumption. They were surveyed twice – at the beginning and at the end of the field trial – and their electricity consumption was also recorded. A control group like this is important to be able to compare households with and without energy feedback. - Part of this group could choose a tariff with two price levels which varied depending on the time of the day.
Interventions (pricing mechanism; technology; feedback) Choice between Web portal: overview of energy consumption (e.g. per hour, day, week, month; showing base load, electricity consumption by cooling appliances (blue) and other electricity consumption (yellow).
- practical advice on energy saving. - option to download their consumption data easily and to save it. OR: Written information: mainly sent to people who did not have any access to the Internet and those who preferred the written form. It showed the energy consumption of the previous months, weeks and days; provided estimates of base load share of energy consumption; provided advice on energy saving AND/OR ToU tariff: there were two tariffs, peak and off-peak with a large difference between peak and off-peak (factor 2,5) Participants in the variable tariff option saved more energy (3 times more) than households that only received energy consumption feedback.
Achievements in experimental stage: Households with a time-variable tariff attained an extra energy saving of 6 % (on top of the average 3.7% achieved by the group without dynamic pricing) , the load shift was only 2 %.
Most users judged the feedback as informative, helpful, well-designed, easy to use and understandable. A minority was concerned about data security and a smaller number found being involved consciously in energy-consumption matters was inconvenient and time-consuming. Most people surveyed showed a clear willingness to

- 75 -
save energy. The written information was judged almost as positively as the web portal. Suggestions for improvement included a display of the energy consumption in real time and a breakdown of the electricity consumption for each appliance in the web portal.
Remarks: The duration is rather short for evaluating durable changes in routine behaviours
8. Efflocom pilot in Norway (Efflocom 2004)
Duration: 2001-2004
Scope: 10,485
Aims: to increase the end-user flexibility in periods of scarcity of electrical energy and power by establishing the basis for the set-up of a an infrastructure based on ICT-solutions for direct communication and load management.; by developing, testing and evaluating different incentives to encourage flexibility in consumption (based on tariffs)
Recruitment, response, segmentation used, control group, representativeness
Technology for direct communication was installed at customers located in the concession areas of the network operators Buskerud Kraftnett and Skagerak Nett. Interventions (pricing mechanism; technology; feedback) Residential consumers were placed on one of three tariffs. • a ToU tariff; • a dynamic tariff with a real-time element depending on the wholesale spot price; and • a dynamic tariff with a temperature dependent part. Of the participating households, 50 % of the houshold customers were to be equipped with potential for load control via the two-way communication link). For the household customers, the boiler for water heating and some floor heating were the appliances that are most relevant for load control. The variable parts of the dynamic tariffs were only activated in periods of peak load (8-11am and 5-8pm for November-April). For consumers that accepted remote load control, low prioritised loads (Boilers for water heating) could be disconnected by the energy supplier under certain conditions Technology and feedback: - smart meters (two-way communication), including hourly metering - and a separate channel for remote control
Achievements: Results for Buskerud Kraftnett showed the following. - For consumers with remote load control: 12% reduction in morning peak usage, and 14% reduction in afternoon peak usage. (1,230 consumers) - For consumers with the ToU tariff but no load control, maximum peak use reductions were 10% in the morning and 7% in the afternoon. (39 consumers). - Results for the ToU tariff and spot price on an hourly basis show peak use reductions of 35% in the morning and 31% in the afternoon, but the sample size was small (6). - Results for use of power contract with spot price on an hourly basis, without technology for load control, shows peak use reductions of 15% during the morning and 22% during the afternoon (17 customers) Results for Skagerak Nett showed the following. - For ToU consumers without load control, the maximum peak period demand reductions were 8% in the morning and 9% in the afternoon (198 consumers) - Results for both ToU tariff and spot price on an hourly basis: peak use reductions of 16% during the morning and 24% during the afternoon (34 customers) - For consumers with ToU pricing and an hourly spot price, the maximum peak period demand reductions were 14% in the morning and 28% during the afternoon (24 consumers).
Remarks: study is not providing clarity on methods of recruitment, results, use of control group etc.

- 76 -
Annex 2: Load flexibility for different appliances
Household practice or need: Cleaning and washing: Tumble Dryer
Flexibility in terms
of potential load
shifting
Tumble dryer is a large load and can contribute significantly
Options for
reduction
Drying without tumble dryer when possible (preferably not indoors due to health
issues)
Reduction can also be accomplished through the investment in more energy efficient
tumble dryer or a washing machine that dries the laundry more effectively.
Type of behaviour Routine
Investment
Flexibility in terms
of Willingness to
shift and reduce
Shifting: limits to willingness to shift time of washing and therefore drying due to
household routines and needs and limits to norms around air drying (some segments
might see it as a poor people's thing to do)
Automation/
remote control?
A general problem is that from a technology point of view this load is easily controlled
remotely or with automation, but many households express concerns around the
clothes getting folds because they lie still for too long if not put in wet and taken out
immediately after the cycle is concluded.
Household practice or need: Cleaning and washing: Washing Machine
Flexibility in terms
of potential load
shifting
In principle the washing machine can be used flexibly during the day by means of
timers or remote control. the shifting potential is high.
Options for
reduction
Reduction can be accomplished by lower temperature settings, using the eco cycle,
washing only with full loads, and by investing in more energy efficient washing
machine
Type of behaviour Routine
Investment
Flexibility in terms
of Willingness to
shift and reduce
Shifting use of washing machine is a tricky thing because households have concerns
about the hygiene and folding of laundry if left in the closed machine for too long.
Automation/
remote control?
The washing machine can easily be controlled remotely or with a timer, and remote
control also allows for temporary stops of the washing cycle.
Household practice or need: Cleaning and washing: Dish Washer
Flexibility in terms
of potential load
shifting
There usually is a great many hours between the filling and emptying of the
dishwasher, in which time the appliance use can be shifted. To avoid perverse use of
cost beneficial time of use and the consequential increase in consumption it is
important to make sure the dishwasher is only turned on when full.
Reduction can be accomplished by washing by hand, but then there is a rebound in
gas for water heating.
Options for
reduction
Reduction can be accomplished through the investment in more energy efficient
dishwasher
Type of behaviour Routine and investment
Flexibility in terms
of Willingness to
The dishwasher can relatively easily be turned on off-peak

- 77 -
shift and reduce
Automation/
remote control?
Remote control of the dishwasher is relatively easy to manage and relatively
acceptable to households in general.
Household practice or need: Eating and drinking: electric cooking
Flexibility in terms
of potential load
shifting
Not very flexible since this is linked to cultural routines. some dishes can be prepared
before peak hours and then only reheated.
Options for
reduction
Reduction can be achieved through tailored tips such as turn off the pasta as soon as it
cooks; turn to steam cooking, put lids on pans, cook for more days at a time.
Type of behaviour Routine
Flexibility in terms
of Willingness to
shift and reduce
very limited willingness to shift cooking between 7 & 9 pm to later time Cooking
routines are strongly linked temporally. Not much options to shift to off-peak unless
food is cooked before peak periods and then reheated.
Automation/
remote control?
Cooking cannot be automated, nor are appliances used for cooking.
Household practice or need: Eating and drinking: water cooker, microwave, espresso machine, coffee
grinder, blender, oven
Flexibility in terms
of potential load
shifting
The theoretical potential is reasonable
Options for
reduction
Reduction can be achieved by means of investment in more energy efficient appliances
and through tailored tips such as: cook/heat no more than needed
Type of behaviour Routine
Flexibility in terms
of Willingness to
shift and reduce
Some things can shifted but has one person commented: "what am supposed to do,
have cold tea?" the potential is limited. The use of these appliances and the needs
they fulfil are felt frequently during the day and changing them would severely affect
feelings of comfort.
Automation/
remote control?
No real options for automation of these functions
Household practice or need: Eating and drinking: Fridge and freezer
Flexibility in terms
of potential load
shifting
The fridge and freezer represent a significant load in many households and have great
potential for flexible load.
Options for
reduction
Reduction can be achieved through the investment in a more efficient fridge or freezer,
but also by automated control of the temperature and defrost options (turning of 15
minutes every hour has no impact on temperature or hygiene). in addition tailored tips
such as:
- set temperature right
-do not leave door open too long.
-put second fridge/freezer in barn or cellar during winter
Type of behaviour Routine/one-off
Flexibility in terms
of Willingness to
Several projects have been undertaken with this automated control of the fridge and
households are in general willing to allow this load management option.

- 78 -
shift and reduce
Automation/
remote control?
automated turn-off for small periods
Household practice or need: Comfort: lighting
Flexibility in terms
of potential load
shifting
In general light is necessary, the amount could be reduced but the load not really
shifted.
Options for
reduction
Reduction can be achieved by turning off lights in unused rooms, and by installing CFL
or Oled bulbs or motion detectors
Type of behaviour Routine and investment
Flexibility in terms
of Willingness to
shift and reduce
People will not be very willing to reduce light levels in their homes, except for turning
off lights when they leave a room.
Automation/
remote control?
yes (timer; lightning control systems) and movement detection systems.
Household practice or need: comfort: outside lighting
Flexibility in terms
of potential load
shifting
This light can be connected to movement detection and can be turned off during peak
hours.
Options for
reduction
turn off lights & use saving bulbs and motion detection
Type of behaviour Routine and investment
Flexibility in terms
of Willingness to
shift and reduce
people might be unwilling to turn off certain types of outdoor lights, such as Christmas
lights since the explicit aim is to be visible.
Automation/
remote control?
yes (timer, lightning control systems), motion detectors
Household practice or need: leisure: TV
Flexibility in terms
of potential load
shifting
Watching television during other activities can be unlearned. However, the watching of
television in the evening is often a non-negotiable activity that is deemed necessary to
unwind. Some shifting is possible by watching television on other media such as tablets
that have been charged beforehand.
Options for
reduction
turn off when no one’s watching
Type of behaviour Routine
Flexibility in terms
of Willingness to
shift and reduce
very limited willingness to shift watching TV between 7 & 9 pm to later time
Automation/
remote control?
The only real option would be to connect the TV to batteries so that the direct
consumption of energy can be temporarily shifted
Household practice or need: leisure: Music installations
Flexibility in terms
of potential load
shifting
Listening to music on devices with batteries such as laptops, iPods, mp3 players

- 79 -
Options for
reduction
turn off when no one’s listening
Type of behaviour Routine
Flexibility in terms
of Willingness to
shift and reduce
For many households having the radio or music player on during other activities or
when not at home as 'companion 'to pets is a difficult behaviour to change.
Automation/
remote control?
No automation available to shift this behaviour.
Household practice or need: leisure: games
Flexibility in terms
of potential load
shifting
With online gaming the only way to shift consumption is by means of battery devices
such as laptops. However to have a good gaming experience usually a desktop
computer is required.
Options for
reduction
limit use of games
Type of behaviour Routine
Flexibility in terms
of Willingness to
shift and reduce
This activity is comfort and leisure related and very much linked to relaxation time in
the evening
Automation/
remote control?
Automation is not relevant for this activity
Household practice or need: leisure: PCs/tablet
Flexibility in terms
of potential load
shifting
the total consumption of these devices is significant, and as such the potential load
shifting as well, although these devices are used rather constantly during the day
Options for
reduction
turn off when not used, charged in off-peak periods. Buying more energy efficient
devices.
Type of behaviour Routine and investment
Flexibility in terms
of Willingness to
shift and reduce
The activities related to these devices are usually not very shift able, e.g. servers or
work related.
Automation/
remote control?
Not relevant
Household practice or need: care: hair-dryer; el toothbrushes, el razors, etc.
Flexibility in terms
of potential load
shifting
Not very significant load
Options for
reduction
limiting use of hair dryer; not using the electric toothbrush every day, razing by hand
etcetera
Type of behaviour Routine
Flexibility in terms
of Willingness to
shift and reduce
People could be motivated to perform these activities later in the evening before going
to bed, instead of in the morning. However, it requires a change in norms and
perceptions of comfort.
Automation/
remote control?
No automation possible here, would even be worthwhile limiting the electronic device
use in this area.

- 80 -
Household practice or need: ease: standby
Flexibility in terms
of potential load
shifting
Significant load shifting potential
Options for
reduction
use stand-by killers
Type of behaviour One-off/investment and Routine
Flexibility in terms
of Willingness to
shift and reduce
Turning otherwise standby devices off completely during peak periods could work, if
people are convinced that the settings will be preserved.
Automation/
remote control?
Automation can create increased level of comfort
Household practice or need: cleaning and maintenance: Vacuum cleaner; do-it-yourself and garden-
related machines (e.g. lawn-mower, drilling machine, terrace heater)
Flexibility in terms
of potential load
shifting
These activities can be shifted to off-peak periods, They very often already take place
in off-peak periods.
Options for
reduction
reconsider usage and frequency of cleaning with electronic devices, stimulate use of
brooms, and manual devices or otherwise buy energy efficient machines
Type of behaviour Routine and One-off/investment
Flexibility in terms
of Willingness to
shift and reduce
People can probably be motivated to shift the time of use
Automation/
remote control?
Not really possible, mostly requires manual activity.

- 81 -
Annex 3: Dynamic pricing approaches tailored to 6 segments
Segment 1 Idealistic savers
General
Considerations
This group shows most efforts to save energy, and already does a lot in terms
of reduction. Driven by idealism, these people are willing to make financial
sacrifices and impose restrictions on themselves even if it means loss of
comfort. This customer is knowledgeable and consists largely of highly
educated women.
Preferred behaviour Both routine behaviour and efficiency measures
Main motivation This group could be motivated to shift their consumption but from an
environmental motivation.
Choices related to
Pricing Mechanism
Saving and shifting will not be financially motivated (no emphasis should be
put on money)and a price incentive may not be the best incentive. If a price
incentive is used, a combination of ToU, possibly with CPP, is a good option to
visualise energy shifting options. Because this segment is not financially
motivated, RTP is probably not suitable (because you still need to respond
strongly to price). You could also simply CPP (and focus on shifting only).
Choices related to
technology
Since this group is highly educated and well informed, different technologies
can be used to support further behavioral change. The use of technology
should be functional for this group. Almost all options are ticked in the toolbox
because these people want information to be provided both at home and at
work on PC, smart phone, IHD. This group does not like ceding control
(especially to a party that is less environmentally conscious and idealistic than
themselves). Remote control by third parties is not an option, automation is
possible if this group can control it themselves.
Choices related to
Feedback
Detailed and differentiated information is desired. Because this group is well
informed, she is well able to interpret the information. Text, graphics, and / or
lamp signals when price changes are options. Tailored advice needs to be
focused on shift options. What is important for this target group: who gives
feedback and how reliable they find this party?
IBR
CPP
CPR
RTP
ToU
none
IHD
Energylamp
Smart meter
App
Magnetic sticker
Automation
Remote control
Post
Website
Colour change
Emoticons
Graphic
Tailored tips
Sound
€/kWhUse kWh
Reduction kWh
CO2 emmission
Emoticons
Graphic
Numbers
CO2 reduction
Reduction €
Use €
Per appliance
Per space
Comparative
Benchmark
Invoice detail.
Tailored tips
Goal setting
Historic
Per activity
PRICING Mechanism
TECHNOLOGYPrice related Use related Frequency,.
Level, type
FEEDBACK: FEEDBACK: FEEDBACK:
Pricing Approach segment 1

- 82 -
Segment 2 Selfless inconsistent energy savers
General
Considerations
This customer is already highly motivated, highly educated and fairly reasonably
prosperous. This group also shows significant energy-saving activities. At the
same time, they are not very consistent: although they do believe that they can
make a difference, they are quite inconsistent in terms of energy efficiency
measures at home - because at that level they do very little.
Preferred behaviour More routine and less investment behavior.
Main motivation This group could be motivated to shift their consumption but from an
environmental motivation.
Choices related to
Pricing Mechanism
Saving and shifting will not be financially motivated (no emphasis should be put
on money). TOU and / or inclining block prices, in combination with CPP or CPR
would fit this group. Since the motivation is not primarily financial in nature,
RTP is probably not perfect (because you still need to respond strongly to
price).
Choices related to
technology
Since this group is well-educated (but not as well informed) we can assume that
different technologies can be used to clearly and adequately inform the user
good about their behaviors and their impact. This group is willing to pay for the
technology as long as it is functional. this group is not worried by remote
control and automation may be appreciated, but can also put a brake on
learning of this group (see below).
Choices related to
Feedback
Clear and understandable feedback to the end user is needed to allow them to
start a learning process on their own (inconsistent) behavior and opportunities
for improvement (also e.g. goals, and advice on investment behavior). Since
these users are motivated, this may result in an actual decrease AND shift in
energy. Thus, in the beginning especially graphics and light signals can be used,
and in time the information can be further differentiated in accordance with the
growing understanding of the end user.
IBR
CPP
CPR
RTP
ToU
none
IHD
Energylamp
Smart meter
App
Magnetic sticker
Automation
Remote control
Post
Website
Colour change
Emoticons
Graphic
Tailored tips
Sound
€/kWhUse kWh
Reduction kWh
CO2 emmission
Emoticons
Graphic
Numbers
CO2 reduction
Reduction €
Use €
Per appliance
Per space
Comparative
Benchmark
Invoice detail.
Tailored tips
Goal setting
Historic
Per activity
PRICING Mechanism
TECHNOLOGYPrice related Use related Frequency,.
Level, type
FEEDBACK: FEEDBACK: FEEDBACK:
Pricing Approach segment 2

- 83 -
Segment 3 Thrifty energy savers
General
Considerations
The thrifty savers are into energy-saving as long as this does not bring them
any negative financial consequences. This also applies to their acceptance of
policies: these should not ask for any additional financial efforts from end
users. These are older people with lower incomes.
Preferred behaviour Focus on routine behavior
Main motivation Their motivation is not primarily intrinsic- but relates to financial necessity and
social pressure. If shifting pays off financially they would be interested.
Choices related to
Pricing Mechanism
Since financial motivation is strong dynamic pricing rates are all possible in
principle. This segment accepts intervention if it pays off (in any case is should
cost nothing extra). ToU, IBR, in combination with CPP or CPR may be used.
RTP is an option, especially if it offers additional opportunities for savings. It is
important that this segment understands what it all entails and receives clear
information and tailored tips.
Choices related to
technology
Since these people are older, not very well educated and not very prosperous,
we assume a surfeit of technology to do more harm than good. This segment
will not want to invest (payback time is probably unfavorable due to old age).
The technologies used need to be functional, designed to provide the
necessary information via an easily programmable IHD, with postal and
magnetic sticker reminders. Remote control is most probably not attractive to
this group.
Choices related to
Feedback
Good regular guidance accompanying the technology is important. The
feedback should clearly show the financial savings and provide tips to save
even more. Feedback channels are: oral, mail, TV commercials. Because this
segment is sensitive to societal expectations of energy efficient behavior,
comparative feedback is also desirable. It is important to keep in mind that this
is potentially a vulnerable segment and the behavioral changes should not
compromise health or well-being.
IBR
CPP
CPR
RTP
ToU
none
IHD
Energylamp
Smart meter
App
Magnetic sticker
Automation
Remote control
Post
Website
Colour change
Emoticons
Graphic
Tailored tips
Sound
€/kWhUse kWh
Reduction kWh
CO2 emmission
Emoticons
Graphic
Numbers
CO2 reduction
Reduction €
Use €
Per appliance
Per space
Comparative
Benchmark
Invoice detail.
Tailored tips
Goal setting
Historic
Per activity
PRICING Mechanism
TECHNOLOGYPrice related Use related Frequency,.
Level, type
FEEDBACK: FEEDBACK: FEEDBACK:
Pricing Approach segment 3

- 84 -
Segment 4 Materialistic energy consumers
General
Considerations
The materialists do little to save energy, but are open to energy efficiency
measures for the house. They are not very positive about policies if these have
financial implications for them. Majority are male.
Preferred behaviour (open to) mainly investment measures for the house and perhaps also energy-
efficient or smart devices.
Main motivation This end user is difficult to motivate but financial incentives provide a good
entry that matches the motivation. this segment is open to shifting if it pays
off financially.
Choices related to
Pricing Mechanism
Price is the main consideration for energy behaviour change in this segment
and this group accepts intervention only if it pays off. Since the materialist by
itself not very motivated, ToU price mechanism is probably too weak an
incentive for him to get moving, furthermore toU asks for routine behavior
change. A sturdy IBR or CPP / CPR, with large differences between peak and
off-peak, can work. RTP is also an option, if linked to an automation or remote
control system so that this segment does not have to follow the price
fluctuations.
Choices related to
technology
The materialist loves technology, gadgets. The common items (smart meters,
IDH) and Apps are convenient, but remote control and automation are
attractive as well. It may cost some money as long as the return on investment
i s short and provides additional benefits such as status. Links with security
systems or home automation can also help to stimulate interest because the
materialist likes to invest in his own house.
Choices related to
Feedback
Clear and understandable feedback that aims to inform the end user about the
financial savings as a result of investment in housing and appliances is
valuable. feedback should also offer tips to realise even more financial savings.
Historical and goal setting feedback and tailored advice can provide additional
support .
IBR
CPP
CPR
RTP
ToU
none
IHD
Energylamp
Smart meter
App
Magnetic sticker
Automation
Remote control
Post
Website
Colour change
Emoticons
Graphic
Tailored tips
Sound
€/kWhUse kWh
Reduction kWh
CO2 emmission
Emoticons
Graphic
Numbers
CO2 reduction
Reduction €
Use €
Per appliance
Per space
Comparative
Benchmark
Invoice detail.
Tailored tips
Goal setting
Historic
Per activity
PRICING Mechanism
TECHNOLOGYPrice related Use related Frequency,.
Level, type
FEEDBACK: FEEDBACK: FEEDBACK:
Pricing Approach segment 4

- 85 -
Segment 5
Comfort-oriented indifferent energy consumers
General
Considerations
The comfort oriented are the least likely to energy saving behaviour. They do
not care about the potential societal problems that the increasing energy
consumption entails. They do not feel responsible and energy consciousness is
nil. Their behaviour is driven by the search for personal comfort. This group of
people is opposed to restrictive policies and interventions that discourage this
behaviour. Majority is male.
Preferred behaviour In principle willing to change both routine and investment behavior.
Main motivation This end user is very difficult to motivate because he / she is really not
interested, and because this segment wishes no interference from government
or operator. The main motivation is comfort and pleasure in life. Shifting should
thus be fun or increase comfort.
Choices related to
Pricing Mechanism
As this is the most difficult segment, that is not financially motivated and does
not wish interference every incentive to shift focus is acceptable, as long as it's
fun and comfort is not affected or even increased, for example by a system that
automates activities that are experienced as being burdensome. So RTP or CPP
/ CPR linked to a automated system so that he / she does not have to follow the
price fluctuations. Stimuli that do not work with price but status or comfort will
also work. ToU is difficult because it requires permanent routine changes. IBR is
probably not suitable because it is focused primarily on savings and this will
only work using energy efficient investments in homes or devices that are
increasing comfort.
Choices related to
technology
A price incentive in itself is not fun, but possibly technology can play a role in
increasing fun. Technology should therefore seduce and the more the better as
long as comfort is not reduced or even increases. Technology that takes care of
burdensome activities is cool, and technology that seduces the group to start
being interested - cool apps, beautiful displays, digital rewards (complementary
currencies, gaming) could work. Remote control and automation are probably
only attractive if they lead to increased comfort, e.g. as part of home
automation and security systems.
Choices related to
Feedback
Attractive feedback should aim to slowly attract interest in saving and shifting
behavior. Historical feedback and feedback on activities to show and feel that
energy / shift will not be at the expense of fun activities and comfort is
necessary. the challenge is to provide feedback in such a manner that it is not
experienced as an infringement of comfort.

- 86 -
IBR
CPP
CPR
RTP
ToU
none
IHD
Energylamp
Smart meter
App
Magnetic sticker
Automation
Remote control
Post
Website
Colour change
Emoticons
Graphic
Tailored tips
Sound
€/kWhUse kWh
Reduction kWh
CO2 emmission
Emoticons
Graphic
Numbers
CO2 reduction
Reduction €
Use €
Per appliance
Per space
Comparative
Benchmark
Invoice detail.
Tailored tips
Goal setting
Historic
Per activity
PRICING Mechanism
TECHNOLOGYPrice related Use related Frequency,.
Level, type
FEEDBACK: FEEDBACK: FEEDBACK:
Pricing Approach segment 5
Segment 6 Problem Conscious welfare oriented energy consumers
General
Considerations
This segment consists largely of young people and is reasonably well
educated. These people are not enthusiastic about saving energy. Although
they are aware of the consequences of their behaviour and also believe that
energy-saving behaviour can make a difference, they do not feel called to
action. This is possibly because they think that their ability to save energy is
very limited.
Preferred behaviour Willing to change both routine and investment behaviour (has not done much
yet).
Main motivation This end user is quite difficult to motivate but there is an opening because he/
she is energy conscious and believes that their own behavior can make a
difference. Although oriented towards comfort, they also feel a certain social
pressure to do something about the energy situation and are sensitive to
financial motivation. Shifting is attractive only if it is fun and financially
interesting.
Choices related to
Pricing Mechanism
This segment does little yet, but that could change. Any price mechanism is
relevant and can provide an incentive (even if money is not the only
motivation). ToU, or IBR, in combination with CPP and CPR is a logical choice.
RTP is an option if connected to an automated or remote control system. In
addition other non pricing incentives would work
Choices related to
technology
Technology is probably not a problem, these relatively young users are
accustomed to the use of many technologies. Remote control and automation
may be appreciated. At the same time, the question is whether this group is
likely to invest in technology in and around the house (probably not).
Technology should be fairly easy to use. Gadgets and gaming may increase
interest. Combinations with automation and remote control are possible, but
this should not be too much trouble and money.
Choices related to
Feedback
Bright and nice feedback should be used to increase this user's ability to save
energy and to shift without sacrificing comfort and lifestyle (it must be a little
trendy). Technology (well-designed course) can contribute to the feeling of

- 87 -
being trendy. This will be presented as part of a lifestyle, with role models and
using (option to) comparative feedback. Communication of "actionable advice"
is important, as well as demonstrating that behavioral change is easy,
effective, and not at the expense of comfort. Social media plays a major role in
providing feedback and as a social pressure mechanism.
IBR
CPP
CPR
RTP
ToU
none
IHD
Energylamp
Smart meter
App
Magnetic sticker
Automation
Remote control
Post
Website
Colour change
Emoticons
Graphic
Tailored tips
Sound
€/kWhUse kWh
Reduction kWh
CO2 emmission
Emoticons
Graphic
Numbers
CO2 reduction
Reduction €
Use €
Per appliance
Per space
Comparative
Benchmark
Invoice detail.
Tailored tips
Goal setting
Historic
Per activity
PRICING Mechanism
TECHNOLOGYPrice related Use related Frequency,.
Level, type
FEEDBACK: FEEDBACK: FEEDBACK:
Pricing Approach segment 6

- 88 -
Annex 4: Findings from Dynamic Pricing pilots, studies and reviews
Pricing mechanisms
+ technology +
feedback
Impact Reference and remarks
Dynamic pricing general
lower electricity bills over the duration of the pilot. Stromback et all 2011 - Very
general conclusion
- Most pricing trials have been
done outside of EU
Dynamic pricing
general + persistence
persistence in DR over at least 2 years Faruqui and Palmer 2011
Persistence in demand response
across multiple years has been
demonstrated in pilots in
California and Maryland.
California’s State-wide Pricing
Pilot (July 2003 - December
2004 ;transferability to NL
context is difficult
Dynamic pricing
general + persistence
There is limited evidence on whether demand side responses
persists over time if it is not automated or directly
controlled.
Frontier Economics and
Sustainability First (2012)
Dynamic pricing
general
pilot sample size does not significantly influence pricing pilot results
Stromback et all 2011 -
Dynamic pricing
general
end-users respond mainly to changes in the price of
electricity rather than to the price of electricity
Stromback et all 2011
Dynamic pricing
general
- “Arc of price responsiveness”: the amount of demand
response rises with the price ratio but at a decreasing rate
- larger price differentials between peak and off-peak periods
lead to more load being shifted away from high price periods
to lower price periods.
- Stromback et all 2011
Faruqui and Palmer 2012:
Dynamic pricing
general
Consumers do shift electricity demand in response to
economic incentives even if these incentives are accompanied
by only basic information (e.g. magnets, info sheets, bill
inserts) on the prices being applied, however the size of the
shift can vary significantly.
Frontier Economics and
Sustainability First (2012);
Dynamic pricing
general + enabling
technologies
- enabling technologies such as in-home displays, energy
orbs and programmable and communicating
thermostats boost the demand response.
ambient notification appears particularly efficient and
effective to notify participants of upcoming high prices
Faruqui and Palmer, 2011; 2012;
Stromback et all 2011 -
Baltimore Gas and Electric’s
Smart Energy Plan pilot It found
in 2008-2009 that the peak
impact with the energy orb was
greater than the peak impact
with price alone, and that the
peak impact with the price and

- 89 -
energy orb and the air
conditioner switch was even
greater. Faruqui and Palmer
2011
Optimum tariff levels
and ratios & role of
technology &
feedback
“Time-varying tariffs may play a role in managing energy
demand, in controlling total and peak-time consumption. The
optimum tariff levels and ratios, and the role of advice and
technology in supporting behaviour change, are as yet poorly
understood.”
EDRP (2011 - reports on 4 trials,
conducted by EDF, E.ON,
Scottish Power and SSE;
attention for recruitment and
control groups), p. 14
Equity Findings on the response of vulnerable and low-income
consumers to DSR initiatives vary across studies. Some but
not all studies found consumers from these groups
are less responsive than the average consumer to DSR
signals.
Frontier Economics and
Sustainability First (2012);
Dynamic pricing
general +
alerts/reminders
The more ways in which participants are alerted of the
event and their response, the better the demand response
Stromback et all 2011
Dynamic pricing
general +
alerts/reminders
pricing pilots, whit high participant interaction showed
better results
Stromback et all 2011 -
- unclear what types of
interaction works best, what
type is most cost effective?
Dynamic pricing
general + automation
Automation is highly effective as a means of shifting or
reducing load
Stromback et all 2011
- costly in low consumption
markets.
- may change if technology
becomes more affordable and/or
the price of electricity increases.
Dynamic pricing
general + automation
generally speaking, automating several sources of load
is more effective than a single source
especially if the sources use
significant amounts of electricity.
Stromback et all 2011
Dynamic pricing
general + automation
+ education
Automation designed to enable load shifting must be
combined with education on how to lower total
consumption in order to avoid increased overall
consumption levels
Stromback et all 2011
this (increase in overall
consumption) happened in a
number of pricing pilots with
automation
Dynamic pricing
general + why
behaviour changes
There is limited evidence on how consumers shift their
electricity use in response to incentives. For example, with
the exception of air-conditioning and storage heating, it is not
clear which appliances consumers are willing to use in a
flexible way.
Frontier Economics and
Sustainability First (2012);
meta-review of studies and
pilots - not all well-designed or
well-evaluated;
Dynamic pricing
general + feedback
- consumption reduction is highest (10.3%)with a combo of up-to-date consumption, historical consumption and cost (bill) are offered to participants What participants respond best to and they value most in our review is: 1. Up-to-date consumption level (i.e. how much energy they have used between the last bill and now) 2. Up-to-date cost or bill (i.e. how high is their bill since they last paid)
Stromback et all 2011

- 90 -
3. Historical consumption (I.e. how much electricity have they used during this period compared to the previous periods)
Dynamic pricing
general +
technology +
feedback
In addition, end-users prefer an in-house display (IHD) that
provides this direct feedback. Clear feedback to end-users is
a necessary element because it enables them to learn how to
control their energy consumption most effectively over a long
period of time (Landis+Gyr, 2009).
Pricing schemes in combination with direct feedback that is
provided with in-house displays (IHDs) have the best results
in terms of energy saving (compared to feedback being
provided on a webpage or with informative billing)
(Stromback et al, 2011; Landis+Gyr, 2009). Key advantage of
IHD is that it offers almost real-time and visible aspects of
the delivery of feedback.
Adding frequent accurate billing to the combination of price
incentive scheme and direct feedback via IHD is advisable
(Landis+Gyr, 2009)
Stromback et all 2011
The outcomes vary widely within a given type of scheme:
pricing in combination with IHD pilots can attain 3% or 19%
reductions. This is because of the impact of surrounding
variables on program outcomes (in addition to the supportive
technology used or particular pricing scheme) (Stromback et
al, 2011).
Stromback et all 2011 -
Socioeconomic factors and consumption patterns can
overcome supportive technology and program type (e.g. a
good informative billing pilot can lead to higher savings than
an IHD pilot depending on surrounding circumstances despite
the fact that on average an IHD is 50% more effective than
an informative bill at reducing overall electricity consumption)
(idem)
Stromback et all 2011
Time of Use
ToU
- % shifting (peak
reduction)
- % of reduction
9% peak reduction in European trials (based on 15 trials)
13% peak reduction in Australian trials (based on 10 trials)
5% peak reduction in USA (based on 84 trials)
6 % peak reduction in Canada (based on 106 trials)
Meta-review by Stromback et al
2011
Based on 215 TOU trials, of which
only 15 in Europe; 10 in Australia,
84 in USA and 106 in Canada).
Some of these ToU trials also
included a CPP part
ToU
Peak reduction: 8.8% across all the TOU rates and information
interventions.
Overall reduction of electricity consumption: 2.5%
CER trial Ireland
ToU ToU peak reductions are the lower than with CPP/CPR, but
occur daily.
Based on 250 samples
(Stromback et all 2011);

- 91 -
transferability to NL context is
problematic because most
samples (310 out of 340) are
from outside of Europe
ToU - TOU trials: results in terms of peak clipping decrease after 12 months but increase again after 24 month(for unclear reasons)
Stromback et all 2011
ToU + education - Participant education clearly determines the success of
failure of TOU pilots in terms of both shifting and
reduction
- TOU pilots without education increased total energy
consumption while TOU with education lowered total energy
consumption by 4%
Stromback et all 2011
ToU + reminders
(fridge magnets and
stickers)
Fridge magnets and stickers have proved cheap and
efficient ways to make participants aware and remind
them of the different prices of electricity during the day
Stromback et all 2011
ToU + automation +
flexible load
ToU: The size of the shift varies across tariff types and trials
(from 0% to 22%).
shows that day-in day-out shifting of demand away from
peak times can be sustained through the combination of
automation and a tariff signal, especially where consumers
have a single flexible load (for example storage heaters).
From Frontier Economics and
Sustainability First (2012)
Based on evidence from the
long running Economy 7 scheme
in the UK4
ToU + IHD or
ambient displays;
regular updates
real time and hourly updates (often displayed on IHDs or
ambient displays) are most efficient at lowering overall
energy usage in TOU trials
Stromback et all 2011
ToU & DSM stimuli -ToU tariffs and DSM stimuli resulted in reduction of
electricity use by 2.5% and peak usage by 8.8%;
- the combination of bi-monthly bill, energy usage
statement and electricity monitor was more effective
than other DSM stimuli in reducing peak usage with a peak
shift of 11.3%;
(CER,2011) Ireland. 5,028
participants; representative
sample; use of control group
ToU
Reduction &
consumption
pattern
Overall energy reduction is linked with the level of usage
(CER,2011) - Ireland. 5,028
participants; representative
sample; use of control group
ToU & DSM stimuli Of the tariff groups tested, no single one in combination with
DSM stimuli stands out as being more effective than the
others.
(CER,2011) - Ireland. 5,028
participants; representative
sample; use of control group
ToU & Behavioural
change reported
82% of participants made some change to the way they use
electricity due to the Trial with 74% stating major changes
were made by their households;
(CER,2011) - Ireland. 5,028
participants; representative
sample; use of control group
ToU & Magnets &
stickers
Simple information can also be effective: The fridge magnet
and stickers achieved 80% recall with 75% finding the
magnet useful and 63% finding the sticker useful.
(CER,2011) - Ireland. 5,028
participants; representative
sample; use of control group
ToU & IHD The electricity monitor was deemed to be effective as a
support to those achieving peak reduction (91% rated it as
(CER,2011) - Ireland. 5,028
participants; representative

- 92 -
an important support) and shifting to night rates (87%
deemed it an important support).
sample; use of control group
ToU & barriers Barriers to peak reduction relate to the difficulty of linking
behaviour change to bill reduction. These perceptions
may have contributed to the current recorded reduction. This
may be hard to address due to exaggerated expectations of
savings and similar exaggerated expectations of
consequences if reduction is not achieved
Barriers to shifting to night usage relate to safety and
convenience.
(CER,2011) - Ireland. 5,028
participants; representative
sample; use of control group
The Overall Load Reduction incentive was impacted by a low
recall rate (58%). However, the scores for communications,
reasonableness of the target and effectiveness of the OLR
incentive in motivating change were all very good.
(CER,2011) - Ireland. 5,028
participants; representative
sample; use of control group
ToU & Awareness
raising
The Trial succeeded in making participants more aware
of energy usage (54% agreed) which is in keeping with the
reduction in usage
recorded. Only 18% stated that there had been no impact on
the way their household uses electricity;
(CER,2011) - Ireland. 5,028
participants; representative
sample; use of control group
ToU & Segmentation-
relevant
Households headed by individuals with greater
educational achievement or social grade achieved higher
levels of reduction than those with lower levels.
This was in part related to the typically higher level of
usage associated with these households. Therefore, the
impact of education or social grade on the ability to gain
benefit from the tariffs is limited
(CER,2011) - Ireland. 5,028
participants; representative
sample; use of control group
ToU & Segmentation-
relevant
The impact of the time of use tariffs on recipients of FEA
(Free Electricity Allowance) shows that these individuals
exhibited the same level of change as other households and
therefore do not appear to be disadvantaged over other
groups;
(CER,2011) - Ireland. 5,028
participants; representative
sample; use of control group
ToU & Segmentation-
relevant
Fuel poor households (which lack financial means to
adequately heat their homes) also benefit from the
deployment of time of use tariffs.
(CER,2011) Ireland. 5,028
participants; representative
sample; use of control group
ToU & other
interventions impact
on shifting
Two trials (EDF and SSE) tested time-of-use (TOU) tariffs for
electricity in combination with smart meters and other
interventions (advice, historic and real-time feedback,
and incentives to reduce overall consumption). These
trials showed effects on shifting load from the peak
period, with bigger shifts at weekends than on
weekdays. Estimates of the magnitude of shifting
effect vary with trial but were up to 10%.
- The EDF trial showed that the effect is stronger with smaller
households (1 or 2 people). The effect was weaker in the SSE
trial and this may be because awareness of the intervention
was limited and it was seen as overly complex.
EDF:
ToU + Smart meter + accurate billing; RTD (“basic display”);
EDRP (2011) - reports on 4
trials, conducted by EDF, E.ON,
Scottish Power and SSE;
attention for recruitment and
control groups)
(overall focus on reduction;
with a minority focused on
shifting. > 60,000 households;
18,000 with smart meters. Of
these, some 195 were targeted
with ToU. No data were
gathered during the trials to
provide evidence on what

- 93 -
energy efficiency advice: sent by post
appliances or behaviours were
responsible for the observed
shifting.
“The literature shows that time
of use tariffs can also bring
about reductions in total energy
consumption. However, the
evidence is almost exclusively
from studies in hot regions
(where the dominant energy
demand is for air conditioning)
and cold regions with electric
heating. The limited evidence
from the UK suggests small
reductions (3% or less) in
overall electricity demand and
no such effect was detected in
EDRP.”
Critical Peak Pricing and Critical Peak Rebate (CPP and CPR)
CPP & peak reduction
%
CPP:
24% peak reduction in European trials (based on 4 trials)
28% peak reduction in Australian trials (based on 6 trials)
14% peak reduction in USA (based on 54 trials)
11 % peak reduction in Canada (based on 5 trials)
Meta-review by Stromback et al
2011
Based on 69 CPP trials, of which
only 4 in Europe
CPP & CPR - CPP and CPR bring the highest reductions but only for
critical peak periods
- CCP tend to have higher impacts than Time-of-Use (TOU)
rates, likely because the CPP rates have higher peak to off-
peak price ratios
- CPP and PTR rates tend to have higher peak to off-peak
ratios than the TOU rates, with some overlap
Faruqui and Palmer 2012
- transferability to NL context is
problematic because most
samples (310 out of 340) are
from outside of Europe (e.g.
different climatic conditions and
load profiles)
CPP & CPR Overall, it seems that CPP and CPR pricing impact are persistent over time.
Stromback et all 2011
CPP/CPR: The size of the shift varies across tariff types and trials (from
5% to 38%).
CPP & CPR +
education
Education has a significant impact on peak clipping:
participants who received education decrease their on-peak
consumption by an extra 23% for CPP/CPR pilots compared
to participants who did not receive any education
Stromback et all 2011
CPP & CPR +
automation and
remote control
IN CPP and CPR: - With remote controllers in appliances
which can communicate with each other and react to outside
information, such as electricity pricing signals, the response
of a household will approximately double
Stromback et all 2011
CPP & CPR +
automation and
remote control
Automated response and flexible loads: Interventions to
automate responses deliver the greatest and most sustained
household shifts in demand where consumers have certain
flexible loads, such as air conditioners or electric heating.
Frontier Economics and
Sustainability First (2012)

- 94 -
CPP & CPR &
technology & feedback
After automation, a combination of economic incentives and
enhanced information (enhanced billing and e.g. IHDs and
Orbs) generally delivers the greatest demand response
Frontier Economics and
Sustainability First (2012)
Real Time Pricing (RTP)
RTP:
13% peak reduction in European trials (based on 3 trials)
10% peak reduction in USA (based on 12 trials)
Stromback et al 2011 - these
trials do not show robust results
(they are based on pilots
mentioned in next row)
RTP - limited available evidence suggests that domestic
consumers do respond to real-time price signals. There has
been limited testing so far of domestic sector real-time
pricing.
4 Trials, 1 in Norway: results are non-significant; or overall
price decrease on spot market interfered with trial. US
project: one Group ToU & CPP, the other Group RTP, showed
less response on RTP (17% vs. 20% peak shift). Lower
response may also be due to the experienced complexity of
RTP’s - important question is how to reduce this through
improved feedback to end-users.
Testing of real-time pricing for households has not produced
robust results to date
From Frontier Economics and
Sustainability First (2012) looked
at four studies : Norway
EFFLOCOM Trial (2001-2004)
(NW, 81 participants);
PowerCentsDC trial (2008-9,
USA, 231 participants); Illinois
Real-Time Pricing Trial (2003-
2006) 1,500 participants; Pacific
Northwest GridWise Project
(2006-2007, USA, 112)
Inclining Block Rates (IBR)
IBR Limited experience with IBR in California, Japan and Belgium
Rationale behind IBR can be to help end-users reduce their
bills (support weak social-economic groups) or to achieve
overall reduction in consumption (general demand reduction
aims).
CREG (2001)