the efficient datacenter - インテル...the efficient datacenter improving datacenter efficiency...
TRANSCRIPT
The Efficient Datacenter
Improving Datacenter Efficiency Through Intel Technologies and High Ambient Temperature Operation
Jay Kyathsandra
Chuck Rego
DCSG Marketing
Agenda
• Datacenters Today
• The High Ambient Temperature (HTA) Datacenter
• HTA Examples
• What Else Do You Need to Build a More Efficient Datacenter?
– Intel solutions to achieve high temp operation
• Near-Future Technologies
• Summary
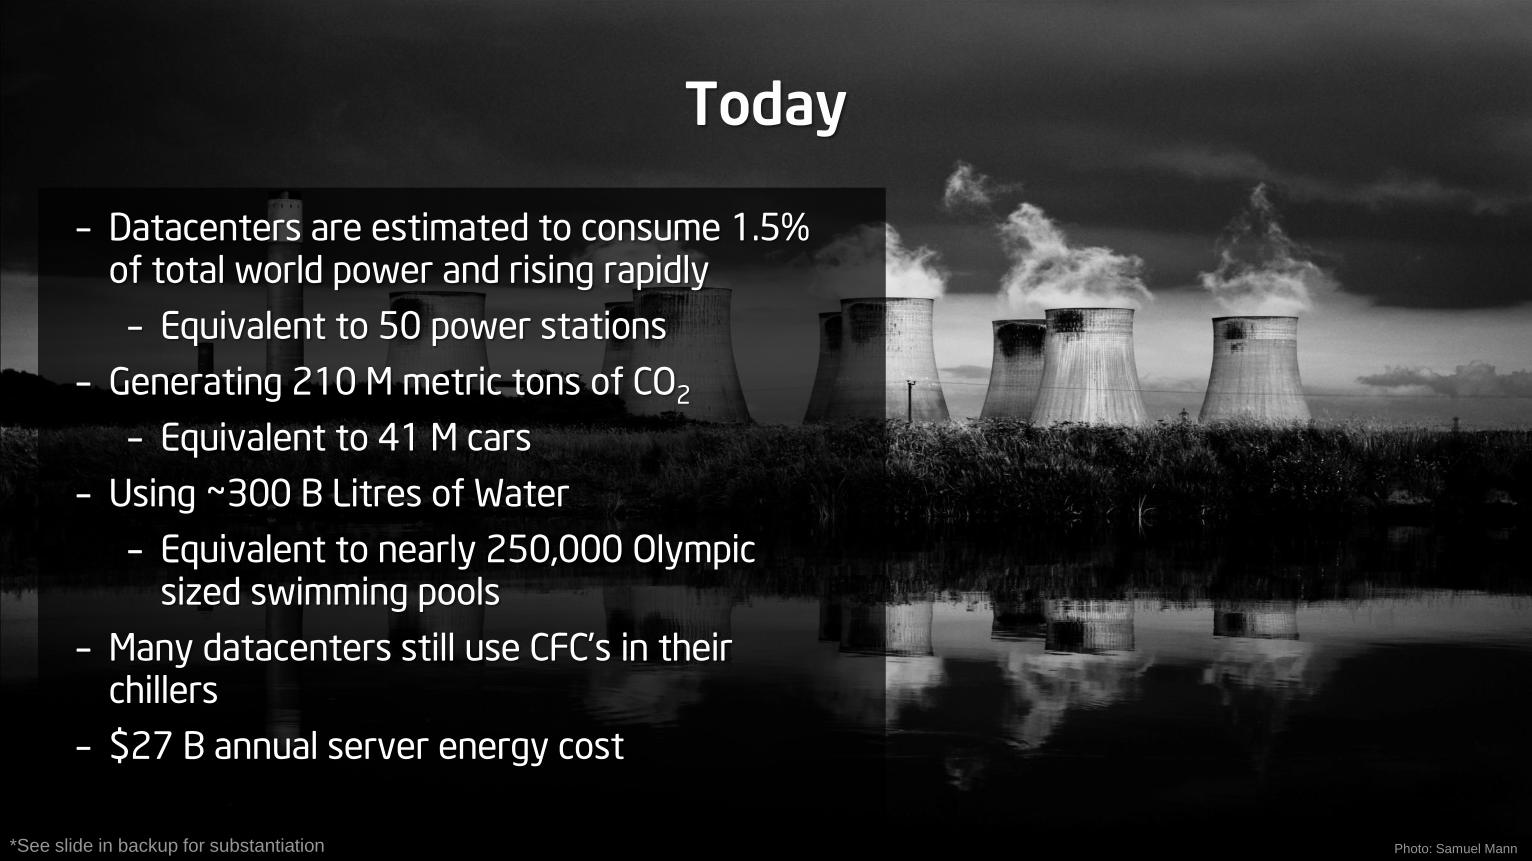
Today
– Datacenters are estimated to consume 1.5% of total world power and rising rapidly
– Equivalent to 50 power stations
– Generating 210 M metric tons of CO2
– Equivalent to 41 M cars
– Using ~300 B Litres of Water
– Equivalent to nearly 250,000 Olympic sized swimming pools
– Many datacenters still use CFC‟s in their chillers
– $27 B annual server energy cost
*See slide in backup for substantiation Photo: Samuel Mann
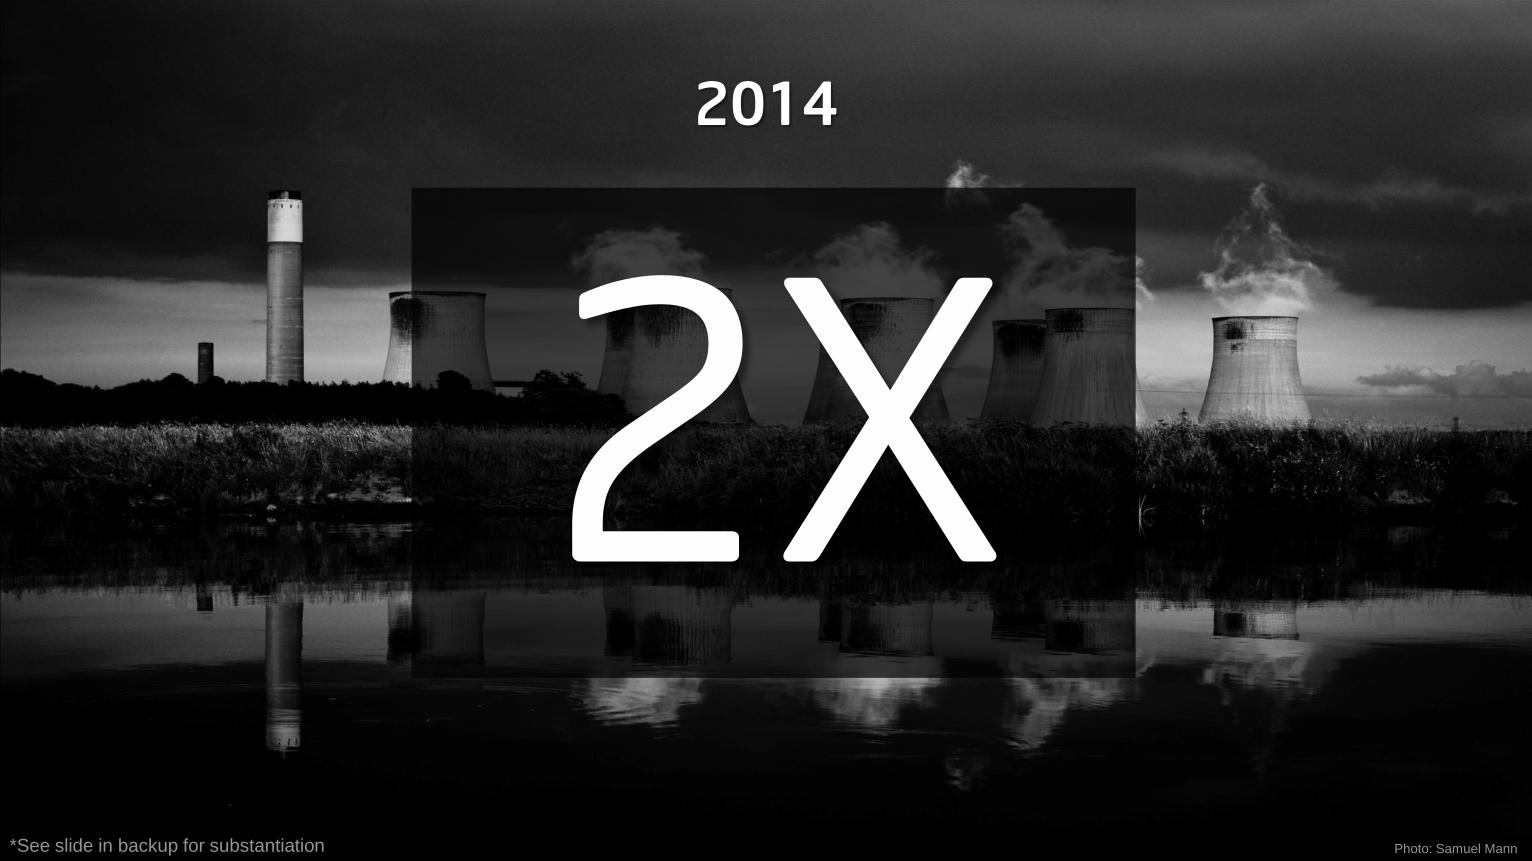
2014
*See slide in backup for substantiation Photo: Samuel Mann
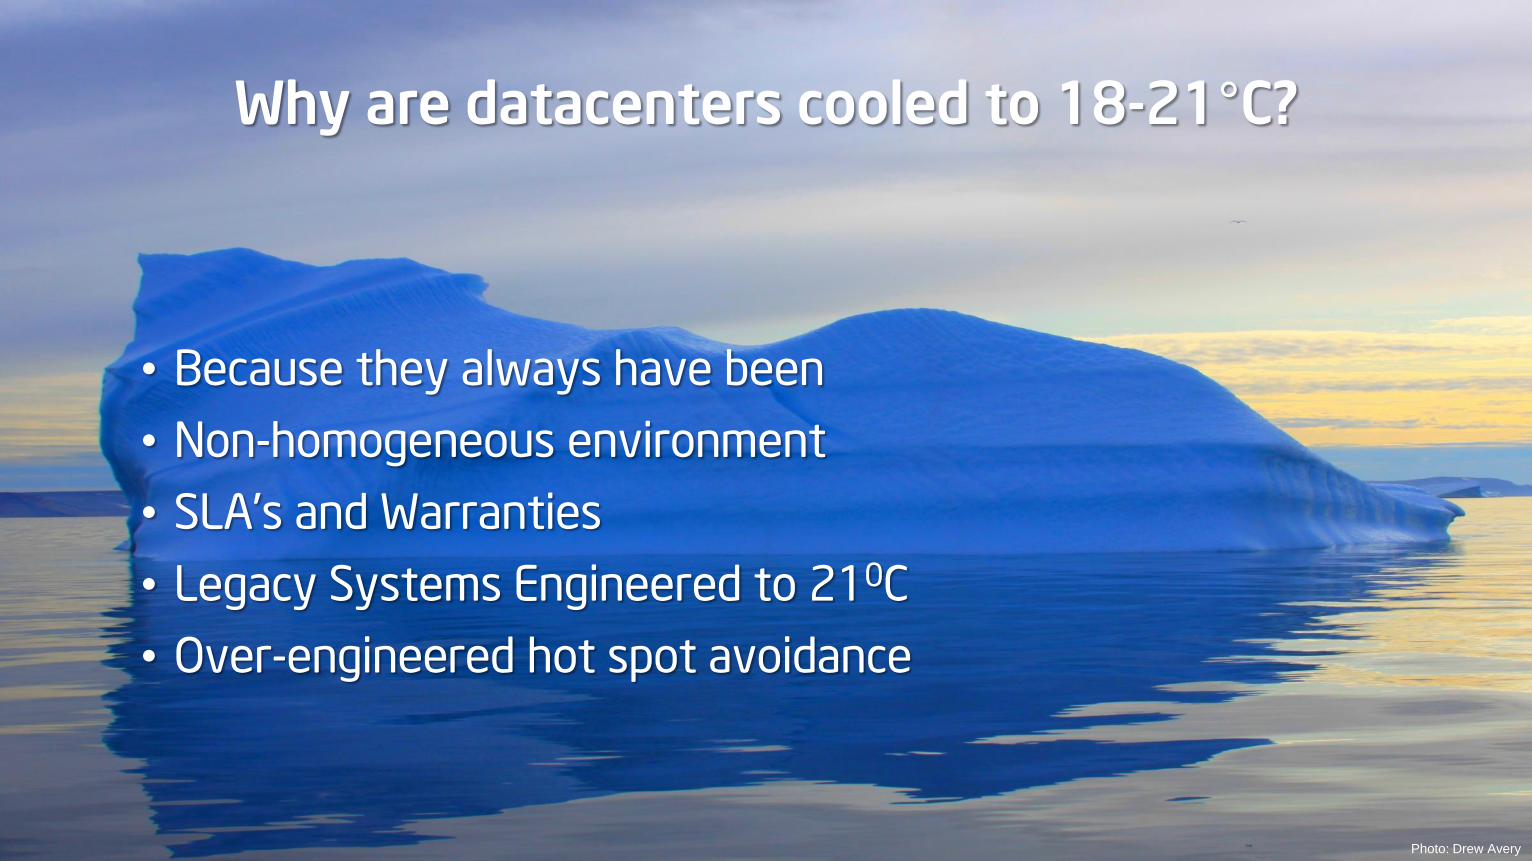
Why are datacenters cooled to 18-21°C?
• Because they always have been
• Non-homogeneous environment
• SLA‟s and Warranties
• Legacy Systems Engineered to 210C
• Over-engineered hot spot avoidance
Photo: Drew Avery
THE HIGH AMBIENT TEMPERATURE (HTA) DATACENTER
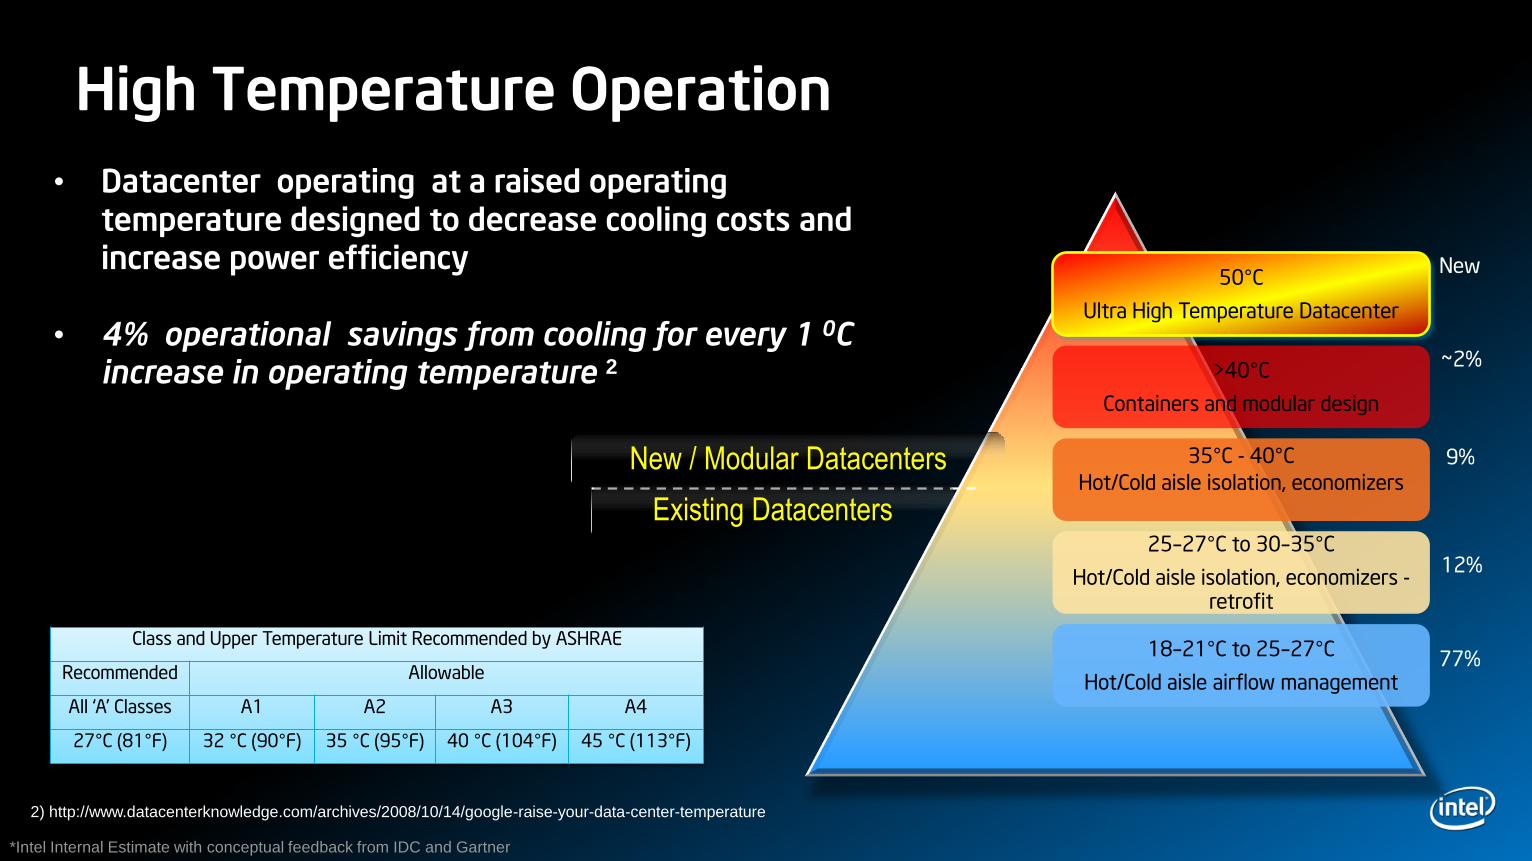
High Temperature Operation
50°C
Ultra High Temperature Datacenter
>40°C
Containers and modular design
35°C - 40°C
Hot/Cold aisle isolation, economizers
25–27°C to 30–35°C
Hot/Cold aisle isolation, economizers -retrofit
18–21°C to 25–27°C
Hot/Cold aisle airflow management
New / Modular Datacenters
Existing Datacenters
~2%
9%
12%
77%
New
*Intel Internal Estimate with conceptual feedback from IDC and Gartner
• Datacenter operating at a raised operating temperature designed to decrease cooling costs and increase power efficiency
• 4% operational savings from cooling for every 1 0C increase in operating temperature 2
Class and Upper Temperature Limit Recommended by ASHRAE
Recommended Allowable
All „A‟ Classes A1 A2 A3 A4
27°C (81°F) 32 °C (90°F) 35 °C (95°F) 40 °C (104°F) 45 °C (113°F)
2) http://www.datacenterknowledge.com/archives/2008/10/14/google-raise-your-data-center-temperature
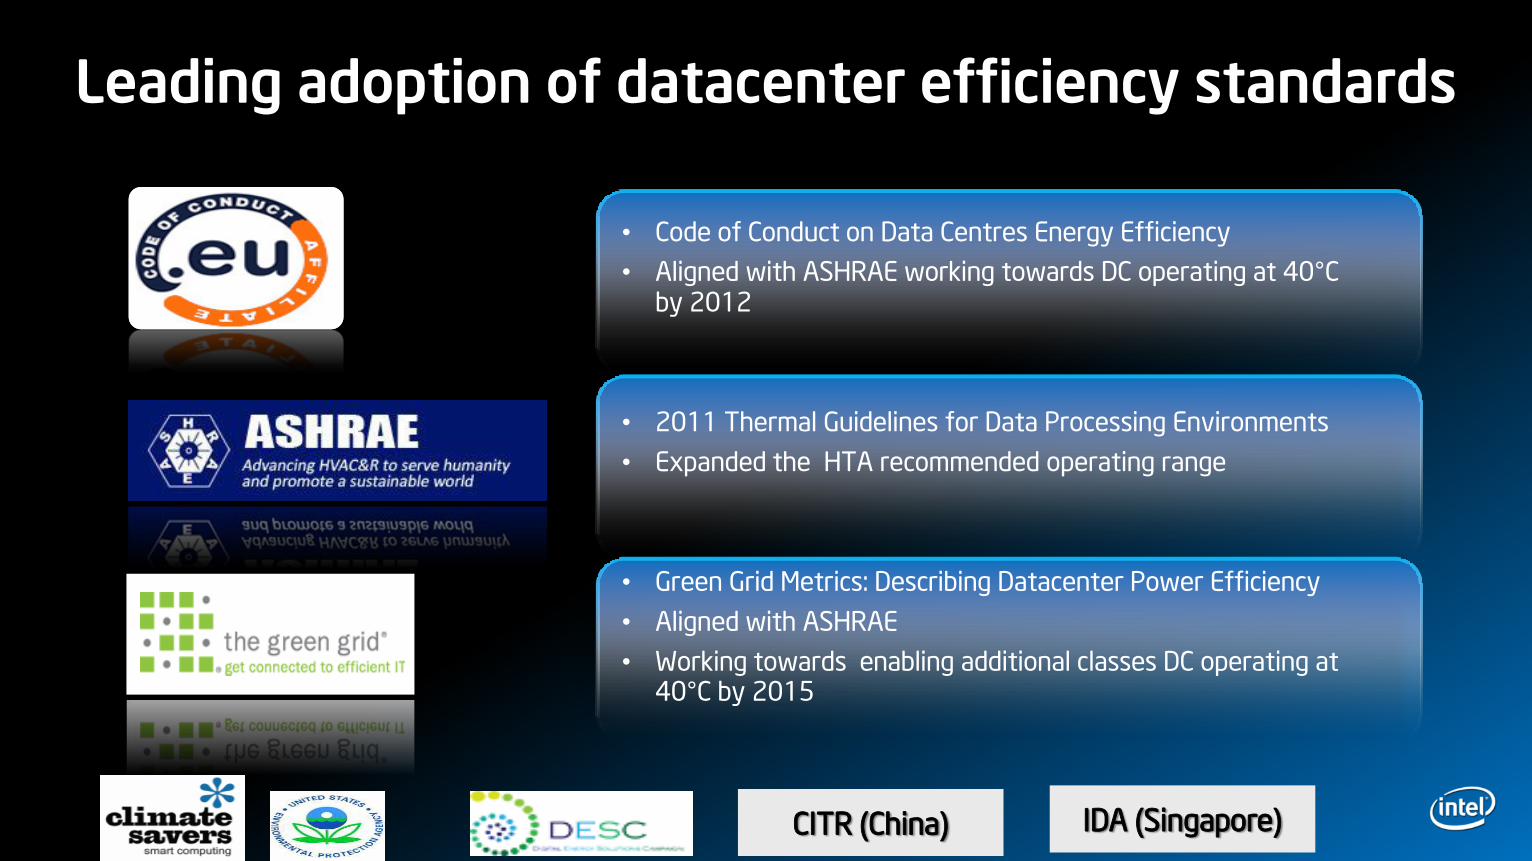
Leading adoption of datacenter efficiency standards
• Code of Conduct on Data Centres Energy Efficiency
• Aligned with ASHRAE working towards DC operating at 40°C by 2012
• 2011 Thermal Guidelines for Data Processing Environments
• Expanded the HTA recommended operating range
• Green Grid Metrics: Describing Datacenter Power Efficiency
• Aligned with ASHRAE
• Working towards enabling additional classes DC operating at 40°C by 2015
IDA (Singapore)CITR (China)
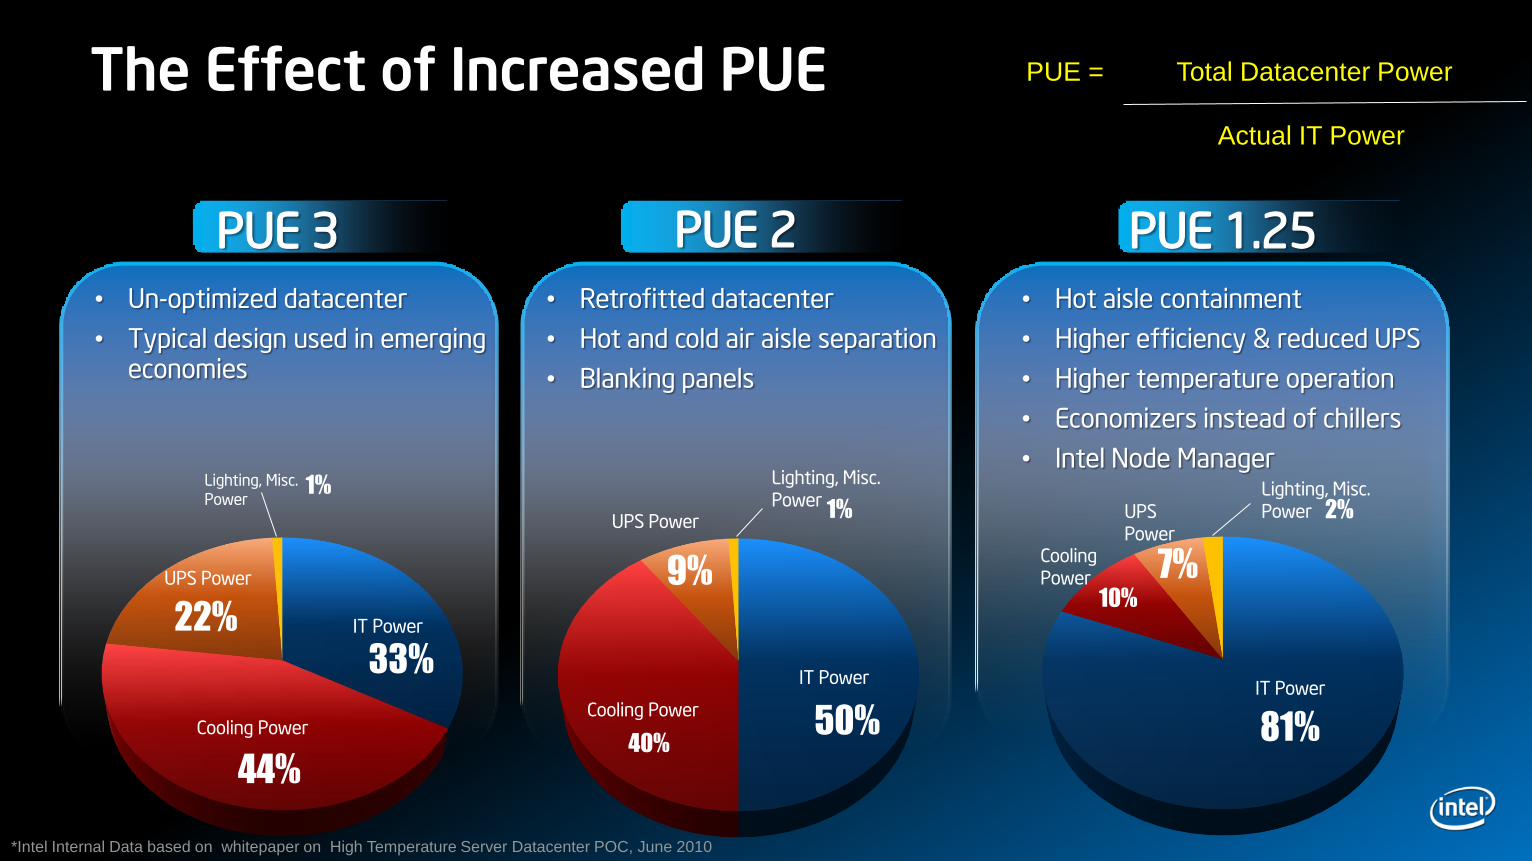
The Effect of Increased PUE
PUE 3
• Un-optimized datacenter
• Typical design used in emerging economies
PUE 1.25
• Hot aisle containment
• Higher efficiency & reduced UPS
• Higher temperature operation
• Economizers instead of chillers
• Intel Node Manager
PUE 2
• Retrofitted datacenter
• Hot and cold air aisle separation
• Blanking panels
IT Power
50%
UPS Power
9%
Cooling Power
40%
1%
Lighting, Misc. Power
IT Power
81%
UPSPower
7%CoolingPower
10%
2%Lighting, Misc. Power
IT Power
33%
UPS Power
22%
Cooling Power
44%
1%Lighting, Misc.
Power
*Intel Internal Data based on whitepaper on High Temperature Server Datacenter POC, June 2010
PUE = Total Datacenter Power
Actual IT Power
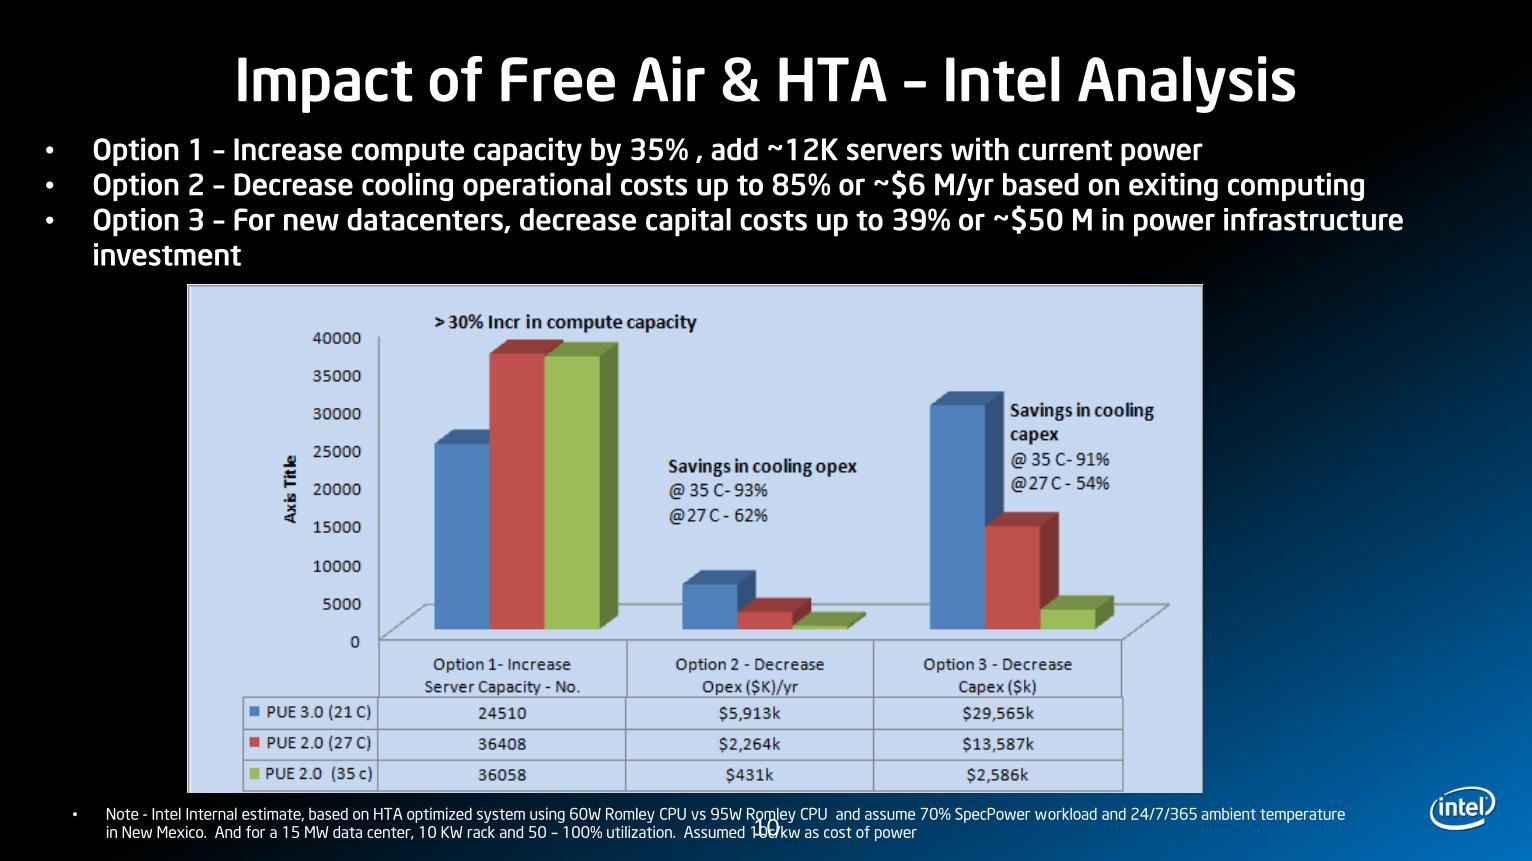
Impact of Free Air & HTA – Intel Analysis
10• Note - Intel Internal estimate, based on HTA optimized system using 60W Romley CPU vs 95W Romley CPU and assume 70% SpecPower workload and 24/7/365 ambient temperature
in New Mexico. And for a 15 MW data center, 10 KW rack and 50 – 100% utilization. Assumed 10c/kw as cost of power
• Option 1 – Increase compute capacity by 35% , add ~12K servers with current power• Option 2 – Decrease cooling operational costs up to 85% or ~$6 M/yr based on exiting computing• Option 3 – For new datacenters, decrease capital costs up to 39% or ~$50 M in power infrastructure
investment

HTA EXAMPLES
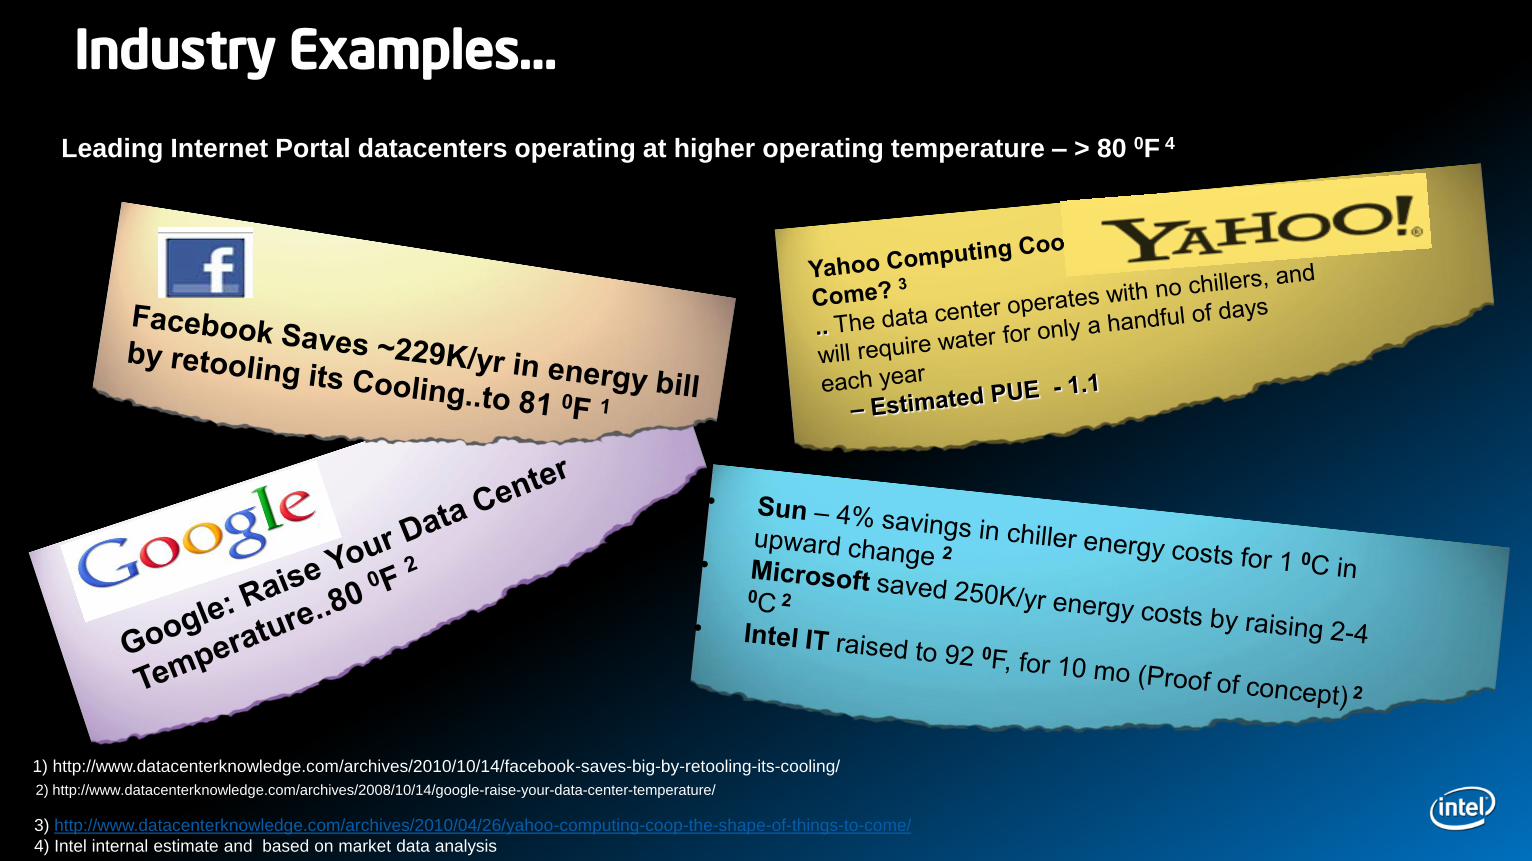
Industry Examples…
Leading Internet Portal datacenters operating at higher operating temperature – > 80 0F 4
1) http://www.datacenterknowledge.com/archives/2010/10/14/facebook-saves-big-by-retooling-its-cooling/
2) http://www.datacenterknowledge.com/archives/2008/10/14/google-raise-your-data-center-temperature/
3) http://www.datacenterknowledge.com/archives/2010/04/26/yahoo-computing-coop-the-shape-of-things-to-come/
4) Intel internal estimate and based on market data analysis
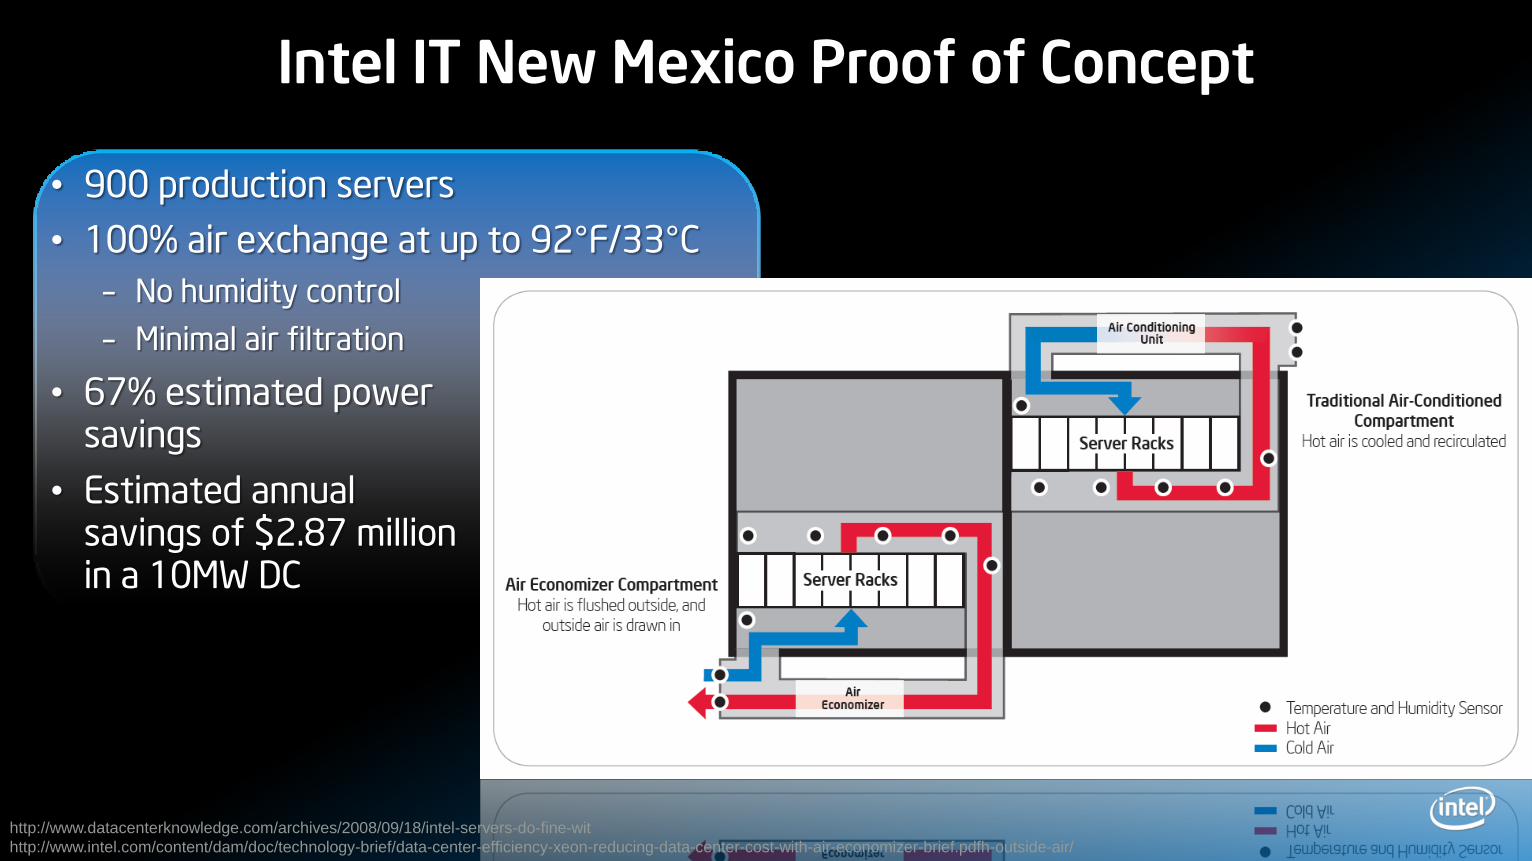
Intel IT New Mexico Proof of Concept
• 900 production servers
• 100% air exchange at up to 92°F/33°C
– No humidity control
– Minimal air filtration
• 67% estimated power savings
• Estimated annual savings of $2.87 million in a 10MW DC
http://www.datacenterknowledge.com/archives/2008/09/18/intel-servers-do-fine-wit
http://www.intel.com/content/dam/doc/technology-brief/data-center-efficiency-xeon-reducing-data-center-cost-with-air-economizer-brief.pdfh-outside-air/
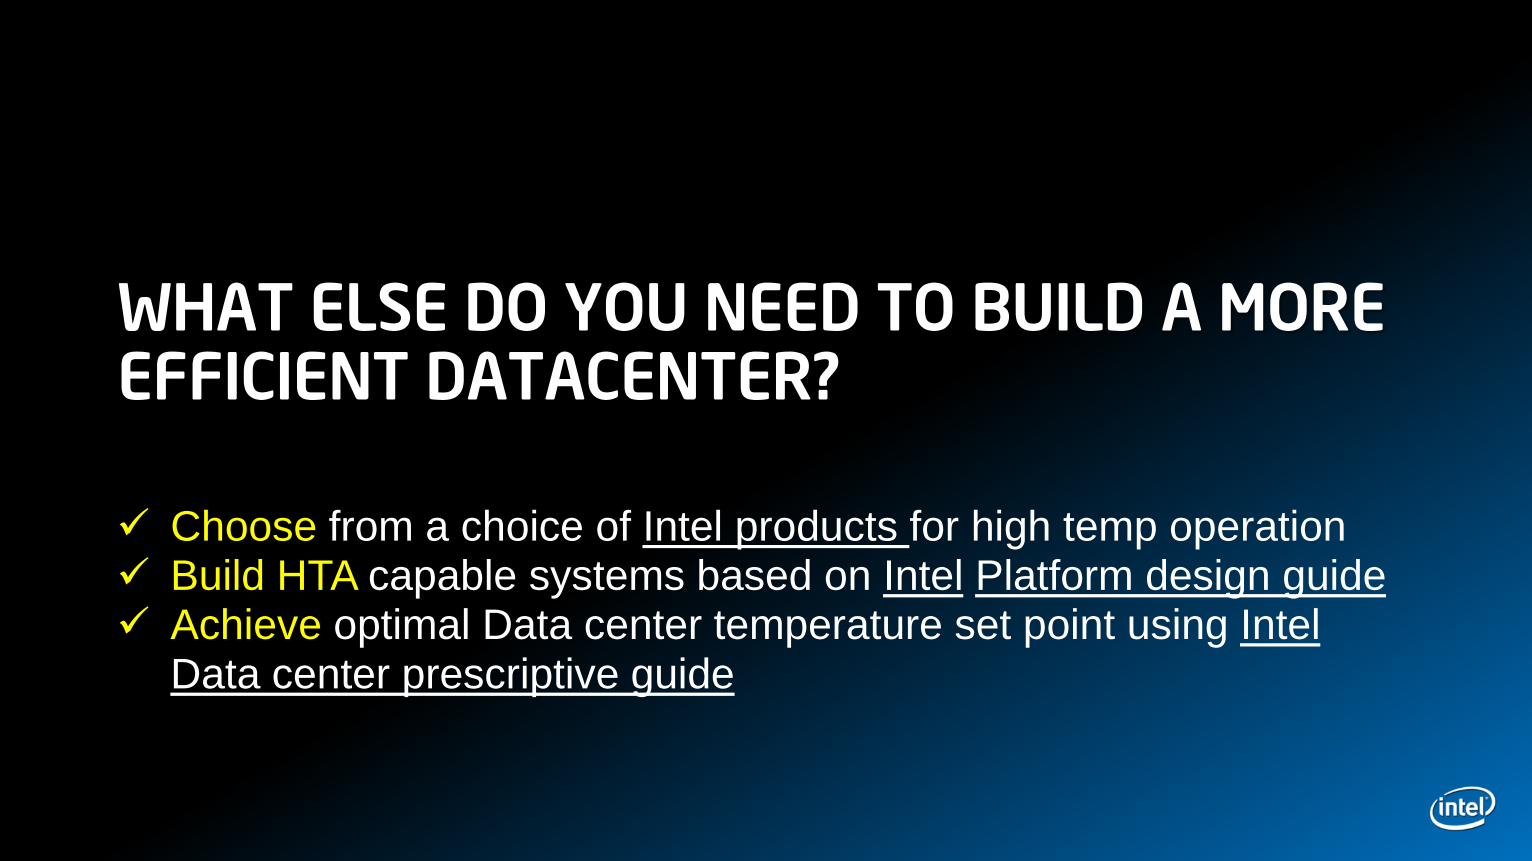
WHAT ELSE DO YOU NEED TO BUILD A MORE EFFICIENT DATACENTER?
Choose from a choice of Intel products for high temp operation Build HTA capable systems based on Intel Platform design guide Achieve optimal Data center temperature set point using Intel
Data center prescriptive guide
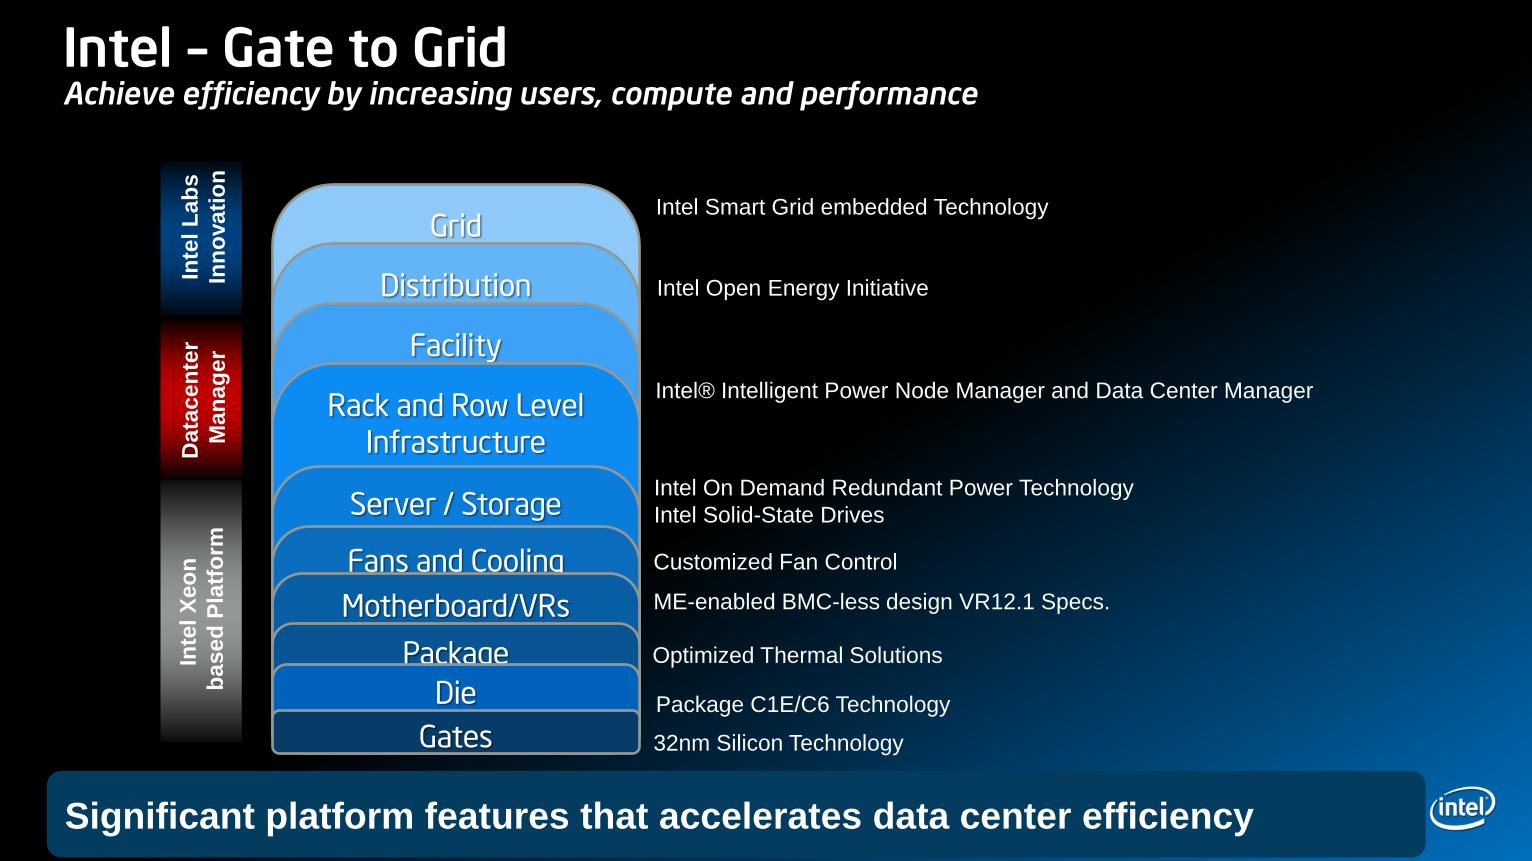
Grid
Distribution
Facility
Rack and Row Level
Infrastructure
Server / Storage
Fans and Cooling
Motherboard/VRs
Package
Die
Gates
Intel – Gate to GridAchieve efficiency by increasing users, compute and performance
32nm Silicon Technology
Package C1E/C6 Technology
ME-enabled BMC-less design VR12.1 Specs.
Customized Fan Control
Intel On Demand Redundant Power Technology
Intel Solid-State Drives
Intel® Intelligent Power Node Manager and Data Center Manager
Intel Open Energy Initiative
Optimized Thermal Solutions
Intel Smart Grid embedded TechnologyIn
tel X
eo
n
ba
se
d P
latf
orm
Data
cen
ter
Ma
na
ge
r
Inte
l L
ab
s
Inn
ova
tio
n
Significant platform features that accelerates data center efficiency
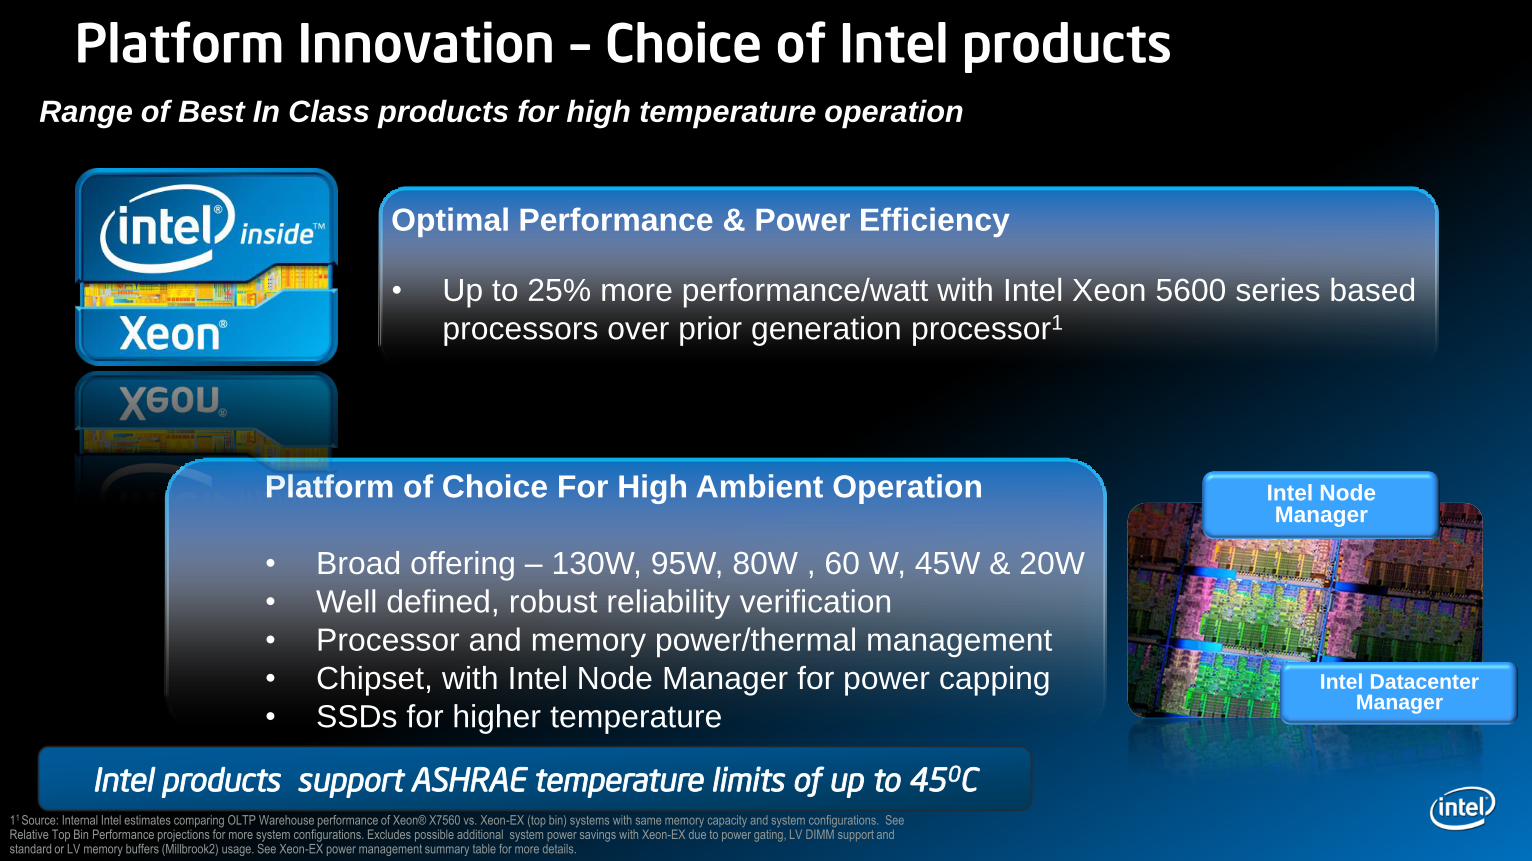
Platform Innovation – Choice of Intel products
Optimal Performance & Power Efficiency
• Up to 25% more performance/watt with Intel Xeon 5600 series based
processors over prior generation processor1
Platform of Choice For High Ambient Operation
• Broad offering – 130W, 95W, 80W , 60 W, 45W & 20W
• Well defined, robust reliability verification
• Processor and memory power/thermal management
• Chipset, with Intel Node Manager for power capping
• SSDs for higher temperature
Range of Best In Class products for high temperature operation
Intel Node Manager
Intel Datacenter Manager
11 Source: Internal Intel estimates comparing OLTP Warehouse performance of Xeon® X7560 vs. Xeon-EX (top bin) systems with same memory capacity and system configurations. See Relative Top Bin Performance projections for more system configurations. Excludes possible additional system power savings with Xeon-EX due to power gating, LV DIMM support and standard or LV memory buffers (Millbrook2) usage. See Xeon-EX power management summary table for more details.
Intel products support ASHRAE temperature limits of up to 450C
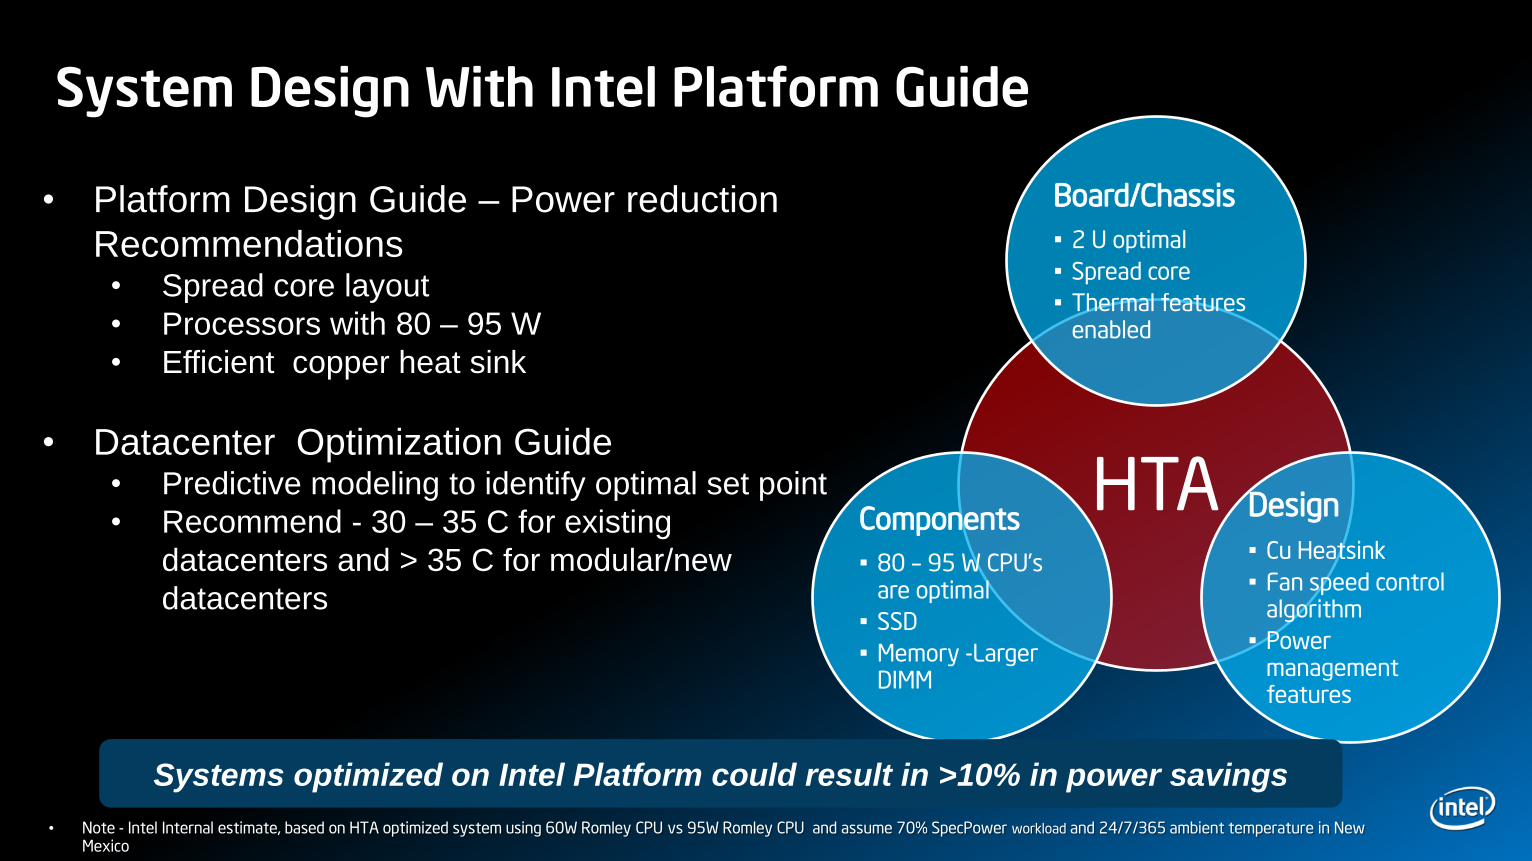
System Design With Intel Platform Guide
HTA
Board/Chassis
• 2 U optimal
• Spread core
• Thermal features enabled
Design
• Cu Heatsink
• Fan speed control algorithm
• Power management features
Components
• 80 – 95 W CPU‟s are optimal
• SSD
• Memory -Larger DIMM
Systems optimized on Intel Platform could result in >10% in power savings
• Platform Design Guide – Power reduction
Recommendations • Spread core layout
• Processors with 80 – 95 W
• Efficient copper heat sink
• Datacenter Optimization Guide• Predictive modeling to identify optimal set point
• Recommend - 30 – 35 C for existing
datacenters and > 35 C for modular/new
datacenters
1
• Note - Intel Internal estimate, based on HTA optimized system using 60W Romley CPU vs 95W Romley CPU and assume 70% SpecPower workload and 24/7/365 ambient temperature in New Mexico
18
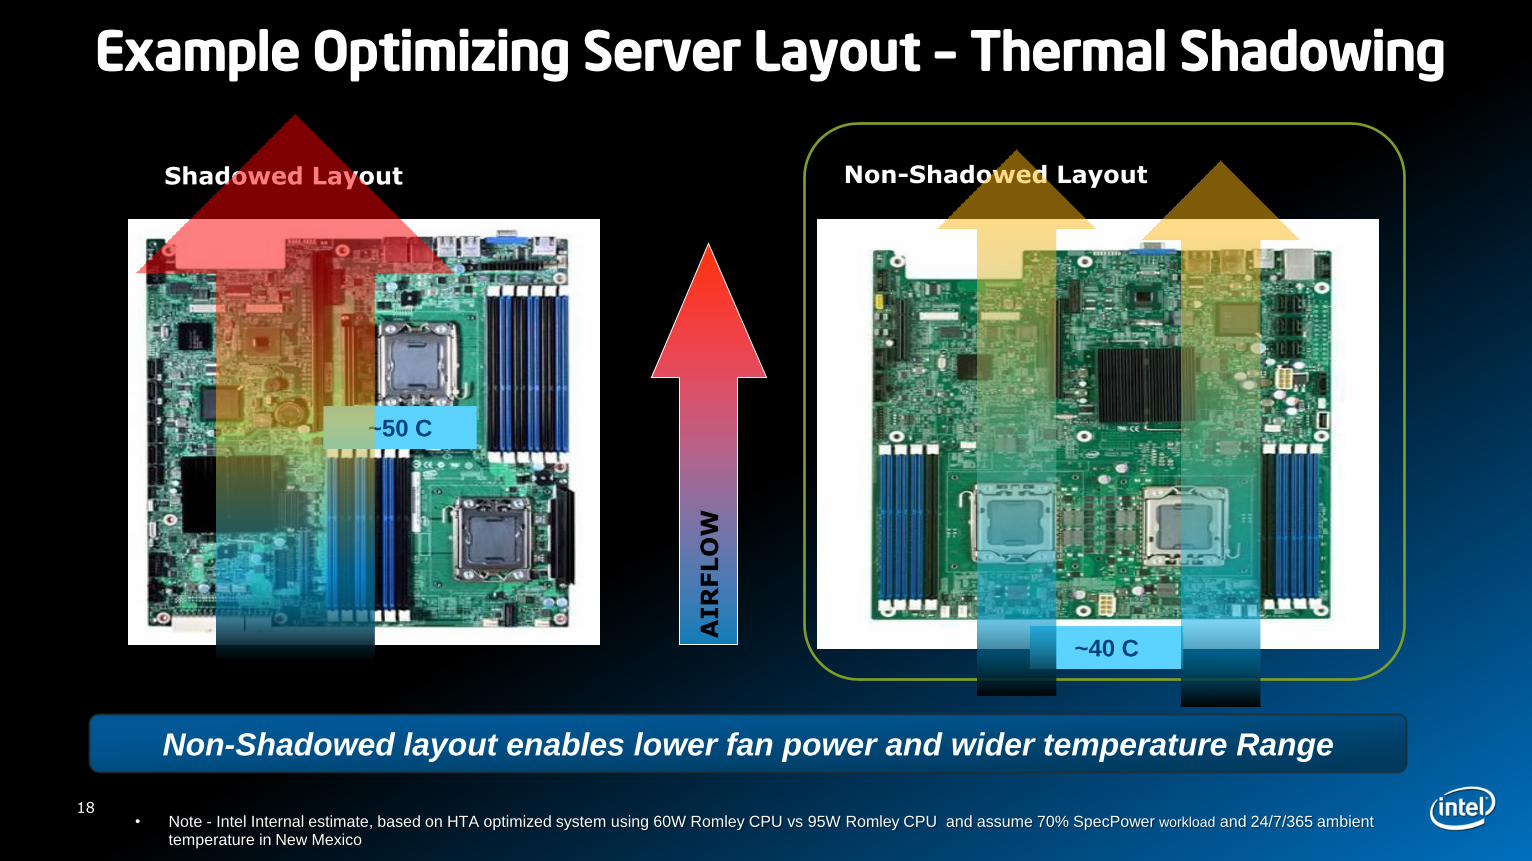
18
Shadowed Layout
AIR
FLO
W
Example Optimizing Server Layout – Thermal Shadowing
Non-Shadowed layout enables lower fan power and wider temperature Range
Non-Shadowed Layout
Source: Intel
~50 C
~40 C
• Note - Intel Internal estimate, based on HTA optimized system using 60W Romley CPU vs 95W Romley CPU and assume 70% SpecPower workload and 24/7/365 ambient temperature in New Mexico
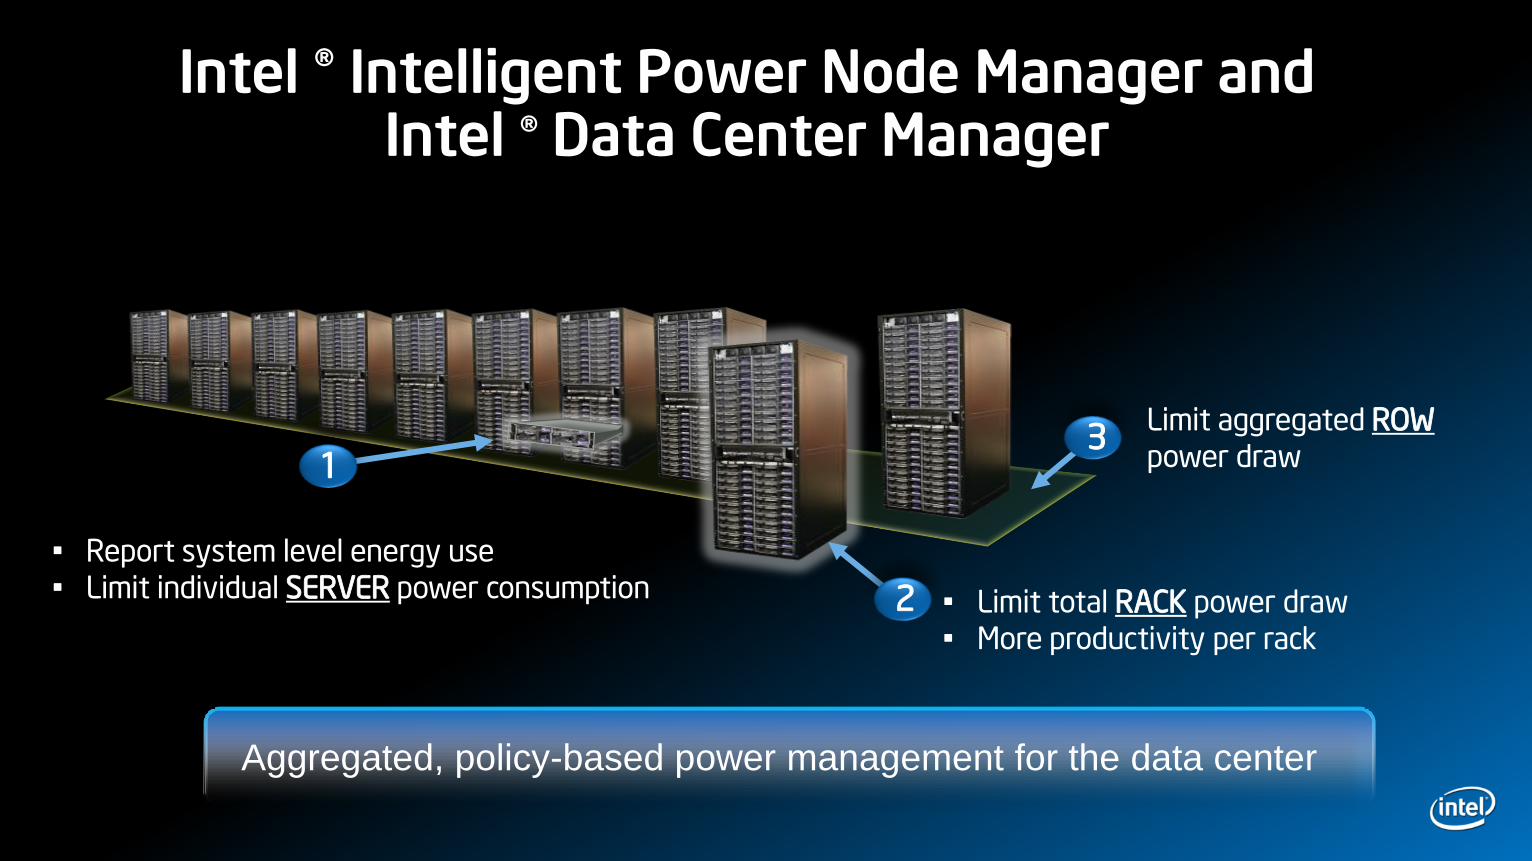
Intel ® Intelligent Power Node Manager and Intel ® Data Center Manager
• Limit total RACK power draw
• More productivity per rack
Limit aggregated ROW
power draw
• Report system level energy use
• Limit individual SERVER power consumption
1
2
3
Aggregated, policy-based power management for the data center
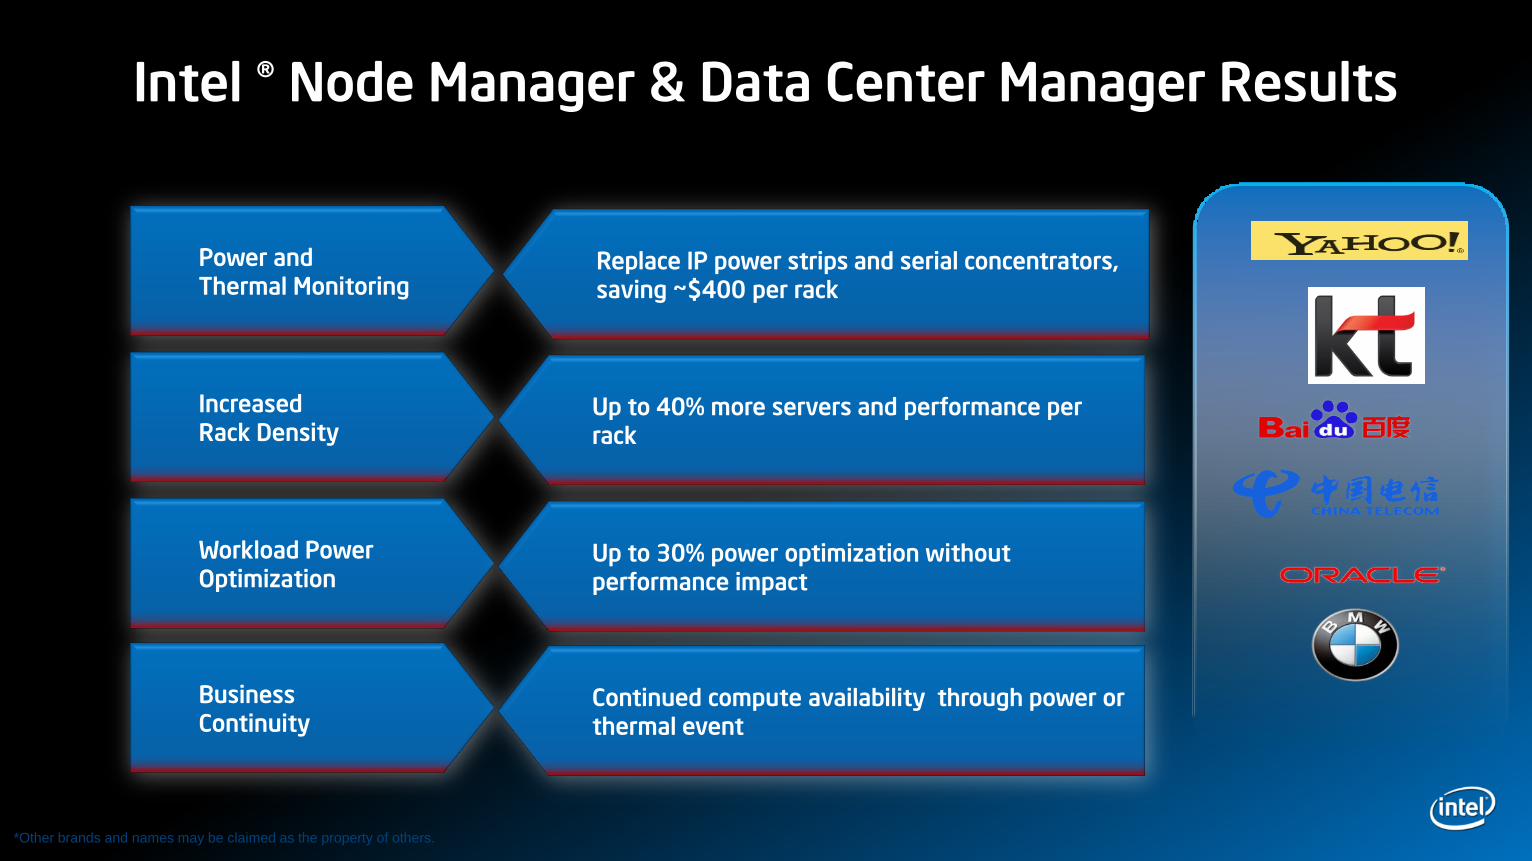
Intel ® Node Manager & Data Center Manager Results
Power and Thermal Monitoring
Increased Rack Density
Workload Power Optimization
Business Continuity
Replace IP power strips and serial concentrators, saving ~$400 per rack
Up to 40% more servers and performance per rack
Up to 30% power optimization without performance impact
Continued compute availability through power or thermal event
*Other brands and names may be claimed as the property of others.
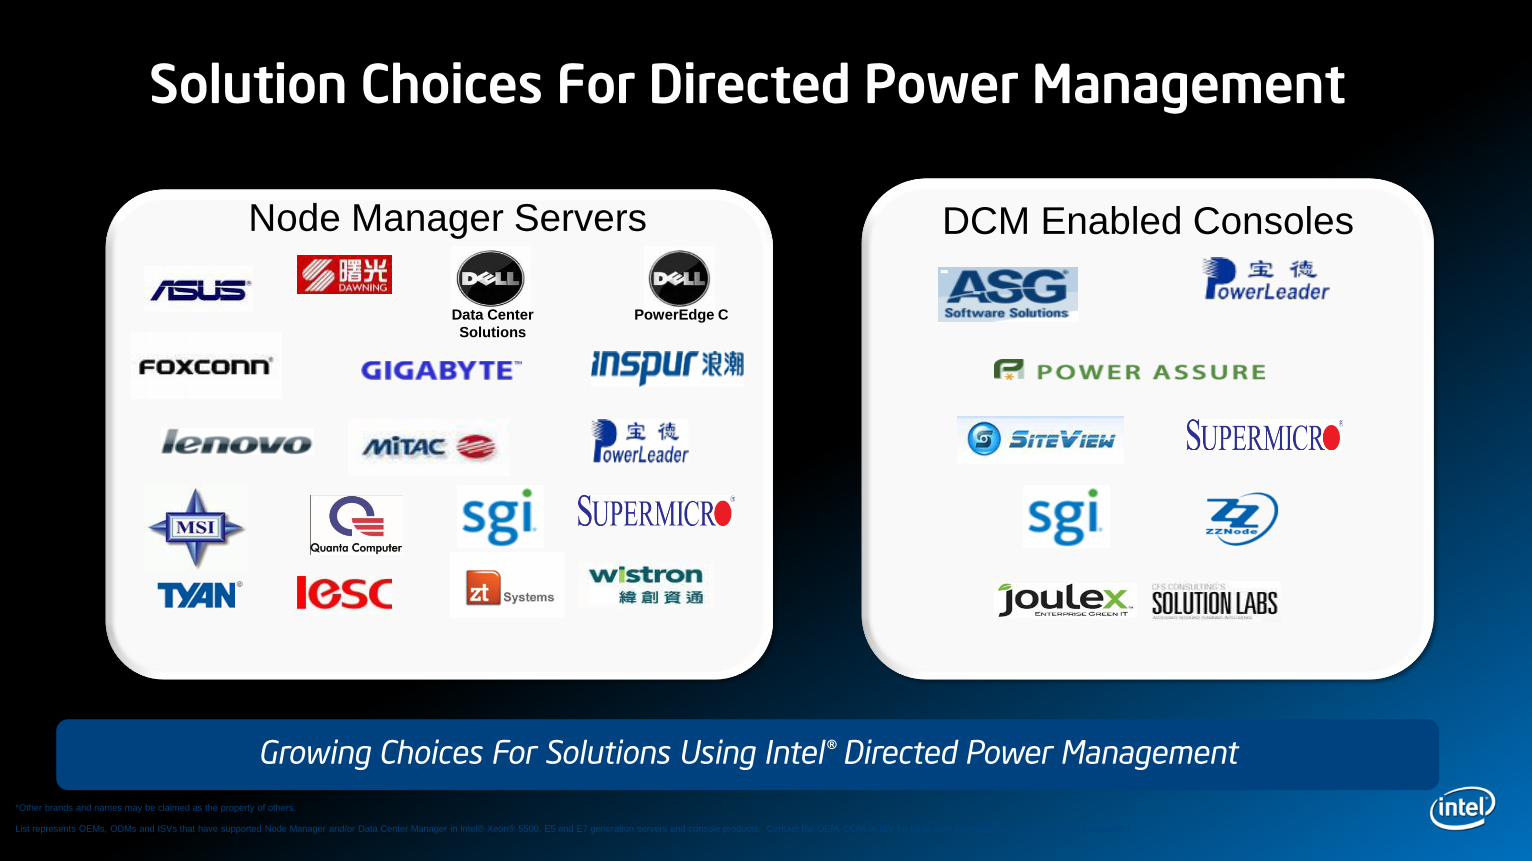
Solution Choices For Directed Power Management
Growing Choices For Solutions Using Intel® Directed Power Management
DCM Enabled ConsolesNode Manager Servers
Data Center
Solutions
PowerEdge C
*Other brands and names may be claimed as the property of others.
List represents OEMs, ODMs and ISVs that have supported Node Manager and/or Data Center Manager in Intel® Xeon® 5500, E5 and E7 generation servers and console products. Contact the OEM, ODM or ISV for up to date information on products that are supported.

NEAR FUTURE TECHNOLOGIES
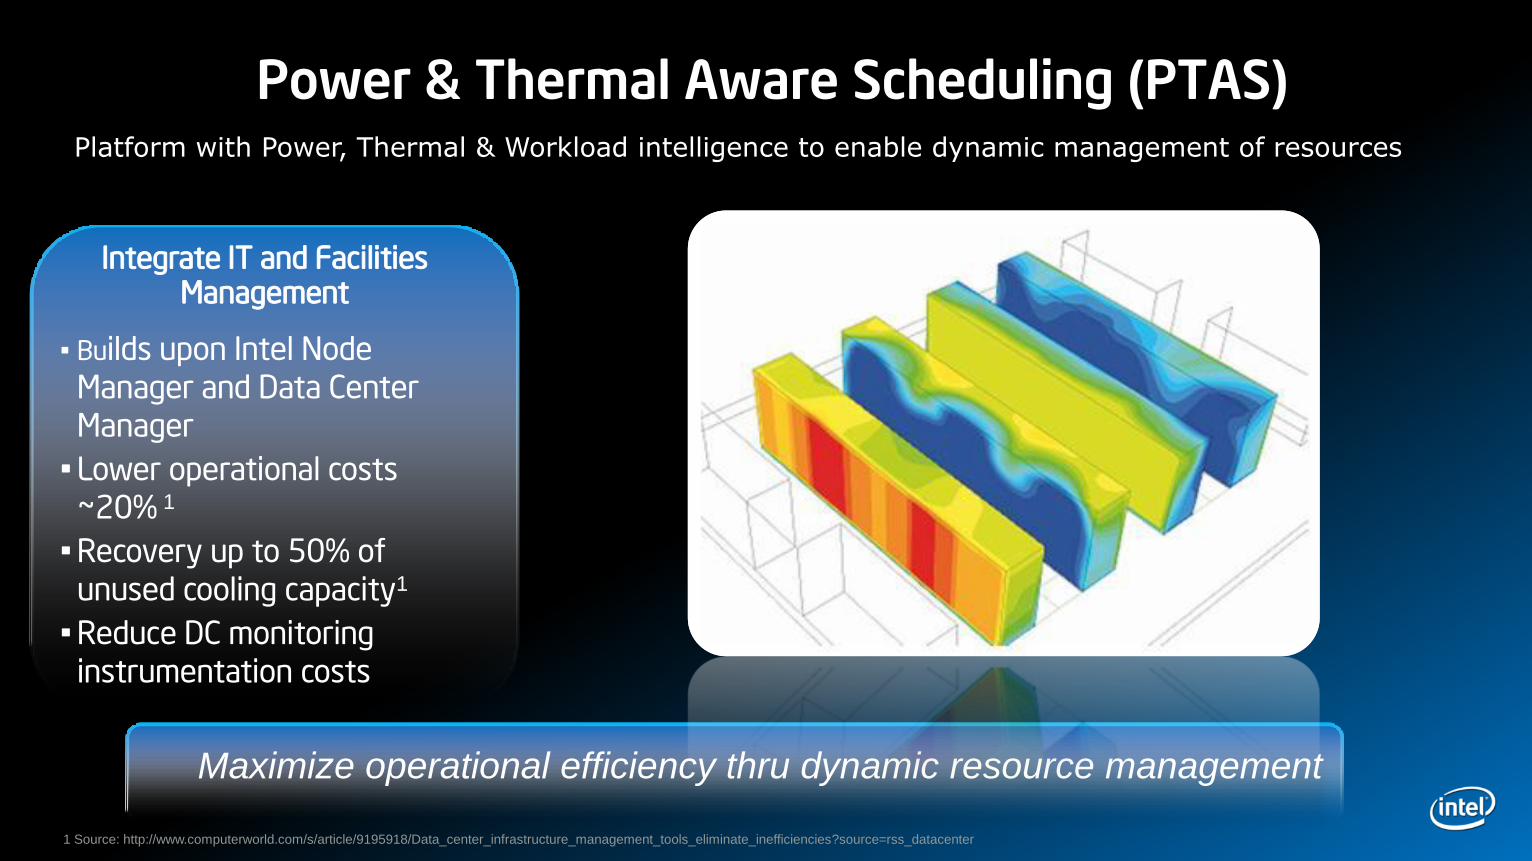
Power & Thermal Aware Scheduling (PTAS)
• Builds upon Intel Node
Manager and Data Center
Manager
• Lower operational costs
~20% 1
• Recovery up to 50% of
unused cooling capacity1
• Reduce DC monitoring
instrumentation costs
Integrate IT and Facilities Management
1 Source: http://www.computerworld.com/s/article/9195918/Data_center_infrastructure_management_tools_eliminate_inefficiencies?source=rss_datacenter
Maximize operational efficiency thru dynamic resource management
Platform with Power, Thermal & Workload intelligence to enable dynamic management of resources
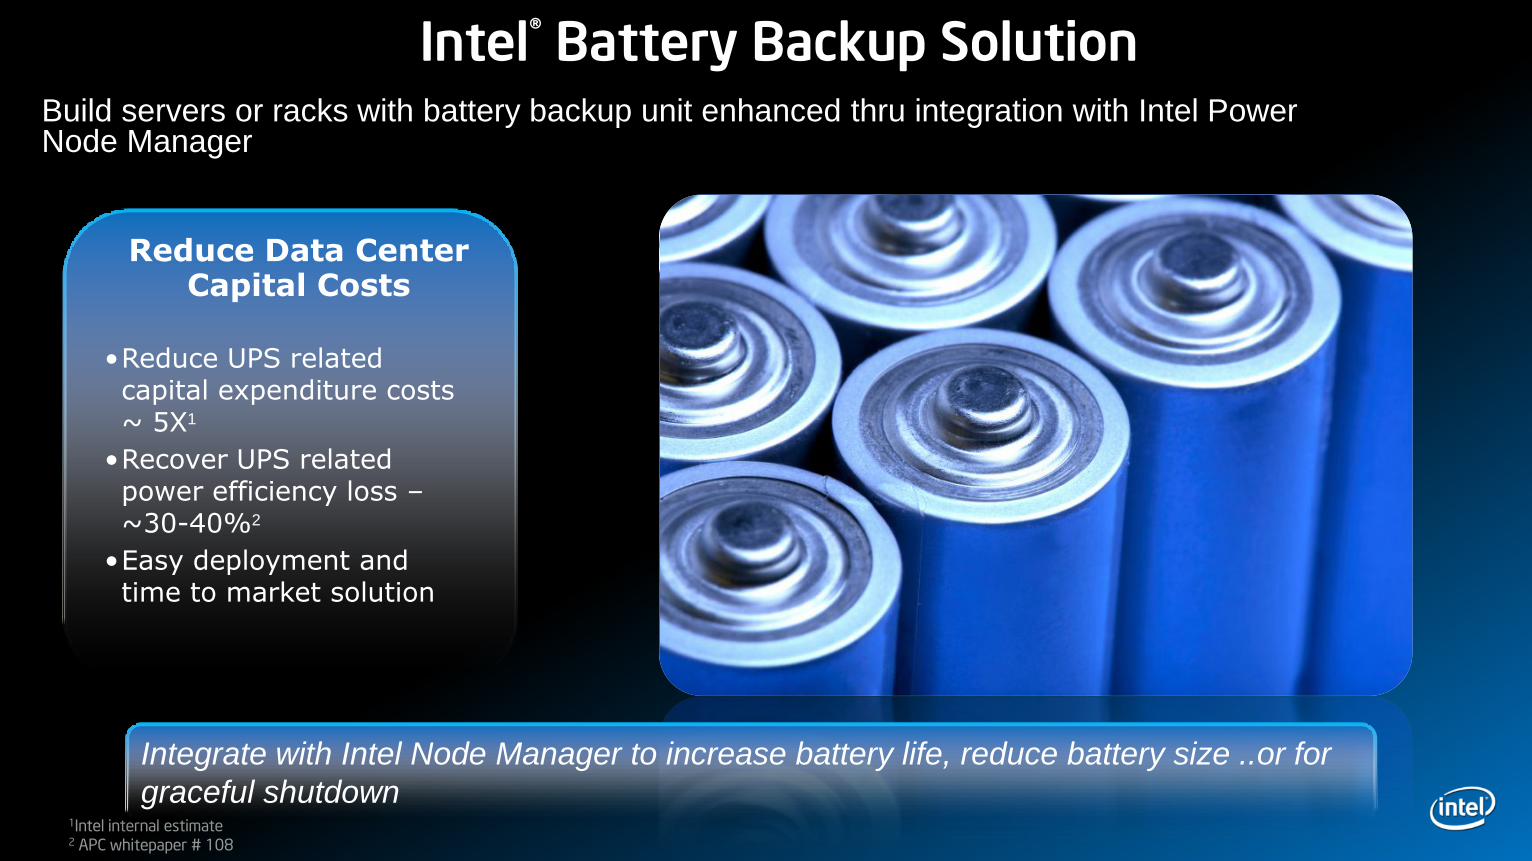
Intel® Battery Backup Solution
•Reduce UPS related capital expenditure costs ~ 5X1
•Recover UPS related power efficiency loss –~30-40%2
•Easy deployment and time to market solution
Reduce Data Center Capital Costs
1Intel internal estimate2 APC whitepaper # 108
Build servers or racks with battery backup unit enhanced thru integration with Intel Power Node Manager
Integrate with Intel Node Manager to increase battery life, reduce battery size ..or for
graceful shutdown

What if -
The world used HTA for a 5°C Datacenter Rise?
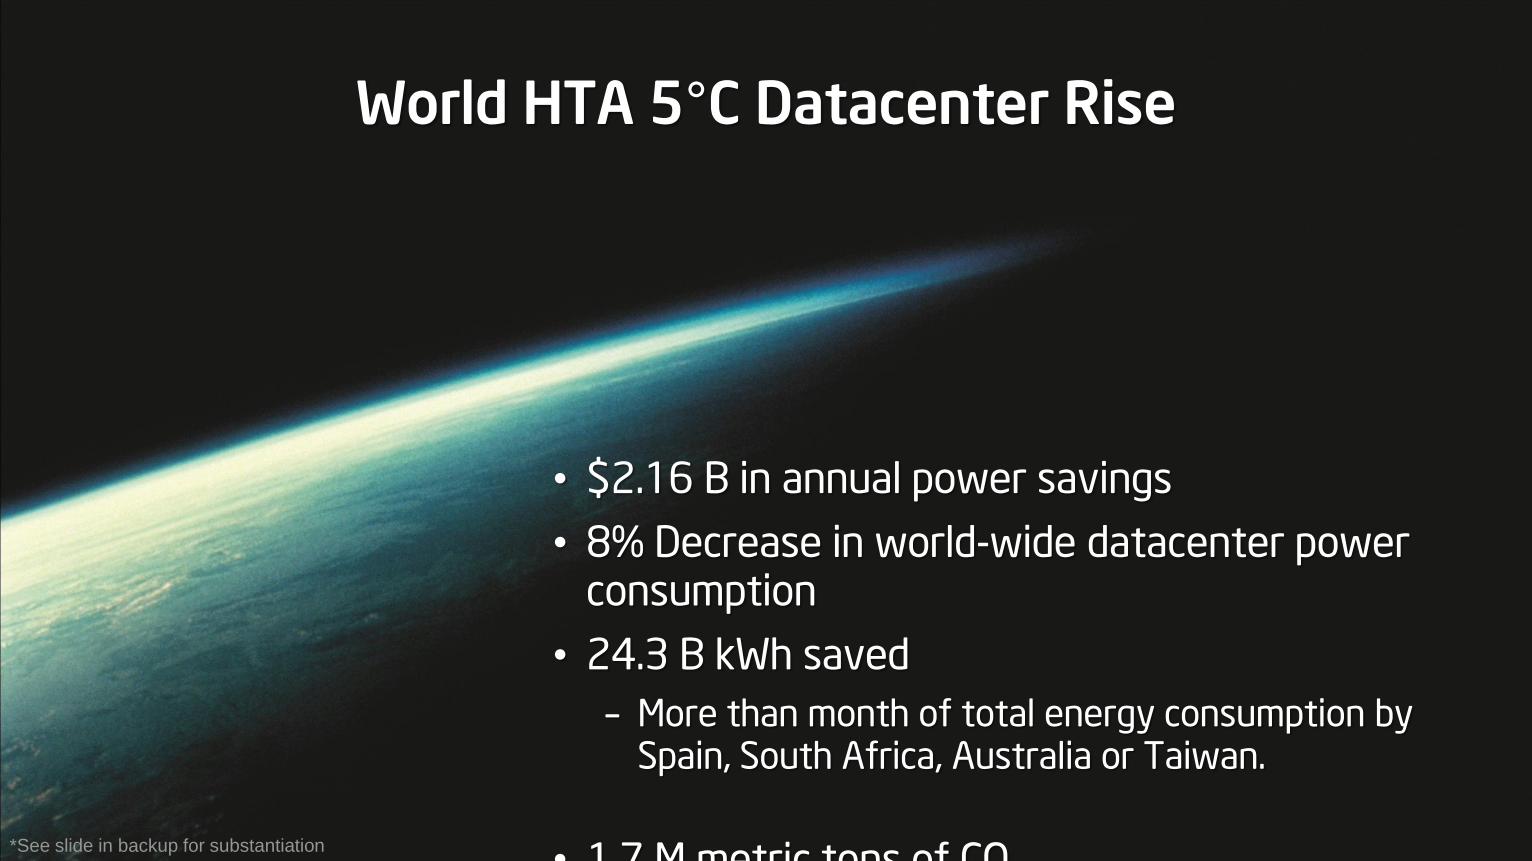
World HTA 5°C Datacenter Rise
• $2.16 B in annual power savings
• 8% Decrease in world-wide datacenter power consumption
• 24.3 B kWh saved
– More than month of total energy consumption by Spain, South Africa, Australia or Taiwan.
• 1.7 M metric tons of CO2*See slide in backup for substantiation
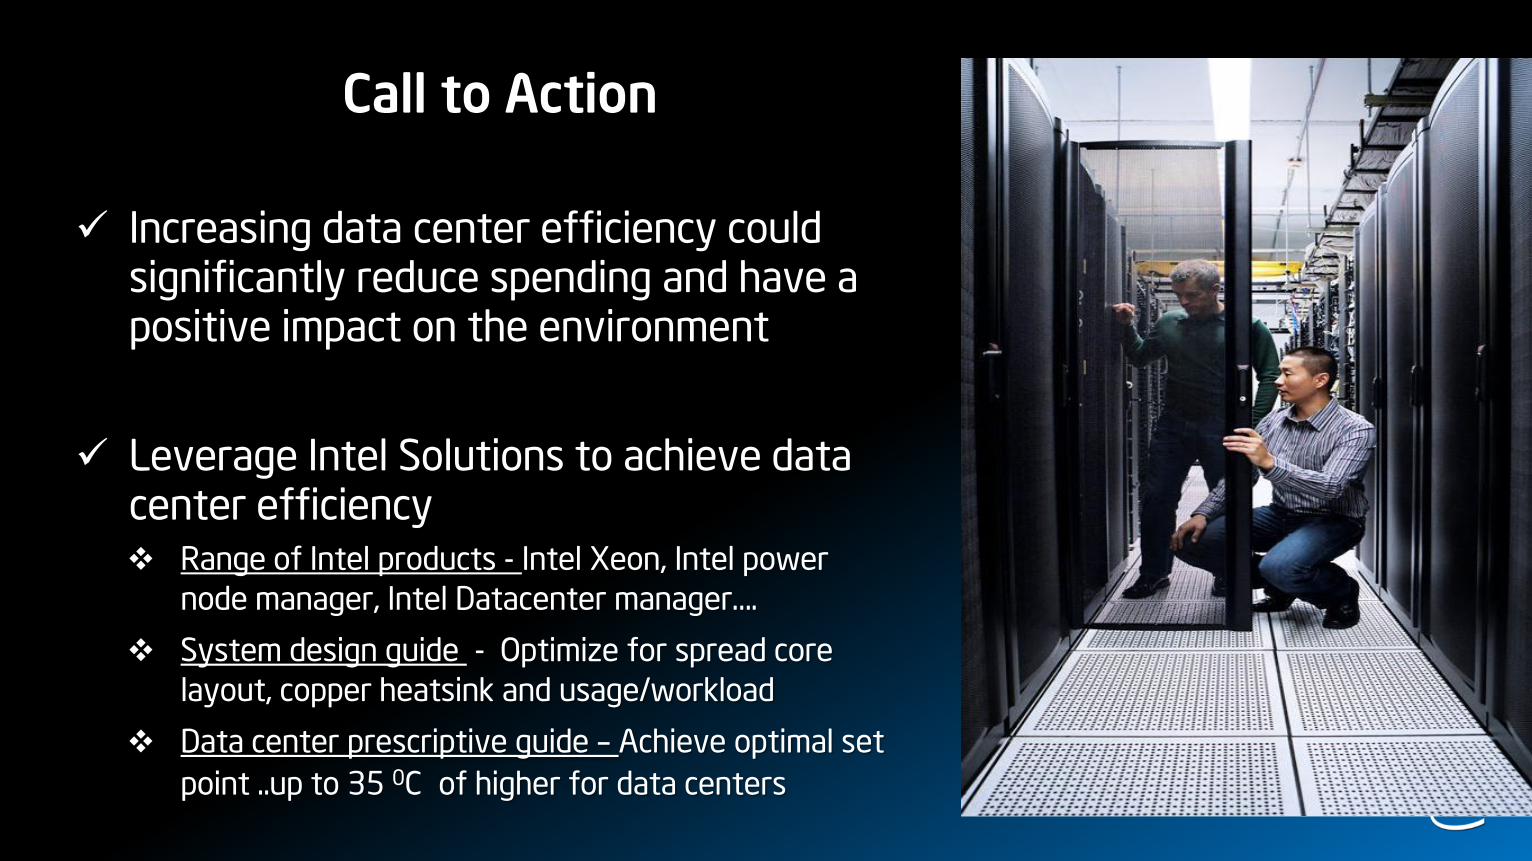
Call to Action
Increasing data center efficiency could significantly reduce spending and have a positive impact on the environment
Leverage Intel Solutions to achieve data center efficiency Range of Intel products - Intel Xeon, Intel power
node manager, Intel Datacenter manager….
System design guide - Optimize for spread core
layout, copper heatsink and usage/workload
Data center prescriptive guide – Achieve optimal set
point ..up to 35 0C of higher for data centers
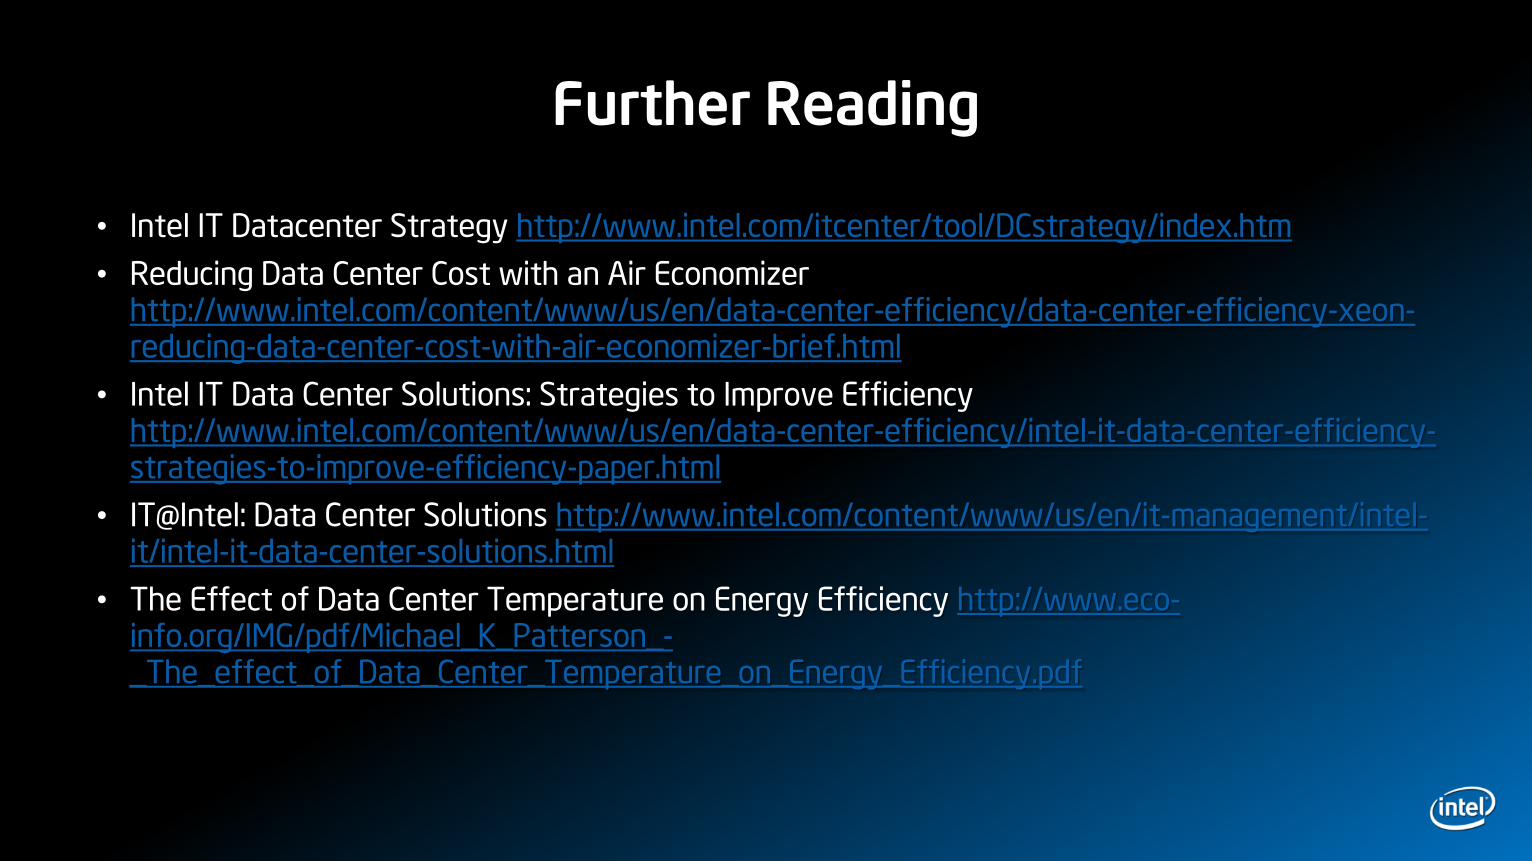
Further Reading
• Intel IT Datacenter Strategy http://www.intel.com/itcenter/tool/DCstrategy/index.htm
• Reducing Data Center Cost with an Air Economizer http://www.intel.com/content/www/us/en/data-center-efficiency/data-center-efficiency-xeon-reducing-data-center-cost-with-air-economizer-brief.html
• Intel IT Data Center Solutions: Strategies to Improve Efficiency http://www.intel.com/content/www/us/en/data-center-efficiency/intel-it-data-center-efficiency-strategies-to-improve-efficiency-paper.html
• IT@Intel: Data Center Solutions http://www.intel.com/content/www/us/en/it-management/intel-it/intel-it-data-center-solutions.html
• The Effect of Data Center Temperature on Energy Efficiency http://www.eco-info.org/IMG/pdf/Michael_K_Patterson_-_The_effect_of_Data_Center_Temperature_on_Energy_Efficiency.pdf

BACKUP
Environmental Benefits Claims Details
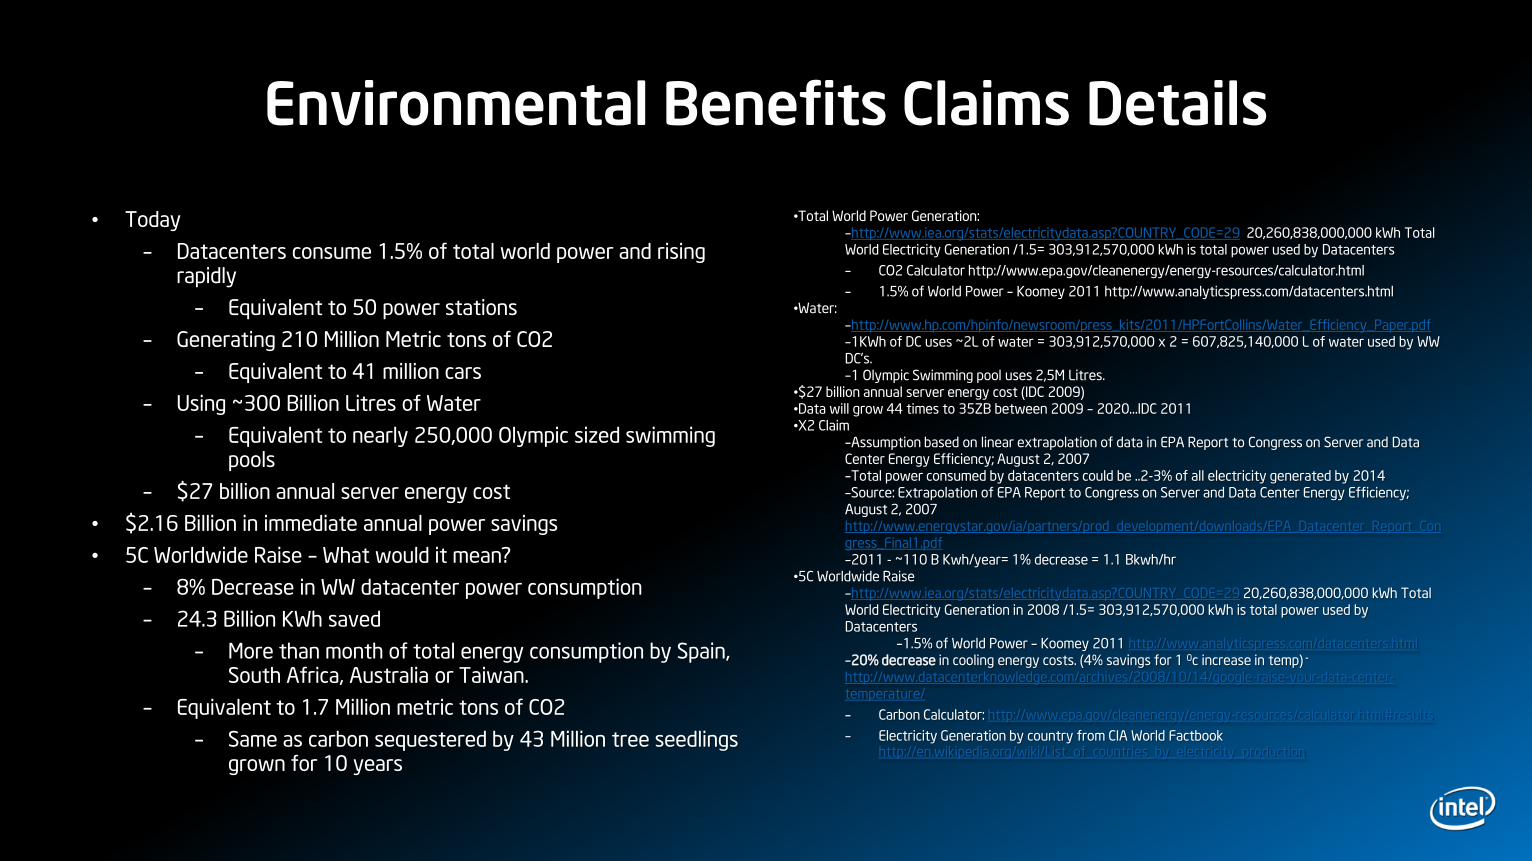
• Today
– Datacenters consume 1.5% of total world power and rising rapidly
– Equivalent to 50 power stations
– Generating 210 Million Metric tons of CO2
– Equivalent to 41 million cars
– Using ~300 Billion Litres of Water
– Equivalent to nearly 250,000 Olympic sized swimming pools
– $27 billion annual server energy cost
• $2.16 Billion in immediate annual power savings
• 5C Worldwide Raise – What would it mean?
– 8% Decrease in WW datacenter power consumption
– 24.3 Billion KWh saved
– More than month of total energy consumption by Spain, South Africa, Australia or Taiwan.
– Equivalent to 1.7 Million metric tons of CO2
– Same as carbon sequestered by 43 Million tree seedlings grown for 10 years
•Total World Power Generation: –http://www.iea.org/stats/electricitydata.asp?COUNTRY_CODE=29 20,260,838,000,000 kWh Total World Electricity Generation /1.5= 303,912,570,000 kWh is total power used by Datacenters
– CO2 Calculator http://www.epa.gov/cleanenergy/energy-resources/calculator.html
– 1.5% of World Power – Koomey 2011 http://www.analyticspress.com/datacenters.html•Water:
–http://www.hp.com/hpinfo/newsroom/press_kits/2011/HPFortCollins/Water_Efficiency_Paper.pdf–1KWh of DC uses ~2L of water = 303,912,570,000 x 2 = 607,825,140,000 L of water used by WW DC‟s. –1 Olympic Swimming pool uses 2,5M Litres.
•$27 billion annual server energy cost (IDC 2009)•Data will grow 44 times to 35ZB between 2009 – 2020…IDC 2011•X2 Claim
–Assumption based on linear extrapolation of data in EPA Report to Congress on Server and Data Center Energy Efficiency; August 2, 2007–Total power consumed by datacenters could be ..2-3% of all electricity generated by 2014–Source: Extrapolation of EPA Report to Congress on Server and Data Center Energy Efficiency; August 2, 2007 http://www.energystar.gov/ia/partners/prod_development/downloads/EPA_Datacenter_Report_Congress_Final1.pdf–2011 - ~110 B Kwh/year= 1% decrease = 1.1 Bkwh/hr
•5C Worldwide Raise–http://www.iea.org/stats/electricitydata.asp?COUNTRY_CODE=29 20,260,838,000,000 kWh Total World Electricity Generation in 2008 /1.5= 303,912,570,000 kWh is total power used by Datacenters
–1.5% of World Power – Koomey 2011 http://www.analyticspress.com/datacenters.html–20% decrease in cooling energy costs. (4% savings for 1 0c increase in temp) -
http://www.datacenterknowledge.com/archives/2008/10/14/google-raise-your-data-center-temperature/
– Carbon Calculator: http://www.epa.gov/cleanenergy/energy-resources/calculator.html#results
– Electricity Generation by country from CIA World Factbookhttp://en.wikipedia.org/wiki/List_of_countries_by_electricity_production
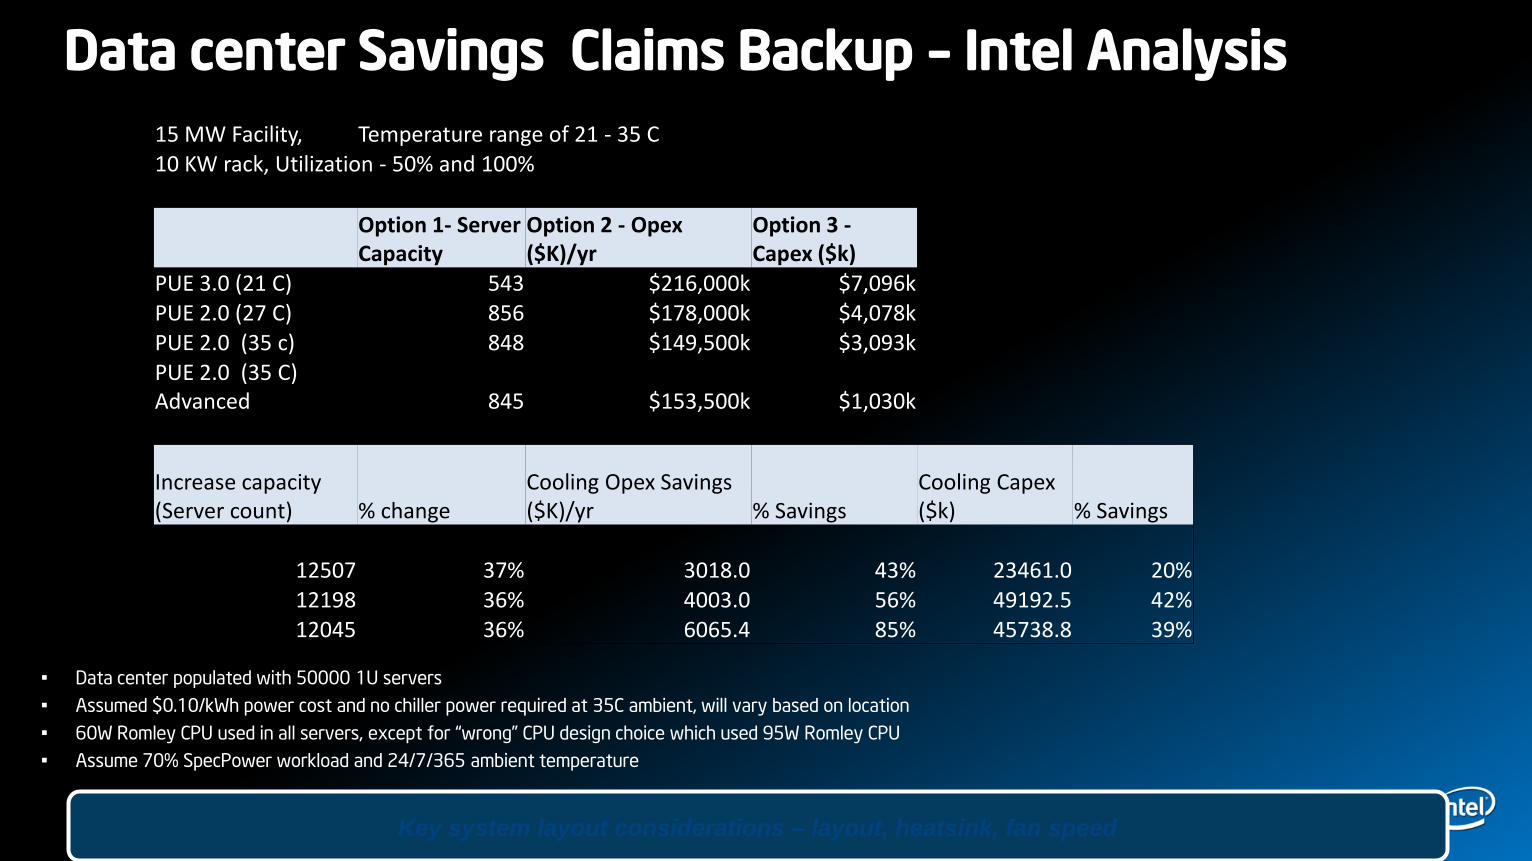
Data center Savings Claims Backup – Intel Analysis
• Data center populated with 50000 1U servers
• Assumed $0.10/kWh power cost and no chiller power required at 35C ambient, will vary based on location
• 60W Romley CPU used in all servers, except for “wrong” CPU design choice which used 95W Romley CPU
• Assume 70% SpecPower workload and 24/7/365 ambient temperature
Key system layout considerations – layout, heatsink, fan speed
15 MW Facility, Temperature range of 21 - 35 C10 KW rack, Utilization - 50% and 100%
Option 1- Server Capacity
Option 2 - Opex ($K)/yr
Option 3 -Capex ($k)
PUE 3.0 (21 C) 543 $216,000k $7,096kPUE 2.0 (27 C) 856 $178,000k $4,078kPUE 2.0 (35 c) 848 $149,500k $3,093kPUE 2.0 (35 C) Advanced 845 $153,500k $1,030k
Increase capacity (Server count) % change
Cooling Opex Savings ($K)/yr % Savings
Cooling Capex ($k) % Savings
12507 37% 3018.0 43% 23461.0 20%12198 36% 4003.0 56% 49192.5 42%12045 36% 6065.4 85% 45738.8 39%
Node Manager Claims Back Up
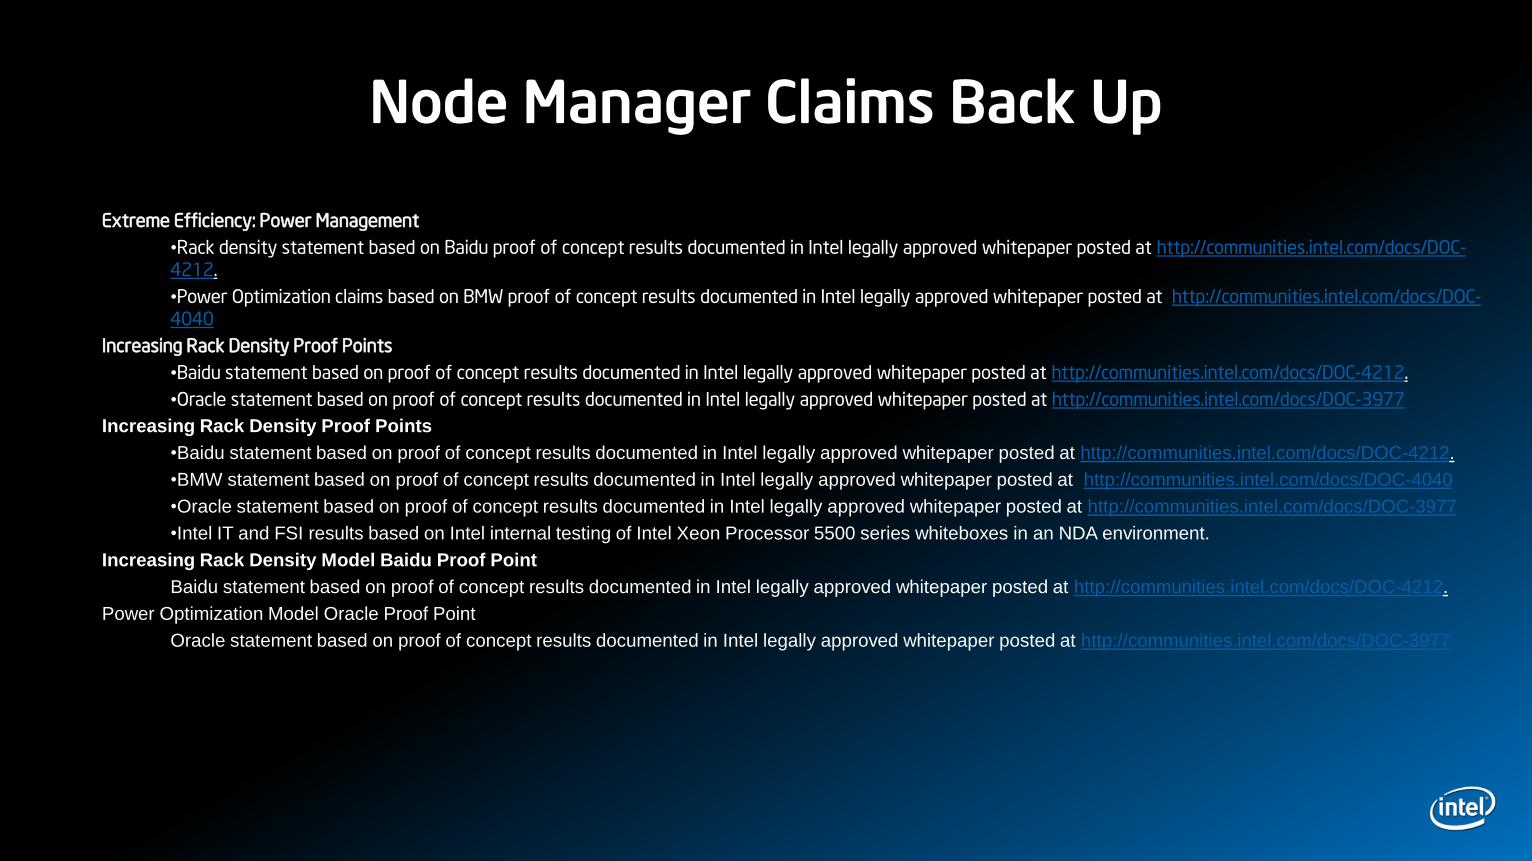
Extreme Efficiency: Power Management
•Rack density statement based on Baidu proof of concept results documented in Intel legally approved whitepaper posted at http://communities.intel.com/docs/DOC-4212.
•Power Optimization claims based on BMW proof of concept results documented in Intel legally approved whitepaper posted at http://communities.intel.com/docs/DOC-4040
Increasing Rack Density Proof Points
•Baidu statement based on proof of concept results documented in Intel legally approved whitepaper posted at http://communities.intel.com/docs/DOC-4212.
•Oracle statement based on proof of concept results documented in Intel legally approved whitepaper posted at http://communities.intel.com/docs/DOC-3977
Increasing Rack Density Proof Points
•Baidu statement based on proof of concept results documented in Intel legally approved whitepaper posted at http://communities.intel.com/docs/DOC-4212.
•BMW statement based on proof of concept results documented in Intel legally approved whitepaper posted at http://communities.intel.com/docs/DOC-4040
•Oracle statement based on proof of concept results documented in Intel legally approved whitepaper posted at http://communities.intel.com/docs/DOC-3977
•Intel IT and FSI results based on Intel internal testing of Intel Xeon Processor 5500 series whiteboxes in an NDA environment.
Increasing Rack Density Model Baidu Proof Point
Baidu statement based on proof of concept results documented in Intel legally approved whitepaper posted at http://communities.intel.com/docs/DOC-4212.
Power Optimization Model Oracle Proof Point
Oracle statement based on proof of concept results documented in Intel legally approved whitepaper posted at http://communities.intel.com/docs/DOC-3977