the efficiency case for raising fuel tax minima under the … · the efficiency case for raising...
TRANSCRIPT
econstorMake Your Publication Visible
A Service of
zbwLeibniz-InformationszentrumWirtschaftLeibniz Information Centrefor Economics
Parry, Ian; Vollebergh, Herman R. J.
Working Paper
Reforming the EU Energy Tax Directive: Assessingthe Options
CESifo Working Paper, No. 5749
Provided in Cooperation with:Ifo Institute – Leibniz Institute for Economic Research at the University ofMunich
Suggested Citation: Parry, Ian; Vollebergh, Herman R. J. (2016) : Reforming the EU Energy TaxDirective: Assessing the Options, CESifo Working Paper, No. 5749
This Version is available at:http://hdl.handle.net/10419/128452
Standard-Nutzungsbedingungen:
Die Dokumente auf EconStor dürfen zu eigenen wissenschaftlichenZwecken und zum Privatgebrauch gespeichert und kopiert werden.
Sie dürfen die Dokumente nicht für öffentliche oder kommerzielleZwecke vervielfältigen, öffentlich ausstellen, öffentlich zugänglichmachen, vertreiben oder anderweitig nutzen.
Sofern die Verfasser die Dokumente unter Open-Content-Lizenzen(insbesondere CC-Lizenzen) zur Verfügung gestellt haben sollten,gelten abweichend von diesen Nutzungsbedingungen die in der dortgenannten Lizenz gewährten Nutzungsrechte.
Terms of use:
Documents in EconStor may be saved and copied for yourpersonal and scholarly purposes.
You are not to copy documents for public or commercialpurposes, to exhibit the documents publicly, to make thempublicly available on the internet, or to distribute or otherwiseuse the documents in public.
If the documents have been made available under an OpenContent Licence (especially Creative Commons Licences), youmay exercise further usage rights as specified in the indicatedlicence.
www.econstor.eu
Reforming the EU Energy Tax Directive: Assessing the Options
Ian Parry Herman Vollebergh
CESIFO WORKING PAPER NO. 5749 CATEGORY 10: ENERGY AND CLIMATE ECONOMICS
FEBRUARY 2016
An electronic version of the paper may be downloaded • from the SSRN website: www.SSRN.com • from the RePEc website: www.RePEc.org
• from the CESifo website: Twww.CESifo-group.org/wp T
ISSN 2364-1428
CESifo Working Paper No. 5749
Reforming the EU Energy Tax Directive: Assessing the Options
Abstract The efficiency case for raising fuel tax minima under the EU Energy Tax Directive (ETD) appears nuanced. Some fuels may be undertaxed (e.g., road diesel, natural gas), while others may be adequately taxed already (e.g., gasoline). Reform proposals would increase some minima, including for road diesel and natural gas, while leaving that for gasoline unchanged. This is a step in the right direction, though the climate, fiscal, health, and net economic benefits are limited. There are potentially much larger gains from extending tax minima to fuels (especially coal) covered by the EU Emissions Trading System (if the cap is tightened). Two-speed systems (with lower minima for low-income countries) may improve political acceptability, while sacrificing little in terms of climate benefits. Under higher, but still plausible, environmental damage assumptions than used here, there is a case for reviving ETD reform, whatever its exact structure.
JEL-codes: Q540, Q580, H230.
Keywords: energy tax directive, climate, tax floor, efficiency.
Ian Parry
Fiscal Affairs Department International Monetary Fund (IMF)
700 19th Street, N.W. USA - 20431 Washington DC
Herman Vollebergh PBL Netherlands Environmental
Assessment Institute P.O. Box 303
The Netherlands - 3720 AH Bilthoven [email protected]
We are grateful to Michael-Skou Anderson and Karen Pittel for very helpful comments and suggestions.
2
1. Introduction The EU Energy Tax Directive (ETD) sets minimum tax rates for fuels—including motor fuels, heating fuels, and electricity—that member states typically need to incorporate in their national tax systems. The ETD is motivated by concerns about the environment and energy dependence, as well as containing tax competition (e.g., the risk of one country setting excessively low tax rates to attract mobile tax bases from other countries). Tax or similar pricing instruments are potentially the most efficient policies for meeting environmental objectives (e.g., Parry et al. 2014, Chapter 3) and their revenues lessen the burden on the broader fiscal system (an especially important concern in these days of historically high fiscal pressures). Recent proposals for amending the ETD2 seek to more effectively promote EU goals for reducing CO2 emissions and improving energy efficiency.3 Currently (see below) tax minima for (on-road) motor fuels favor diesel (which has higher energy content per liter) over gasoline, and minima for heating fuels moderately favor coal (the most CO2 and air pollution intensive fuel) over other fuels. Most coal is exempted however as it is used by large installations for the production of electricity, which are covered by the EU Emissions Trading System (ETS)—these fuels are currently exempt from the ETD on the principle of avoiding overlapping instruments. The reform proposals would replace the current structure of volume-based rates with a charge on each fuel’s carbon content, as well as harmonizing charges on energy content within on-road transportation fuels and within heating/off-road transportation fuels. The reforms (phased in over several years) would, most notably, increase tax floors for diesel and especially for natural gas, while leaving that for gasoline unchanged. Although reform efforts have been stalled since 2011, the issue is likely to resurface at some point with pressure for better harmonization of carbon prices across fuels as the EU makes progress on its commitment to cut greenhouse gases by 40 percent below 1990 levels by 2030. Besides requiring minimum prices on CO2 emissions (a global pollutant) across fuels (both outside and within the ETS) and countries, it is difficult to provide specific guidance on what additional tax minima at the EU level might be efficient from a broader economic perspective. Although energy use is associated with other environmental side effects (air pollution, road congestion, etc.) to a large extent these are national in scope, and impacts vary substantially with local factors, so tax setting for these environmental effects is generally better left to member states. And while tax competition warrants coordination, the severity of the problem varies across fuels and countries (e.g., competition is more intense for trucks
2 See, for example, EC (2011a, b). 3 These goals include cutting EU greenhouse gas emissions by 20 percent in 2020 and 40 percent in 2030, and improving energy efficiency by 20 percent in 2020, all relative to 1990 levels (see Löschel and Oliver 2015).
3
crossing several borders on one tank of fuel than for cars) and quantitative evidence is lacking on efficient tax minima. Rather than attempting to estimate the fully efficient set of minimum tax rates for the ETD (an analytically challenging task!), this paper seeks, more modestly, to identify promising directions for reform, relative to the current situation. To do this we provide a quantitative framework, based on a spreadsheet tool (populated with data for 2012), illustrating trade-offs across a range of possibilities for ETD reform in terms of metrics of concern to policymakers—CO2 emissions, revenue, health impacts, and net economic benefits (environmental benefits less economic costs). Some reform possibilities simply consider more aggressive versions of existing proposals, however some more radical alternatives, designed to increase environmental effectiveness and political acceptability, are also evaluated. One reform extends the proposed CO2 component of the ETD to fuels covered by the EU ETS, thereby establishing a floor price under ETS emissions, some form of which is needed (see Hepburn and Teytelboym (2014) in light of low and volatile emissions prices (recently hovering around €8 per ton of CO2). In addition, given that an obstacle to ETD reform has been concerns about higher minimum taxes among newer (lower-income) member states, another reform entails a two-speed system granting these states less stringent tax floors. Although our numbers are illustrative (e.g., it is difficult to project how tax rates that are formally non-binding might respond to higher tax floors), three general themes emerge from the discussion. First, directionally the proposed reforms to the ETD seem to make economic sense. The case for increasing gasoline and electricity taxes is debatable. According to some, though not all, assessments gasoline excise taxes may already charge for environmental costs like global warming, local pollution, congestion, and accidents; cross-border tax competition is mainly localized; and taxes on vehicles (or in the longer term kilometers driven) may be more efficient instruments for raising revenue (as their tax bases are generally less mobile). And higher electricity tax floors are poorly targeted at emissions. The case for increasing the diesel tax floor is more compelling, given higher environmental costs than for gasoline, more intense tax competition, and the currently favorable tax treatment of diesel. Similarly, the current tax floor for natural gas is below levels needed to reflect environmental costs. Existing reform proposals would however have limited environmental and fiscal effects, cutting EU CO2 emissions and air pollution deaths each by about 1.5 percent, while raising revenues averaging 0.2 percent of GDP. A second theme, on the other hand, is the greater environmental and economic benefits from extending the ETD to fuels covered under the ETS, or just to coal used by power generators, as well as the fiscal benefits from extracting rents that would otherwise go to holders of free ETS allowances. In either case EU CO2 emissions would fall by around 4-5 percent (with a tightening of the ETS cap to maintain current allowance prices), and air pollution deaths
4
around 5-7 percent, while raising new revenue on average of around 0.5 percent of GDP and generating net economic benefits several times larger than confining the ETD to non-ETS fuels. A third theme is that two-speed systems (where increases in tax minima for low-income countries are half those for other countries) need not sacrifice a great deal in terms of climate benefits—EU CO2 emissions reductions are still around 90 percent or more of those when low-income countries are subject to the same tax floors as other countries. In sum, there does not appear to be a huge amount at stake—in quantitative terms—in the reform of the ETD as currently proposed. Much more effective from an environmental, fiscal, and economic perspective, would be an extension of the ETD to ETS fuels, most importantly coal, even if lower-income countries were granted less stringent tax floors. The rest of the paper is organized as follows. The next section provides background on the current ETD and proposed changes, current energy use and taxation across the EU, and efficient design of energy taxes from a national and EU perspective. Section 3 motivates the alternative reform possibilities and presents (based on the spreadsheet tool described in the Appendix) rough calculations of the environmental, fiscal, health, and economic impacts of these reforms. Section 4 offers concluding remarks. 2. Background 2.1. The Current and Proposed ETD: A Closer Look
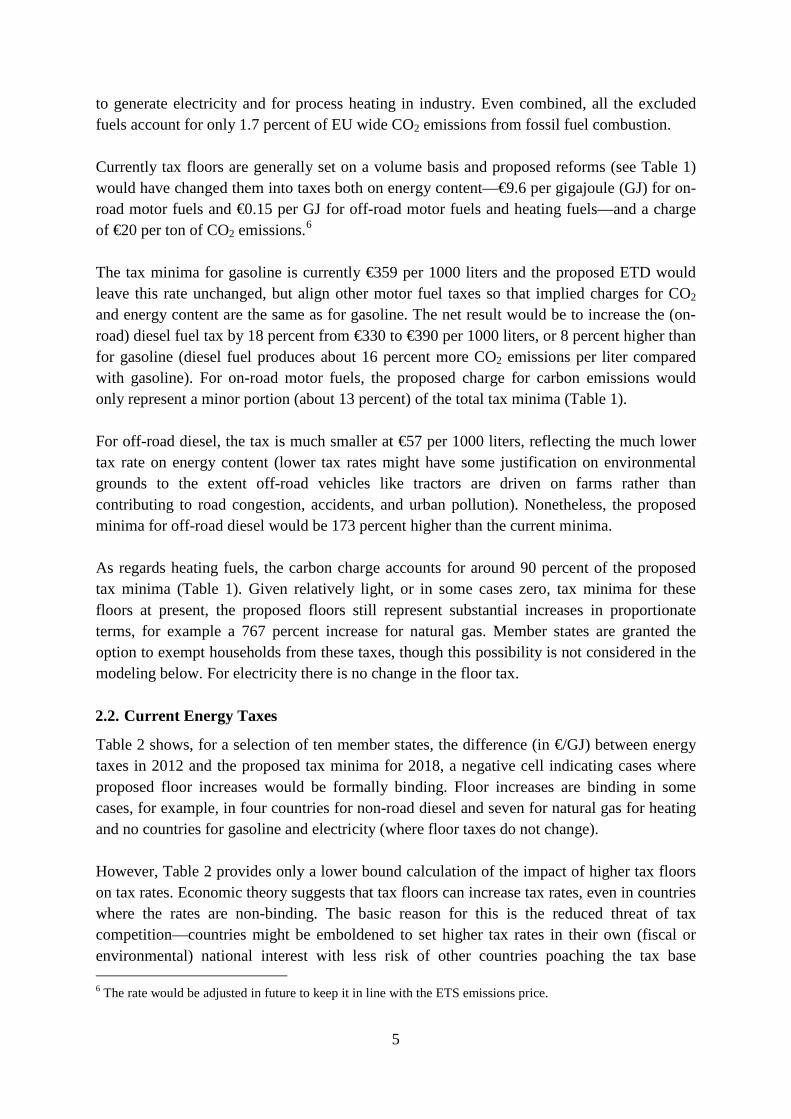
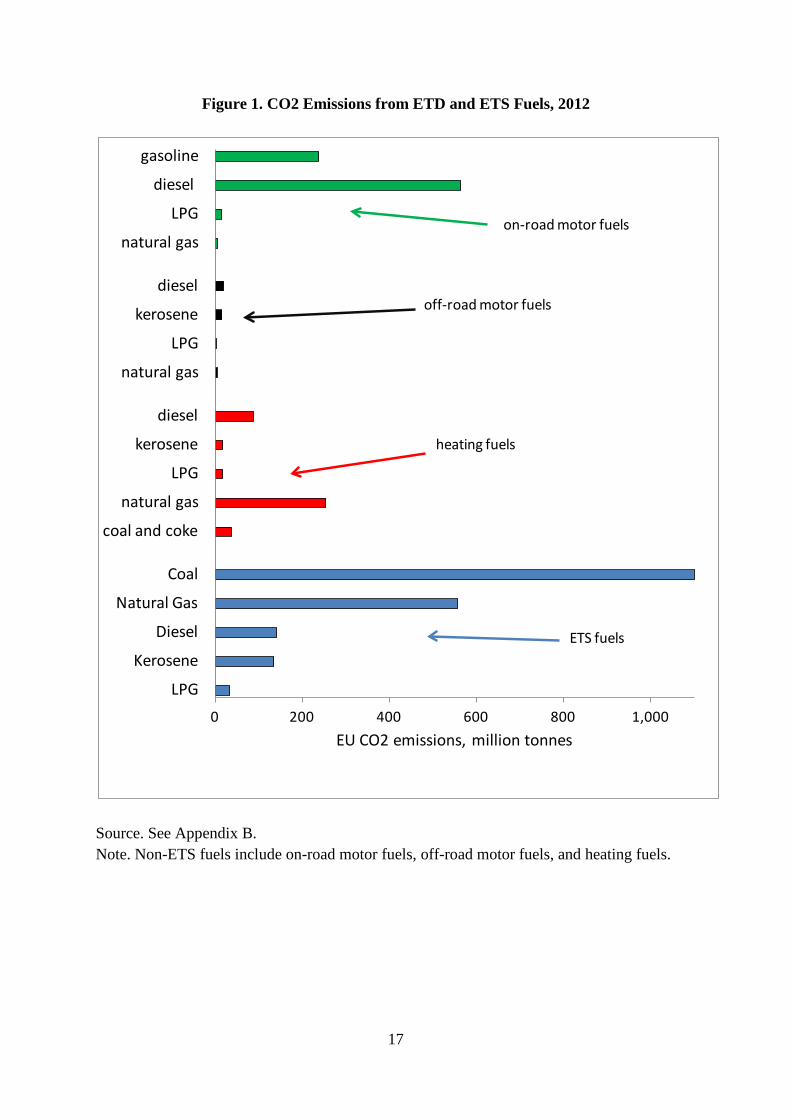
Introduced in 2003, the ETD sets minimum tax rates for five motor fuels—gasoline, diesel, kerosene, liquefied petroleum gas (LPG), and natural gas—making a distinction between on-road and off-road uses. Also covered are six heating fuels—diesel, heavy fuel oil, kerosene, LPG, natural gas, and coal/coke—as well as electricity.4 Figure 1 provides a sense of the importance of different fossil fuels in terms of their contribution to EU CO2 emissions in 2012, along with emissions sources covered by the ETS (coal, natural gas, diesel, kerosene, LPG).5 The discussion below is confined to the more important fuels from a CO2 perspective—gasoline and diesel for on- and off-road motor fuels; diesel, natural gas, and coke/coal for heating fuels; and the five ETS fuels mainly used
4 The ETD was the result of a long discussion on the introduction of an EU-wide carbon tax (Smith and Vollebergh, 1993) and represents a much diluted version of earlier European Commission proposals (including COM (92) 226 and COM (95) 172). 5 Biofuels and biomass are excluded from our analysis, on the assumption that they capture as much CO2 from the air as they release when being burned. The case for exemptions for biofuels and biomass – like biodiesel or waste incineration – may not be as strong as is often assumed, however. They also strongly contribute to air pollution. See Vollebergh (1997) for early estimates of the overall environmental damage profile of both biodiesel and waste incineration.
5
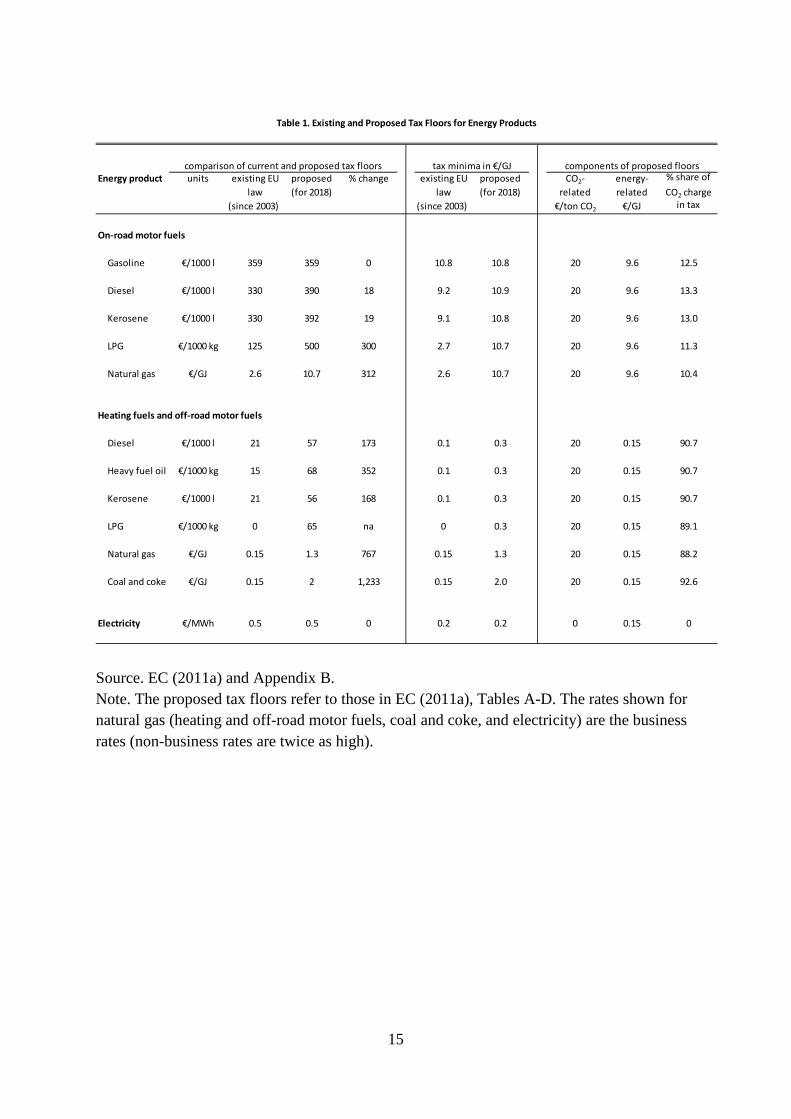
to generate electricity and for process heating in industry. Even combined, all the excluded fuels account for only 1.7 percent of EU wide CO2 emissions from fossil fuel combustion. Currently tax floors are generally set on a volume basis and proposed reforms (see Table 1) would have changed them into taxes both on energy content—€9.6 per gigajoule (GJ) for on-road motor fuels and €0.15 per GJ for off-road motor fuels and heating fuels—and a charge of €20 per ton of CO2 emissions.6 The tax minima for gasoline is currently €359 per 1000 liters and the proposed ETD would leave this rate unchanged, but align other motor fuel taxes so that implied charges for CO2 and energy content are the same as for gasoline. The net result would be to increase the (on-road) diesel fuel tax by 18 percent from €330 to €390 per 1000 liters, or 8 percent higher than for gasoline (diesel fuel produces about 16 percent more CO2 emissions per liter compared with gasoline). For on-road motor fuels, the proposed charge for carbon emissions would only represent a minor portion (about 13 percent) of the total tax minima (Table 1). For off-road diesel, the tax is much smaller at €57 per 1000 liters, reflecting the much lower tax rate on energy content (lower tax rates might have some justification on environmental grounds to the extent off-road vehicles like tractors are driven on farms rather than contributing to road congestion, accidents, and urban pollution). Nonetheless, the proposed minima for off-road diesel would be 173 percent higher than the current minima. As regards heating fuels, the carbon charge accounts for around 90 percent of the proposed tax minima (Table 1). Given relatively light, or in some cases zero, tax minima for these floors at present, the proposed floors still represent substantial increases in proportionate terms, for example a 767 percent increase for natural gas. Member states are granted the option to exempt households from these taxes, though this possibility is not considered in the modeling below. For electricity there is no change in the floor tax. 2.2. Current Energy Taxes
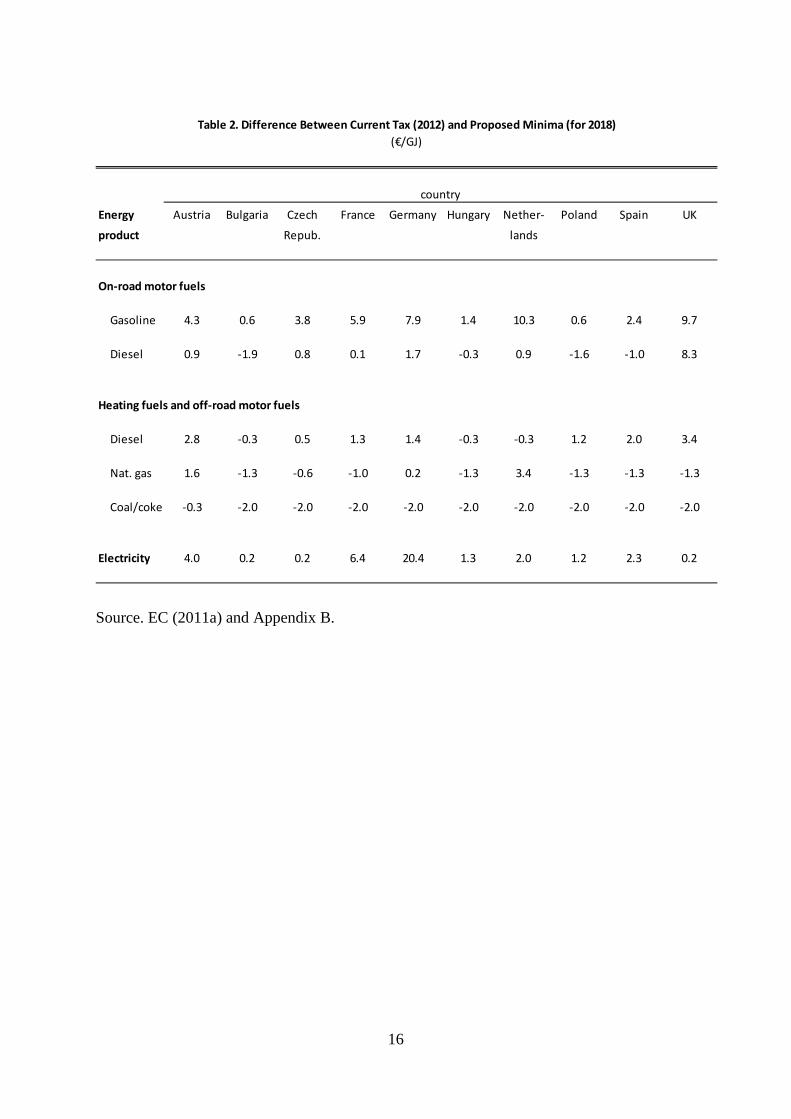
Table 2 shows, for a selection of ten member states, the difference (in €/GJ) between energy taxes in 2012 and the proposed tax minima for 2018, a negative cell indicating cases where proposed floor increases would be formally binding. Floor increases are binding in some cases, for example, in four countries for non-road diesel and seven for natural gas for heating and no countries for gasoline and electricity (where floor taxes do not change). However, Table 2 provides only a lower bound calculation of the impact of higher tax floors on tax rates. Economic theory suggests that tax floors can increase tax rates, even in countries where the rates are non-binding. The basic reason for this is the reduced threat of tax competition—countries might be emboldened to set higher tax rates in their own (fiscal or environmental) national interest with less risk of other countries poaching the tax base 6 The rate would be adjusted in future to keep it in line with the ETS emissions price.
6
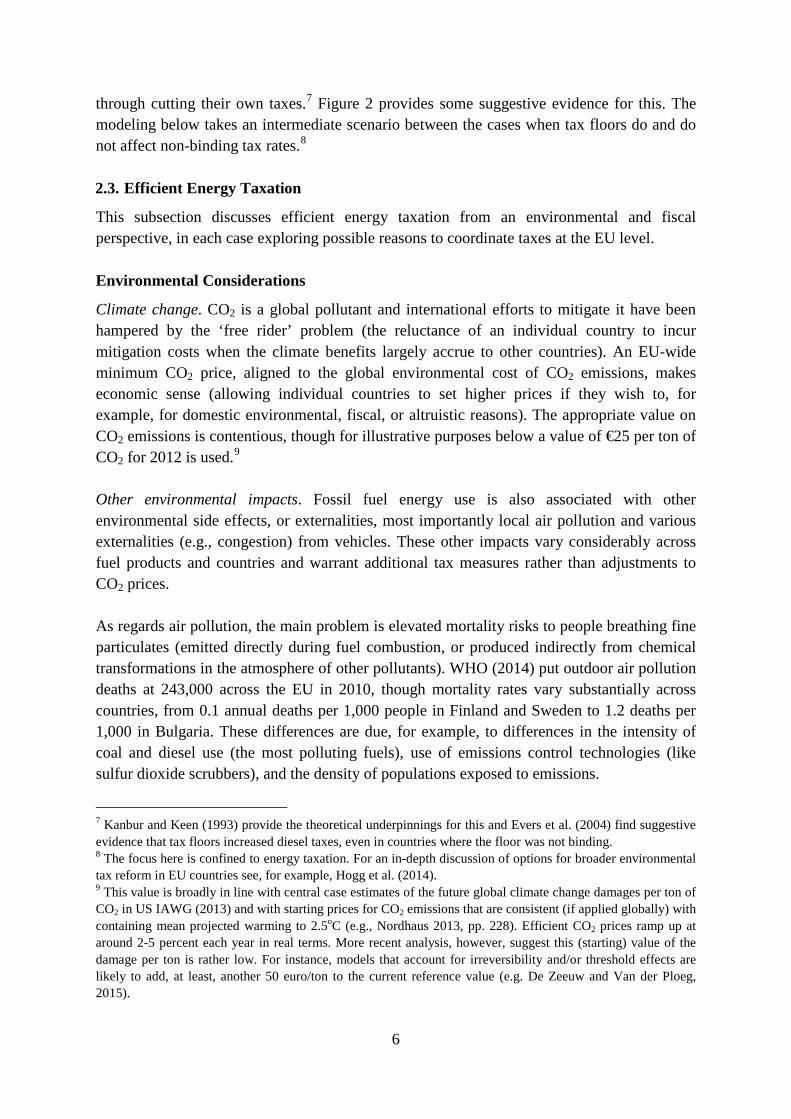
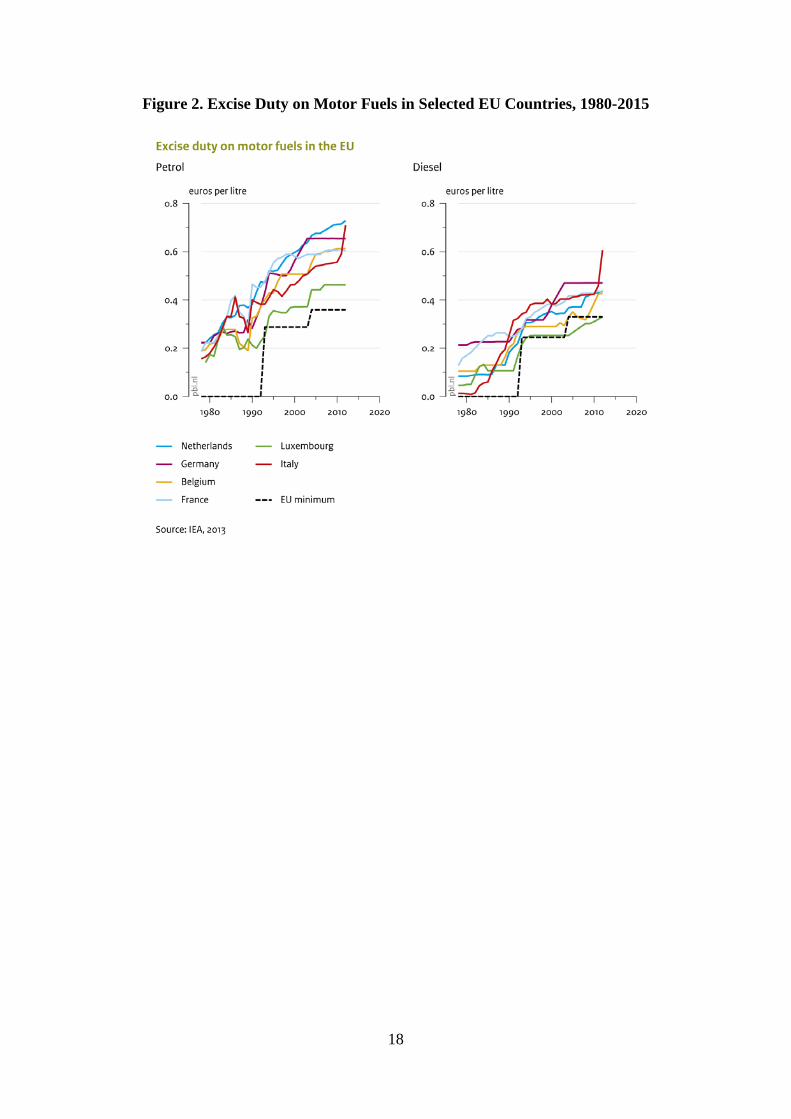
through cutting their own taxes.7 Figure 2 provides some suggestive evidence for this. The modeling below takes an intermediate scenario between the cases when tax floors do and do not affect non-binding tax rates.8 2.3. Efficient Energy Taxation
This subsection discusses efficient energy taxation from an environmental and fiscal perspective, in each case exploring possible reasons to coordinate taxes at the EU level. Environmental Considerations
Climate change. CO2 is a global pollutant and international efforts to mitigate it have been hampered by the ‘free rider’ problem (the reluctance of an individual country to incur mitigation costs when the climate benefits largely accrue to other countries). An EU-wide minimum CO2 price, aligned to the global environmental cost of CO2 emissions, makes economic sense (allowing individual countries to set higher prices if they wish to, for example, for domestic environmental, fiscal, or altruistic reasons). The appropriate value on CO2 emissions is contentious, though for illustrative purposes below a value of €25 per ton of CO2 for 2012 is used.9 Other environmental impacts. Fossil fuel energy use is also associated with other environmental side effects, or externalities, most importantly local air pollution and various externalities (e.g., congestion) from vehicles. These other impacts vary considerably across fuel products and countries and warrant additional tax measures rather than adjustments to CO2 prices. As regards air pollution, the main problem is elevated mortality risks to people breathing fine particulates (emitted directly during fuel combustion, or produced indirectly from chemical transformations in the atmosphere of other pollutants). WHO (2014) put outdoor air pollution deaths at 243,000 across the EU in 2010, though mortality rates vary substantially across countries, from 0.1 annual deaths per 1,000 people in Finland and Sweden to 1.2 deaths per 1,000 in Bulgaria. These differences are due, for example, to differences in the intensity of coal and diesel use (the most polluting fuels), use of emissions control technologies (like sulfur dioxide scrubbers), and the density of populations exposed to emissions.
7 Kanbur and Keen (1993) provide the theoretical underpinnings for this and Evers et al. (2004) find suggestive evidence that tax floors increased diesel taxes, even in countries where the floor was not binding. 8 The focus here is confined to energy taxation. For an in-depth discussion of options for broader environmental tax reform in EU countries see, for example, Hogg et al. (2014). 9 This value is broadly in line with central case estimates of the future global climate change damages per ton of CO2 in US IAWG (2013) and with starting prices for CO2 emissions that are consistent (if applied globally) with containing mean projected warming to 2.5oC (e.g., Nordhaus 2013, pp. 228). Efficient CO2 prices ramp up at around 2-5 percent each year in real terms. More recent analysis, however, suggest this (starting) value of the damage per ton is rather low. For instance, models that account for irreversibility and/or threshold effects are likely to add, at least, another 50 euro/ton to the current reference value (e.g. De Zeeuw and Van der Ploeg, 2015).
7
Emissions released from tall smokestacks (e.g., coal plants) can be transported long distances, crossing national borders.10 In principle, cross-border pollution calls for policy coordination, though involving only a limited number of affected countries. Emissions released closer to ground level (e.g., from cars, houses) tend to remain locally concentrated, limiting cross-border impacts. Local air pollution is therefore more efficiently addressed by national, or perhaps neighboring, governments given that much of the damage occurs within national borders. Moreover, within the EU cross-border impacts are already taken into account through its air pollution policy.11 Nonetheless, until polluters are fully charged for environmental damages through taxes or similar instruments (and recent estimates for the EU suggest this is not yet the case), reform of the ETD can still increase economic efficiency to the extent there are unpriced local health benefits. As regards other vehicle externalities, the main ones are congestion (costs that drivers impose on other road users through adding to delays on busy roads), accidents (risks drivers pose to pedestrians and other vehicle occupants and to third parties through property damages, medical costs, and so on) and wear and tear on the road network (mainly caused by vehicles with heavy axle weights). All of these externalities are better addressed through other measures than fuel taxes (e.g., de Borger and Proost 2014), such as peak period congestion fees and kilometer-based tolls on trucks related to their axle weight, and set at a national or sub-national level. Until these more novel pricing instruments are comprehensively implemented however, economic efficiency requires reflecting all these environmental costs in existing fuel taxes.12 To the extent that ETD reforms push national fuel taxes up towards efficient levels, they yield net economic efficiency benefits, and vice versa if they push taxes (that are already excessive) further beyond the efficient level. There are possibilities for cross-border externalities here as well—most notably, the external costs associated with truck driving may occur in countries other than where trucks re-fuel (and pay tax), given long distances they can travel on a tank of fuel. But again the ideal
10 However, a person’s exposure to air pollution declines rapidly the further away they live from a pollution source. A study for China (Zhou et al. 2006), for example, estimates that someone living within 100 km from a coal plant inhales 86 times as much pollution as someone living 1,000-3,000 km away. At the same time, however, the contribution of many local air pollution sources also contributes to so called ‘background air pollution’ which, in turn, exacerbates local health impacts everywhere. This is why, increasingly, air pollution coordination between global regions is called for. 11 Emissions of air pollutants in the EU are restricted by the EU National Emission Ceilings Directive which imposes national ceilings on emissions of air pollutants, without the possibility to bank or trade between member states. 12 Parry et al. (2014) discuss a simple formula for doing this, and apply it using country-level estimates of external costs.
8
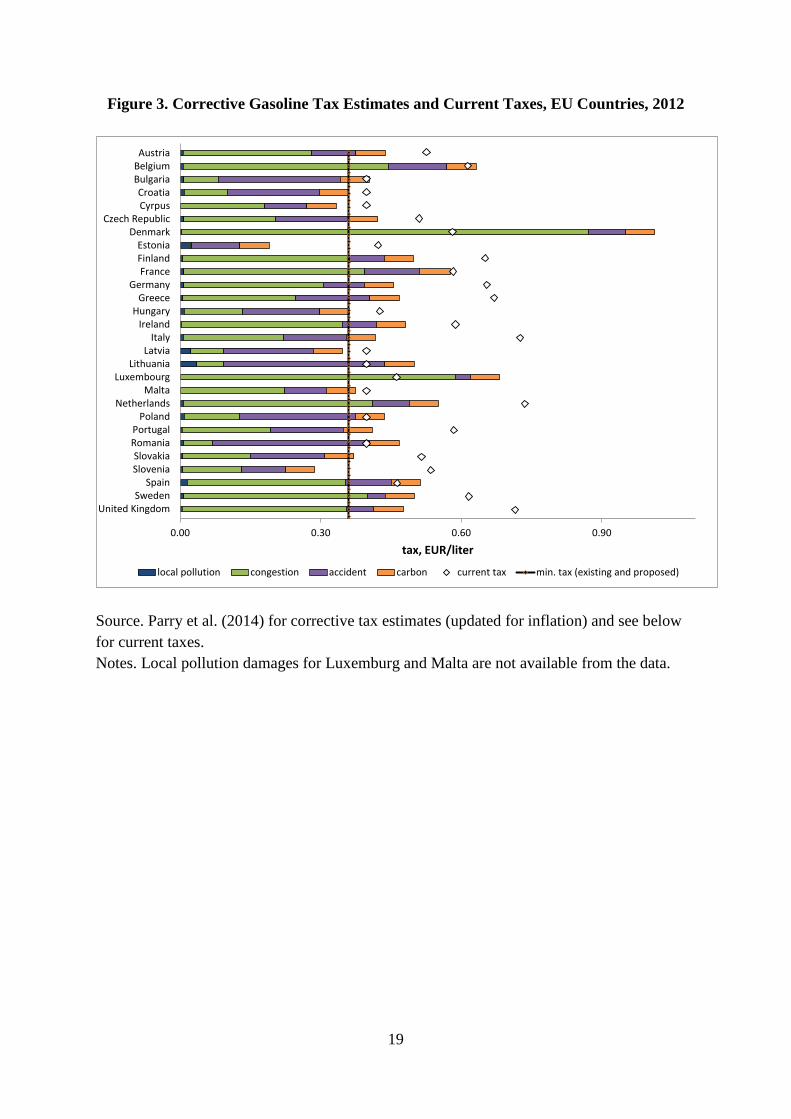
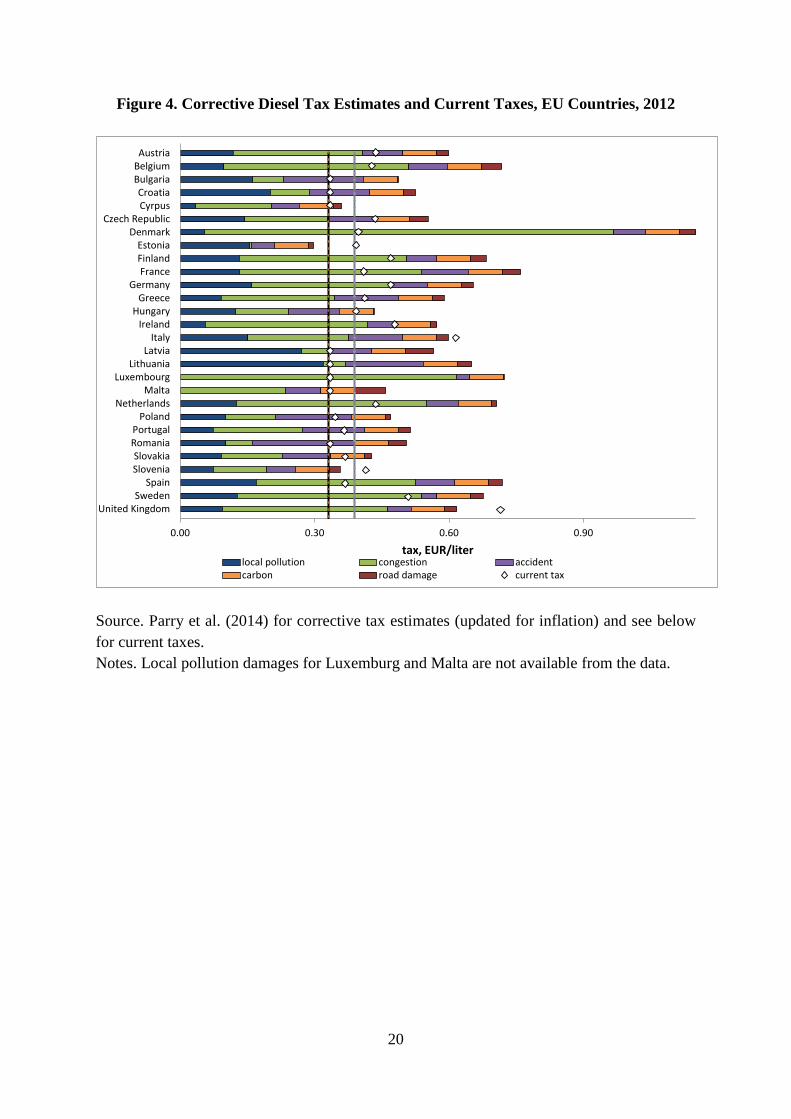
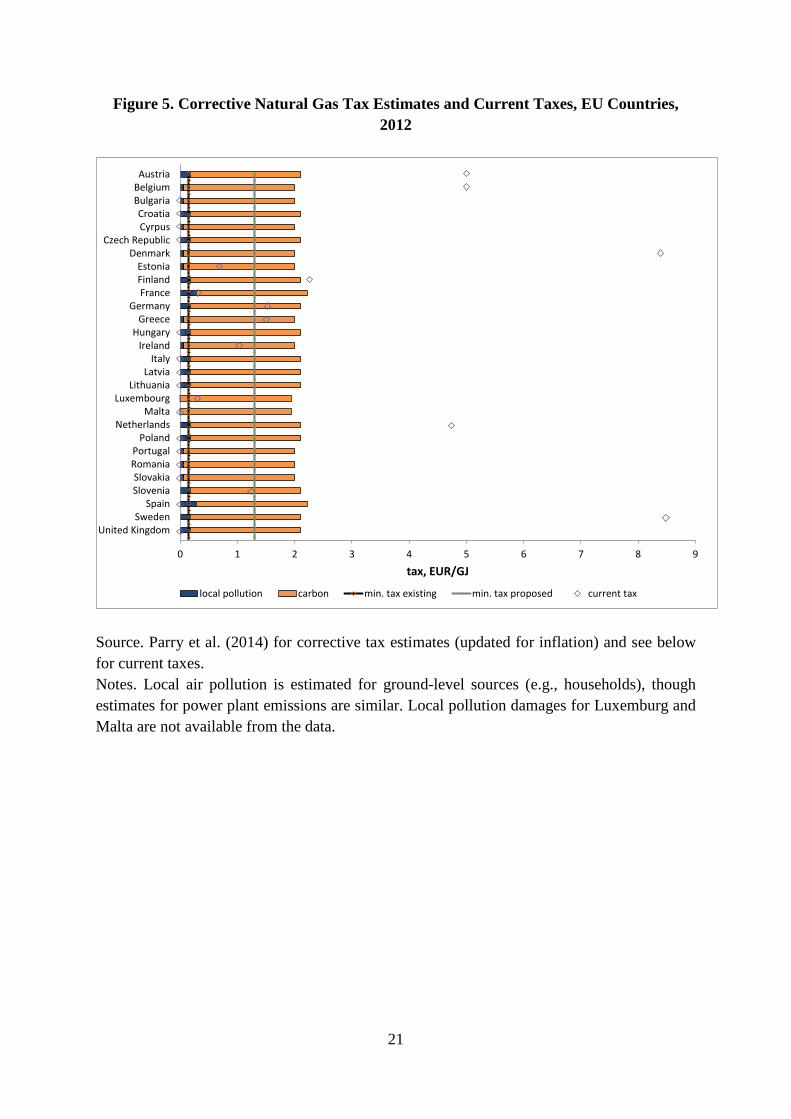
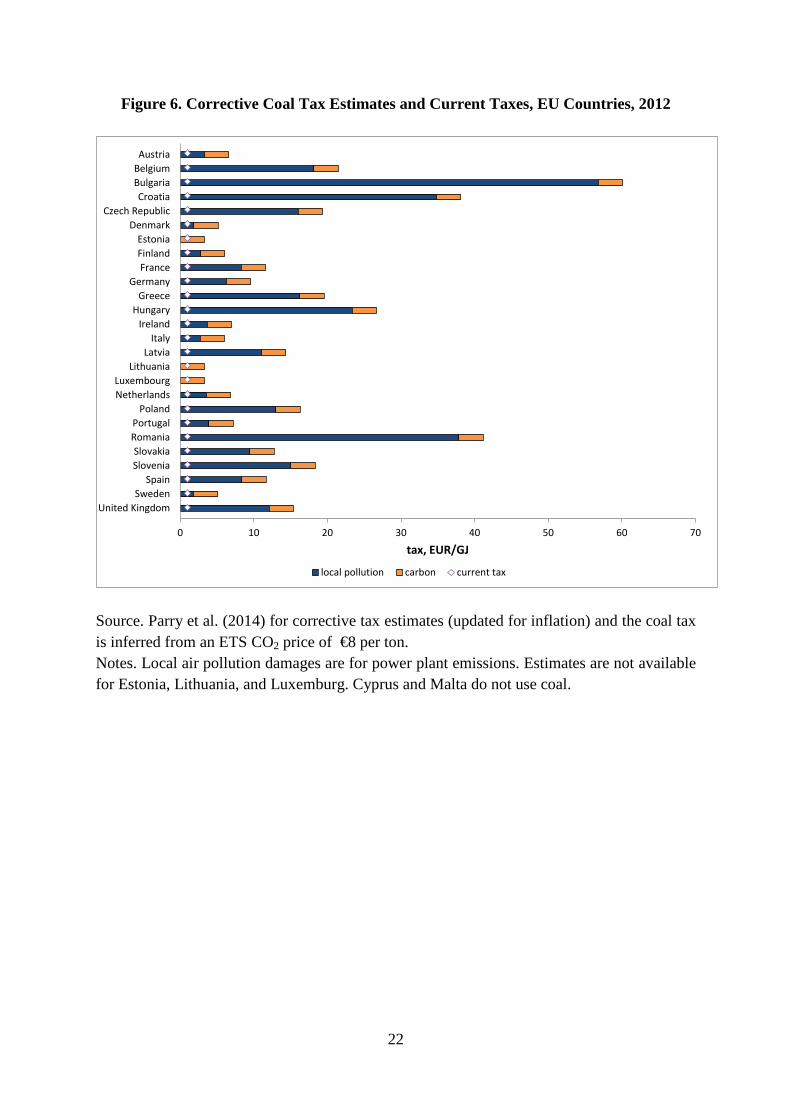
charges to reflect these cross-border externalities are highly location specific and a minimum tax applied across the EU would be a blunt instrument.13 Comparing existing and environmentally efficient fuel taxes. Figures 3-6 compare fuel excises in 2012 and (where applicable) ETD tax floors with some (albeit rough) estimates of efficient or ‘corrective’ taxes needed to reflect external costs. The presented estimates are based on recent work by the IMF (methods underlying the quantification of externalities are summarized in Appendix A). The absolute level of the estimates appear somewhat at the lower end of the uncertainty bound and should therefore treated with care.14 As regards gasoline, the IMF estimates of corrective taxes (shown in Figure 3) are typically between about €0.30 and 0.60 per liter, with congestion usually the biggest component, followed by traffic accidents, then carbon damages—a more modest €0.06 per liter—and local air pollution even less. For most countries, the efficient tax estimates are in the ballpark of the ETD minimum rate (€0.36 per liter), or somewhat above it. However existing taxes are significantly above the ETD minima and generally exceed corrective levels. This does not necessarily imply that fuel taxes should be reduced, given that estimates of efficient taxes are imprecise and perhaps on the low side and fiscal reasons for taxes (see below), but it does at least suggest that a substantial increase in gasoline taxes (induced through a higher EU tax floor) is questionable on externality grounds. For diesel fuel use (averaged across cars and heavier road vehicles), the corrective tax levels tend to be a bit higher than for gasoline, mainly because local air pollution costs are more substantial, and tax rates tend to be a bit lower, falling short of corrective levels in the majority of cases (Figure 4). The case for increasing the tax floor for diesel on externality grounds therefore looks more compelling than for gasoline, particularly as the current floor is below that for gasoline. As regards natural gas, the proposed increase would bring the tax minima much closer to levels warranted on environmental (mostly climate) grounds, though a number of countries already impose taxes exceeding the proposed floor (Figure 5). Paradoxically, there is no tax floor for coal used in the ETS and where environmentally efficient taxes are much larger (Figure 2) due to higher CO2 emission rates per unit of energy (about 40 percent higher than for natural gas) and much higher air pollution emission rates. In fact, local air pollution costs 13 Moreover, these cross-border spillovers will decline with the trend towards greater reliance on distance-based charging for trucks in the EU, as the external costs caused by trucks occur in the country where distance-based taxes are levied. 14 A number of studies have estimated various environmental costs from transportation and energy in European countries, though these are not usually expressed in a form allowing for computation of efficient fuel taxes. One exception is Vollebergh et al (2014) who provide a very involved estimate for the Netherlands, suggesting considerably higher corrective taxes than illustrated below. For some discussion see, for example, Brandt et al. (2010), EXIOPOL (2011), Maibach et al. (2008), NEEDS (2011). A valuable exercise (though one beyond the scope of this paper) would be to reconcile the different estimates which employ quite different methodologies and assumptions. In the meantime, the results from any one study should be treated with caution.
9
exceed climate damages for the majority of countries, often by a substantial amount (especially in densely populated countries with limited deployment of air emissions control technologies). Countries do not generally impose excise taxes on coal, and implicit charges for CO2 emissions through the ETS accounted for only about 30 percent of the assumed climate damages in 2012. Fiscal Considerations
We begin here with some basic tax principles from a domestic perspective, and then consider tax competition issues. Domestic revenue considerations. One basic tax principle is that consumer goods, including residential electricity, heating, and passenger car fuels, are legitimate bases of taxation on fiscal grounds, but intermediate inputs, including industrial electricity and heating and truck fuels, are not. Taxing intermediate inputs at rates higher than those needed to reflect external costs would distort the way firms do business, causing them to use too little of the taxed input, and too much of other inputs, than would be efficient from society’s perspective.15 Another principle is that all consumer goods should generally be taxed at the same ad valorem rate to avoid distorting relative consumer prices, and hence household choices over different goods, though there can be a case for additional taxation in specific cases. Without getting into the technicalities, the case for additional taxation is potentially stronger if (up to a point) the product’s tax base is relatively less mobile than tax bases for broader fiscal instruments. This can be the case if broader instruments case a lot of distortion to economic activity (e.g., promoting black market activity, discouraging labor supply, causing tax-sheltering in housing, fringe benefits, or other tax-preferred activities). These possibilities have been explored in the US literature, with studies finding that on balance fiscal considerations may warrant significant additional gasoline taxation beyond levels warranted by externalities (e.g., West and Williams 2007, Parry 2011). The estimates are imprecise, and could be somewhat higher or lower for different EU countries and for other energy products (depending, for example, on the specifics of countries’ tax systems and behavioral responses to energy and broader tax changes), but the general point is valid: fiscal considerations may warrant setting excise tax rates on household energy products above levels needed to reflect external costs.16 On closer inspection however, within the energy sector there are some taxes, like simple taxes on vehicle sales, vehicle ownership or residential electricity, that have more immobile
15 This is issue is taken care of under normal procedures for value added taxes (VAT) where firms can claim rebates on VAT paid on intermediate inputs. 16 In this chapter we do not consider the potential role of using revenues from environmental taxes to reduce distortionary taxation such as those on wages (see Kosonen and Nicodème 2009 for a discussion in the EU context).
10
bases—and therefore are potentially even more attractive from a revenue-raising perspective—than fuel taxes.17 In fact, using just one tax instrument for two conflicting objectives sets up an inherent tension—the more environmentally effective the policy, the less revenue will be raised. This tension might be avoided by tailoring taxes on fuels to environmental objectives and taxes on vehicles and residential electricity to fiscal objectives. In fact this is what many EU countries are already doing. 18 Tax competition issues. A further complication, and one that may lead countries to set inefficiently low fuel taxes, is the potential for tax competition. National governments may be tempted to set taxes too low (from an international perspective) if this encourages domestic fuel purchases from cross-border sales, thereby appropriating some of the revenue base from other countries (without necessarily adding to domestic environmental costs). The severity of tax competition varies across fuel products, however. Evers et al. (2004) find significant evidence of tax competition over diesel fuel within the EU, not surprisingly given that trucks can drive 1,500-3,000 kilometers on a tank of fuel, allowing considerable flexibility over where to re-fuel. Tax competition for car fuels (gasoline and diesel) is generally less intense, given that most driving from a tank of fuel is contained within one country, though geographically small, landlocked states may have strong incentives to set lower tax rates to encourage cross-border purchases (see the example of Luxemburg in Figure 2). Summary
The environmental case for substantially higher tax floors within the existing structure of the ETD is nuanced given that, according to estimates used here, current tax rates for gasoline exceed environmentally efficient taxes (though this is not a universal finding across studies). Current tax floors for diesel and natural gas, in contrast, are generally below levels warranted on environmental grounds. The degree of undercharging is most pronounced for coal, ironically as coal use is mostly excluded from the ETD and also in the proposed ETD for 2018. Revenue-raising considerations may warrant some further taxation of household (but not industry) fuels, though other instruments are potentially more efficient from a fiscal perspective. Conversely, tax competition suggests a stronger case for coordinating over taxes for intermediate fuels (for trucks) rather than household fuels (for cars), though solid analytical work quantifying the efficient level of tax floor is lacking.
17 Electricity taxes have relatively immobile bases in the sense that (unlike for taxes on power generation fuels) they cannot be avoided by reducing fuel use per unit of generation, while simple vehicle taxes have immobile bases in the sense that (unlike for road fuel taxes) they cannot be avoided by driving vehicles less, or using fuel efficient vehicles more intensively. 18 However, EU currently aims to phase out (sales) taxes on vehicles in order to improve the functioning of the internal market. Moreover, taxes on vehicles may provide an important second best instrument to effectively price emissions, like carbon. Recent evidence from a Dutch experiment with differentiated car sales taxes suggest that fuel (tax) price increases are much less effective to stimulate the purchase of small fuel efficient cars (see Meerkerk et al. 2014).
11
3. Comparing Reform Possibilities Leaving aside theoretical ambiguities in the case for higher EU energy tax minima, this section provides some quantitative sense of the environmental, fiscal, and economic welfare tradeoffs across a wide spectrum of possibilities for reforming the ETD. We start with the motivation for alternative options, briefly outline the methodology, and then present the results. 3.1. Motivation for Alternative Options
Eight options for reforming the ETD are considered, including four cases meant to roughly span the range of possibilities for different tax rate structures, but each done with and without a two-speed system involving increases in tax floors (relative to the current situation) that are 50 percent smaller for lower income member states than other states. Specific tax rate changes are discussed below and the focus in the results discussion is on effects aggregated to the EU level. All scenarios are based on data for 2012, comparing counter-factual situations for that year had different tax regimes been in place. Lower income member states are defined as countries with per capita income below €15,000 in 2012 and include Bulgaria, Croatia, Czech Republic, Estonia, Hungary, Latvia, Lithuania, Poland, Romania, and Slovakia. Collectively, these countries accounted for 19 percent of EU CO2 emissions in 2012, so the emissions impacts of granting them laxer tax floors will not be that dramatic. Their share of EU air pollution deaths is larger however, at 51 percent, so relative differences in health outcomes between one- and two-speed reforms are more pronounced. The four cases for higher tax floors include: (i) The proposed ETD (discussed in Section 2 and indicated by comparing the fourth and
third columns in Table 1, or the sixth and seventh columns) by itself.
(ii) Establishing a €20 per ton charge on CO2 emissions from ETS fuels, combined with (i). The key question here is how the ETS would be adjusted. We assume the supply of allowances is reduced accordingly to maintain the 2012 allowance price of €8 per ton on top of the new tax floor, implying a total price on ETS emissions of €28 per ton which is equal to the (marginal) climate change damage we assume throughout this paper. If instead the supply of allowances is held fixed, allowance prices would (temporarily) drop to zero as the tax floor renders the ETS non-binding.19
19 Note that emissions can also be shifted over time due to the banking provision in the ETS keeping allowance prices low for a (very) long period (see for a detailed analysis Brink et al., 2015). Our assumption of allowance supply adaptation is equivalent to a so called variable carbon tax option as currently applied by the UK.
12
(iii) A tax minima of €3 per GJ for coal consumption across both ETS and non-ETS sectors, combined with (i). This is equivalent to (on average) a charge of about €28 per ton of CO2 from coal use.20 Again, ETS allowances are reduced to maintain the €8 per ton allowance price on top of the coal tax).
(iv) Higher tax minima for the main road fuels, combined with (i). Specifically, the tax floor for gasoline is increased from €359 to €415 per 1000 liters and the tax floor for diesel is increased from €330 to €450 per 1000 liters.
3.2. Methodology
Appendix B provides details on the spreadsheet and data used to generate rough calculations of the impacts of alternative reforms. For each 28 EU member countries, 11 fuel use categories potentially subject to (changes in or new) tax minima are considered—three motor fuels (on-road gasoline, on-road diesel, off-road diesel), three heating fuels (diesel, natural gas and coal/coke), and five primary ETS fuels (coal, natural gas, diesel, kerosene, and LPG). Changes in fuel taxes in response to higher tax floors are based on splitting the difference between two bounding cases, one in which taxes increase in line with tax minima only in those countries where rates are currently, or become, binding, and the other in which all tax rates increase by the same absolute amount as the increase in the floor tax. Tax changes are passed forward in higher fuel prices and fuels change according to simple assumptions about (long-run) fuel price elasticities (ignoring cross-price effects among fuels). The CO2, health, revenue, and economic welfare impacts of these changes in fuel use are computed21, and aggregated over fuel products and countries. 3.3. Quantitative Assessment
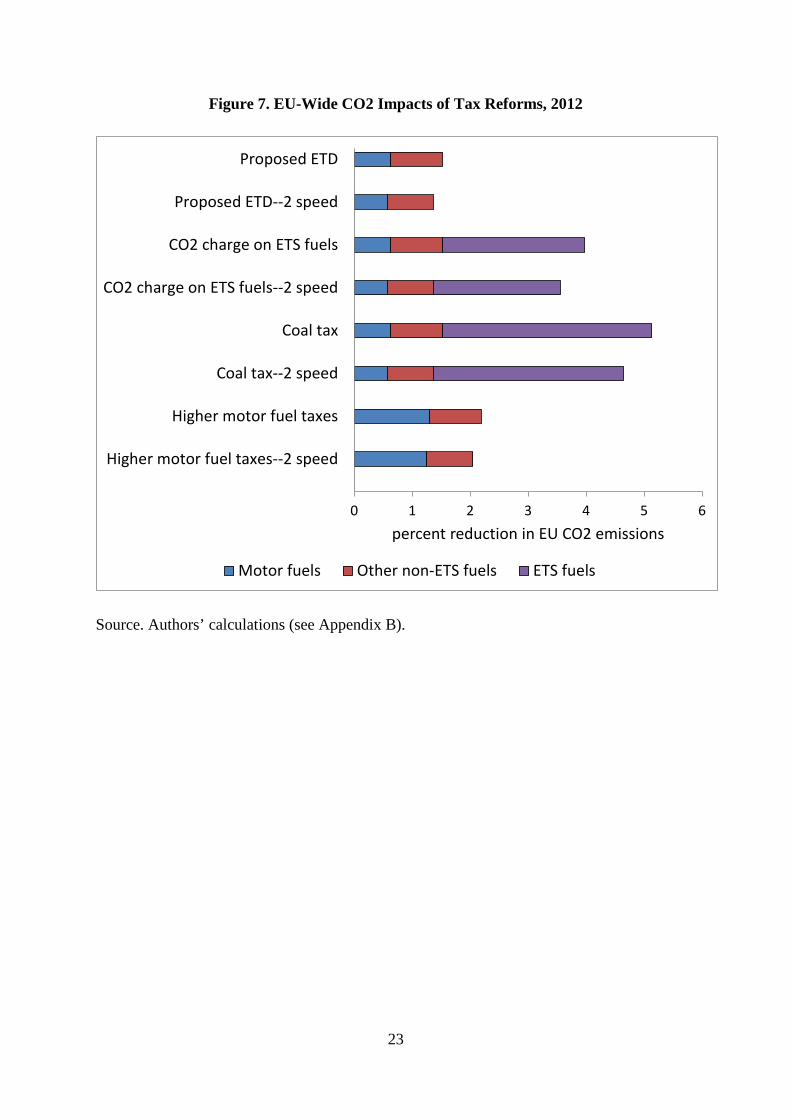
This section compares the reform scenarios described above in terms of their impacts, indicating the contribution of broad fuel groupings—motor fuels, other non-ETS fuels or heating, and ETS fuels. The numbers are useful in providing a broad sense of the impacts of different policy scenarios, though they should not be taken too literally (e.g., given uncertainty over parameters and how actual tax rates might respond to higher tax floors). CO2 emissions. Figure 8 shows the percent reduction in EU-wide CO2 emissions from alternative tax reform possibilities, that is, the reductions compared with actual 2012 levels had these higher tax floors been in place. To put the figures in perspective, actual CO2 emissions in 2012 were 3,776 million tonnes, or nearly 10 percent below 1990 levels (the reference point for future emissions targets).
20 Ideally member states would be allowed to vary this charge with local air emissions rates and population exposure but this possibility is not considered here. 21 Economic welfare impacts are a partial equilibrium measure, reflecting environmental benefits less economic costs from changes in fuel use.
13
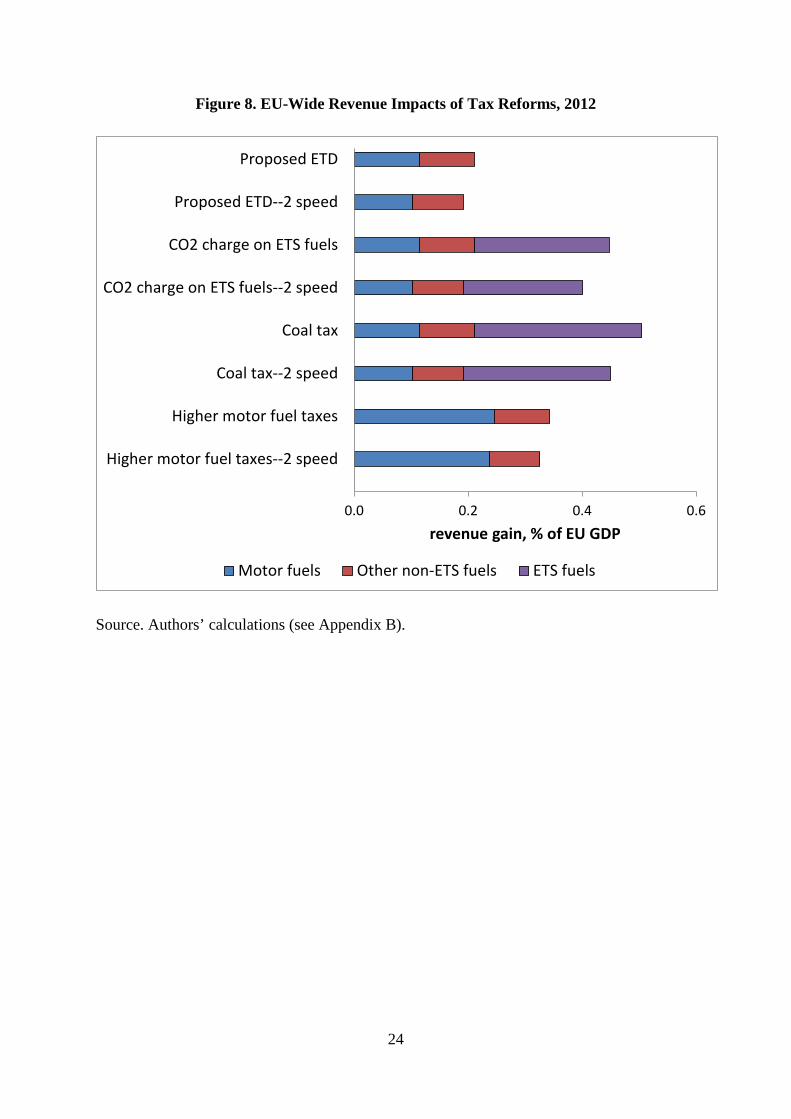
The proposed ETD reduces EU-wide CO2 emissions by an estimated 1.5 percent, with two-fifths coming from reduced motor fuel consumption (i.e., diesel fuel as the gasoline tax floor is unchanged) and three-fifths from reduced heating fuel consumption (assuming, as noted above, no exemptions from tax increases). The higher motor fuel tax scenario pushes the CO2 reductions up to 2.2 percent, though effects are limited.22 Achieving more substantial reductions in CO2 emissions requires extending tax reforms to ETS fuels, either through directly pricing CO2 or taxing coal—EU-wide CO2 emissions are reduced by 4.0 percent in the former policy scenario and by 5.1 percent in the latter. Both of these extensions have a substantial effect on coal prices (given that coal is the most carbon-intensive fuel), and even though the price responsiveness of coal is smaller than for road fuels, the EU-wide reduction in coal use is still 6 and 11 percent respectively. Also noteworthy is that the two-speed structures allowing less stringent tax floors for lower-income members states do not sacrifice a large amount in terms of CO2 reductions. Reductions are about 5-10 percent smaller than when all countries are subject to the same tax floors. Revenue. Figure 8 shows total revenues raised from the reform scenarios, expressed as a percent of EU-wide GDP (and accounting for any revenue losses from pre-existing fuel taxes from erosion of the tax base). The proposed ETD raises revenues of 0.2 percent of GDP (averaged across the EU) with about half coming from higher motor taxes and half from higher taxes for heating fuels. Extending the tax base to ETS CO2 emissions more than doubles revenues, to 0.45 percent of EU GDP, while the scenarios with coal taxes and higher motor fuel taxes each raise revenues of 0.50 and 0.34 percent of GDP respectively. Aggregate revenues are 5-10 percent lower under the two-speed structures across the different scenarios, though proportionate impacts are bigger in low-income member states (up to about 20 percent lower). Health impacts. Figure 9 shows the percent reduction in premature air pollution deaths from fossil fuel air pollution. The proposed ETD has fairly modest health benefits—a reduction in air pollution deaths of 1.4 percent, with two-fifths coming from reductions in motor fuels and three-fifths from reductions in heating fuels. Heating fuels like natural gas do not really produce the pollutants (direct fine particulates and sulfur dioxide) that are especially harmful to human health, and although diesel fuel accounts for about 15 percent of premature air pollution deaths in the EU, the proposed ETD only cuts diesel use by 4 percent. Again, extending the ETD to the
22 In this policy scenario, the proportionate changes in fuel prices for individual countries are around 5-8 percent for gasoline and 10-20 percent for diesel. Given the elasticity assumptions, these imply gasoline reductions of around 2.5-4 percent, and diesel reductions of around 5-10 percent.
14
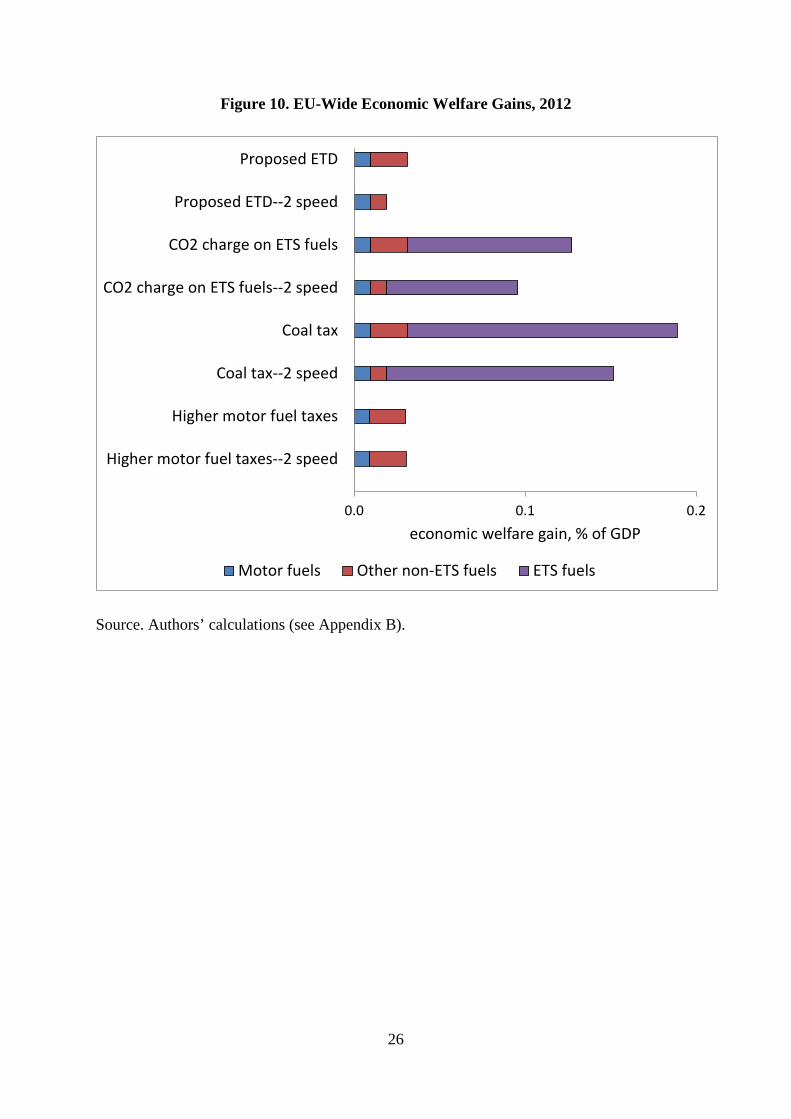
ETS, or taxing coal, yields significantly bigger health benefits—4.9 percent and 6.9 percent, respectively—given that ETS coal accounts for two-thirds of air pollution deaths.23 Under the two-speed scenarios, health benefits for lower income countries are typically around a third smaller than when they are subject to the same tax floors as other countries. Economic impacts. Finally, Figure 10 illustrates the net economic welfare benefits from the policy reforms expressed as a percent of EU GDP. Net benefits are much larger, between 0.1 and 0.2 percent of GDP, when tax floors cover coal or ETS fuels. Again, this reflects the relatively large economic efficiency gains from taxing coal, the fuel where there is currently the largest discrepancy (by far) between the efficient level of taxation to charge for environmental costs and current taxation. 4. Conclusion The economic efficiency basis (as well as political support) for energy tax harmonization at the EU level remains unsettled. There is a clear case for minimum prices to reflect carbon emissions, however this applies equally to fuels within the ETS (and not currently covered by the proposed ETD). There are important externalities (e.g., air pollution) besides carbon emissions, but their severity varies with local conditions and setting of tax rates is generally better left to member states (with some additional coordination with the current EU air quality directive where needed). There are some tax competition issues (e.g., truck drivers re-tanking in countries where fuel prices are lowest) though quantitative estimates of efficient tax floors at the EU level is lacking. Although the existing ETD reform proposals from 2011 would be a step in the right direction, illustrative calculations presented here suggest the climate, fiscal, health, and net economic gains would be relatively modest. There are potentially much larger gains from extending tax minima to fuels (especially coal) covered by the ETS, though this would undermine the trading system (by driving allowance prices to zero) in the short run if the current emissions cap would not be adapted accordingly. Given the political challenges of reaching unanimity over common tax floors across the 28 EU member states, policymakers might consider the possibility of two speed systems with less stringent floors for lower-income states, and this would have a relatively modest sacrifice in terms of EU carbon emissions. Finally it should be noted that our estimates of the environmental costs of fuel use are at the lower end of the bandwidth of uncertainty that inherently surrounds such estimates. The case for a revival of ETD reform—whatever its exact structure—strongly increase with much higher environmental benefits from reform.
23 Scaling coal taxes to smokestack air pollution emission rates would be significantly more effective as it would promote greater use of emissions control technologies.
15
Source. EC (2011a) and Appendix B. Note. The proposed tax floors refer to those in EC (2011a), Tables A-D. The rates shown for natural gas (heating and off-road motor fuels, coal and coke, and electricity) are the business rates (non-business rates are twice as high).
Energy product units existing EU proposed % change existing EU proposed CO2- energy- % share oflaw (for 2018) law (for 2018) related related CO2 charge
(since 2003) (since 2003) €/ton CO2 €/GJ in tax
On-road motor fuels
Gasoline €/1000 l 359 359 0 10.8 10.8 20 9.6 12.5
Diesel €/1000 l 330 390 18 9.2 10.9 20 9.6 13.3
Kerosene €/1000 l 330 392 19 9.1 10.8 20 9.6 13.0
LPG €/1000 kg 125 500 300 2.7 10.7 20 9.6 11.3
Natural gas €/GJ 2.6 10.7 312 2.6 10.7 20 9.6 10.4
Heating fuels and off-road motor fuels
Diesel €/1000 l 21 57 173 0.1 0.3 20 0.15 90.7
Heavy fuel oil €/1000 kg 15 68 352 0.1 0.3 20 0.15 90.7
Kerosene €/1000 l 21 56 168 0.1 0.3 20 0.15 90.7
LPG €/1000 kg 0 65 na 0 0.3 20 0.15 89.1
Natural gas €/GJ 0.15 1.3 767 0.15 1.3 20 0.15 88.2
Coal and coke €/GJ 0.15 2 1,233 0.15 2.0 20 0.15 92.6
Electricity €/MWh 0.5 0.5 0 0.2 0.2 0 0.15 0
tax minima in €/GJ
Table 1. Existing and Proposed Tax Floors for Energy Products
components of proposed floorscomparison of current and proposed tax floors
16
Source. EC (2011a) and Appendix B.
Energy Austria Bulgaria Czech France Germany Hungary Nether- Poland Spain UK
product Repub. lands
On-road motor fuels
Gasoline 4.3 0.6 3.8 5.9 7.9 1.4 10.3 0.6 2.4 9.7
Diesel 0.9 -1.9 0.8 0.1 1.7 -0.3 0.9 -1.6 -1.0 8.3
Heating fuels and off-road motor fuels
Diesel 2.8 -0.3 0.5 1.3 1.4 -0.3 -0.3 1.2 2.0 3.4
Nat. gas 1.6 -1.3 -0.6 -1.0 0.2 -1.3 3.4 -1.3 -1.3 -1.3
Coal/coke -0.3 -2.0 -2.0 -2.0 -2.0 -2.0 -2.0 -2.0 -2.0 -2.0
Electricity 4.0 0.2 0.2 6.4 20.4 1.3 2.0 1.2 2.3 0.2
Table 2. Difference Between Current Tax (2012) and Proposed Minima (for 2018)(€/GJ)
country
17
Figure 1. CO2 Emissions from ETD and ETS Fuels, 2012
Source. See Appendix B. Note. Non-ETS fuels include on-road motor fuels, off-road motor fuels, and heating fuels.
0 200 400 600 800 1,000
gasoline
diesel
LPG
natural gas
diesel
kerosene
LPG
natural gas
diesel
kerosene
LPG
natural gas
coal and coke
Coal
Natural Gas
Diesel
Kerosene
LPG
EU CO2 emissions, million tonnes
heating fuels
on-road motor fuels
off-road motor fuels
ETS fuels
18
Figure 2. Excise Duty on Motor Fuels in Selected EU Countries, 1980-2015
19
Figure 3. Corrective Gasoline Tax Estimates and Current Taxes, EU Countries, 2012
Source. Parry et al. (2014) for corrective tax estimates (updated for inflation) and see below for current taxes. Notes. Local pollution damages for Luxemburg and Malta are not available from the data.
0.00 0.30 0.60 0.90
AustriaBelgiumBulgariaCroatiaCyrpus
Czech RepublicDenmark
EstoniaFinlandFrance
GermanyGreece
HungaryIreland
ItalyLatvia
LithuaniaLuxembourg
MaltaNetherlands
PolandPortugalRomaniaSlovakiaSlovenia
SpainSweden
United Kingdom
tax, EUR/liter
local pollution congestion accident carbon current tax min. tax (existing and proposed)
20
Figure 4. Corrective Diesel Tax Estimates and Current Taxes, EU Countries, 2012
Source. Parry et al. (2014) for corrective tax estimates (updated for inflation) and see below for current taxes. Notes. Local pollution damages for Luxemburg and Malta are not available from the data.
0.00 0.30 0.60 0.90
AustriaBelgiumBulgariaCroatiaCyrpus
Czech RepublicDenmark
EstoniaFinlandFrance
GermanyGreece
HungaryIreland
ItalyLatvia
LithuaniaLuxembourg
MaltaNetherlands
PolandPortugalRomaniaSlovakiaSlovenia
SpainSweden
United Kingdom
tax, EUR/literlocal pollution congestion accidentcarbon road damage current tax
21
Figure 5. Corrective Natural Gas Tax Estimates and Current Taxes, EU Countries, 2012
Source. Parry et al. (2014) for corrective tax estimates (updated for inflation) and see below for current taxes. Notes. Local air pollution is estimated for ground-level sources (e.g., households), though estimates for power plant emissions are similar. Local pollution damages for Luxemburg and Malta are not available from the data.
0 1 2 3 4 5 6 7 8 9
AustriaBelgiumBulgariaCroatiaCyrpus
Czech RepublicDenmark
EstoniaFinlandFrance
GermanyGreece
HungaryIreland
ItalyLatvia
LithuaniaLuxembourg
MaltaNetherlands
PolandPortugalRomaniaSlovakiaSlovenia
SpainSweden
United Kingdom
tax, EUR/GJ
local pollution carbon min. tax existing min. tax proposed current tax
22
Figure 6. Corrective Coal Tax Estimates and Current Taxes, EU Countries, 2012
Source. Parry et al. (2014) for corrective tax estimates (updated for inflation) and the coal tax is inferred from an ETS CO2 price of €8 per ton. Notes. Local air pollution damages are for power plant emissions. Estimates are not available for Estonia, Lithuania, and Luxemburg. Cyprus and Malta do not use coal.
0 10 20 30 40 50 60 70
AustriaBelgiumBulgariaCroatia
Czech RepublicDenmark
EstoniaFinlandFrance
GermanyGreece
HungaryIreland
ItalyLatvia
LithuaniaLuxembourgNetherlands
PolandPortugalRomaniaSlovakiaSlovenia
SpainSweden
United Kingdom
tax, EUR/GJ
local pollution carbon current tax
23
Figure 7. EU-Wide CO2 Impacts of Tax Reforms, 2012
Source. Authors’ calculations (see Appendix B).
0 1 2 3 4 5 6
Proposed ETD
Proposed ETD--2 speed
CO2 charge on ETS fuels
CO2 charge on ETS fuels--2 speed
Coal tax
Coal tax--2 speed
Higher motor fuel taxes
Higher motor fuel taxes--2 speed
percent reduction in EU CO2 emissions
Motor fuels Other non-ETS fuels ETS fuels
24
Figure 8. EU-Wide Revenue Impacts of Tax Reforms, 2012
Source. Authors’ calculations (see Appendix B).
0.0 0.2 0.4 0.6
Proposed ETD
Proposed ETD--2 speed
CO2 charge on ETS fuels
CO2 charge on ETS fuels--2 speed
Coal tax
Coal tax--2 speed
Higher motor fuel taxes
Higher motor fuel taxes--2 speed
revenue gain, % of EU GDP
Motor fuels Other non-ETS fuels ETS fuels

25
Figure 9. EU-Wide Health Impacts of Tax Reforms, 2012
Source. Authors’ calculations (see Appendix B).
0 2 4 6
Proposed ETD
Proposed ETD--2 speed
CO2 charge on ETS fuels
CO2 charge on ETS fuels--2 speed
Coal tax
Coal tax--2 speed
Higher motor fuel taxes
Higher motor fuel taxes--2 speed
percent reduction in EU premature deaths
Motor fuels Other non-ETS fuels ETS fuels
26
Figure 10. EU-Wide Economic Welfare Gains, 2012
Source. Authors’ calculations (see Appendix B).
0.0 0.1 0.2
Proposed ETD
Proposed ETD--2 speed
CO2 charge on ETS fuels
CO2 charge on ETS fuels--2 speed
Coal tax
Coal tax--2 speed
Higher motor fuel taxes
Higher motor fuel taxes--2 speed
economic welfare gain, % of GDP
Motor fuels Other non-ETS fuels ETS fuels
27
Appendix A: Methodology Underlying Environmental Damage Estimates This Appendix discusses the valuation of air pollution damages from stationary sources, and externalities from motor vehicles, developed in Parry et al. (2014) and used above to infer efficient fuel taxes (external costs are updated from 2010 to 2012 using the EU consumer price index). Air Pollution from Coal and Natural Gas. The key air pollutant from a public health perspective is fine particulate matter (PM2.5, with diameter up to 2.5 micrometers), which is small enough to penetrate the lungs and bloodstream. PM2.5 can be emitted directly during fuel combustion, or formed indirectly through chemical reactions in the atmosphere involving sulfur dioxide (SO2) and nitrogen oxides (NOx). Parry et al. (2014) assess damages from these pollutants for coal plants by first estimating ‘intake fractions’—the fraction of these emissions that are inhaled by exposed populations as PM2.5. They begin with estimates (Zhou et al. 2006) of these fractions for the average coal plant in China, where these estimates account for exposure to people living up to 2,000 km from plants. Intake fractions are then extrapolated to other countries depending on the number of people living at different distance classifications from the average coal plant in that country relative to number of people living in those distance classifications in China. This is done by mapping data on the geographical location of coal plants in individual countries to very granular, spatial population data. Intake fractions are then linked to mortality risks. Baseline mortality rates for diseases (e.g., lung cancer, heart disease, strokes) whose prevalence is potentially increased by pollution exposure are obtained for different countries from the World Health Organization (WHO)’s Global Burden of Disease (GBD) project. These baseline mortality rates are then related to evidence (again from GBD) on how the relative risk for each disease increases with the rate at which pollution is inhaled, to give health impacts per ton of emissions for the three air pollutants. Health risks are then monetized using evidence from several hundred studies, compiled by OECD (2012), on how people in different countries are willing to give up income to reduce these risks. They find that each one percent increase in per capita income raises people’s willingness to pay for health risk reductions by 0.8 percent and that, for the average OECD country, peoples’ valuation of health risks implies a benefit of $3.7 million per premature death avoided. Parry et al. (2014) extrapolate this evidence to obtain health valuations at the individual country level. Finally, environmental damages can be expressed per gigajoule (GJ) of coal energy using country-level estimates of emissions rates per GJ—that is, the damage per GJ is the emission rate per GJ, times the damage per ton of emissions, summed over the three pollutants.
28
Parry et al. (2014) used the same approach to estimate air pollution damages per GJ of natural gas from power plants, though these damages are far more moderate as gas produces essentially no direct PM2.5 and SO2, and is also less NOx intensive than coal. Air pollution damages for gas used in residences and industry were estimated in the same way as for motor fuels (see below) but, since the estimates are similar to those for gas power plants, the latter are used for all natural gas usage. Vehicle Externalities. Air emissions from motor fuel combustion are released close to the ground and tend to remain locally concentrated rather than being dispersed over large distances. For these fuels, Parry et al. (2014) extrapolate national average intake fractions for emissions in different countries from a large city-level database. Mortality effects and monetary damages are then inferred using the same procedures as above, and damages are expressed per liter of fuel use, based on country-level vehicle emission rates. For the congestion component of corrective motor fuel taxes, Parry et al. (2014) start with average travel delay—the difference between time taken to drive a kilometer at prevailing speeds and the time that would be taken at free-flow speeds—extrapolated to each country from a database containing 90 cities in different countries. Statistical regressions were used to relate travel delays to various transportation indicators at the city level, and then country level delays were predicted using the regression coefficients and country-level data for the same transportation indicators. Marginal delay (the delay one vehicle imposes on other vehicles) is taken to be four times the average delay, based on specifications that are commonly used by transportation engineers. Marginal delays are converted into passenger delays by scaling by car occupancy and are then expressed in monetary costs using the value of travel time which, based on reviews of empirical literature, is taken to be 60 percent of the market wage. Finally, marginal congestion costs are scaled back by a third, based on evidence suggesting that travel on congested roads (which is dominated by commuting) is less responsive to higher fuel prices than travel on uncongested roads. As discussed in Parry et al. (2014), Ch. 5, there are a number of reasons why their overall approach might result in an understatement of congestion costs. Parry et al. (2014) assess accident externalities by first breaking out country-level data on traffic fatalities into those assumed to reflect external risks (not considered by drivers), including pedestrian/cyclist fatalities and a fraction of fatalities to other vehicle occupants in multi-vehicle collisions, as opposed to risks that drivers take into account, including the risk of divers killing themselves in single- and multi-vehicle collisions. Fatality risks are monetized using the same mortality values as used for pollution deaths. Other external costs (e.g., non-fatal injuries to pedestrians/cyclists and other vehicle occupants, medical/property damages borne by third parties) are extrapolated to other countries from a limited number of country case studies.
29
Lastly, Parry et al. (2014) measure the external costs of road damage by countries’ spending on road maintenance, scaled back by 50 percent to make an adjustment for the role of weather in road deterioration. Combined external costs from motor fuel use are summarized by corrective fuel taxes. For gasoline, corrective taxes are based on externalities from cars, and for diesel, on a weighted average of externalities from (diesel) cars and heavy vehicles with weights equal to the respective fuel shares of these vehicles. In computing corrective taxes, congestion, accident, and road damage externalities are scaled back to take into account the fact that only about half of the tax-induced reduction in fuel use comes from reductions in vehicle kilometers driven (the other fraction comes from longer-run improvements in the average fuel efficiency of the vehicle fleet which does not reduce these externalities). Appendix B: Methodology and Data Sources for Assessing ETD Reform Possibilities The modeling results discussed above are based on a spreadsheet tool populated, for the 28 EU member countries, with the following data: • consumption of major fuel categories under the ETD and the ETS; • prices for these fuels; • fuel excises taxes; • minimum tax rates under the current ETD and various scenarios for tax reform; • CO2 emission rates; • premature deaths from air pollution attributed to different fuels; • efficient fuel taxes to reflect environmental damages; • fuel price elasticities; and • miscellaneous data—GDP and exchange rates. The spreadsheet calculates the change in tax for a particular fuel, in a particular country, implied by various reforms (see below). Any tax increases are assumed to be fully passed forward into higher prices for fuel users. In turn, fuel demand is reduced in response to higher prices according to fuel price elasticities, implying changes in CO2 emissions, tax revenues, air pollution deaths, and economic welfare. These responses are meant to capture changes in fuel use after full adjustment—short run dynamics (e.g., as the vehicle fleet turns over gradually in response to higher fuel prices) are beyond our scope, partly as they would require a far more complicated model. Cross-price effects (e.g., substitution from diesel to gasoline vehicles if tax reforms raise the price of diesel relative to gasoline) are also ignored, again because they would add considerable complexity, without affecting the general flavor of the results. The spreadsheet uses data from year 2012 (the latest for which data is available) and therefore looks at what would have happened had different tax scenarios been in place in that year (after full adjustment to those taxes). This avoids the need to make projections about
30
future data inputs. All monetary figures are expressed in €s (converted, where needed, at market exchange rates in 2012). Changes in fuel tax rates in different countries in response to changes in tax minima are obtained by splitting the difference (based on discussion in the main text) between two bounding cases. In the lower bound case, taxes increase in line with increases in tax minima for countries/fuel products for which tax floors are currently, or become, binding (in cases where tax floors remain non-binding there is no change in the domestic fuel tax rate). In the upper bound case, the tax on a fuel in each country increases by the same absolute amount as any absolute increase in the tax floor. More details on the data sources and computations are provided below. Fuel consumption. The model distinguishes, for each EU country, 11 fuel use categories. Outside of the ETS, there are three motor fuels—on-road gasoline, on-road diesel, and off-road diesel—and three heating fuels—diesel, natural gas, and coal/coke. And within the ETS sector there are five primary fuels—coal, natural gas, diesel, kerosene, and LPG. Six primary fuels were excluded from the calculations—various motor fuels (on-road LPG and natural gas, off-road kerosene, LPG, and natural gas) and LPG for heating—because the quantities are very small, for example, all these fuels in aggregate account for 1.7 percent of EU wide CO2 emissions. Changes in electricity consumption are not explicitly tracked, given no change in the proposed tax floor for electricity. All fuel consumption is taken from the International Energy Agency (IEA) website and expressed in terra-joules (TJ). Fuel prices. Fuel use is related to the fuel user prices, given by pre-tax prices plus excises.24 The pre-tax prices are mostly obtained from OECD (2014). In a few cases where data is unavailable (typically Bulgaria, Croatia, Cyprus, Latvia, Lithuania, Romania, and a greater number of countries for coal) a simple average of other EU prices is assumed. For the ETS fuels, prices for diesel, kerosene and LPG are not available—the first two were proxied by diesel prices for heating and the last by natural gas prices for heating. Prices are expressed in € per giga-joule (GJ). Fuel excises. These are taken from OECD (2014), converted into €/GJ. In cases where data is not available, given that missing data is mostly for new EU members with relatively low rates, taxes are set equal to the lowest rate in other countries where data is available, or (for ETS fuels) assumed to be zero in cases where excises are uncommon.
24 For simplicity VAT is excluded. Alternatively, this could be included for fuels consumed by households, with the excises also scaled by VAT rates, though the proportionate changes in fuel prices would be the same as calculated here.
31
ETD tax rates and reform scenarios. Data sources for these tax rates are noted in the main text. CO2 emission rates. For primary fuels, these were taken from Parry et al. (2014), based on factors calculated by the Institute for Applied Systems Analysis. Emissions factors are taken to be the same for a particular fuel product, regardless of its use (for a particular primary fuel product, there is essentially no variation in emission rates across countries). CO2 emission rates for electricity by country (assumed the same for residential and industrial uses) are taken from IEA (2015). Air pollution deaths. These are taken from country-level estimates of deaths per unit of fuel use (which are the air pollution damages per unit of fuel use described in Appendix A divided by the value per fatality). Efficient fuel taxes. These are estimates of fuel taxes needed to reflect CO2, local air pollution and, in the case of road fuels, traffic congestion, accidents, and road damage (see Appendix A). Fuel price elasticities. Fuel price elasticities are taken to be constant (rather than changing in response to changes in fuel prices) which is a standard assumption. Based broadly on the empirical literature25 price elasticities (for all countries) for road and heating fuels are taken to be -0.5, while elasticities for fuels covered by the ETS (most importantly power generation fuels) are taken to be -0.25. Plausible alternative assumptions affect the results only modestly. Miscellaneous data. GDP and market exchange rates for 2012 are from IMF (2015). Computing environmental, fiscal, and economic impacts. CO2 emissions are simply use of fuel in a particular country times the fuel’s CO2 emissions factor, and aggregated over fuel products and countries. CO2 emissions are re-computed in response to reductions in fuel use caused by different tax reforms and compared with the initial amount. Revenue impacts are calculated in essentially the same way, except that fuel use is multiplied by the excise on a particular product. Reductions in revenues from pre-existing taxes, due to the erosion of the fuel tax base in response to new policies, are therefore taken into account. Revenue implications of changes in VAT receipts are not included in these calculations. Similarly, premature deaths are just deaths per unit of fuel product from Parry et al. (2014) (and taken as constant), times fuel consumption, and aggregated over fuel products and countries. Again, health impacts are re-computed at the new distribution of fuel use in response to policy reform and compared with the initial number of deaths.
25 See the summary in Parry et al. (2015).

32
Economic welfare impacts are calculated by integrating the difference between the efficient fuel tax and the prevailing fuel tax over the reduction in fuel use induced by the tax change, and then aggregating over fuels and countries.
33
References De Borger, Bruno and Stef Proost, 2014. “Tax and Regulatory Policies for European Transport—Getting There, but in the Slow Lane.” Paper presented at a conference Energy Tax and Regulatory Policy in Europe: Reform Priorities and Research Needs, CESIfo, Munich, November. Brandt, J., Silver, J. D., Gross, A. and Christensen, J.H., 2010. Marginal Damage Cost per unit of Air Pollution Emissions. Roskilde: National Environmental Research Institute. 23 p. Specific agreement 3555/ B2010/EEA.54131 implementing framework contract ref. no. EEA/IEA/09/002. Brink, C., H.R.J. Vollebergh and E. van der Werf, 2015. “Carbon Pricing in the EU: Evaluation of Different EU ETS Reform Options.” CESifo Working Paper, 5633, Munich. EC, 2011a. Proposal for a Council Directive Amending Directive 2003/96/EC restructuring the Community Framework for the Taxation of Energy Products and Electricity. European Commission, Brussels, Belgium. EC, 2011b. Smarter Energy Taxation for the EU. European Commission, Brussels, Belgium. Evers, Michiel, Ruud A. de Mooij, and Herman R.J. Vollebergh, 2004. “Tax Competition under Minimum Rates: The Case of European Diesel Taxes.” CESifo Working Paper Series 1221, CESifo Group Munich. EXIOPOL, 2011. A New Environmental Accounting Framework Using externality Data and Input-Output Tools for Policy Analysis. EU funded research project. www.feem-project.net/exiopol/index.php. Hepburn, Cameron and Alexander Teytelboym, 2014. “Reforming the EU ETS – Where are we now?” Paper presented at a conference Energy Tax and Regulatory Policy in Europe: Reform Priorities and Research Needs, CESIfo, Munich, November. Hogg, Dominic, Mikael Skou Anderson, Tim Elliott, Chris Sherrington, Thomas Vergunst, Sarah Ettlinger, Laurence Elliott, and Joe Hudson, 2014. Study on Environmental Fiscal Reform Potential in 12 EU Member States. Final Report to DG Environment of the European Commission. IEA 2015. World Energy Statistics and Balances. International Energy Agency, Paris, France. IMF 2015. World Economic Outlook Database. International Monetary Fund, Washington, DC. Available at: www.imf.org/external/pubs/ft/weo/2015/02/weodata/index.aspx.
34
Kanbur, Ravi and Michael Keen, 1993. “Jeux Sans Frontieres: Tax Competition and Tax Coordination when Countries Differ in Size.” American Economic Review 83, 877-892. Kosonen K and Nicodème G.. 2009, The role of fiscal instruments in environmental policy. CES IFO Working Paper, 2719, Munich. Löschel, Andreas and Oliver Schenker, 2014. “On the Coherence of Economic Instruments: Climate, Renewables and Energy Efficiency Policies.” Paper presented at a conference Energy Tax and Regulatory Policy in Europe: Reform Priorities and Research Needs, CESIfo, Munich, November. Maibach M., Schreyer, C., Sutter, D., van Essen, H.P., Boon, B. H., Smokers, R., Schroten, A., Doll, C., Pawlowska, B., Bak, M., 2008. Handbook on Estimation of External Costs in the Transport Sector, produced within the study Internalization Measures and Policies for All External Cost of Transport (IMPACT), Version 1.1, Delft, CE, commissioned by European Commission DG TREN. Meerkerk, J. van, G. Renes & G. Ridder (2014), Greening the Dutch car fleet: the role of differentiated sales taxes, PBL Working Paper 18, Den Haag. NEEDS, 2011. New Energy Externalities Development for Sustainability. EU-funded research project. Available at: www.needs-project.org. Nordhaus, William D., 2013. The Climate Casino: Risk, Uncertainty, and Economics for a Warming World. New Haven, Connecticut: Yale University Press. OECD, 2012. Mortality Risk Valuation in Environment, Health and Transport Policies. Organization for Economic Cooperation and Development, Paris, France. OECD, 2014. Energy Prices and Taxes, 4th Quarter 2014. Organization for Economic Cooperation and Development, Paris, France. Parry, Ian, W.H., 2011. “How Much Should Highway Fuels Be Taxed?” In Gilbert E. Metcalf (ed.), U.S. Energy Tax Policy, Cambridge University Press, 269-297. Parry, Ian W.H., Dirk Heine, Shanjun Li, and Eliza Lis, 2014. Getting Energy Prices Right: From Principle to Practice. International Monetary Fund, Washington, DC. Parry, Ian, Chandara Veung and Dirk Heine, 2015. “How Much Carbon Pricing is in Countries Own Interests? The Critical Role of Co-Benefits.” Climate Change Economics, forthcoming.
35
Smith, S. and H.R.J. Vollebergh 1993, “The European Carbon Excise Proposal: a `Green' Tax Takes Shape”, EC Tax Review, nr.4, 1993, 207-221 US IAWG, 2013, Technical Update of the Social Cost of Carbon for Regulatory Impact Analysis under Executive Order 12866. United States Inter-Agency Working Group, Washington, DC. Van der Ploeg, Frederick and Aart De Zeeuw, 2015. “Climate Tipping and Economic Growth: Precautionary Capital and the Price of Carbon.” Paper presented at the 2015 NBER Summer Institute (Environmental & Energy Economics), Cambridge, MA. Vollebergh, H.R.J. “Environmental Externalities and Social Optimality in Biomass Markets: Waste-to-Energy in the Netherlands and Biofuels in France”, Energy Policy, 25, 6, 1997, 605-621 Vollebergh, H.R.J., E. Drissen, H. Eerens and G. Geilenkirchen (2014), Milieubelastingen en Groene Groei Deel II: Evaluatie van belastingen op energie in Nederland vanuit milieuperspectief, PBL Achtergrondstudies, 500229002, Bilthoven. West, Sarah and Roberton C. Williams, 2007. “Optimal Taxation and Cross-Price Effects on Labor Supply: Estimates of the Optimal Gas Tax.” Journal of Public Economics 91: 593-617. WHO, 2014. Public Health, Environmental and Social Determinants of Health. World Health Organization, available at: www.who.int/phe/health_topics/outdoorair/databases/en/. Zhou, Ying, Jonathan I. Levy, John S. Evans, and James K. Hammitt, 2006. “The Influence of Geographic Location on Population Exposure to Emissions from Power Plants throughout China.” Environment International 32: 365–73.