the effect of soil water content during land preparation on aspects of soil physical condition and...
TRANSCRIPT
Soil'& Tillage Research, 9 (1987) 287-302 Elsevier Science Publishers B.V., Amsterdam - - Printed in The Netherlands
287
The Effect of Soil Water Content Dur ing Land Preparat ion on Aspects of Soil Phys ica l Condit ion and Cotton Growth
D. McGARRY
CSIRO, Division of Soils, Cunningham Laboratory, 306, Carmody Road, St. Lucia, Qld. 4067 (Australia)
(Accepted for publication 13 November 1986)
ABSTRACT
McGarry, D., 1987. The effect of soil water content during land preparation on aspects of soil physical condition and cotton growth. Soil Tillage Res., 9: 287-302.
In a field experiment on cracking clay soil, the effects of soil water content during pre-sowing land preparation and intensity of cultivations during the growing season on soil physical condi- tions and growth of a furrow-irrigated cotton crop were investigated. Before sowing, cultivations typical of local practice were imposed on soil in a 'dry', 'moist' and 'wet' state, representing three main treatments. During the season, three intensities of inter-row cultivation were superimposed on each of the three main treatments.
Soil physical conditions and cotton plant growth were influenced by soil water content during pre-sowing land preparation, but not by subsequent inter-row cultivations. In soil prepared 'dry', after the first irrigation significantly more water was extracted by the crop than from either of the other two treatments. The morphology of the post-season soil profile of the land prepared 'dry' differed little from the unirrigated and uncultivated pre-season profile, whereas that of the land prepared 'wet' had altered considerably, being generally massive to a depth of 0.65 m. Cotton in the land prepared 'dry' grew tallest and had most green bolls of any main treatment on most weeks during the season. For most of the season, land prepared 'dry' or 'moist' had similar above-ground plant dry matter, both having greater amounts than the 'wet' treatment. Plant population per metre of row was equal in the 'dry' and 'moist' treatments, and lower in the 'wet'. Yield differences were not recorded between treatments as there was high insect damage in the 'dry' treatment.
INTRODUCTION
Investigation of the impact of irrigated crop production on the physical con- dition of cracking clay soil in the Namoi Valley, northwestern New South Wales began in 1979. This followed reports by local cotton growers of visible changes in the structure of the upper subsoil which they related to an overall decline in yield. A preliminary investigation of changes in soil physical condition in corn-
0167-1987/87/$03.50 © 1987 Elsevier Science Publishers B.V.
288
mercial cotton fields was completed, but shed little light on the cause of dete- riorated conditions { McGarry and Chan, 1984 ). Subsequent inspection of soil pits on farms with more detailed management records provided visual evidence for associating massive upper subsoil s tructure with previous cultivation under wet soil conditions.
Investigation of soil s tructural degradation is generally of two types: labo- ratory studies in which soil samples are compacted artificially over a range of water contents (for example, Meredi th and Patrick, 1961); and field investi- gations in which ei ther cultivation intensity or the soil water content at which cultivation is performed is varied (for example, Raghavan and McKyes, 1978; Paul and de Vries, 1979). Although the former allows control over a variety of conditions, field studies are more readily t ransla ted into agricultural causes and effects.
This paper presents data from a field experiment, the prime objective of which was to examine the response of selected soil and crop measures to pre- sowing land preparat ion over a range of soil water profiles. A previously dry- land site was chosen to act as a baseline against which change could be meas- ured, and the selected range of soil water profiles at the time of land preparation was typical of those facing growers in different years. A secondary objective was the assessment of different intensities of inter-row cultivation during the growing season.
MATERIAL AND METHODS
The site chosen was field C2 on the Agricultural Research Station, Narrabri ( 30 ° 11' S, 149 ° 38 'E) . Although the site had been cultivated in the past, it had not been irrigated for at least 8 years, during which time it had been under a fallow and dryland wheat rotation, with little cultivation or soil disturbance. The soil was a dark, moderate ly self-mulching, seasonally cracking, uniformly textured, clay - classed as Ug5.25 by Northcote (1979) and as a fine, thermic, montmoril lonit ic typic Pellustert (U.S.D.A., 1975). Before the cultivation or irrigation imposed in this experiment, examinat ion of two profiles in the exper- imental area demonst ra ted tha t profile morphology exemplified 'natural ' soil structure as previously seen in uncult ivated and uni r r iga ted clay soils near Narrabri, with 0.05-0.2 m of crumb-st ructured top soil underlain by soil with lenticular peds with smooth or polished faces to at least 1.5 m. Fur ther infor- mation on the site has been recorded elsewhere (McGarry et al., 1982). Par- ticle size and chemical data were relatively uniform across the site. Clay content to 1 m averaged 63 % ( S.D. -- 2 ) ; pH (1:5 soil water extract) ranged from 7.4-8.0 at the surface and 8.2-8.8 at 0.5 m; cation exchange capacity to 1 m averaged 45 m.e.q./100 g ( S.D. = 4 ), varying little with depth; exchangeable sodium per- centages were on the whole low, averaging 1.6 in the surface 0.1 m and 8.4 in
289
BLOCK 3
i/ i .... I_o C A B
~ 4 4 m ~
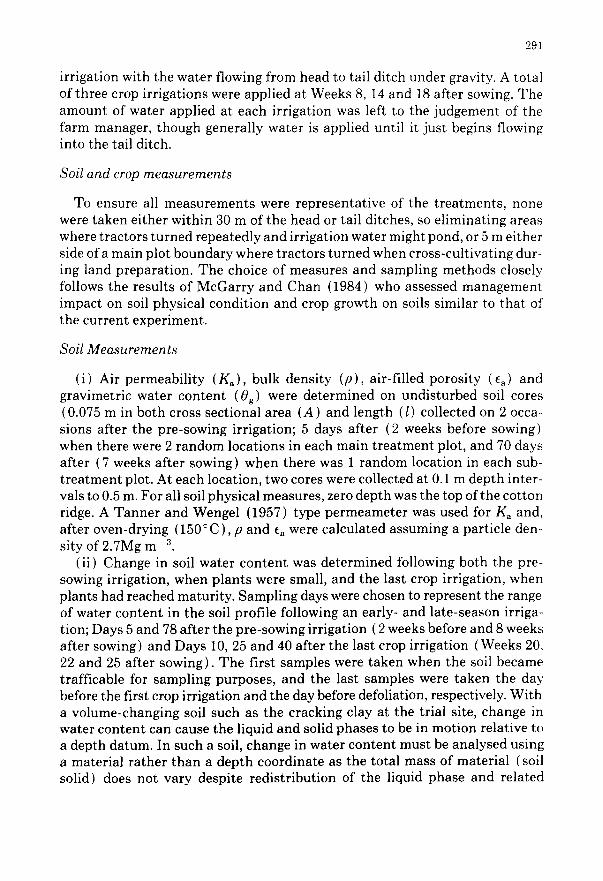
KEY T O W A T E R PROFILE DURING LAND PREPARATION A 'dry'
B 'moist '
C 'wet'
BLOCK 2 BLOCK 1
B C A B A C
KEY TO INTER-ROW CULTIVATION INTENSITIES + 'double '
o 'normal' - ' z e r o '
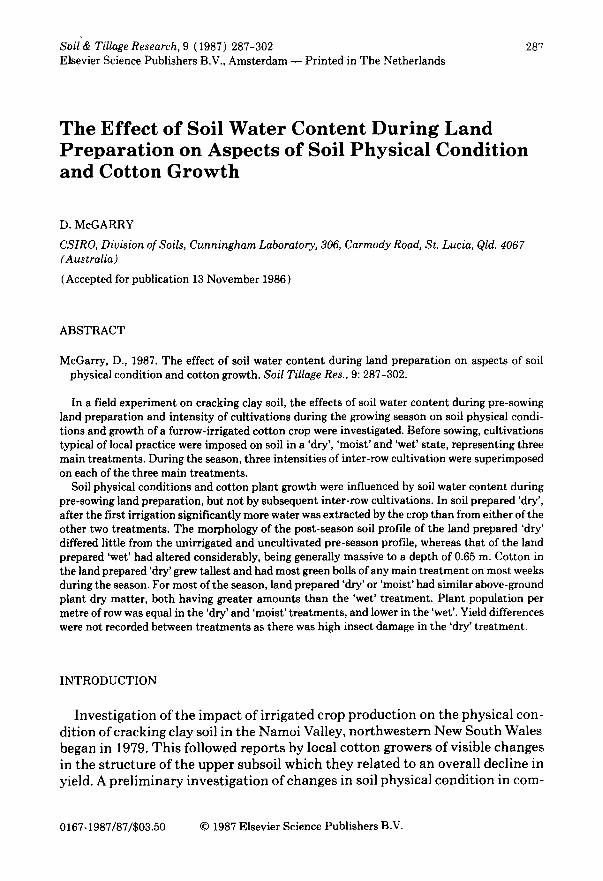
Fig. 1. Experimental design indicating plot locations of water profiles at time of land preparations, and during season inter-row cultivation intensity.
the subsoil (1 m); Ca /Mg ratios were generally high, on average 2.2 in the top 0.4 m.
Experimental design and treatments
The cultivation trial was in the form of a 3 × 3 × 3 split-plot randomised block design, as shown in Fig. 1.
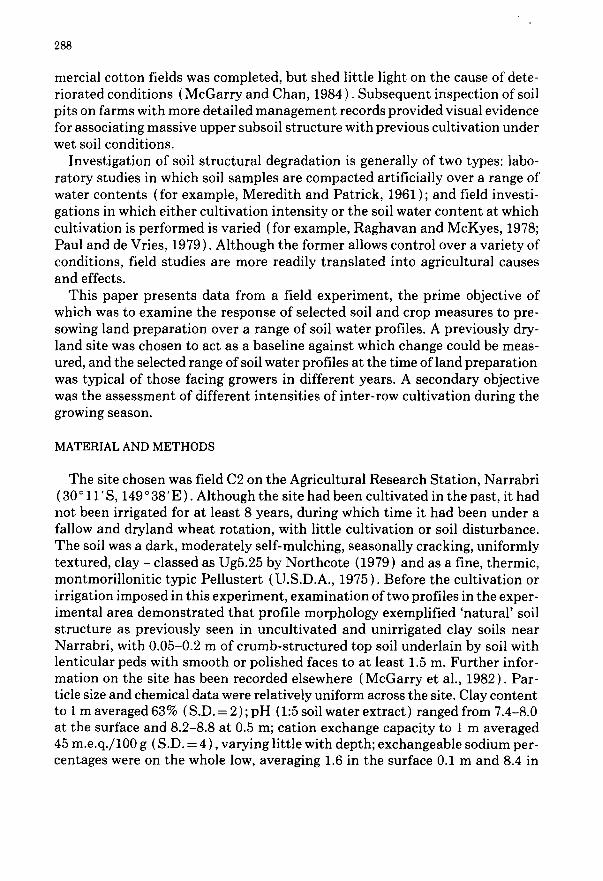
The three main treatments were soil water profiles at t ime of pre-sowing land preparation (Fig. 2 ). The water profiles were effected as follows: Treat- ment A consisted of removing the stubble of a dryland wheat crop which had
0
0.1
0.2
0.3
0.4
0.5
A 0.6 E 0.7
.c Q. 0.8
0.9
1.0
I t
1.2
1 3
~ 4
1.5
O g ( kg k g 1) 01 0.2 0.3 0.4
t l
,re ,men, t?
i I - - - - - - C . / - /
. / I / I
/ /
/ /
/ f
/ /
/
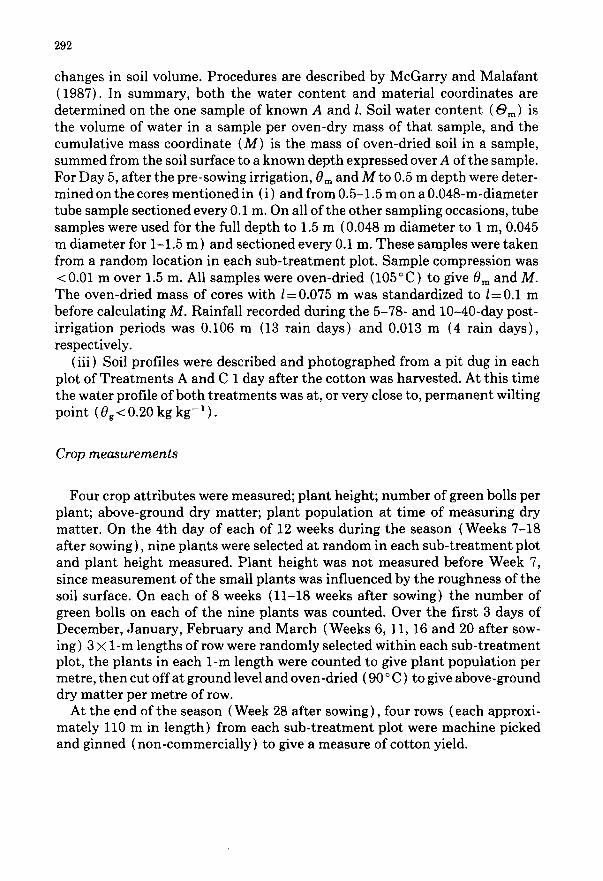
Fig. 2. Soil water content (0g) vs. depth profiles of each of the three pre-season land preparation treatments.
290
matured in a dry summer (1979-80) one day after harvesting; in Treatment B, water was run down irrigation furrows until the water reached the tail-ditch when the water input was stopped; in Treatment C, a low earth wall was built around each mainplot and each was ponded with water to an average depth of 20 cm, until the fall in water level was zero over a 3-h period. After wetting, Treatments B and C were given time to equilibrate, and in the case of Treat- ment C, for surface soil conditions to become trafficable. Intermittent rainfall after initial wetting caused this time period to be 105 days for Treatment B and 48 days for Treatment C. As a result, land preparation on each treatment began at different times: Treatments A and C 1 day apart, but Treatment B 56 days later. The profiles were sampled 1 day before commencing land prepara- tion, and the water profiles varied little during the 6-7 days required for land preparation on any one treatment as there were neither plants to transpire nor rainfall to add soil water. The soil water profiles so obtained (Fig. 2) were typical of the range found in local clay soils and which local cotton growers cultivate in different years; Treatment A resembled the 'permanent wilting point' profile, and Treatment C the 'after winter fallow' profile sampled by Chan and Hodgson (1981) on the same research station. The water profile of Treatment B represented the mid-range of A and C to approximately 0.35 m.
The land preparation for each main treatment was identical, and followed the local procedure with respect to the type of implements and their methods and sequence of usage: scarify with diamond harrows (one way), land plane (three ways), chisel plough {two ways), disc (two ways) and scarify (two ways) all pulled by wheeled tractors. All tractors operated '4-row set up', i.e. four rows of cotton hills (or 4-m width ) were cultivated in one pass. The deep- est cultivating implement (chisels) penetrated, on average, 0.35 m. The prep- aration was carried out during the 2-month period before sowing.
The three sub-treatments were: (1) 'zero' inter-row cultivation (only man- ual weed-chipping); (2) 'normal ' inter-row cultivation (three occasions, one tractor and implement pass each time) ; (3) 'double' cultivation (three occa- sions, two tractor and implement passes each time). On sub-treatments (2) and (3), the same implement (sled gear with knives) was used on all occa- sions. The three occasions were: twice after the pre-sowing irrigation (Weeks 5 and 7 after sowing), and once after the first crop irrigation (Week 12 after sowing). Each time, the surface soil was dry. Each subtreatment plot was 10-12 m across.
After the pre-sowing land preparation, the trial was managed as a normal, uniform field of cotton. Anhydrous ammonia at 80 kg ha - 1 was incorporated at the time of building-up the cotton hills, the pre-sowing irrigation took place 21 days before sowing, and the trial was sown with Deltapine 61 (a variety used for commercial production) on the 20 October 1980. During the season, all treatments were irrigated, sprayed with insecticide or cultivated on the same days. The irrigation system used was typical of valley practice, being furrow
291
irrigation with the water flowing from head to tail ditch under gravity. A total of three crop irrigations were applied at Weeks 8, 14 and 18 after sowing. The amount of water applied at each irrigation was left to the judgement of the farm manager, though generally water is applied until it just begins flowing into the tail ditch.
Soil and crop measurements
To ensure all measurements were representative of the t reatments , none were taken either within 30 m of the head or tail ditches, so eliminating areas where tractors turned repeatedly and irrigation water might pond, or 5 m either side of a main plot boundary where tractors turned when cross-cultivating dur- ing land preparation. The choice of measures and sampling methods closely follows the results of McGarry and Chan {1984) who assessed management impact on soil physical condition and crop growth on soils similar to that of the current experiment.
Soil Measurements
(i) Air permeabili ty (Ka), bulk density (p), air-filled porosity (~a) and gravimetric water content (0g) were determined on undisturbed soil cores (0.075 m in both cross sectional area (A) and length (1) collected on 2 occa- sions after the pre-sowing irrigation; 5 days after (2 weeks before sowing) when there were 2 random locations in each main t rea tment plot, and 70 days after (7 weeks after sowing) when there was 1 random location in each sub- t r ea tment plot. At each location, two cores were collected at 0.1 m depth inter- vals to 0.5 m. For all soil physical measures, zero depth was the top of the cotton ridge. A Tanner and Wengel (1957) type permeameter was used for K~ and, after oven-drying (150 °C), p and ea were calculated assuming a particle den- sity of 2.7Mg m -3
(ii) Change in soil water content was determined following both the pre- sowing irrigation, when plants were small, and the last crop irrigation, when plants had reached maturity. Sampling days were chosen to represent the range of water content in the soil profile following an early- and late-season irriga- tion; Days 5 and 78 after the pre-sowing irrigation ( 2 weeks before and 8 weeks after sowing) and Days 10, 25 and 40 after the last crop irrigation (Weeks 20, 22 and 25 after sowing). The first samples were taken when the soil became trafficable for sampling purposes, and the last samples were taken the day before the first crop irrigation and the day before defoliation, respectively. With a volume-changing soil such as the cracking clay at the trial site, change in water content can cause the liquid and solid phases to be in motion relative to a depth datum. In such a soil, change in water content must be analysed using a material ra ther than a depth coordinate as the total mass of material (soil solid) does not vary despite redistribution of the liquid phase and related
292
changes in soil volume. Procedures are described by McGarry and Malafant (1987). In summary, both the water content and material coordinates are determined on the one sample of known A and l. Soil water content (Ore) is the volume of water in a sample per oven-dry mass of that sample, and the cumulative mass coordinate (M) is the mass of oven-dried soil in a sample, summed from the soil surface to a known depth expressed over A of the sample. For Day 5, after the pre-sowing irrigation, 0m and M to 0.5 m depth were deter- mined on the cores mentioned in (i) and from 0.5-1.5 m on a 0.048-m-diameter tube sample sectioned every 0.1 m. On all of the other sampling occasions, tube samples were used for the full depth to 1.5 m (0.048 m diameter to 1 m, 0.045 m diameter for 1-1.5 m) and sectioned every 0.1 m. These samples were taken from a random location in each sub-treatment plot. Sample compression was <0.01 m over 1.5 m. All samples were oven-dried (105°C) to give 0m and M. The oven-dried mass of cores wi th/=0.075 m was standardized to l=O.1 m before calculating M. Rainfall recorded during the 5-78- and 10-40-day post- irrigation periods was 0.106 m (13 rain days) and 0.013 m (4 rain days), respectively.
(iii) Soil profiles were described and photographed from a pit dug in each plot of Treatments A and C I day after the cotton was harvested. At this time the water profile of both treatments was at, or very close to, permanent wilting point ( Og < 0.20 kg kg- 1 ).
Crop measurements
Four crop attributes were measured; plant height; number of green bolls per plant; above-ground dry matter; plant population at time of measuring dry matter. On the 4th day of each of 12 weeks during the season (Weeks 7-18 after sowing), nine plants were selected at random in each sub-treatment plot and plant height measured. Plant height was not measured before Week 7, since measurement of the small plants was influenced by the roughness of the soil surface. On each of 8 weeks (11-18 weeks after sowing) the number of green bolls on each of the nine plants was counted. Over the first 3 days of December, January, February and March (Weeks 6, 11, 16 and 20 after sow- ing) 3 × 1-m lengths of row were randomly selected within each sub-treatment plot, the plants in each 1-m length were counted to give plant population per metre, then cut off at ground level and oven-dried ( 90 ° C ) to give above-ground dry matter per metre of row.
At the end of the season (Week 28 after sowing), four rows (each approxi- mately 110 m in length) from each sub-treatment plot were machine picked and ginned (non-commercially) to give a measure of cotton yield.
293
Statistical analysis
Analysis of variance was done on three soil physical variables ( e, p, K,) for each 0.1-m increment to 0.5 m for each of the 2 sampling days. On Day 5, only main t rea tment effects were tested as no sub- t rea tment cultivations had been done. By Day 70, two inter-row cultivations had been done, so both sub-treat- ment and main t rea tment effects were tested.
Combining the data for both sampling days, lines were fitted to the relation- ships of Og:p to evaluate shrinkage, and Q:K~ ( after McGarry and Chan, 1984 ) for each 0.1-m increment to 0.5 m. For these two relationships, main treatment, effects were tested for each depth with respect to degree of parallelism and identity (y-axis intercept) of the fitted lines. Also, for the combined data, models were fitted to the relationship of 0g:Q for each 0.1-m increment to 0.5 m, and main t rea tment effects evaluated with respect to the est imated 0 k ( with confidence interval) at ~ = 10%, a commonly accepted 'critical' value.
Models were fitted to 0m VS. M on each sampling day after pooling the sam- ples from individual cores ( McGarry and Malafant, 1987 ). Change in soil water between fitted lines for each day (Am) was calculated by integration, and since the integrands were functions of the fitted parameters, it was possible to esti- mate the variance of Am. Following the pre-sowing irrigation, only main treat- ment effects were tested because on Day 5 sub-treatments had not yet been imposed. Following the last crop irrigation, both sub- t reatment and main t rea tment effects were tested.
Analysis of variance for the four crop at tr ibutes and yield was done. Data t ransformations were necessary for number of green bolls and plant population (square root) as the data were discrete, and above-ground dry mat ter (loge) which had large increments between sampling occasions so variance increased in association with the means.
Throughout the paper, the level of significance used is P < 0.05, unless oth- erwise stated.
RESULTS
Soil physical data to 0.5 m
There were no significant differences at any sampling depth in %, p or K~, either between main t rea tments for either sampling day or between sub-treat- ments on Day 70. A comparison of residual and t r ea tment mean squares from the analyses of variance for ~, and p showed overall variability (i.e. the inher- ent variability of the field) to be 4-8 t imes less than the variability between main t reatments . So, the lack of significant main t rea tment effects was not due to large wi th in- t rea tment variability, but to a lack of difference between t rea tment means. No significant differences were found between main treat-
294
ments with respect to degree of parallelism or identity of the fitted lines of either 0g: p, or es: K8 for any sampling depth. This was despite Q, p and K~ being sampled over a wide range of 0g (0.20-0.44 kg kg -1) in the top 0.2 m, and 0.24-0.38 kg kg-1 from 0.2 to 0.5 m). There were no significant differences between main treatments for the estimated 0g at ea = 10%.
Change in soil water
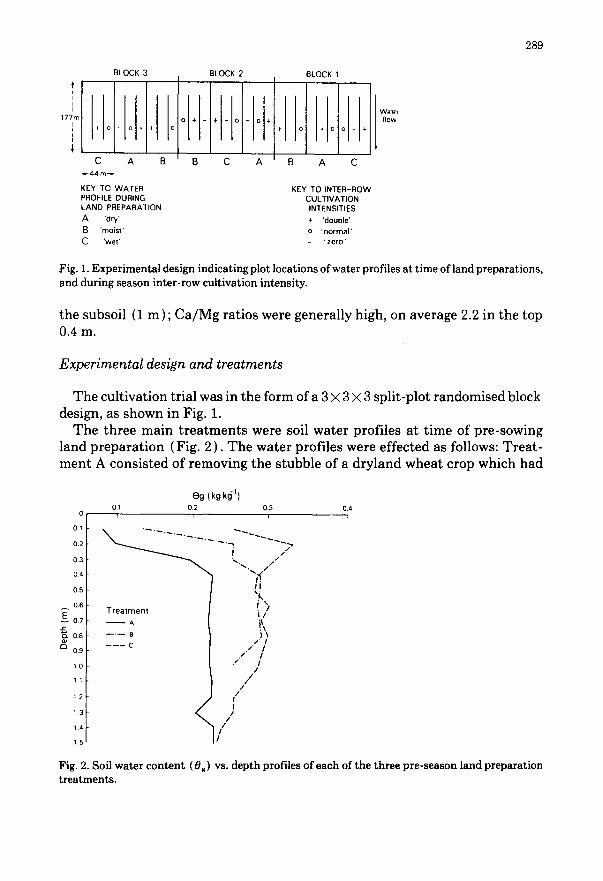
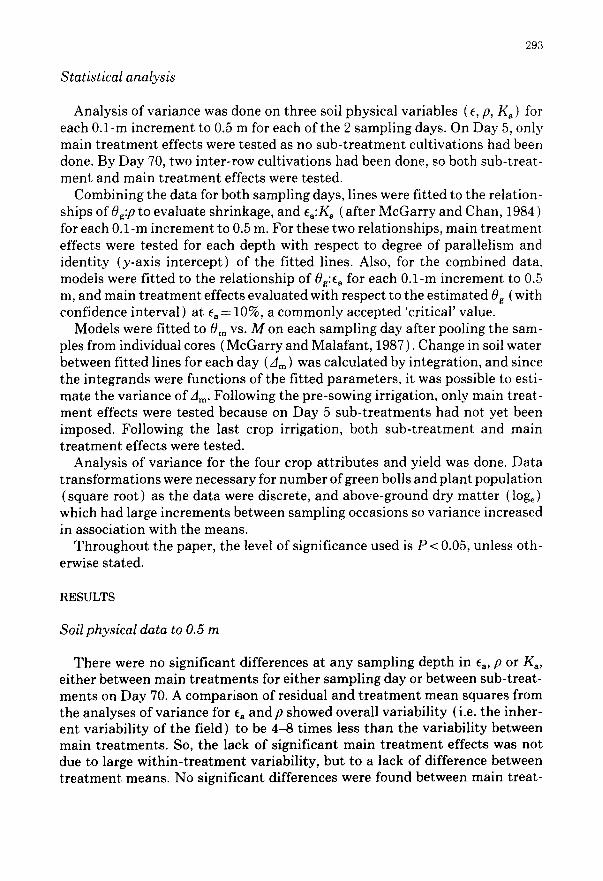
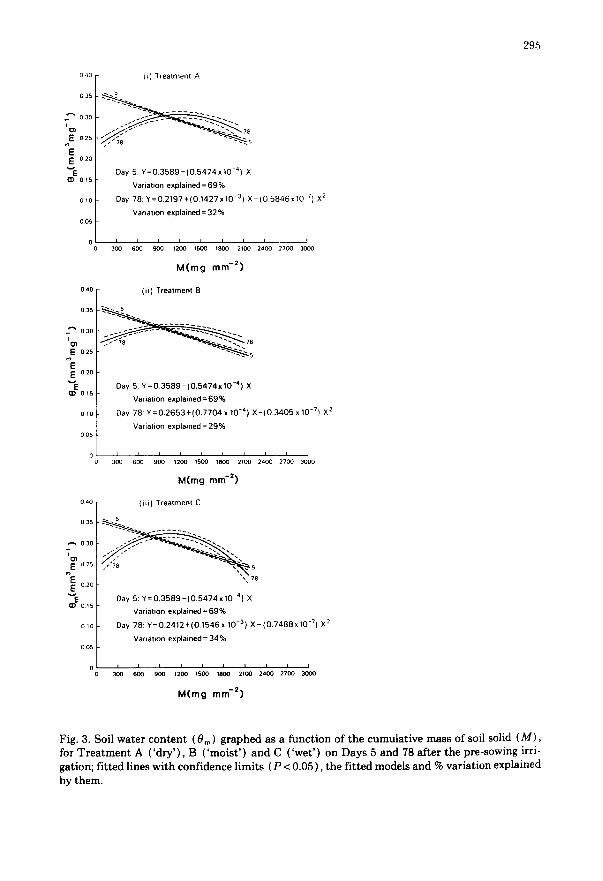
The only significant difference for change in soil water was between main treatments after the pre-sowing irrigation. Following the last crop irrigation there were no significant effects for either main treatment or sub-treatment. Plots of fitted lines, their confidence limits, the models fitted and the percent- age variation explained by them are presented for each sampling day for each main treatment following the pre-sowing irrigation (Fig. 3). Data points are not plotted in Fig. 3 since their great number (up to 135 per line) masks the fitted lines and confidence limits. On Day 5, one line best-fitted the data for all treatments, but on Day 78 each treatment required a different line. All treatments yielded two major zones of change in soil water with time; one of water loss in the upper profile from plant extraction and through-drainage, and one of water gain in the lower profile from infiltration. Only Treatment C had a third zone of water change, deep in the profile, but the change in water between days was not significant. To help relate the mass-based axes in Fig. 3 with the depth-based axes in Figs. 2 and 4 it can be stated that in Fig. 3, (i) the smallest and greatest M value of any line equal 0 and 1.5 m deep, respec- tively, and (ii) the cross-over point between the zone of water loss and that of water gain was approximately at 0.8, 0.7 and 0.6 m deep for Treatments A, B and C, respectively.
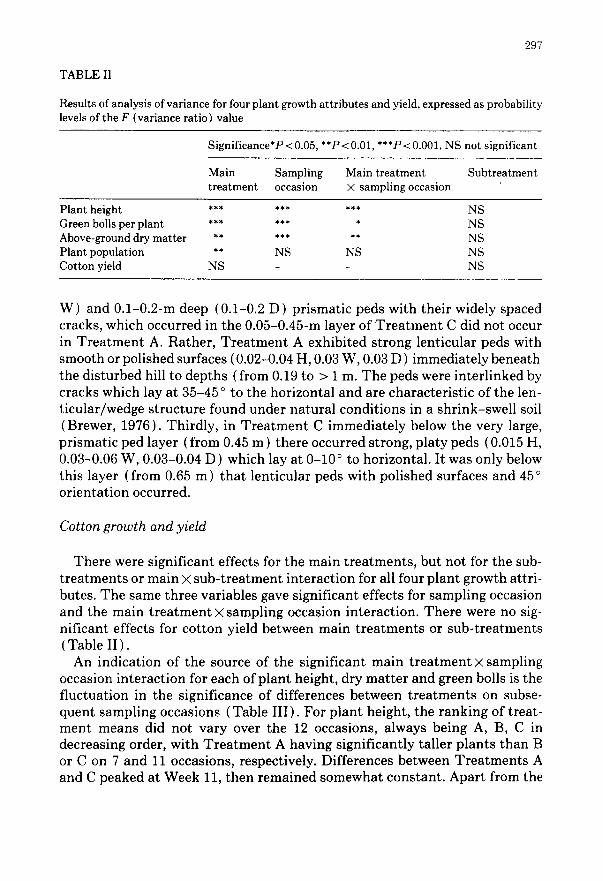
In the extraction-drainage dominant zone, significantly (P<0.01) more water was lost from Treatment A than either B or C, and this water was lost from a greater cumulative mass of soil than in B or C. The value of M for Treatment C is much smaller than that for the two other treatments (Table I). Water loss per unit M (analogous to water loss per unit depth when using a depth coordinate) was also greatest in Treatment A, being 0.052 mm, whereas B and C were 0.036 and 0.040, respectively. There were no significant differ- ences between treatments for change in soil water in the infiltration zone ( Table I), where on average 0.021 mm of water per unit M was gained by each treatment.
End of season soil profile morphology
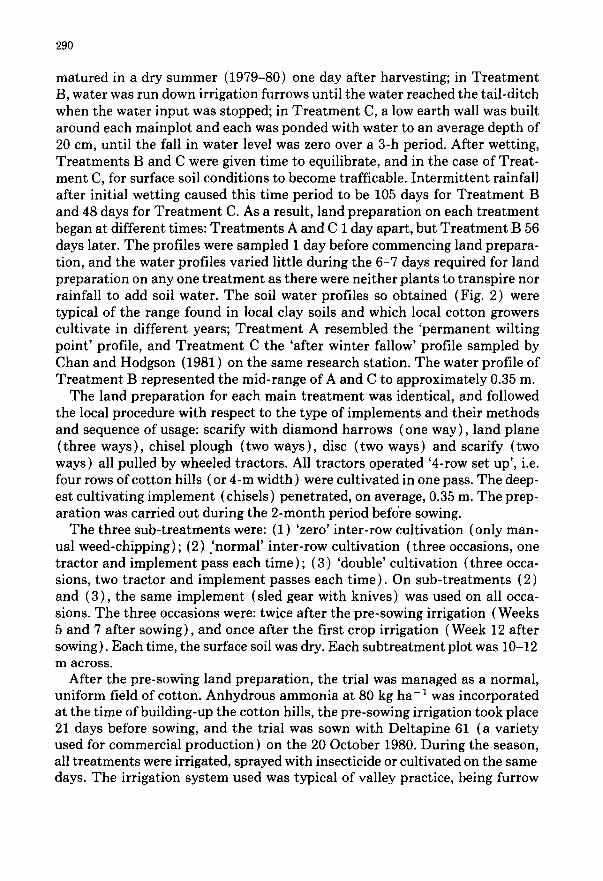
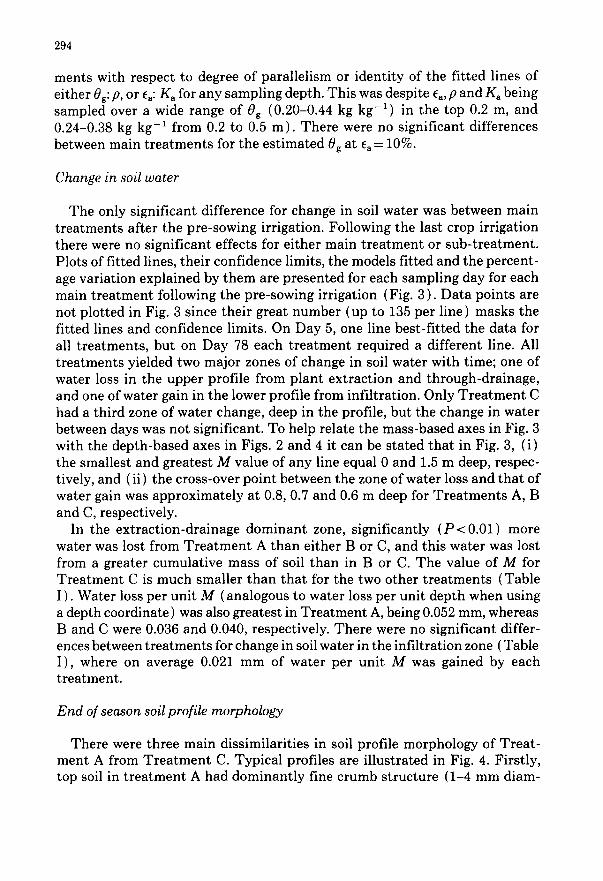
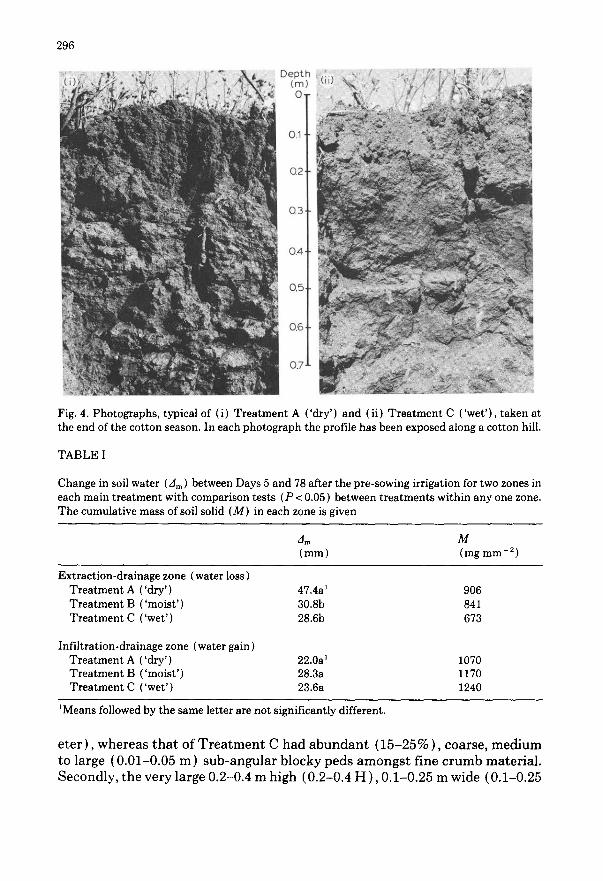
There were three main dissimilarities in soil profile morphology of Treat- ment A from Treatment C. Typical profiles are illustrated in Fig. 4. Firstly, top soil in treatment A had dominantly fine crumb structure (1-4 mm diam-
040
O35
030 I
O25
E E 020
015
- (i) ' l reatment A
- -~"-'-:: ~ ........... -. ~ 78
Day 5 : Y = O . 3 5 8 9 - ( O . 5 4 7 4 x 1 0 -4) X
Variation explained = 6 9 %
Day 7 8 : Y = 0 . 2 1 9 7 +(0 .1427 x 10 -3) X - ( O . 5 8 4 6 x 1 0 -7) X 2
Variation explained = 32 %
300 600 900 1200 1500 1800 21 27 3000
M ( m g mm -2 )
04o I- ( i i) Treatment B
/ o3s ".-=-_5
- . . ~ . ~ ~ _ ~ ~ . . . . . . .
,+ o+F : E 020
015 Day 5: Y = O . 3 5 8 9 - ( 0 . 5 4 7 4 x l O -4) X
Variation explained = 6 9 %
Day 78: Y = 0 .2653 + ( 0 . 7 7 0 4 x 10 -4) X - ( O . 3 4 0 5 x 10 -'/) X 2
Variation expla ined= 29%
I I I I I I I I I I 300 600 900 1200 1500 1800 2100 2400 2700 3000
M(mg mm -2)
040
035
030 T
E 025
% E 020
v (~E015
010
005
0
( i i i } Treatment C
- . 5
78
Day 5:Y=O.3589-(O.5474x10 -4) X
Variation explained = 6 9 %
Day 7 8 : Y = 0 . 2 4 1 2 + ( 0 . 1 5 4 6 x 10 -3) X - ( 0 . 7 4 8 8 x 1 0 "7) X 2
Variation explained = 34 %
I 1 L i I i I I I I 300 600 900 1200 1500 1800 2100 24(X) 2700 3[;00
M ( m g mm -~ )
295
Fig. 3. Soil water content (0m) graphed as a function of the cumulative mass of soil solid (M), for Treatment A ('dry'), B ('moist') and C ('wet') on Days 5 and 78 after the pre-sowing irri- gation; fitted lines with confidence limits (P < 0.05), the fitted models and % variation explained by them.
296
D e p t h : (iJ) ~ f ~ ~ "~'~
O-
0.1.
Q2 ~
Q3.
0.4.
O.5
0.6.
0.7.
Fig. 4. Photographs, typical of (i) Trea tment A ( 'dry') and (ii) Trea tment C ( 'wet ' ) , taken at the end of the cotton season. In each photograph the profile has been exposed along a cotton hill.
TABLE I
Change in soil water (~m) between Days 5 and 78 after the pre-sowing irrigation for two zones in each main t reatment with comparison tests (P<0 .05) between t reatments within any one zone. The cumulative mass of soil solid (M) in each zone is given
LJ m M (mm) (rag mm -2)
Extraction-drainage zone (water loss) Trea tment A ( 'dry ') 47.4a 1 Trea tment B ( 'moist ' ) 30.8b Trea tment C ( 'wet ') 28.6b
Infiltration-drainage zone (water gain) Trea tment A ( 'dry ') 22.0a ~ Trea tment B ( 'moist ' ) 28.3a Trea tment C ( 'wet ' ) 23.6a
906 841 673
1070 1170 1240
~Means followed by the same letter are not significantly different.
eter), whereas that of Treatment C had abundant (15-25%), coarse, medium to large (0.01-0.05 m) sub-angular blocky peds amongst fine crumb material. Secondly, the very large 0.2-0.4 m high (0.2-0.4 H ), 0.1-0.25 m wide (0.1-0.25
297
TABLE II
Results of analysis of variance for four plant growth at tr ibutes and yield, expressed as probability levels of the F (variance ratio) value
Significance*P < 0.05, **P< 0.01, ***P < 0.001, NS not significant
Main Sampling t rea tment occasion
Main t rea tment Subt rea tment X sampling occasion
Plant height *** *** *** NS Green bolls per plant *** *** * NS Above-ground dry mat ter ** *** ** NS Plant population ** NS NS NS Cotton yield NS - - NS
W) and 0.1-0.2-m deep (0.1-0.2 D) prismatic peds with their widely spaced cracks, which occurred in the 0.05-0.45-m layer of Treatment C did not occur in Treatment A. Rather, Treatment A exhibited strong lenticular peds with smooth or polished surfaces (0.02-0.04 H, 0.03 W, 0.03 D ) immediately beneath the disturbed hill to depths (from 0.19 to > 1 m. The peds were interlinked by cracks which lay at 35-45 ° to the horizontal and are characteristic of the len- ticular/wedge structure found under natural conditions in a shrink-swell soil (Brewer, 1976). Thirdly, in Treatment C immediately below the very large, prismatic ped layer (from 0.45 m ) there occurred strong, platy peds ( 0.015 H, 0.03-0.06 W, 0.03-0.04 D) which lay at 0-10 ° to horizontal. It was only below this layer {from 0.65 m) that lenticular peds with polished surfaces and 45 ° orientation occurred.
Cotton growth and yield
There were significant effects for the main treatments, but not for the sub- treatments or main X sub-treatment interaction for all four plant growth attri- butes. The same three variables gave significant effects for sampling occasion and the main treatment X sampling occasion interaction. There were no sig- nificant effects for cotton yield between main treatments or sub-treatments (Table II).
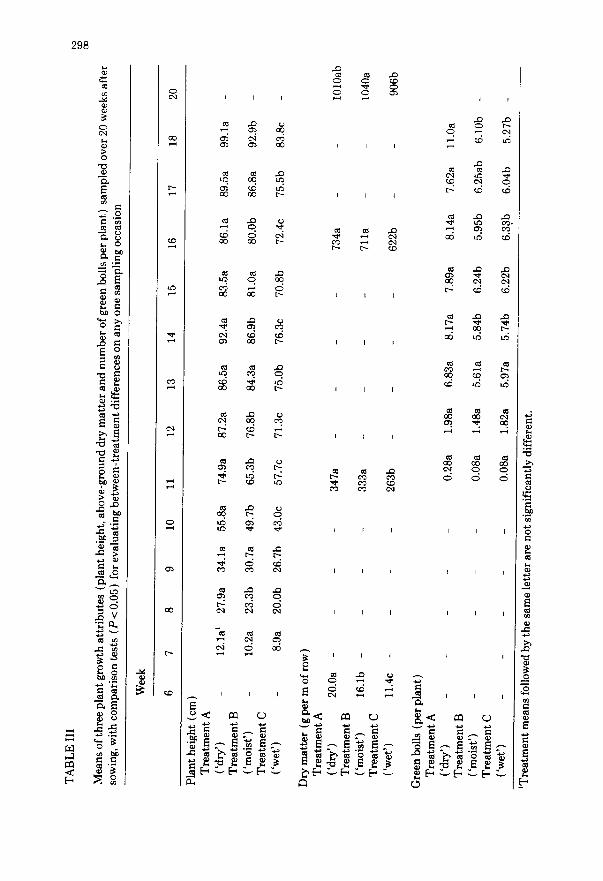
An indication of the source of the significant main treatment × sampling occasion interaction for each of plant height, dry matter and green bolls is the fluctuation in the significance of differences between treatments on subse- quent sampling occasions (Table III). For plant height, the ranking of treat- ment means did not vary over the 12 occasions, always being A, B, C in decreasing order, with Treatment A having significantly taller plants than B or C on 7 and 11 occasions, respectively. Differences between Treatments A and C peaked at Week 11, then remained somewhat constant. Apart from the
298
,-a ~q
>
(.#
(1#
.~v
~8
¢4:)
,--i
t!
I I I
aC aO
O0 ~0 b"
aO
b "
m ,~a
~ i 0 GO
I I I
I I I
I I I
I I I
I I I
I I I
I I I
I I I
,.~ lm
Im
a6 ~
O0 O0 ~0
I I I I I I
I I I I I I
I I I I I I
I I I I I I
. @
C13
,.Q m~
o
299
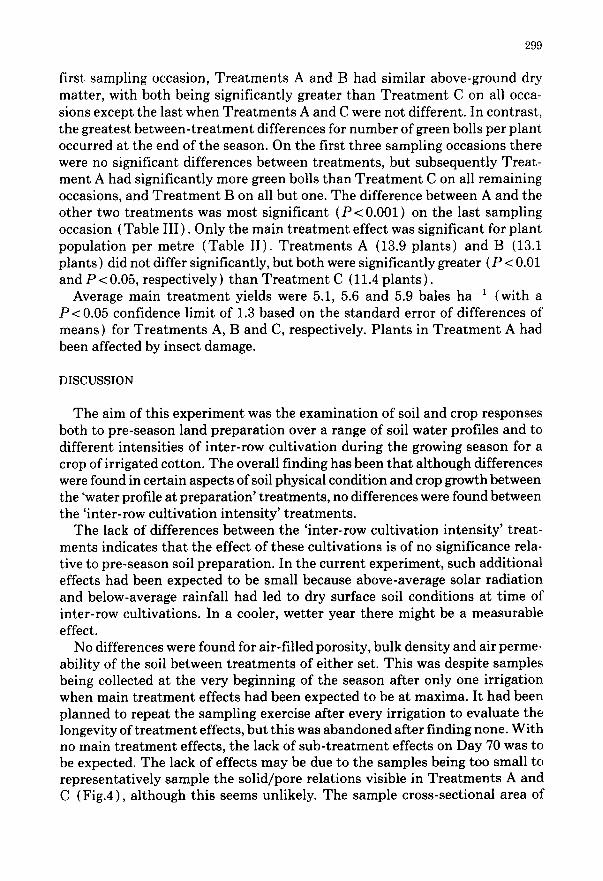
first sampling occasion, Treatments A and B had similar above-ground dry matter, with both being significantly greater than Treatment C on all occa- sions except the last when Treatments A and C were not different. In contrast, the greatest between-treatment differences for number of green bolls per plant occurred at the end of the season. On the first three sampling occasions there were no significant differences between treatments, but subsequently Treat- ment A had significantly more green bolls than Treatment C on all remaining occasions, and Treatment B on all but one. The difference between A and the other two treatments was most significant (P<0.001) on the last sampling occasion (Table III ). Only the main treatment effect was significant for plant population per metre (Table II). Treatments A (13.9 plants) and B (13.1 plants ) did not differ significantly, but both were significantly greater (P < 0.01 and P < 0.05, respectively) than Treatment C (11.4 plants).
Average main treatment yields were 5.1, 5.6 and 5.9 bales ha -1 (with a P < 0.05 confidence limit of 1.3 based on the standard error of differences of means) for Treatments A, B and C, respectively. Plants in Treatment A had been affected by insect damage.
DISCUSSION
The aim of this experiment was the examination of soil and crop responses both to pre-season land preparation over a range of soil water profiles and to different intensities of inter-row cultivation during the growing season for a crop of irrigated cotton. The overall finding has been that although differences were found in certain aspects of soil physical condition and crop growth between the 'water profile at preparation' treatments, no differences were found between the 'inter-row cultivation intensity' treatments.
The lack of differences between the 'inter-row cultivation intensity' treat- ments indicates that the effect of these cultivations is of no significance rela- tive to pre-season soil preparation. In the current experiment, such additional effects had been expected to be small because above-average solar radiation and below-average rainfall had led to dry surface soil conditions at time of inter-row cultivations. In a cooler, wetter year there might be a measurable effect.
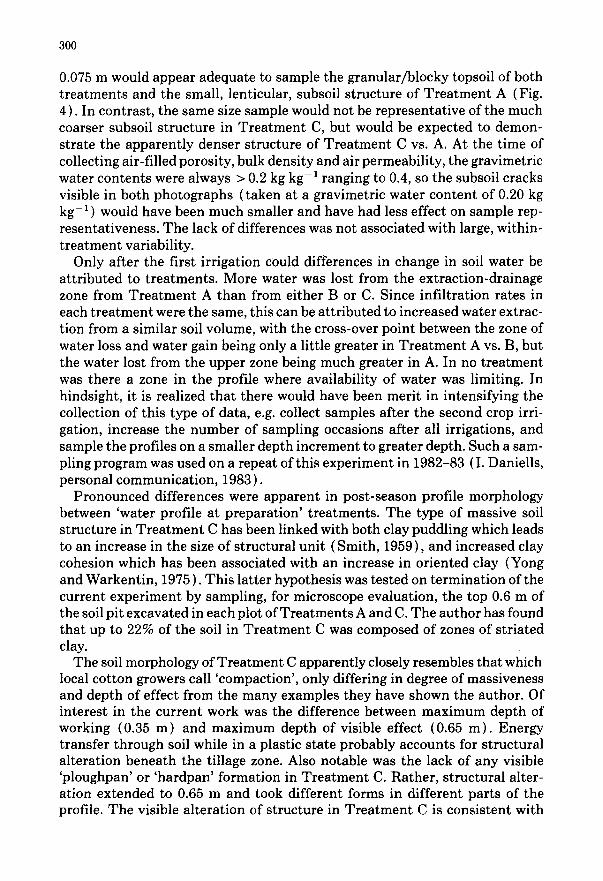
No differences were found for air-filled porosity, bulk density and air perme- ability of the soil between treatments of either set. This was despite samples being collected at the very beginning of the season after only one irrigation when main treatment effects had been expected to be at maxima. It had been planned to repeat the sampling exercise after every irrigation to evaluate the longevity of treatment effects, but this was abandoned after finding none. With no main treatment effects, the lack of sub-treatment effects on Day 70 was to be expected. The lack of effects may be due to the samples being too small to representatively sample the solid/pore relations visible in Treatments A and C (Fig.4), although this seems unlikely. The sample cross-sectional area of
300
0.075 m would appear adequate to sample the granular/blocky topsoil of both treatments and the small, lenticular, subsoil structure of Treatment A (Fig. 4). In contrast, the same size sample would not be representative of the much coarser subsoil structure in Treatment C, but would be expected to demon- strate the apparently denser structure of Treatment C vs. A. At the time of collecting air-filled porosity, bulk density and air permeability, the gravimetric water contents were always > 0.2 kg kg- 1 ranging to 0.4, so the subsoil cracks visible in both photographs (taken at a gravimetric water content of 0.20 kg kg- 1 ) would have been much smaller and have had less effect on sample rep- resentativeness. The lack of differences was not associated with large, within- treatment variability.
Only after the first irrigation could differences in change in soil water be attributed to treatments. More water was lost from the extraction-drainage zone from Treatment A than from either B or C. Since infiltration rates in each treatment were the same, this can be attributed to increased water extrac- tion from a similar soil volume, with the cross-over point between the zone of water loss and water gain being only a little greater in Treatment A vs. B, but the water lost from the upper zone being much greater in A. In no treatment was there a zone in the profile where availability of water was limiting. In hindsight, it is realized that there would have been merit in intensifying the collection of this type of data, e.g. collect samples after the second crop irri- gation, increase the number of sampling occasions after all irrigations, and sample the profiles on a smaller depth increment to greater depth. Such a sam- pling program was used on a repeat of this experiment in 1982-83 (I. Daniells, personal communication, 1983).
Pronounced differences were apparent in post-season profile morphology between 'water profile at preparation' treatments. The type of massive soil structure in Treatment C has been linked with both clay puddling which leads to an increase in the size of structural unit (Smith, 1959), and increased clay cohesion which has been associated with an increase in oriented clay {Yong and Warkentin, 1975 ). This latter hypothesis was tested on termination of the current experiment by sampling, for microscope evaluation, the top 0.6 m of the soil pit excavated in each plot of Treatments A and C. The author has found that up to 22% of the soil in Treatment C was composed of zones of striated clay.
The soil morphology of Treatment C apparently closely resembles that which local cotton growers call 'compaction', only differing in degree of massiveness and depth of effect from the many examples they have shown the author. Of interest in the current work was the difference between maximum depth of working (0.35 m) and maximum depth of visible effect (0.65 m). Energy transfer through soil while in a plastic state probably accounts for structural alteration beneath the tillage zone. Also notable was the lack of any visible 'ploughpan' or 'hardpan' formation in Treatment C. Rather, structural alter- ation extended to 0.65 m and took different forms in different parts of the profile. The visible alteration of structure in Treatment C is consistent with