the effect of non-cognitive traits on health behaviours in ...ftp.iza.org/dp7301.pdf · the effect...
TRANSCRIPT
DI
SC
US
SI
ON
P
AP
ER
S
ER
IE
S
Forschungsinstitut zur Zukunft der ArbeitInstitute for the Study of Labor
The Effect of Non-Cognitive Traits on HealthBehaviours in Adolescence
IZA DP No. 7301
March 2013
Silvia MendoliaIan Walker
The Effect of Non-Cognitive Traits on
Health Behaviours in Adolescence
Silvia Mendolia University of Wollongong
Ian Walker
Lancaster University and IZA
Discussion Paper No. 7301 March 2013
IZA
P.O. Box 7240 53072 Bonn
Germany
Phone: +49-228-3894-0 Fax: +49-228-3894-180
E-mail: [email protected]
Any opinions expressed here are those of the author(s) and not those of IZA. Research published in this series may include views on policy, but the institute itself takes no institutional policy positions. The IZA research network is committed to the IZA Guiding Principles of Research Integrity. The Institute for the Study of Labor (IZA) in Bonn is a local and virtual international research center and a place of communication between science, politics and business. IZA is an independent nonprofit organization supported by Deutsche Post Foundation. The center is associated with the University of Bonn and offers a stimulating research environment through its international network, workshops and conferences, data service, project support, research visits and doctoral program. IZA engages in (i) original and internationally competitive research in all fields of labor economics, (ii) development of policy concepts, and (iii) dissemination of research results and concepts to the interested public. IZA Discussion Papers often represent preliminary work and are circulated to encourage discussion. Citation of such a paper should account for its provisional character. A revised version may be available directly from the author.
IZA Discussion Paper No. 7301 March 2013
ABSTRACT
The Effect of Non-Cognitive Traits on Health Behaviours in Adolescence*
This paper investigates the relationship between personality traits in adolescence and health behaviours using a large and recent cohort study. In particular, we investigate the impact of locus of control, self-esteem and conscientiousness at age 15-16, on the incidence of health behaviours such as: alcohol consumption; cannabis and other drug use; unprotected and early sexual activity; and sports and physical activity. We use matching methods to control for a very rich set of adolescent and family characteristics and we find that personality traits do affect health behaviours. In particular, individuals with external locus of control, or with low self-esteem, or with low levels of conscientiousness are more likely to engage in health-risky behaviours. JEL Classification: I18, I28 Keywords: personality, locus of control, self-esteem, health behaviours Corresponding author: Ian Walker Department of Economics Lancaster University Lancaster, LA1 4YX United Kingdom E-mail: [email protected]
* We are grateful to the Economic and Social Data Service at the University of Essex and the Department for Education for providing the data. The data can be obtained via http://www.esds.ac.uk/longitudinal/access/lsype/faq.asp and our STATA code is available on request.
2
1. Introduction
The objective of this paper is to analyse the role of non-cognitive traits on health
behaviours in adolescence. Scholars from various fields have examined the determinants of
economic success that go beyond those captured by cognitive ability, and have shown that
certain traits, other than IQ and measures of cognitive development, significantly affect
economic life outcomes.
Our paper contributes to the existing literature in two ways. First, we produce new
evidence on the importance of non-cognitive skills, based on a large and recent dataset,
consisting of a cohort of children born in 1990 who were followed for seven years, starting in
2004. Second, unlike much other research, our analysis is focused on personality traits in
adolescence. This is important as a variety of studies show that, unlike cognitive abilities,
personality traits are relatively malleable over the life cycle so policy interventions can target
adolescents in order to promote useful traits and supress harmful ones early in life in order to
avoid adverse long term negative effects.
Our data allows us to study the effect of personality traits recorded when the child is
15-16 on subsequent health-risky behaviours up to when she/he is 19-20 years old. We use
the extensive information available on the child’s personality to construct indicators of locus
of control, self-esteem and conscientiousness to relate these characteristics to various health-
related behaviours.
Our results broadly support the idea that non-cognitive skills are very important in
determining people’s health choices in life: individuals with external locus of control, low
self-esteem and low levels of conscientiousness are more likely to engage in risky
behaviours, such as cannabis and drugs taking, unprotected sex, or excessive drinking. The
rest of this paper is organized as follows. Section 2 provides a brief overview of the existing
literature. Section 3 presents the data and explains the personality indicators and health-
3
related outcomes that it contains. Section 4 discusses the estimation methods and the results.
Section 5 concludes.
2. Overview of existing literature
Risky behaviour with respect to health is important. The World Health Organisation
has recently shown (World Health Organisation, 2009) that health-risky behaviours, such as
illicit drugs use, alcohol consumption, inadequate physical exercise, etc., significantly
increase morbidity and mortality risks in Western developed countries. In addition to this, the
US Centre for Disease Control and Prevention noted in its Annual Youth Risk Behaviour
Surveillance Report 2011 that “the leading causes of morbidity and mortality among youth
and adults in the United States are related to six categories of priority health-risk behaviors:
behaviors that contribute to unintentional injuries and violence; tobacco use; alcohol and
other drug use; sexual behaviors that contribute to unintended pregnancy and sexually
transmitted diseases (STDs), including HIV infection; unhealthy dietary behaviors; and
physical inactivity”. This seems to be particularly relevant for the British population,:
according to the UNICEF Innocenti Report on child poverty (UNICEF, 2007), the prevalence
of risky behaviours, such as alcohol abuse, illicit drugs use and hazardous sexual activity in
the UK is higher than in other similar OECD countries.
The evidence on the effect of personality on health has suggested that personality
predicts health through a variety of mechanisms, such as health-related behaviours, longevity,
and social relationships. Almlund et al. (2011) provide an excellent review of the studies
conducted in this area. They conclude that most of the literature in the fields of psychology
and health sciences shows that personality traits such as conscientiousness, openness to
experience, and agreeableness generally have a positive effect on longevity. Heckman, et al.
(2006) use data from the National Longitudinal Survey of Youth 1979 to investigate the
4
effect of cognitive and non-cognitive skills on labour market outcomes and social behaviors
and show that non-cognitive abilities, such as locus of control and self-esteem, affect
schooling decisions, wages and risky behaviors among youths, such as the probability of
smoking, using marijuana, and being a teenager mother. Almlund et al. (2011) note that the
main difficulty in conducting analyses of this kind is to identify the causal relationship
between personality and health, because health status is also likely to have an effect on
personality. Controlling for the timing of the events might be a partial solution (Friedman et
al., 2010). Some studies in the literature have used structural models to control for reverse
causality (Conti and Heckman, 2010; Savelyev, 2010) and have shown a relationship between
personality traits, initial health endowments and educational choices.
In general, Conscientiousness, Openess to Experience, and Agreeableness have a
positive effect on the length of individual lives, while Neuroticism is associated with shorter
lives (see for example Martin et al., 2007; Kern and Friedman, 2008). One of the most
important transmission channels from personality to health is likely to be through health-
related behaviours. Various papers have shown that non-cognitive traits have an effect on
smoking, diet and exercise (Heckman et al., 2006; Hampson et al., 2007; Gale et al., 2008;
Hampson et al., 2010), as well as reactions to chronic illness (Mejier et al, 2002) and
personality traits recorded at school-age have an effect on behaviours during midlife
(Hampson et al., 2007). Personality traits may also have an indirect effect on health through
educational attainment (Hampson et al., 2010). However, most of the existing studies tend to
use small or unrepresentative samples (see Roberts et al., 2007 for a review, and Bogg and
Roberts, 2004 for a meta-analysis. The latter exploits large numbers of small studies and
shows statistically significant correlations for almost all outcomes).
As we have already mentioned, the economics literature on the impact of personality
traits on health behaviours is limited. And, as noted before, Heckman et al. (2006) show that
5
non-cognitive skills affect the probability of smoking, using marijuana, and being a teenager
mother in US NLSY data, while Chiteji (2010) uses data from the US PSID to show that self-
efficacy is associated with lower alcohol consumption and more physical exercise. Cobb-
Clark et al. (2012) use Australian data to analyse the relationship between locus of control
and healthy habits, such as diet, physical exercise, smoking and drinking and show that
individual with an internal locus of control are more likely to eat well and exercise regularly,
even if this link cannot be explained by individual time preferences toward the future.
Social scientists and health economists have devoted a significant amount of effort to
investigating the determinants of health risky behaviours, as they are one of the main causes
of differences in health outcomes (Cutler and Glaeser, 2005). Cutler and Lleras-Muney
(2005) note that income and prices account for a small part of the variation in health
behaviours, and many unhealthy behaviours are costly, so differences in tastes and
information are likely to play a major role in these choices. A large literature has shown that
education affects health behaviours (Grossman, 2000 and 2006; Cutler and Lleras-Muney,
2005) because of its effect on individual health production efficiency (Grossman, 1975) or
because they are both affected by a third factor (Fuch, 1982; Arendt, 2005; Lleras Muney,
2005) such as: risk attitudes (Anderson and Mellor, 2008), or discounting and time
preferences (Van Der Pol, 2011). Stress and lack of control have also been found to have an
impact on health choices (Salovey, 1998; Hamilton et al., 2009). Other factors, such as family
relationships (Roche et al., 2008), religiosity (Nonnemaker et al., 2003), peer effects and
social networks are also likely to play a major role, especially in analysing behaviours of
adolescents (Cutler and Lleras-Muney, 2005). However, most of this literature has not
directly taken into account specific personality traits, such as Self-Esteem, Locus of Control
or Conscientiousness.
6
3. Data
This paper uses data from the Longitudinal Study of Young People in England
(LSYPE), which is a large scale panel survey of English adolescents, interviewed for the first
time when they were in school year 9 in 2004 at the age of 14. The study is managed by the
Department of Education and covers wide range of social policy issues. The questionnaires
cover a variety of topics, including academic achievements, family relationships, attitudes
toward school, family and labour market, and some more sensitive or challenging issues, such
as risky health behaviours (smoking, alcohol drinking, drug taking), personal relationships,
etc.
In the first wave, selected to be representative of the young people in England, around
15,500 young people were interviewed. In the first four waves, parents/guardians were also
interviewed. Our final sample includes around 7,000 observations of children with non-
missing information on personality traits, health behaviours and other essential information
on the child’s birth and family background (the selected observations were not significantly
different from the original data in terms of their observable characteristics).
Outcomes
The LSYPE includes information on various outcomes, measured from adolescence to early
adulthood, and we are interested in investigating the effect of personality traits recorded at
wave 2 (or 4) on health-risky behaviours recorded at wave 6 or 7. These questions are
answered by the child through self-completion questionnaires, in order to minimise the risk of
misreporting on these sensitive topics. We focus on four groups of outcomes: cannabis and
drug use; sex behaviour; drinking and sport and physical activity. Unfortunately, information
about smoking is only available in LSYPE until wave 4 and no information is collected about
nutrition habits.
7
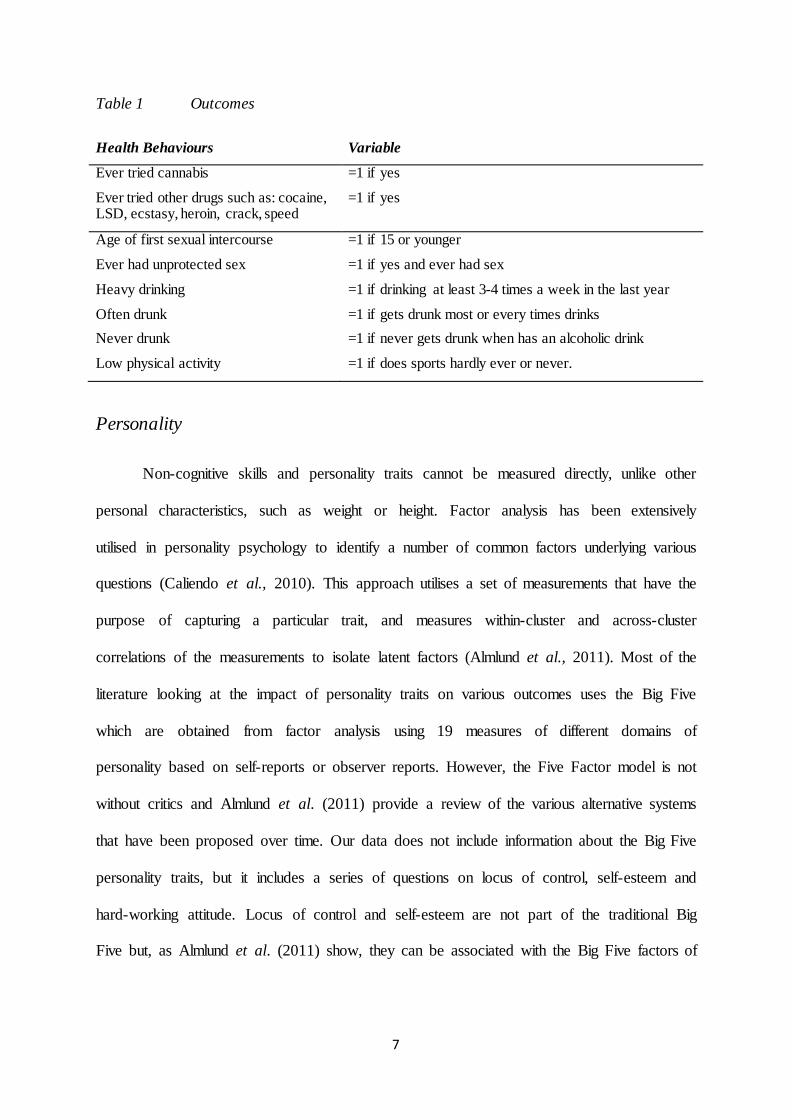
Table 1 Outcomes
Health Behaviours Variable
Ever tried cannabis =1 if yes
Ever tried other drugs such as: cocaine, LSD, ecstasy, heroin, crack, speed
=1 if yes
Age of first sexual intercourse =1 if 15 or younger
Ever had unprotected sex =1 if yes and ever had sex
Heavy drinking =1 if drinking at least 3-4 times a week in the last year
Often drunk =1 if gets drunk most or every times drinks Never drunk =1 if never gets drunk when has an alcoholic drink
Low physical activity =1 if does sports hardly ever or never.
Personality
Non-cognitive skills and personality traits cannot be measured directly, unlike other
personal characteristics, such as weight or height. Factor analysis has been extensively
utilised in personality psychology to identify a number of common factors underlying various
questions (Caliendo et al., 2010). This approach utilises a set of measurements that have the
purpose of capturing a particular trait, and measures within-cluster and across-cluster
correlations of the measurements to isolate latent factors (Almlund et al., 2011). Most of the
literature looking at the impact of personality traits on various outcomes uses the Big Five
which are obtained from factor analysis using 19 measures of different domains of
personality based on self-reports or observer reports. However, the Five Factor model is not
without critics and Almlund et al. (2011) provide a review of the various alternative systems
that have been proposed over time. Our data does not include information about the Big Five
personality traits, but it includes a series of questions on locus of control, self-esteem and
hard-working attitude. Locus of control and self-esteem are not part of the traditional Big
Five but, as Almlund et al. (2011) show, they can be associated with the Big Five factors of
8
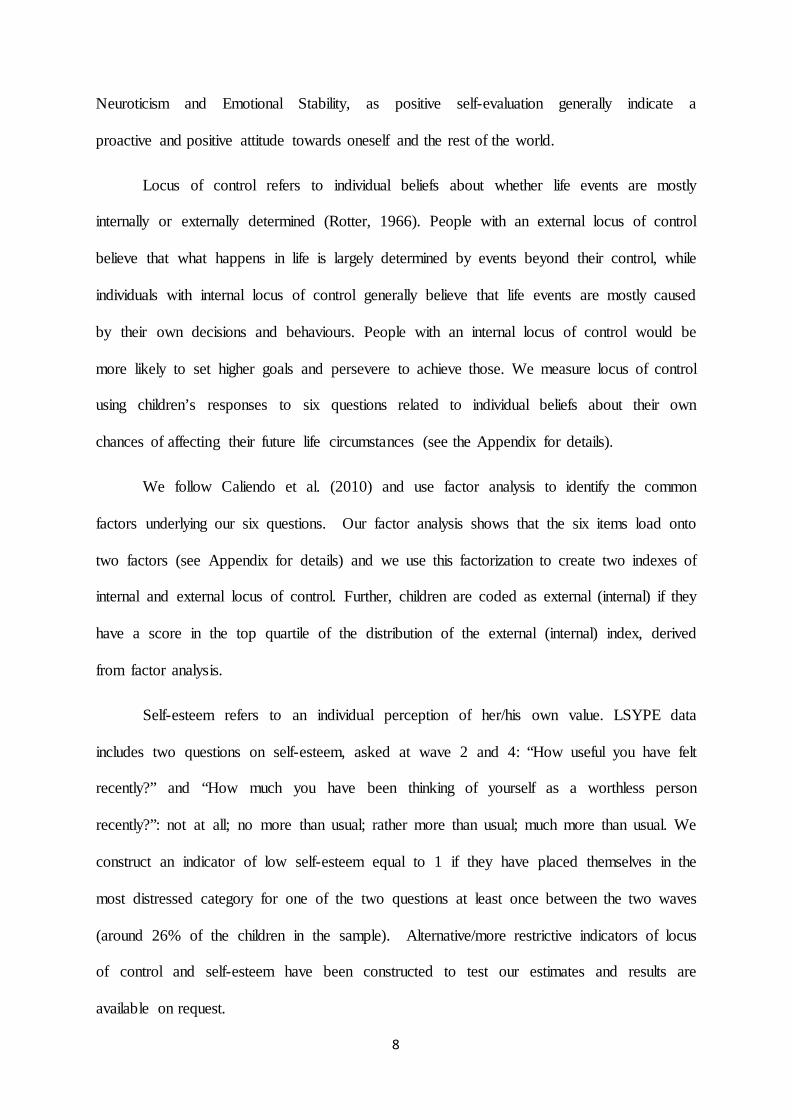
Neuroticism and Emotional Stability, as positive self-evaluation generally indicate a
proactive and positive attitude towards oneself and the rest of the world.
Locus of control refers to individual beliefs about whether life events are mostly
internally or externally determined (Rotter, 1966). People with an external locus of control
believe that what happens in life is largely determined by events beyond their control, while
individuals with internal locus of control generally believe that life events are mostly caused
by their own decisions and behaviours. People with an internal locus of control would be
more likely to set higher goals and persevere to achieve those. We measure locus of control
using children’s responses to six questions related to individual beliefs about their own
chances of affecting their future life circumstances (see the Appendix for details).
We follow Caliendo et al. (2010) and use factor analysis to identify the common
factors underlying our six questions. Our factor analysis shows that the six items load onto
two factors (see Appendix for details) and we use this factorization to create two indexes of
internal and external locus of control. Further, children are coded as external (internal) if they
have a score in the top quartile of the distribution of the external (internal) index, derived
from factor analysis.
Self-esteem refers to an individual perception of her/his own value. LSYPE data
includes two questions on self-esteem, asked at wave 2 and 4: “How useful you have felt
recently?” and “How much you have been thinking of yourself as a worthless person
recently?”: not at all; no more than usual; rather more than usual; much more than usual. We
construct an indicator of low self-esteem equal to 1 if they have placed themselves in the
most distressed category for one of the two questions at least once between the two waves
(around 26% of the children in the sample). Alternative/more restrictive indicators of locus
of control and self-esteem have been constructed to test our estimates and results are
available on request.
9
Almlund et al. (2011) present competence, dutifulness, self-discipline, perseverance
and work-ethic as facets of Conscientiousness. LSYPE includes four questions on hard-
working attitudes (see the Appendix for details) and we use factor analysis to identify the
common factors underlying the four questions and to create an index of Conscientiousness.
Then, we construct an indicator of high conscientiousness, which is equal to 1 if the children
have a score in the top quartile of the distribution of the index of conscientiousness, derived
from factor analysis.
Other explanatory variables
We estimate three versions of our model, progressively increasing the set of
independent variables. All of the variables we control for are, arguably, pre-determined
variables – that is, not themselves influenced by personality traits. Our first, most
parsimonious, model only includes at-birth characteristics such as: birth-weight; whether the
child was premature; ethnic background; sex of the child; and family characteristics such as
marital status and age of the mother at birth. In the second model we include other family’s
characteristics (measured at wave 1) which are unlikely to have changed since the child’s
birth, such as: maternal education, child and mother disability, grandparents’ education, and
older siblings. The last model includes further characteristics at wave 1 such as: younger
siblings; maternal working and marital status; household income; family size; and whether
the child has ever been in care.
Descriptive statistics
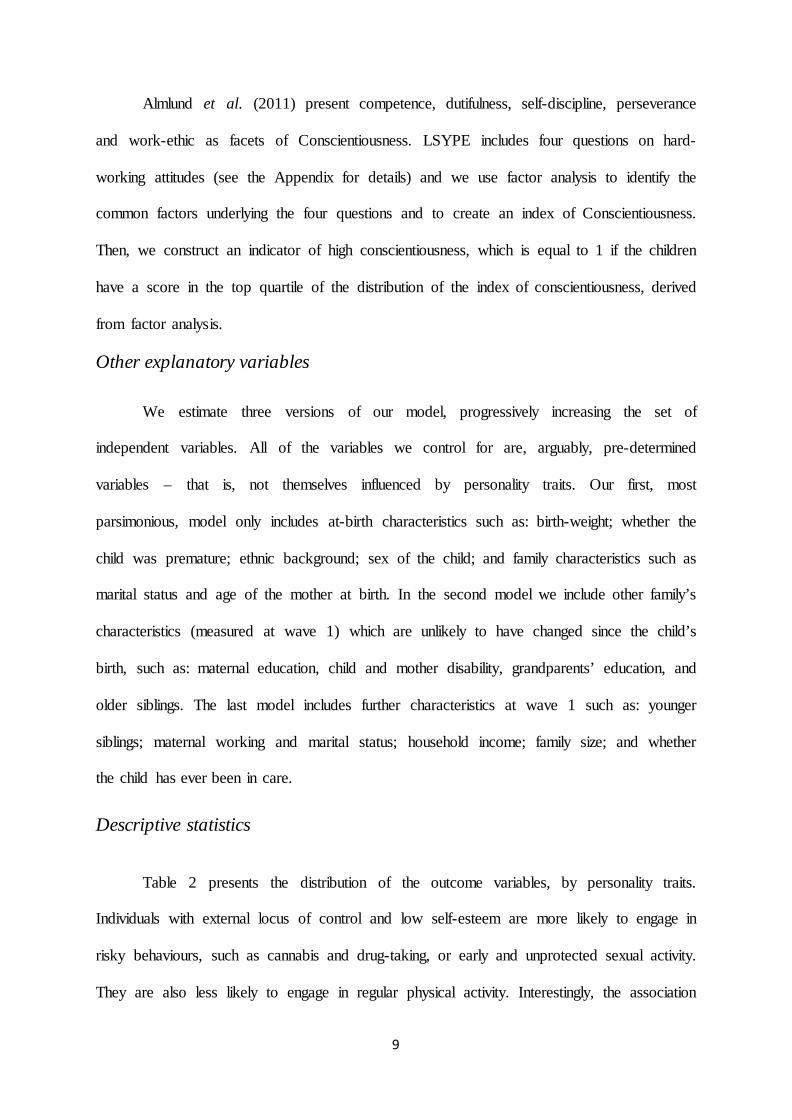
Table 2 presents the distribution of the outcome variables, by personality traits.
Individuals with external locus of control and low self-esteem are more likely to engage in
risky behaviours, such as cannabis and drug-taking, or early and unprotected sexual activity.
They are also less likely to engage in regular physical activity. Interestingly, the association
10
with alcohol consumption is less pronounced. On the other hand, children with high level of
conscientiousness seem less likely to engage in health-risky behaviours, such as drinking,
drug-taking or unprotected sex.
Children with an external locus of control are more likely to come from disadvantaged
families, with single or very young mothers at birth, and lower household income and level of
education. On the other hand, children with low self-esteem and high conscientiousness
(mostly girls) are more likely to have highly educated mums, who work, and have relatively
high family income.
Table 2 Distribution of outcome variables by locus of control, self-esteem and conscientiousness
Whole
sample External Low Self Esteem
High Conscientiousness
Ever tried cannabis (%) 32 35 39 22
Taking cannabis in last 4 weeks (%) 36 38 38 33
Ever tried other drugs (%) 11 14 15 6
Ever had sex (%) 67 77 70 59
First sexual intercourse <16 (%) 31 37 35 25
Ever had unprotected sex (%) 43 48 48 35
Heavy drinking (%) 20 19 21 18
Drinking Rarely (%) 17 19 19 19
Often drunk (%) 29 32 32 26
Never drunk (%) 11 10 10 12
Low physical activity (%) 19 23 25 15 Note: All outcomes are recorded at wave 6 or 7. 4. Estimation
While we begin by using Ordinary Least Squares, to control for observable
confounders, this is well known to lead to biased estimates of the causal effects because of
neglected heterogeneity. The linear model can be written as:
Hi = α + βi Pi + γi Xi + ε i
11
where Hi represents a particular health behaviour, Pi is a vector of psychological traits (binary
indicators of external locus of control; low self-esteem; high conscientiousness) and Xi is a
vector of child’s and family’s characteristics.
We estimate the three versions of our model including all the three personality traits
and then we test the stability of our results by including one or two personality traits at a
time. Interestingly, our results are very consistent and stable across all the specifications.
The major challenge in this analysis is establishing causal connections between
personality and child outcomes, given that children did not receive personality characteristics
through random assignment and the children who exhibit a particular trait may have
unobserved characteristics which also affect their health behaviour. Therefore, we think of
OLS as providing upper bounds to the causal effects.
The effect non-cognitive skills on children’s health behaviours may be estimated
correctly through OLS if several assumptions are true. First, the “selection on observables”
assumption must be satisfied (see Heckman, 1979). This means that all variables that predict
both personality and children’s health behaviours should be included in our model. Second,
the model must be correctly specified: this is very problematic because assumptions like
linearity and additivity are really difficult to verify when we include several independent
variables. Further, if there is a lack of overlap in covariate distributions across children who
have, and do not have, a specific personality trait– that is, for example, if there are children
with internal locus of control for whom there are no comparable children without internal
locus of control- linear regression models extrapolate results over portions of the distribution
where there is no support (comparing incomparable children).
We cannot, in this data, address the selection on unobservables problem. There is
simply no quasi-experimental variation across our sample to exploit. However, we can go
some way towards addressing the other problems. Firstly, we try to lower the upper bound
12
provided by OLS estimation, through the inclusion of a progressively more detailed set of
independent variables. Second, we exploit propensity score matching, that does not strongly
rely on functional form assumptions and restricts inference to samples where we can find
overlap in the distribution of covariates across the treatment (i.e. personality traits).
Propensity Score Matching has been used in various recent papers investigating the
determinants of children well-being (see for example Ruhm, 2008; Berger et al., 2005; and
Goodman and Sianesi, 2005) and the effect of personality traits (Caliendo et al., 2005).
In order to estimate the effect of personality on children’s outcomes, we would ideally
need to compare the average outcomes for children who have low self-esteem (for example)
with the average outcomes for the same children had they not had low self-esteem. However,
the latter is an unobserved counterfactual and the evaluation problem is to provide unbiased
estimates of this average counterfactual using appropriate methods and assumptions. The idea
of propensity score matching is to make children with different personality traits (i.e. internal
and external; conscientious and non-conscientious; with low and high self-esteem) as
comparable as possible in all other characteristics. More specifically, firstly we estimate the
conditional probability of having a specific personality trait, like being external (being in the
treatment group) for each child, given our covariates. This is called the propensity score.
Then, estimated propensity scores are used to create a matched control group and for each
treated child we find the comparison member with the closest propensity score. Non matched
individuals are dropped from the analysis. Our analysis is performed using psmatch2 and
appropriate tests have been run, in order to compare covariate distributions across our
matched groups to ensure that adequate has been obtained (results available on request). Our
approach is similar to Goodman and Sianesi (2005) and we use propensity score matching
with the nearest neighbour method with replacement (as it has been shown to reduce bias
relative to matching without replacement, see Dehejia and Wahba, 2002) and then used the
13
common option, so that off-support observations are automatically dropped. Similar results
were obtained with other methods.
Matching is more robust than OLS because it does not restrict the way in which
personality may affect behaviours to be linear, and inference is limited to samples that are
effectively comparable, based on the covariates distribution. Matching attaches appropriate
weights to the observations in the control group, so that the distribution of their observable
characteristics is realigned to the treatment group.
5. Results
The results from the estimation of the effect of personality traits on health behaviours
are presented in Tables 3 and 4. We begin by using OLS with the three indicators of external
locus of control, low self-esteem and high conscientiousness and then we change the
specifications by including one or two personality traits at a time (see Table 3). The indicator
of internal locus of control was included in a previous version of the model: however, it never
led to significant effects and therefore we decided to omit it from the final specification. This
shows that the effect of personality on health behaviours is mostly driven by the negative
effect of being external (rather than by the positive effect of being internal). The models have
also been estimated with continuous indexes of internal and external locus of control, self-
esteem and conscientiousness and results are available on request.
OLS estimation restricts the possibility to control for children’s differences
parametrically – for example, in a linear way. Therefore, our results have also been estimated
by using PSM (see Table 4), that allows to compare individuals with different personality
traits on the basis of their observable characteristics without the functional form restrictions
of OLS. PSM estimation only allows to match individuals on the basis of one treatment but,
as we show in table 3, the effect of personality is very stable and the size and magnitude of
the effects do not change when we include one or two traits at a time.
14
Results presented in Tables 3 and 4 show that non-cognitive skills generally have
significant effect on health behaviours and the sizes of the effects are notable. Having
external locus of control is associated with higher chances to use cannabis or other drugs by
about 3-4 percentage points (p.p.). This result is stable across different specification of the
model, as well as including/excluding other personality traits. Similarly, external locus of
control has a strong negative impact on sexual behaviours and the size of the effect is even
higher (between 6 and 7 p.p). The negative effect of external locus of control is not
surprising, as external individuals tend to think that their choices have less impact on their
future, which is mostly driven by luck and external circumstances. As a consequence, they
also seem less cautious in engaging in various health-risky behaviours. The effect of low self-
esteem and high conscientiousness on cannabis/drug-taking and risky sexual behaviours are
higher than the effect of locus of control and, again, very stable across different specifications
of the model. Children’s low self-esteem increases the chances of taking cannabis by about
10 p.p. and the effect on the chances of trying drugs is a bit lower (around 6 p.p.) but still
very significant. Low self-esteem also increases the incidence of risky sexual activity by
about 7-8 p.p. High conscientiousness seems to have an important protective effect from
health-risky behaviours, with significant effects on cannabis (around 8 p.p) and drugs use
(around 4 p.p.), as well as decreasing chances of engaging in early and unprotected sexual
behaviour (by around 5 to 7 p.p.).
As expected, children with low self-esteem seem to underestimate the consequences
of their risky health behaviours and, possibly because they struggle to see themselves as
valuable, they are less cautious with respect to their health. On the other hand more
conscientious children are more likely to carefully evaluate the consequences of their actions
and to have a proactive orientation towards the future.
15
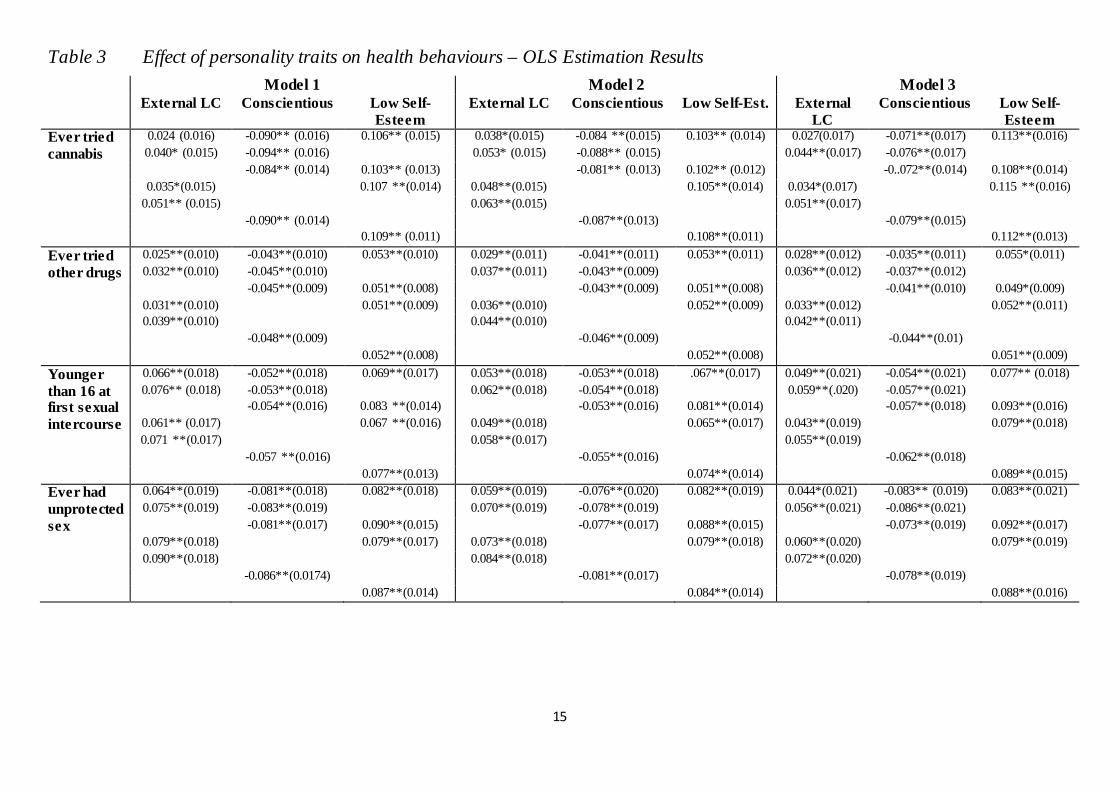
Table 3 Effect of personality traits on health behaviours – OLS Estimation Results Model 1 Model 2 Model 3 External LC Conscientious Low Self-
Esteem External LC Conscientious Low Self-Est. External
LC Conscientious Low Self-
Esteem Ever tried 0.024 (0.016) -0.090** (0.016) 0.106** (0.015) 0.038*(0.015) -0.084 **(0.015) 0.103** (0.014) 0.027(0.017) -0.071**(0.017) 0.113**(0.016) cannabis 0.040* (0.015) -0.094** (0.016) 0.053* (0.015) -0.088** (0.015) 0.044**(0.017) -0.076**(0.017) -0.084** (0.014) 0.103** (0.013) -0.081** (0.013) 0.102** (0.012) -0..072**(0.014) 0.108**(0.014) 0.035*(0.015) 0.107 **(0.014) 0.048**(0.015) 0.105**(0.014) 0.034*(0.017) 0.115 **(0.016) 0.051** (0.015) 0.063**(0.015) 0.051**(0.017) -0.090** (0.014) -0.087**(0.013) -0.079**(0.015) 0.109** (0.011) 0.108**(0.011) 0.112**(0.013) Ever tried 0.025**(0.010) -0.043**(0.010) 0.053**(0.010) 0.029**(0.011) -0.041**(0.011) 0.053**(0.011) 0.028**(0.012) -0.035**(0.011) 0.055*(0.011) other drugs 0.032**(0.010) -0.045**(0.010) 0.037**(0.011) -0.043**(0.009) 0.036**(0.012) -0.037**(0.012) -0.045**(0.009) 0.051**(0.008) -0.043**(0.009) 0.051**(0.008) -0.041**(0.010) 0.049*(0.009) 0.031**(0.010) 0.051**(0.009) 0.036**(0.010) 0.052**(0.009) 0.033**(0.012) 0.052**(0.011) 0.039**(0.010) 0.044**(0.010) 0.042**(0.011) -0.048**(0.009) -0.046**(0.009) -0.044**(0.01) 0.052**(0.008) 0.052**(0.008) 0.051**(0.009) Younger 0.066**(0.018) -0.052**(0.018) 0.069**(0.017) 0.053**(0.018) -0.053**(0.018) .067**(0.017) 0.049**(0.021) -0.054**(0.021) 0.077** (0.018) than 16 at 0.076** (0.018) -0.053**(0.018) 0.062**(0.018) -0.054**(0.018) 0.059**(.020) -0.057**(0.021) first sexual -0.054**(0.016) 0.083 **(0.014) -0.053**(0.016) 0.081**(0.014) -0.057**(0.018) 0.093**(0.016) intercourse 0.061** (0.017) 0.067 **(0.016) 0.049**(0.018) 0.065**(0.017) 0.043**(0.019) 0.079**(0.018) 0.071 **(0.017) 0.058**(0.017) 0.055**(0.019) -0.057 **(0.016) -0.055**(0.016) -0.062**(0.018) 0.077**(0.013) 0.074**(0.014) 0.089**(0.015) Ever had 0.064**(0.019) -0.081**(0.018) 0.082**(0.018) 0.059**(0.019) -0.076**(0.020) 0.082**(0.019) 0.044*(0.021) -0.083** (0.019) 0.083**(0.021) unprotected 0.075**(0.019) -0.083**(0.019) 0.070**(0.019) -0.078**(0.019) 0.056**(0.021) -0.086**(0.021) sex -0.081**(0.017) 0.090**(0.015) -0.077**(0.017) 0.088**(0.015) -0.073**(0.019) 0.092**(0.017) 0.079**(0.018) 0.079**(0.017) 0.073**(0.018) 0.079**(0.018) 0.060**(0.020) 0.079**(0.019) 0.090**(0.018) 0.084**(0.018) 0.072**(0.020) -0.086**(0.0174) -0.081**(0.017) -0.078**(0.019) 0.087**(0.014) 0.084**(0.014) 0.088**(0.016)
16
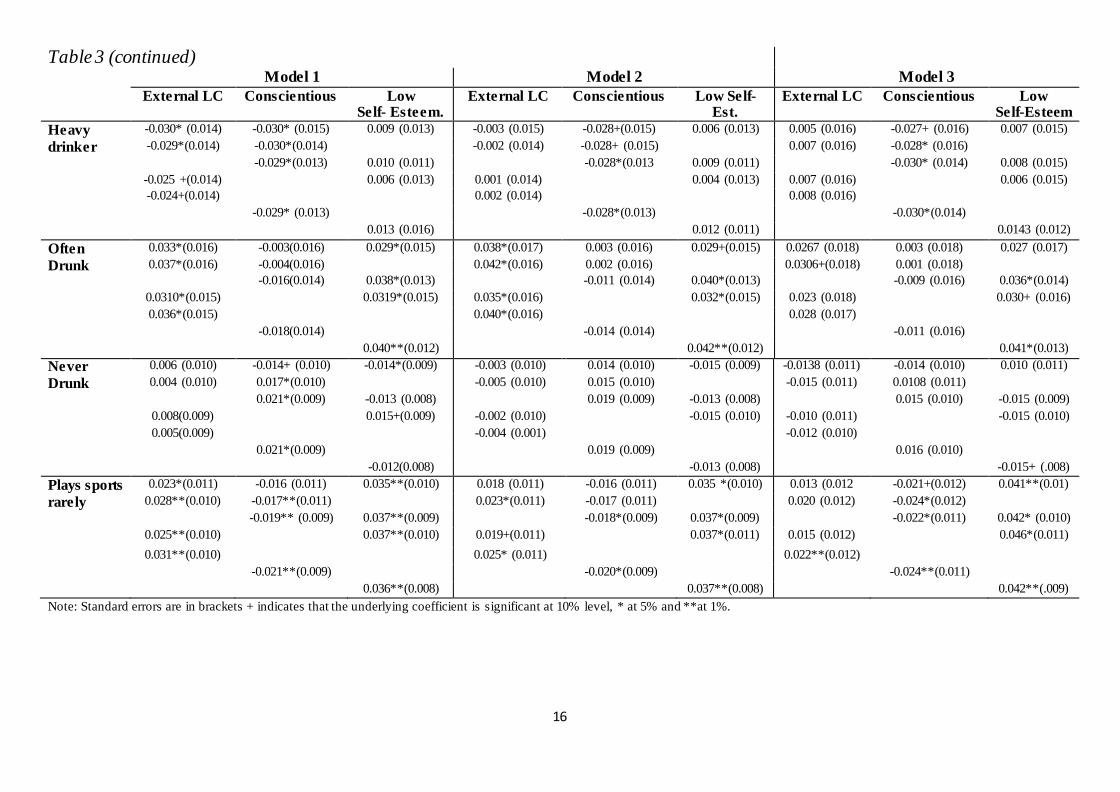
Table 3 (continued)
Model 1 Model 2 Model 3 External LC Conscientious Low
Self- Esteem. External LC Conscientious Low Self-
Est. External LC Conscientious Low
Self-Esteem Heavy -0.030* (0.014) -0.030* (0.015) 0.009 (0.013) -0.003 (0.015) -0.028+(0.015) 0.006 (0.013) 0.005 (0.016) -0.027+ (0.016) 0.007 (0.015) drinker -0.029*(0.014) -0.030*(0.014) -0.002 (0.014) -0.028+ (0.015) 0.007 (0.016) -0.028* (0.016) -0.029*(0.013) 0.010 (0.011) -0.028*(0.013 0.009 (0.011) -0.030* (0.014) 0.008 (0.015) -0.025 +(0.014) 0.006 (0.013) 0.001 (0.014) 0.004 (0.013) 0.007 (0.016) 0.006 (0.015) -0.024+(0.014) 0.002 (0.014) 0.008 (0.016) -0.029* (0.013) -0.028*(0.013) -0.030*(0.014) 0.013 (0.016) 0.012 (0.011) 0.0143 (0.012) Often 0.033*(0.016) -0.003(0.016) 0.029*(0.015) 0.038*(0.017) 0.003 (0.016) 0.029+(0.015) 0.0267 (0.018) 0.003 (0.018) 0.027 (0.017) Drunk 0.037*(0.016) -0.004(0.016) 0.042*(0.016) 0.002 (0.016) 0.0306+(0.018) 0.001 (0.018) -0.016(0.014) 0.038*(0.013) -0.011 (0.014) 0.040*(0.013) -0.009 (0.016) 0.036*(0.014) 0.0310*(0.015) 0.0319*(0.015) 0.035*(0.016) 0.032*(0.015) 0.023 (0.018) 0.030+ (0.016) 0.036*(0.015) 0.040*(0.016) 0.028 (0.017) -0.018(0.014) -0.014 (0.014) -0.011 (0.016) 0.040**(0.012) 0.042**(0.012) 0.041*(0.013) Never 0.006 (0.010) -0.014+ (0.010) -0.014*(0.009) -0.003 (0.010) 0.014 (0.010) -0.015 (0.009) -0.0138 (0.011) -0.014 (0.010) 0.010 (0.011) Drunk 0.004 (0.010) 0.017*(0.010) -0.005 (0.010) 0.015 (0.010) -0.015 (0.011) 0.0108 (0.011) 0.021*(0.009) -0.013 (0.008) 0.019 (0.009) -0.013 (0.008) 0.015 (0.010) -0.015 (0.009) 0.008(0.009) 0.015+(0.009) -0.002 (0.010) -0.015 (0.010) -0.010 (0.011) -0.015 (0.010) 0.005(0.009) -0.004 (0.001) -0.012 (0.010) 0.021*(0.009) 0.019 (0.009) 0.016 (0.010) -0.012(0.008) -0.013 (0.008) -0.015+ (.008) Plays sports 0.023*(0.011) -0.016 (0.011) 0.035**(0.010) 0.018 (0.011) -0.016 (0.011) 0.035 *(0.010) 0.013 (0.012 -0.021+(0.012) 0.041**(0.01) rarely 0.028**(0.010) -0.017**(0.011) 0.023*(0.011) -0.017 (0.011) 0.020 (0.012) -0.024*(0.012) -0.019** (0.009) 0.037**(0.009) -0.018*(0.009) 0.037*(0.009) -0.022*(0.011) 0.042* (0.010) 0.025**(0.010) 0.037**(0.010) 0.019+(0.011) 0.037*(0.011) 0.015 (0.012) 0.046*(0.011) 0.031**(0.010) 0.025* (0.011) 0.022**(0.012) -0.021**(0.009) -0.020*(0.009) -0.024**(0.011) 0.036**(0.008) 0.037**(0.008) 0.042**(.009) Note: Standard errors are in brackets + indicates that the underlying coefficient is significant at 10% level, * at 5% and **at 1%.
17
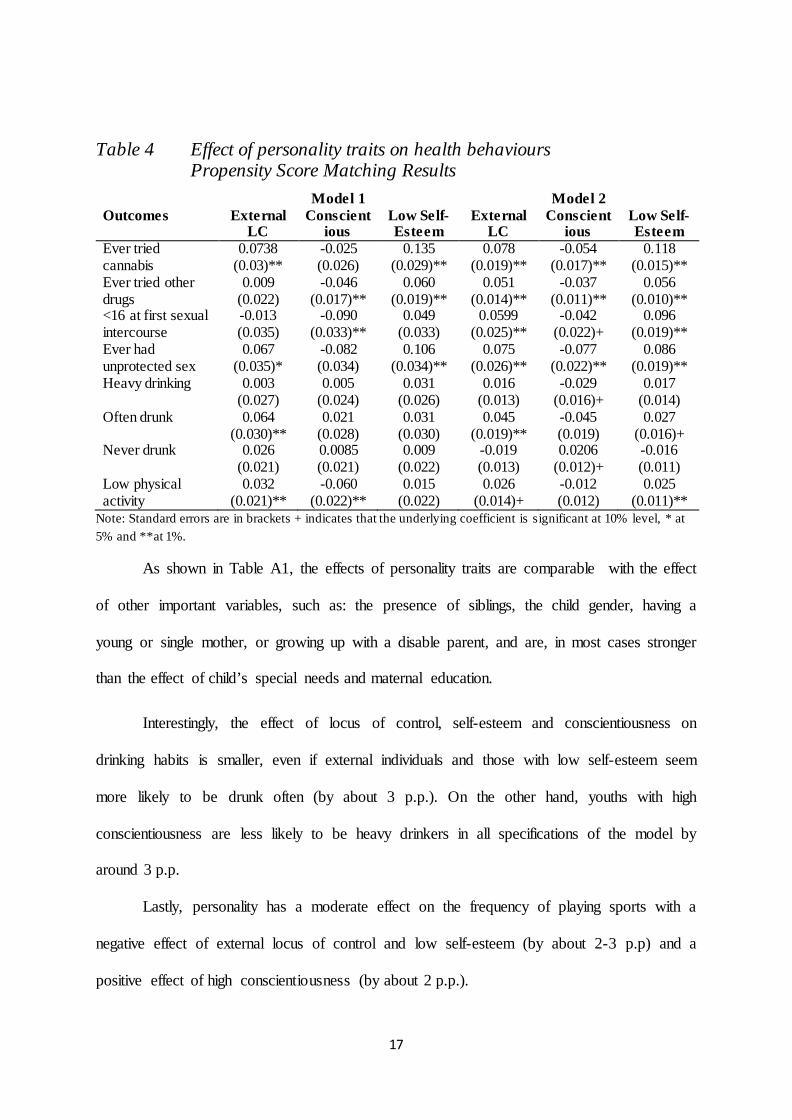
Table 4 Effect of personality traits on health behaviours Propensity Score Matching Results
Model 1 Model 2 Outcomes External
LC Conscient
ious Low Self- Esteem
External LC
Conscientious
Low Self-Esteem
Ever tried cannabis
0.0738 (0.03)**
-0.025 (0.026)
0.135 (0.029)**
0.078 (0.019)**
-0.054 (0.017)**
0.118 (0.015)**
Ever tried other drugs
0.009 (0.022)
-0.046 (0.017)**
0.060 (0.019)**
0.051 (0.014)**
-0.037 (0.011)**
0.056 (0.010)**
<16 at first sexual intercourse
-0.013 (0.035)
-0.090 (0.033)**
0.049 (0.033)
0.0599 (0.025)**
-0.042 (0.022)+
0.096 (0.019)**
Ever had unprotected sex
0.067 (0.035)*
-0.082 (0.034)
0.106 (0.034)**
0.075 (0.026)**
-0.077 (0.022)**
0.086 (0.019)**
Heavy drinking 0.003 (0.027)
0.005 (0.024)
0.031 (0.026)
0.016 (0.013)
-0.029 (0.016)+
0.017 (0.014)
Often drunk 0.064 (0.030)**
0.021 (0.028)
0.031 (0.030)
0.045 (0.019)**
-0.045 (0.019)
0.027 (0.016)+
Never drunk 0.026 (0.021)
0.0085 (0.021)
0.009 (0.022)
-0.019 (0.013)
0.0206 (0.012)+
-0.016 (0.011)
Low physical activity
0.032 (0.021)**
-0.060 (0.022)**
0.015 (0.022)
0.026 (0.014)+
-0.012 (0.012)
0.025 (0.011)**
Note: Standard errors are in brackets + indicates that the underlying coefficient is significant at 10% level, * at 5% and **at 1%.
As shown in Table A1, the effects of personality traits are comparable with the effect
of other important variables, such as: the presence of siblings, the child gender, having a
young or single mother, or growing up with a disable parent, and are, in most cases stronger
than the effect of child’s special needs and maternal education.
Interestingly, the effect of locus of control, self-esteem and conscientiousness on
drinking habits is smaller, even if external individuals and those with low self-esteem seem
more likely to be drunk often (by about 3 p.p.). On the other hand, youths with high
conscientiousness are less likely to be heavy drinkers in all specifications of the model by
around 3 p.p.
Lastly, personality has a moderate effect on the frequency of playing sports with a
negative effect of external locus of control and low self-esteem (by about 2-3 p.p) and a
positive effect of high conscientiousness (by about 2 p.p.).
18
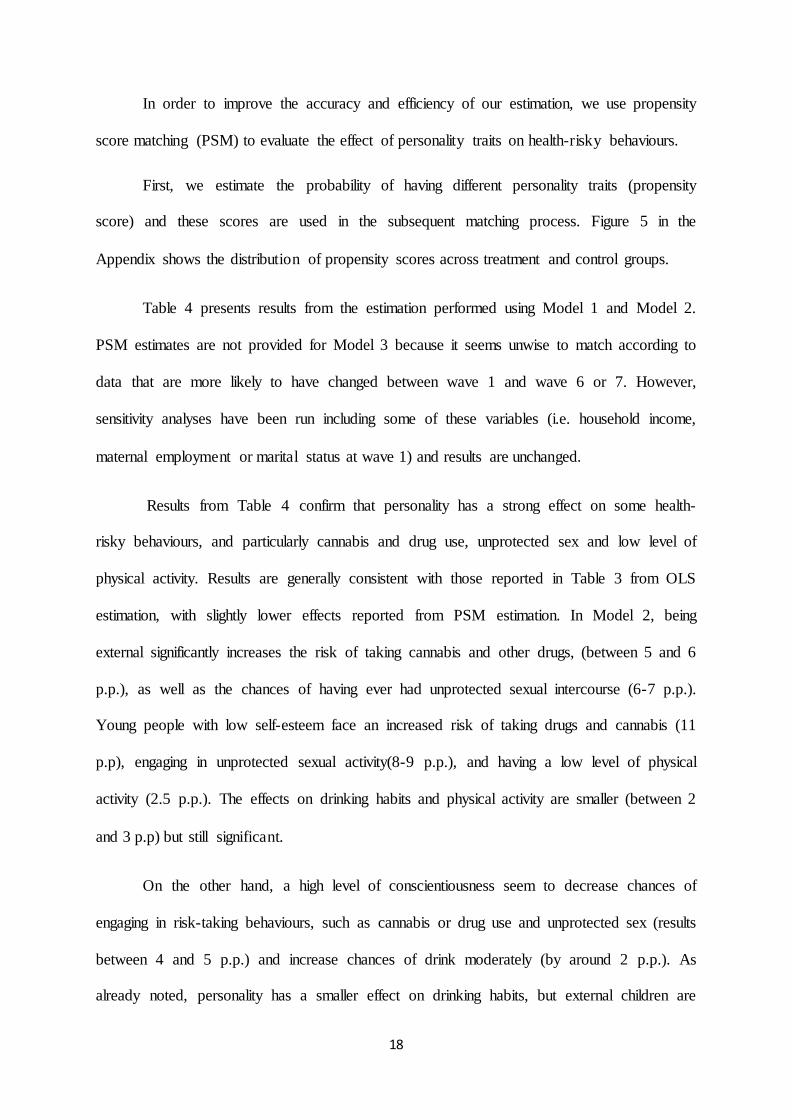
In order to improve the accuracy and efficiency of our estimation, we use propensity
score matching (PSM) to evaluate the effect of personality traits on health-risky behaviours.
First, we estimate the probability of having different personality traits (propensity
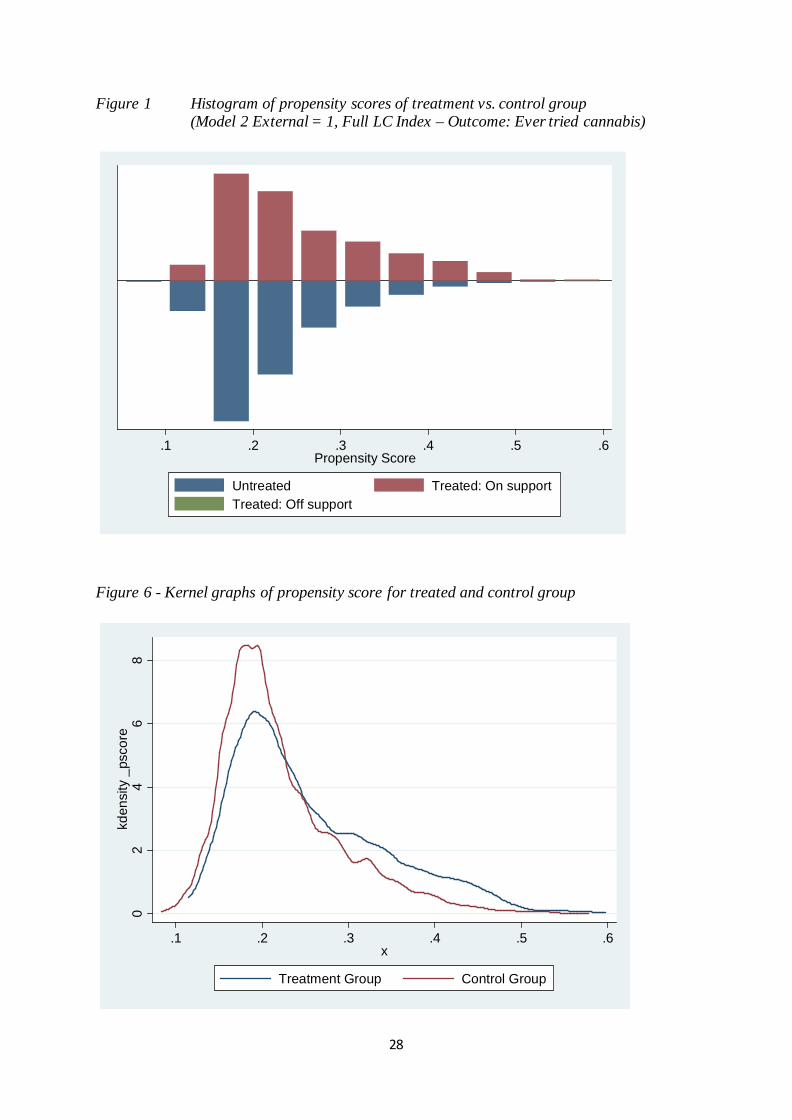
score) and these scores are used in the subsequent matching process. Figure 5 in the
Appendix shows the distribution of propensity scores across treatment and control groups.
Table 4 presents results from the estimation performed using Model 1 and Model 2.
PSM estimates are not provided for Model 3 because it seems unwise to match according to
data that are more likely to have changed between wave 1 and wave 6 or 7. However,
sensitivity analyses have been run including some of these variables (i.e. household income,
maternal employment or marital status at wave 1) and results are unchanged.
Results from Table 4 confirm that personality has a strong effect on some health-
risky behaviours, and particularly cannabis and drug use, unprotected sex and low level of
physical activity. Results are generally consistent with those reported in Table 3 from OLS
estimation, with slightly lower effects reported from PSM estimation. In Model 2, being
external significantly increases the risk of taking cannabis and other drugs, (between 5 and 6
p.p.), as well as the chances of having ever had unprotected sexual intercourse (6-7 p.p.).
Young people with low self-esteem face an increased risk of taking drugs and cannabis (11
p.p), engaging in unprotected sexual activity(8-9 p.p.), and having a low level of physical
activity (2.5 p.p.). The effects on drinking habits and physical activity are smaller (between 2
and 3 p.p) but still significant.
On the other hand, a high level of conscientiousness seem to decrease chances of
engaging in risk-taking behaviours, such as cannabis or drug use and unprotected sex (results
between 4 and 5 p.p.) and increase chances of drink moderately (by around 2 p.p.). As
already noted, personality has a smaller effect on drinking habits, but external children are
19
more likely to get drunk often (by around 5-6 p.p.). They are also more likely to not engage
in regular physical activity by around 3-4 p.p.
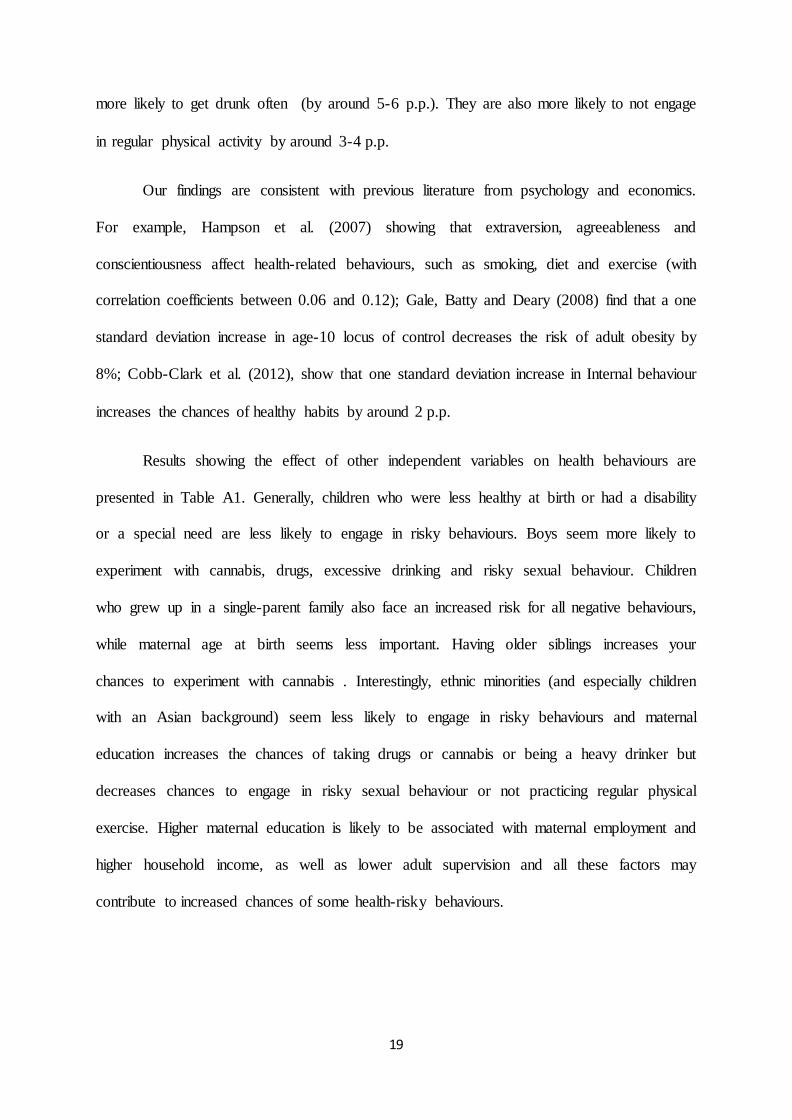
Our findings are consistent with previous literature from psychology and economics.
For example, Hampson et al. (2007) showing that extraversion, agreeableness and
conscientiousness affect health-related behaviours, such as smoking, diet and exercise (with
correlation coefficients between 0.06 and 0.12); Gale, Batty and Deary (2008) find that a one
standard deviation increase in age-10 locus of control decreases the risk of adult obesity by
8%; Cobb-Clark et al. (2012), show that one standard deviation increase in Internal behaviour
increases the chances of healthy habits by around 2 p.p.
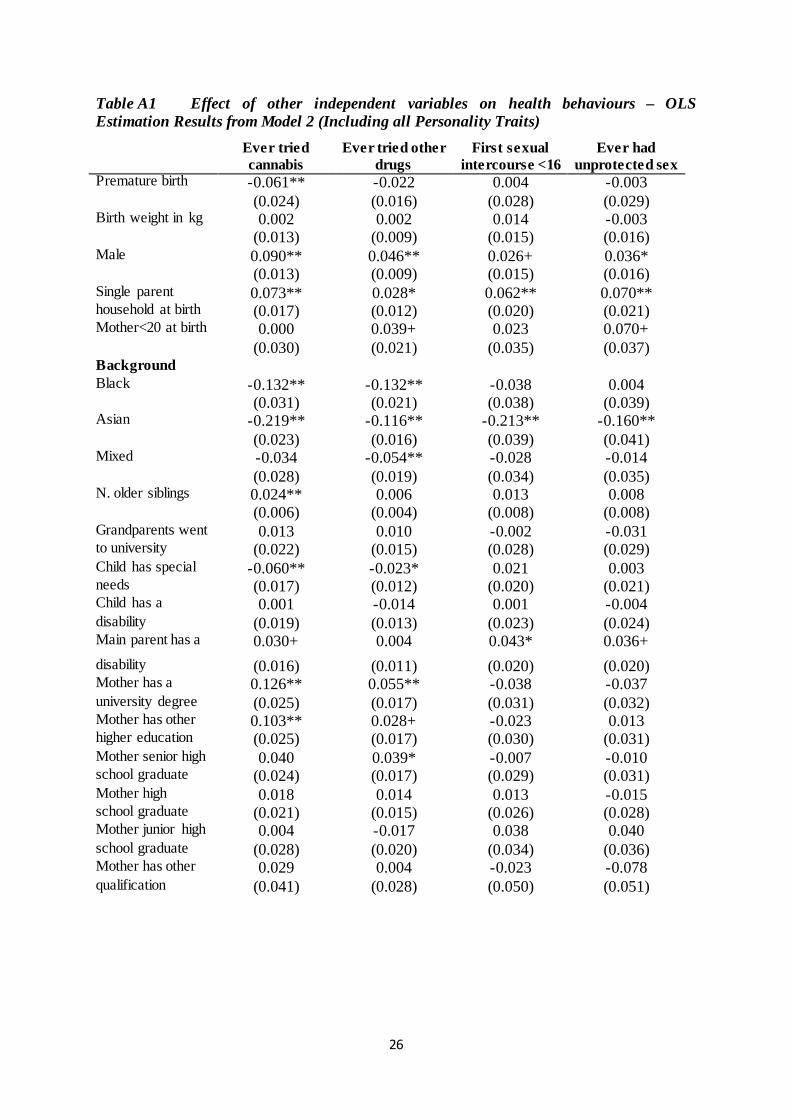
Results showing the effect of other independent variables on health behaviours are
presented in Table A1. Generally, children who were less healthy at birth or had a disability
or a special need are less likely to engage in risky behaviours. Boys seem more likely to
experiment with cannabis, drugs, excessive drinking and risky sexual behaviour. Children
who grew up in a single-parent family also face an increased risk for all negative behaviours,
while maternal age at birth seems less important. Having older siblings increases your
chances to experiment with cannabis . Interestingly, ethnic minorities (and especially children
with an Asian background) seem less likely to engage in risky behaviours and maternal
education increases the chances of taking drugs or cannabis or being a heavy drinker but
decreases chances to engage in risky sexual behaviour or not practicing regular physical
exercise. Higher maternal education is likely to be associated with maternal employment and
higher household income, as well as lower adult supervision and all these factors may
contribute to increased chances of some health-risky behaviours.
20
6. Conclusion
In this paper, we have investigated the effect of personality traits on health
behaviours. We have used the Longitudinal Study of Young People in England, which is a
rich source of information on English teenagers who were followed from age 14 for 7 waves.
We find that non-cognitive skills have a notable effect on the incidence of health-risky
behaviours and particularly, children with external locus of control and low self-esteem are
more likely to use cannabis and drugs, engage in risky sexual activity and get drunk often.
The size of the effect is statistically significant, economically important, and is comparable to
other important variables, such as sex of the child, family composition or family
circumstances at birth.
Our analysis is performed using Ordinary Least Squares and Propensity Score
Matching. We make extensive use of the amount of information contained in LSYPE and
gradually increase our set of independent variables, in order to try to control for all factors
affecting both personality and health behaviours. Our results are stable over different
specifications of our model. Propensity Score Matching allow us to find a group of children
who did not have a particular personality trait as similar as possible to our treatment group
(children who have that same personality characteristic), given our independent variables. We
can then compare outcomes between these two groups and check whether there are any
significant differences.
This analysis fills a gap in the existing literature, by providing new evidence on recent
British data. Governments across various Western countries have been devoting a significant
amount of resources to the improvement of adolescents’ well-being and there has been
considerable debate about the need to reduce the incidence of health risky behaviours among
teenagers. This paper provides further evidence of the importance of non-cognitive skills and
our results underline the potential positive effects of policy interventions targeting specific
21
negative attitudes and personality traits (such as external locus of control or low self-esteem)
among teenagers. However, further research is needed to assess the stability of our results in
the presence of selection on unobservables and to establish the transmission channels of the
effects.
Our results have important policy implications: policies aimed at promoting positive
personality traits have been proved to be particularly effective when targeting adolescence
(see Almlund et al., 2011 for a review and Bloom et al., 2009 and Martin et al., 2010 for
specific examples), while changes in personality become more difficult later in life (Borghans
et al., 2008). If personality is an important determinant of health-related choices in early
adulthood, these interventions will also decrease the incidence of health-risky behaviours.
22
References
Almlund, M., Duchworth, A.L., Heckman, J., Kaus, T. (2011), Personality Psychology and Economics, NBER Working Paper Series 16822.
Anderson, L.R., Mellor, J.M. (2008), Predicting Health Behaviors with an Experimental Measure of Risk Preference. Journal of Health Economics, 27, 1260-1274.
Arendt, JN. (2005), Does Education Cause Better Health? A Panel Data Analysis Using School Reforms for Identification. Economics of Education Review, 24, 149–160.
Berger, L.M., Hill, J., and Waldfogel, J. (2005), Maternity Leave, Early Maternal Employment and Child Health and Development in the US. Economic Journal, 115, 29-47.
Bloom, D., Gardenhire-Crooks, A., Mandsager, C. L. (2009). Reengaging High School Dropouts: Early Results of the National Guard Youth Challenge Program Evaluation. MDRC Report, New York
Bogg, T.B, Roberts, W. (2004), Conscientiousness and Health-related Behaviors: A Meta-analysis of the Leading Behavioral Contributors to Mortality. Psychological Bulletin, 130, 887–919.
Borghans, Duckworth, A., Heckman, J. Ter Weel B. (2008), The Economics and Psychology of Personality Traits, NBER Working Paper Series 13810.
Caliendo, M., Cobb-Clark, D. Uhelndorff A. (2010), Locus of Control and Job Search Strategies. IZA Discussion Paper No. 4750.
Chiteji, N. (2010). Time Preferences, Non-cognitive Skills and Well-being across the Life Course: Do Non-cognitive Skills Encourage Healthy Behavior? American Economic Review, 100, 200-204.
Cobb-Clark, D., Kassenboehmer, S.C., Schurer, S. (2012), Healthy Habits: The Connection between Diet, Exercise, and Locus of Control. IZA Discussion Paper No. 6789.
Conti, G., Heckman, J., Yi, J., Zhang, J. (2010). "Early Health Shocks, Parental Responses, and Child Outcomes." Unpublished manuscript, Department of Economics, University of Hong Kong.
Cutler D., Glaeser E. (2005) What Explains Differences in Smoking, Drinking, and Other Health-Related Behaviors? The American Economic Review, 95, 238-242.
Cutler, D., Lleras Muney, A. (2005), Understanding differences in health behaviors by education. Journal of Health Economics 29, 1-28.
Friedman, H.S., Kern, M.L., Reynolds, C.A. (2010), Personality and Health, Subjective Well-Being, and Longevity. Journal of Personality, 78, 179-216.
Gale, C.R., Batty, G. D., Deary, I.J. (2008), Locus of Control at Age 10 Years and Health Outcomes and Behaviors at Age 30 Years: The 1970 British Cohort Study." Psychosomatic Medicine,70, 397-403.
Goodman, A., B. Sianesi (2005), Early Education and Children’s Outcomes: How Long Do the Impacts Last? Fiscal Studies, 26, 513-548.
23
Grossman, M. (1975), The Correlation between Health and Schooling. In Household Production and Consumption, Terleckvj NE (ed.). Columbia University Press for the National Bureau of Economic Research: New York.
Grossman, M. (2000), The Human Capital Model. In Handbook of Health Economics, Culyer AJ, Newhouse JP (eds).North-Holland: Amsterdam.
Grossman, M. (2006), Education and Nonmarket outcomes. In Handbook of the Economics of Education, Hanushek E, Welch F (eds). North-Holland: Amsterdam.
Hamilton, H., Noh, S., Adlaf, E. (2009), Perceived Financial Status, Health, and Maladjustment in Adolescence. Social Science and Medicine, 68, 1527-1534.
Hampson, S.E., Goldberg, L.R., Vogt, T.M., Dubanoski J.P. (2007), Mechanisms by Which Childhood Personality Traits Influence Adult Health Status: Educational Attainment and Healthy Behaviors. Health Psychology, 26, 121-125.
Hampson, S.E., Tildesley, E., Andrews, J.A., Luyckx, K.and Mroczek, D.K. (2010), The Relation of Change in Hostility and Sociability During Childhood to Substance Use in Mid Adolescence. Journal of Research in Personality, 44, 103-114.
Heckman, J. J. (1979), Sample Selection Bias as a Specification Error. Econometrica, 47, 153-161.
Heckman, J.J., Stixrud, J., Urzua, S. (2006). The Effects of Cognitive and Noncognitive Abilities on Labor Market Outcomes and Social Behavior. Journal of Labor Economics, 24, 411-482.
Kern, M. L. and Friedman, H. S. (2008), Do Conscientious Individuals Live Longer?, Health Psychology, 27, 505-512.
Lleras-Muney A. (2005), The Relationship Between Education and Adult Mortality in the United States. Review of Economic Studies, 72: 189–221.
Martin L.R., Friedman H.S., Schwartz J.E. (2007), Personality and Mortality Risk across the Life Span: The Importance of Conscientiousness as a Biopsychosocial Attribute. Health Psychology, 26, 428-436.
Martins, Pedro S. (2010). Can Targeted, Non-Cognitive Skills Programs Improve Achievement? IZA Discussion Paper No. 5266
Mejier, S.A., Sinnemaa, G,. Bijstra, J. O., Mellenbergh, G.J., Wolters, W., H.G. (2002) Coping styles and locus of control as predictors for psychological adjustment of adolescents with a chronic illness, Social Science and Medicine, 54, 1453-1461.
Nonnemaker, J., McNeeley, C., Blum, R.W. (2003), Public and Private Domains of Religiosity and Adolescent Health Risk Behaviors: Evidence from the National Longitudinal Study of Adolescent Health. Social Science and Medicine, 57, 2049-2054.
Roberts, B.W., Kuncel, N.R., Shiner, R., Caspi, A., Goldberg L.R. (2007), The Power of Personality: The Comparative Validity of Personality Traits, Socioeconomic Status, and Cognitive Ability for Predicting Important Life Outcomes. Perspectives on Psychological Science, 2, 313-345.
Roche, K., Ahmend, S., Blum, R.W, (2008), Enduring Consequences of Parenting for Risk Behaviors from Adolescence into Early Adulthood. Social Science and Medicine, 66, 2023-2034.
24
Ruhm, C.J. (2008), Maternal Employment and Adolescent Development. Labour Economics, 15, 958-983.
Salovey, P., Rothman, A.J., Rodin, J., (1998). Health behavior. In: Gilbert, D.T., Fiske, S.T., Lindzey, G. (Eds.), Handbook of Social Psychology, vol. II. Oxford University Press, New York.
Savelyev, P.A. (2010), Conscientiousness, Education, and Longevity of High-Ability Individuals. Unpublished manuscript. University of Chicago, Department of Economics.
Unicef Innocenti Research Centre (2007), An Overview of Child Well-Being in Rich Countries in Unicef, Child poverty in perspective: An overview of child well-being in rich countries, Innocenti Report Card 7, 2007 UNICEF Innocenti Research Centre, Florence.
US Department for Health and Human Services, centers for Disease Control and Prevention (2011), Youth Risk Behaviour Surveillance – United States, 2011, Surveillance Summaries, 61.
Van Der Pol, M. (2011), Health, Education and Time Preferences. Health Economics, 20, 917-929.
World Health Organisation (2009), Global Health Risks. Mortality and burden of disease attributable to selected major risks. WHO, Geneva.
25
Appendix
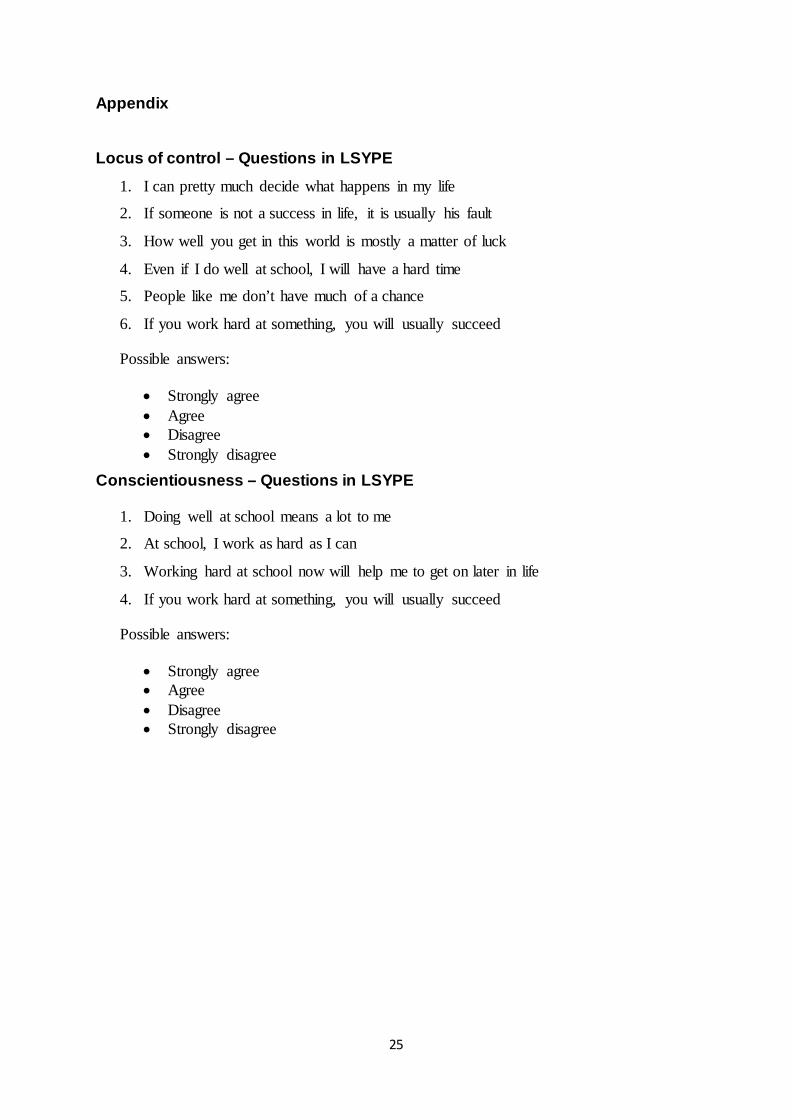
Locus of control – Questions in LSYPE
1. I can pretty much decide what happens in my life
2. If someone is not a success in life, it is usually his fault
3. How well you get in this world is mostly a matter of luck
4. Even if I do well at school, I will have a hard time
5. People like me don’t have much of a chance
6. If you work hard at something, you will usually succeed
Possible answers:
• Strongly agree • Agree • Disagree • Strongly disagree
Conscientiousness – Questions in LSYPE
1. Doing well at school means a lot to me
2. At school, I work as hard as I can
3. Working hard at school now will help me to get on later in life
4. If you work hard at something, you will usually succeed
Possible answers:
• Strongly agree • Agree • Disagree • Strongly disagree
26
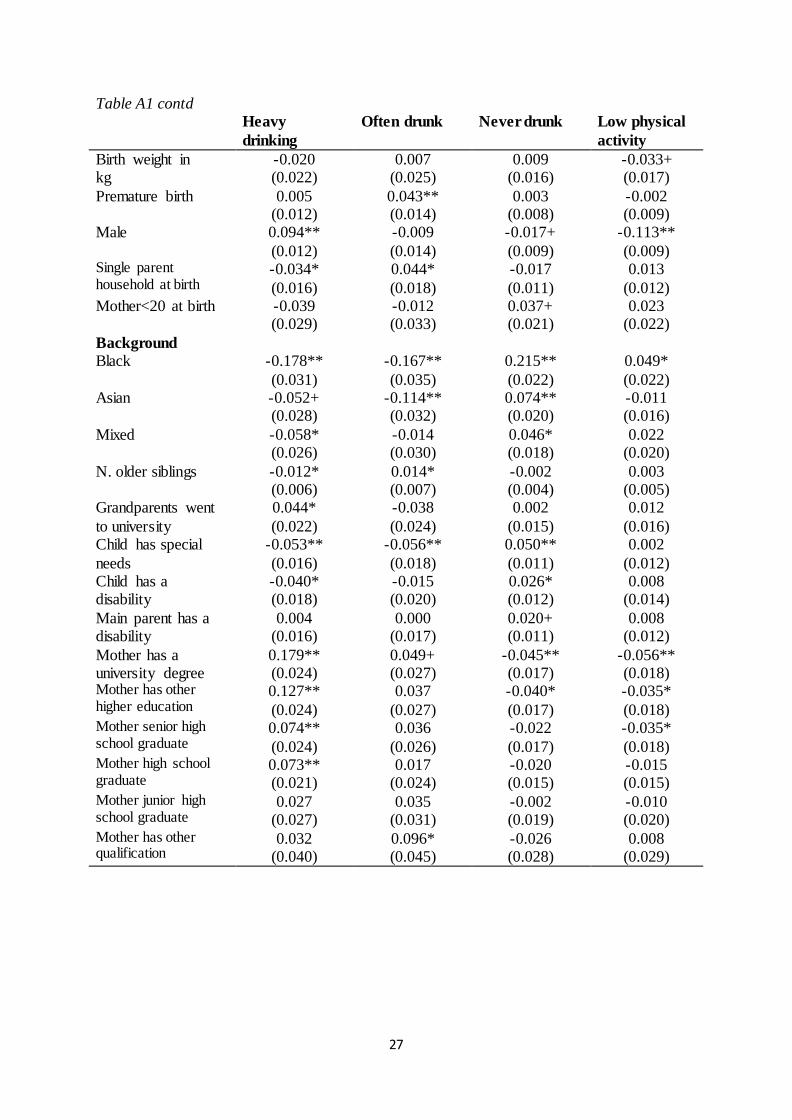
Table A1 Effect of other independent variables on health behaviours – OLS Estimation Results from Model 2 (Including all Personality Traits) Ever tried
cannabis Ever tried other
drugs First sexual
intercourse <16 Ever had
unprotected sex Premature birth -0.061** -0.022 0.004 -0.003 (0.024) (0.016) (0.028) (0.029) Birth weight in kg 0.002 0.002 0.014 -0.003 (0.013) (0.009) (0.015) (0.016) Male 0.090** 0.046** 0.026+ 0.036* (0.013) (0.009) (0.015) (0.016) Single parent 0.073** 0.028* 0.062** 0.070** household at birth (0.017) (0.012) (0.020) (0.021) Mother<20 at birth 0.000 0.039+ 0.023 0.070+ (0.030) (0.021) (0.035) (0.037) Background Black -0.132** -0.132** -0.038 0.004 (0.031) (0.021) (0.038) (0.039) Asian -0.219** -0.116** -0.213** -0.160** (0.023) (0.016) (0.039) (0.041) Mixed -0.034 -0.054** -0.028 -0.014 (0.028) (0.019) (0.034) (0.035) N. older siblings 0.024** 0.006 0.013 0.008 (0.006) (0.004) (0.008) (0.008) Grandparents went 0.013 0.010 -0.002 -0.031 to university (0.022) (0.015) (0.028) (0.029) Child has special -0.060** -0.023* 0.021 0.003 needs (0.017) (0.012) (0.020) (0.021) Child has a 0.001 -0.014 0.001 -0.004 disability (0.019) (0.013) (0.023) (0.024) Main parent has a 0.030+ 0.004 0.043* 0.036+ disability (0.016) (0.011) (0.020) (0.020) Mother has a 0.126** 0.055** -0.038 -0.037 university degree (0.025) (0.017) (0.031) (0.032) Mother has other 0.103** 0.028+ -0.023 0.013 higher education (0.025) (0.017) (0.030) (0.031) Mother senior high 0.040 0.039* -0.007 -0.010 school graduate (0.024) (0.017) (0.029) (0.031) Mother high 0.018 0.014 0.013 -0.015 school graduate (0.021) (0.015) (0.026) (0.028) Mother junior high 0.004 -0.017 0.038 0.040 school graduate (0.028) (0.020) (0.034) (0.036) Mother has other 0.029 0.004 -0.023 -0.078 qualification (0.041) (0.028) (0.050) (0.051)
27
Table A1 contd Heavy
drinking Often drunk Never drunk Low physical
activity Birth weight in kg
-0.020 0.007 0.009 -0.033+ (0.022) (0.025) (0.016) (0.017)
Premature birth 0.005 0.043** 0.003 -0.002 (0.012) (0.014) (0.008) (0.009)
Male 0.094** -0.009 -0.017+ -0.113** (0.012) (0.014) (0.009) (0.009)
Single parent household at birth
-0.034* 0.044* -0.017 0.013 (0.016) (0.018) (0.011) (0.012)
Mother<20 at birth -0.039 -0.012 0.037+ 0.023 (0.029) (0.033) (0.021) (0.022)
Background Black -0.178** -0.167** 0.215** 0.049*
(0.031) (0.035) (0.022) (0.022) Asian -0.052+ -0.114** 0.074** -0.011
(0.028) (0.032) (0.020) (0.016) Mixed -0.058* -0.014 0.046* 0.022
(0.026) (0.030) (0.018) (0.020) N. older siblings -0.012* 0.014* -0.002 0.003
(0.006) (0.007) (0.004) (0.005) Grandparents went to university
0.044* -0.038 0.002 0.012 (0.022) (0.024) (0.015) (0.016)
Child has special needs
-0.053** -0.056** 0.050** 0.002 (0.016) (0.018) (0.011) (0.012)
Child has a disability
-0.040* -0.015 0.026* 0.008 (0.018) (0.020) (0.012) (0.014)
Main parent has a disability
0.004 0.000 0.020+ 0.008 (0.016) (0.017) (0.011) (0.012)
Mother has a university degree
0.179** 0.049+ -0.045** -0.056** (0.024) (0.027) (0.017) (0.018)
Mother has other higher education
0.127** 0.037 -0.040* -0.035* (0.024) (0.027) (0.017) (0.018)
Mother senior high school graduate
0.074** 0.036 -0.022 -0.035* (0.024) (0.026) (0.017) (0.018)
Mother high school graduate
0.073** 0.017 -0.020 -0.015 (0.021) (0.024) (0.015) (0.015)
Mother junior high school graduate
0.027 0.035 -0.002 -0.010 (0.027) (0.031) (0.019) (0.020)
Mother has other qualification
0.032 0.096* -0.026 0.008 (0.040) (0.045) (0.028) (0.029)
28
Figure 1 Histogram of propensity scores of treatment vs. control group (Model 2 External = 1, Full LC Index – Outcome: Ever tried cannabis)
Figure 6 - Kernel graphs of propensity score for treated and control group
.1 .2 .3 .4 .5 .6Propensity Score
Untreated Treated: On supportTreated: Off support
02
46
8kd
ensi
ty _
psco
re
.1 .2 .3 .4 .5 .6x
Treatment Group Control Group