the effect of microporosity on transport properties in porous media
TRANSCRIPT

Accepted Manuscript
The effect of microporosity on transport properties in porous media
Ayaz Mehmani, Maša Prodanović
PII: S0309-1708(13)00196-6DOI: http://dx.doi.org/10.1016/j.advwatres.2013.10.009Reference: ADWR 2125
To appear in: Advances in Water Resources
Received Date: 2 May 2013Revised Date: 9 October 2013Accepted Date: 11 October 2013
Please cite this article as: Mehmani, A., Prodanović, M., The effect of microporosity on transport properties inporous media, Advances in Water Resources (2013), doi: http://dx.doi.org/10.1016/j.advwatres.2013.10.009
This is a PDF file of an unedited manuscript that has been accepted for publication. As a service to our customerswe are providing this early version of the manuscript. The manuscript will undergo copyediting, typesetting, andreview of the resulting proof before it is published in its final form. Please note that during the production processerrors may be discovered which could affect the content, and all legal disclaimers that apply to the journal pertain.

1
The effect of microporosity on transport properties in porous media 1
2
Ayaz Mehmani1 and Maša Prodanović1 3
4 1Department of Petroleum and Geosystems Engineering, The University of Texas at Austin, 5
1 University Station, C0300, Austin, TX 78712 6
7
*Corresponding author, email [email protected], phone +1-512-471-0839, fax +1-512-8
471-9605 9
10
11
Abstract 12
13
Sizeable amounts of connected microporosity with various origins can have a profound effect on 14
important petrophysical properties of a porous medium such as (absolute/relative) permeability 15
and capillary pressure relationships. We construct pore-throat networks that incorporate both 16
intergranular porosity and microporosity. The latter originates from two separate mechanisms: 17
partial dissolution of grains and pore fillings (e.g. clay). We then use the reconstructed network 18
models to estimate the medium flow properties. In this work, we develop unique network 19
construction algorithms and simulate capillary pressure – saturation and relative permeability - 20
saturation curves for cases with inhomogeneous distributions of pores and micropores. 21
Furthermore, we provide a modeling framework for variable amounts of cement and connectivity 22
of the intergranular porosity and quantifying the conditions under which microporosity dominates 23
transport properties. In the extreme case of a disconnected inter-granular network due to 24
cementation (where the microporous regions, if existent, remain connected), a range of 25
saturations within which neither fluid phase is capable of flowing emerges. To our knowledge, 26
this is the first flexible pore scale model, from first principles, to successfully approach this 27
behavior observed in tight reservoirs. 28
29
Keywords 30
porous media, multiphase flow, relative permeability, two-scale network flow model, 31
microporosity 32
33
1. Introduction 34
35
We propose a new network model for capillary pressure / relative permeability - saturation 36
relationships based on the pore level petrophysical description of porosity in multiple scales. We 37
first clarify the terminology we use in this work. We classify porosity into two categories, namely 38

2
macroporosity and microporosity. Macroporosity refers to the original intergranular (primary) 1
porosity in typical subsurface porous materials including those intergranular pores that remain 2
open after cementation and compaction. Void spaces that reside inside grains (and act “in 3
parallel” to macropores, e.g. due to dissolution) or inside materials filling the macropores (and 4
act “in series” to the macropores, e. g. porosity within clay) will be referred to as micropores. 5
The parallel and series terminology is conceptual and borrowed from common analogy of 6
(resistance to) flow of fluid in porous medium and (resistance to) the flow of electrical current in 7
circuits. The interplay of macroporosity and microporosity on transport properties is difficult to 8
observe experimentally: for instance, a single imaging technique can rarely capture both length 9
scales in desired detail. Herein lies the motivation to develop a deterministic simulation model 10
that sheds light into transport mechanisms between the two porosity types. All reported lengths 11
in this work are normalized by the grain sizes. Although we analyzed each porosity class 12
separately, both classes co-exist in our porous medium model, and are treated simultaneously. 13
Further, while we present the results only based on granular media, the algorithm has enough 14
flexibility to be used on image-based networks (see preliminary results in [1]). 15
16
1.1. Inadequacies in the conventional relationships for heterogeneous porous media 17
18
Conventional relationships, such as Archie’s law for resistivity, the Carman-Kozeny permeability 19
estimate and the Brooks-Corey parameterization of relative permeability, were developed for 20
rocks whose pores are mostly intergranular and well connected. The conventional models and 21
theoretical relationships therefore cannot be expected to do well in cases where microporosity 22
dominates the pore space. Such domination is common in many carbonates and tight gas 23
sandstones (TGSS). For instance, most TGSS with porosities less than 10% exhibit steep 24
capillary-pressure curves, low permeability, and high irreducible saturations at drainage and 25
imbibition [2]. The authors in [2] fitted many TGSS experimental curves, but such fits do not 26
necessarily offer qualitative understanding behind the observed behavior. It would thus be 27
instructive to generate the behavior from first principles. 28
29
Carbonate rocks are another class of rocks with highly interconnected and heterogeneous 30
distribution of porous and microporous regions [3]. These rocks are therefore difficult to classify 31
[4] and their experimental behavior is hard to explain [5]. This leads us further to contend that, 32
when macroporosity and microporosity are considered separately in a porous medium, the 33

3
multiphase constitutive relationships are not a simple function of equivalent, separate 1
constitutive relationships. 2
3
Network models that consider the single length scale for either pore sizes or connectivity are 4
often inadequate in modeling complex media. Mousavi and Bryant [6] attempted to characterize 5
TGSS by numerically cementing a wide range of sphere packs (for overview of network models, 6
see Section 2), which is a valid approach in modeling conventional sandstones [7]. 7
Nevertheless, the wide range of pore sizes observed, and the high capillary pressures 8
measured, could not be simulated by the conventional, single-scale network model. To 9
circumvent this issue in the absence of the actual TGSS network, the authors [6] used the 10
spatial distribution of a conventional network that was representative of sandstone with a 11
porosity of 5%. They used throat sizes that matched the TGSS distribution from a Green River 12
basin in Wyoming and simulated the drainage curves in an attempt to match the experimental 13
mercury porosimetry data. Neither a qualitative nor a quantitative match ensued. 14
15
In tight gas sandstones, relative permeability curves can have a range of fairly large gas and 16
water saturations in which neither phase holds effective (measurable) flow capacities 17
(sometimes referred to as “permeability jail” [8], defined for rocks with absolute permeability < 18
0.05mD in the region where both relative permeabilities are less than 0.02). Simulations by Silin 19
et al. [9] approach this type of behavior using a direct simulation of imbibition in imaged TGSS 20
samples characterized by thin microcracks. However, the microporosity connecting to cracks 21
was poorly resolved, and its overall volume and influence are not clear. 22
23
1.2 Hypothesis and objective of this paper 24
25
We hypothesize that ignoring microporosity, and specifically how it connects to macroporosity in 26
pore scale modeling, is the main reason why existing functional relationships (correlations) in 27
many cases do not match experimental data (either qualitatively or quantitatively). Our objective 28
is to develop a flexible model that can consider a wide range of spatial distributions for macro- 29
and microporosity, as well as their (inter)connectivity, and thus overcome the limitations of 30
available models (see Section 1.3). With the developed model, we can begin to understand and 31
systematically quantify the conditions under which microporosity dominates the transport 32
properties and needs to be explicitly accounted for. 33
34

4
We present an algorithm to geometrically match pore throat networks from two separate scales 1
(and possibly from two different imaging modalities). In these networks, the boundary between 2
the length scales can take an arbitrary shape. For clarity, in this work we focus on construction 3
from model granular media, but a similar algorithm can be devised for imaged porous media 4
(see Section 4.2). Since the resultant pore network is a single entity (i.e. all scales are 5
deterministically included and dealt with simultaneously), we can apply existing network 6
modeling techniques without requiring any additional "bridging physics" to stitch the length 7
scales together. We present results on estimated transport properties from these two -scale 8
media. Before we proceed with the method description (in Section 2), we briefly overview the 9
existing models with similar objectives and their current limitations. 10
11
1.3 Pore scale modeling of multiphase flow on multiple length scales 12
13
When modeling multi-phase fluid flow, one must account for processes occurring on a broad 14
range of scales. In particular, the detailed structure of the pore space can play a critical role in 15
determining the spatial distribution of fluid phases and ultimately influences the macroscopic 16
flow properties. Different length scales often demand different approaches. A direct simulation 17
within a geometrically detailed medium is very costly. Hence, modeling at the pore scale is often 18
done after mapping the pore space onto a representative network of idealized pores and 19
throats. Fluid displacements are then simulated through discrete events (for overview of 20
network models refer to Section 2.1) on the network. At larger scales, one usually constructs 21
continuum numerical models, in which individual grid blocks implicitly contain sufficient pores so 22
that the system within each grid block evolves smoothly with time. Large (continuum) scale 23
models all require parameters and constitutive relationships that are provided by pore scale 24
models, theory or experiments. Continuum models capable of accounting for two scales - the 25
so-called dual permeability models [10]–[12] - have been constructed, but they all require prior 26
knowledge of constitutive relationships. Efforts have also been made in building hybrid methods 27
that couple regions, modeled via pore scale networks, with regions that are treated with 28
continuous approaches [13]. 29
30
We briefly overview pore scale methods that incorporate microporosity. Wu and coauthors [14] 31
showed the importance of including microscale pores using a direct lattice-Boltzmann based 32
simulation of drainage capillary pressure in imaged pore spaces. The simulation was first run by 33
omitting the submicron pores in a two-scale siltstone reconstruction, and then iteratively adding 34

5
stochastically generated submicron pores. A significant difference in capillary pressure 1
threshold and residual saturation in drainage was observed in spite of the fact that both length 2
scales were well connected. The model was based on a single image, did not report on relative 3
permeability, and prohibited modification in the relative spatial position of the microporosity and 4
macroporosity, all of which issues we address in this work. Toumelin [15] on the other hand, 5
studied the effect of microporosity on the electrical properties (Archie’s cementation and 6
saturation exponents m and n respectively) through the random walk method in model 7
carbonates with well-connected intergranular porosity. The authors concluded that the intra-8
granular porosity (microporosity) added in parallel with the intergranular porosity 9
(macroporosity) did not have much effect on the cementation factor in water wet media (m 10
changed from 2 to 1), but had a noticeable effect on the resistivity index for oil wet rocks. We 11
work with similar models, but include the ability to vary intergranular porosity connectivity as well 12
as the spatial position of microporosity. In this work we focus on fluid flow rather than electrical 13
properties. Finally, Youssef at el. [16] modeled carbonates using the macro- and microporosity 14
information estimated from high resolution micro-tomography images. The macroporous 15
network model was augmented with cuboids that represented microporous regions and were 16
placed in parallel with macroporosity. The physical size (cross-sectional area and length) of the 17
microporous regions was based upon upscaled (effective) parameters and was thus somewhat 18
arbitrary, but the estimated pore volume was preserved. We present microporosity that acts 19
both in parallel and in series with the macroporosity. 20
21
22
2. Methods 23
24
For the benefit of the readers new to the area, the first two Methods subsections give a general 25
overview of pore network modeling (Section 2.1), and the network generation method we use 26
(Section 2.2). Those familiar with the topic can proceed to Section 2.3. 27
28
29
2.1 Pore network modeling overview 30
31
Theoretical predictions of macroscopic two-phase flow in a porous medium can be achieved by 32
averaging the Navier-Stokes equations at the pore scale assuming appropriate boundary 33
conditions. Darcy’s equation can be obtained and is commonly used in larger scale reservoirs 34

6
[17]. However, obtaining a closed constitutive system of averaged equations requires the 1
introduction of constitutive relationships between the different parameters, such as capillary 2
pressure-saturation and relative permeability-saturation. 3
4
Further, in many porous media main pathways are of dimension 10-5m or less, and interfacial 5
tension between (immiscible) fluid phases plays a significant role in determining fluid 6
configurations. The ratio between viscous and capillary pressure drop is characterized as a 7
dimensionless capillary number NCa = µv/σ, where µ is the viscosity of the wetting phase, v the 8
characteristic velocity magnitude and σ the interfacial tension between the phases. For capillary 9
number less than approximately 10-4, the multiphase flow is said to be dominated by capillary 10
(interfacial) forces [18]. In case of the single phase flow, we assume laminar flow given the very 11
small throat sizes. 12
13
Network flow modeling was pioneered by [19]–[21] and provides a means to link the microscale 14
description of the medium (topology and geometry) with macroscopic fluid properties such as 15
the relationships between saturation, capillary pressure and interfacial area. Network models 16
bring capillarity and viscosity together, and in contrast with averaging/homogenization 17
approaches, stress capillary forces and their control of flow through the connected network of 18
pores (openings, pore bodies, sites) and throats (narrow channels, necks, bonds). A network 19
model aims at good representation of pore and throat interconnectivity in a porous medium. 20
While pores and throats are depicted via simple geometrical shapes, the models retain a subset 21
of the realistic microscale properties (such as pore/throat size or coordination number 22
distribution). Reviews on network flow models [22], [23] have more details on the models and 23
their historical development. 24
25
2.1.1. Quasi-static network flow model 26
27
In this work we simulate both single and two phase steady state (equilibrium) flows. Basic 28
assumptions of modeling single fluid in a network of pores and throats is that the resistance to 29
flow in the pore volumes can be neglected since the diameters of the pores are much greater 30
than the diameters of the throats. Thus the pore network model can be represented by pore 31
volumes, with pressures pi (or potentials), connected by throats that control fluid flow through 32
viscous forces. If a channel is completely filled with a single fluid, the flow rate along the channel 33
from pore i to pore j is given by qij= gij(pi-pj) where gij is the throat conductance. At each pore, 34

7
mass balance is enforced, i.e. sum of all of the flow rates at steady state is zero. Enforcing 1
mass balance at each pore, together with set pressures at inlet and outlet boundaries and a no-2
flow condition at all the other boundaries, results in a system of linear equations (with pore 3
pressures the unknowns). Thus, the calculation of flow rate through the entire network, and 4
ultimately permeability of the medium, is straightforward. 5
6
We assume that the throat conductance is based on the Hagen-Poiseulle steady state flow 7
solution in a cylinder inscribed into the throat channel (i.e. no-slip wall boundary condition is 8
inherent in the solution). Most of our two-scale networks are normalized with respect to the grain 9
radius; nevertheless we assume that flow on both length scales falls into a Hagen-Poiseulle 10
regime. It is important to note that for tube radii less than 100nm, the apparent gas permeability 11
has a nonlinear dependence on pressure (enhanced by diffusion and gas slip wall boundary 12
condition, see [24] as well as discussion in Section 4.2). Presently we do not assume any 13
nonlinear solution with pressure, but point the interested reader to [25]. 14
15
Fluid menisci in porous media at equilibrium are known to be surfaces of constant curvature, 16
satisfying Young-Laplace equation: 17
18
cP Cσ=
19
1 2
1 1C
R R= +
20
21
where σ is the interfacial tension, Pc is the corresponding capillary pressure of the two fluids, 22
is the curvature (actually, twice the mean curvature of the interface) and, R1 and R2 are the 23
principal radii of curvatures in two orthogonal directions. 24
25
In a slow displacement, it is justified to model the interface as evolving through a series of 26
interfaces of constant curvature (i.e. equilibrium states). Whether the curvature increases or 27
decreases is dependent upon whether the simulation is for drainage or imbibition. In order to 28
simulate such displacements in a network, a priori knowledge of the critical curvatures (under 29
which each throat drains or pore imbibes) is essential. 30
31
(1)
(2)

8
Two phase flow configurations at drainage are based on the concept of critical throat curvature 1
(for drainage) and pore curvature (for imbibition). For sphere-packs based network models we 2
use the formulation by Mason and Mellor [26] slightly modified for our systems: 3
4
5
6
where C is the drainage critical curvature, Rinscribed is the radius of the largest sphere that can be 7
inscribed into the throat or pore, Ravg is the average sphere radius of the original packing and R 8
is the average radius of the rescaled grain pack (if we are in a microporous region, see section 9
Section 2.3; if in macroporous region then R=Ravg). For a discussion on curvature criteria, 10
please refer to [27]. Note that the ratio scales the correction term 1.6 from [26] to 11
micropores. Capillary pressure curves obtained for the single scale model compares well with 12
existing similar models in the literature [28], and drainage relative permeability curves computed 13
for the obtained fluid configurations compare well with [29]. 14
15
Dynamic network modeling incorporates transient behavior, however it is more computationally 16
involved [23] and has not been used in this work; nonetheless it presents a possible future 17
extension to our work. 18
19
2.2 Network generation approach 20
21
While the concept of pore-throat networks is relatively simple, the construction of a pore-throat 22
network that is true to the porous medium of interest is a non-trivial task and thus multiple 23
approaches are available. In this work, we use Delaunay tessellation of grain centers that is 24
commonly used for sphere packings and granular materials [26], [30], [31]. A schematic 25
overview is shown in Figure 1. Void spaces within tetrahedral cells resulting from tessellation of 26
grain centers form pores, and the tetrahedron sides are the narrowest parts of the pore space 27
called throats (bottlenecks for flow). The geometry of the pore space is then simplified as pores 28
(spheres or other simple geometrical objects of equivalent volume) that are connected via 29
throats (cylinders of different cross-sections). We perform no post-processing (such as those 30
done by [31]), of this network, thus all interior pores in the network have exactly four neighbors. 31
The networks in this work do not have periodic boundaries. 32

9
1
2.2.1 Modeling Heterogeneous Media 2
3
While there has been little effort directed towards network modeling of TGSS, there has been a 4
number of studies conducted on network modeling of heterogeneous media. Most of the time, 5
very wide and carefully correlated pore and throat size distributions, are spread over a known 6
structured medium [32], [33]. One shortcoming of this approach is that the underlying network 7
topology itself does not exhibit any heterogeneity, but only the sizes of the pores and throats do. 8
This is quite a severe deficiency: it means that the volume fraction contributed by the small 9
pores is insignificant, since their number density was no greater than pores with 1000 times the 10
volume. The method proposed here does not suffer from this deficiency. Another natural model 11
to use when constructing a network model of a pore-space would be the so-called “scale-free” 12
networks [34], that have an essentially fractal topology. The main disadvantage of such 13
networks is that they don’t embed well in 3D Euclidean space – i.e. one invariably needs to 14
have some throats connecting non-adjacent pores. Real porous media might have pores on 15
different scales, but the pores nevertheless span a finite size range and are embedded in a 16
Euclidean space. 17
18
Many packing algorithms (such as sphere-packing algorithm used in this work, [35]) are capable 19
of creating heterogeneous grain packings with a wide distribution of grain sizes. Pore-network 20
model construction for these packings is typically done via Delaunay tessellation (DT) of the 21
grain centers. DT, however, struggles with creating meaningful pores e. g. where very 22
numerous small grains touch a large grain and results in many distorted pores. We have 23
exemplified this situation elsewhere [36]. Voro++ library (http://math.lbl.gov/voro++/) can create 24
weighted Voronoi tessellation (dual of DT) for packings with wide range of sizes and it could be 25
extended to create pore throat networks (private communication with Dr. C. Rycroft). Alas, to 26
our knowledge no successful attempt exists to date. 27
28
2.3 Two-scale pore network construction 29
30
We will refer to the pore-throat network that corresponds to the inter-granular porosity as 31
macronetwork, and any network mapping the microporosity as micronetwork. Main algorithm 32
steps are as follows: 33
34

10
(1) Construct a macronetwork of the inter-granular pore space (see Section 2.2) 1
(2) Designate microporous regions (these regions could be individual grains e.g. regions of 2
the partially dissolved solid phase, or individual pores containing porous fillers such as 3
clay). In this work, we use f to denote the fraction of macropores or grains that contain the 4
micropores. 5
(3) Choose a scaling factor b for microporous regions (ratio of the macro to micro length 6
scale, noting that different regions can have different scaling factors). Although we used 7
integer scaling factors in this work, the choice of b is arbitrary and non-integer numbers 8
can be used as well. 9
(4) Rescale and map a microporosity network onto each designated microporous region; 10
retain the pores and throats of the mapped network that fall within the microporous region 11
and connect them with all the existing pores and throats (macro or micro). Repeat the 12
procedure until all of the microporous regions are processed. 13
14
Steps (1)-(4) result in a multiscale network that contains both macroporosity and microporosity. 15
16
Before we proceed with a more detailed explanation of the algorithm, we comment on the origin 17
of the micronetwork. This work uses networks representative of granular media on both scales. 18
This is simply a matter of convenience, however, and we do not intend to imply that 19
microporosity is granular in nature: most are not granular at all. The micronetwork that is to be 20
rescaled onto microporous regions should resemble the structure of microporosity as much as is 21
known or possible (for example quantification of microporosity due to dissolution and within clay, 22
see [37] and [38] respectively). For instance, if a detailed SEM image is available, one might 23
infer the sizes of small grains within partially dissolved grains or pore sizes within the clay-filled 24
regions. (Note that SEM does not provide 3D structural information, only 2D). Then the network 25
to be rescaled could be that reconstructed for sphere packing which has grains (or pore sizes) 26
that reflect the sizes observed within partially dissolved grains. 27
28
2.3.1 Construction for grain-filling microporosity 29
30
For a granular medium, we process the medium grain by grain. If simulated sphere packings are 31
used, we know all of the information necessary to (analytically) define each grain. Note that if a 32
granular medium or weakly cemented sandstone is imaged, then individual grains can be found 33
by grain partitioning algorithms [39]. For each grain that is designated as microporous, we find 34

11
its bounding box and map/rescale the micronetwork from its original bounding box to the grain. 1
Each pore of the rescaled network is subsequently tested. If the pore center falls within the grain 2
in question, it is added to the main network (that is, the multiscale network being constructed). If 3
the pore center falls within the pore space it is not added, we locate the pore it belongs to in the 4
macronetwork and label it accordingly (note that for the macronetwork, we need precise 5
information on the location of all of its pores). Next, we process all the rescaled throats. Each 6
throat has two neighboring pores within the grain and will be included in the main network only if 7
at least one of the pores belongs to the microporous grain. If both of them are already added to 8
the multiscale network, we add this throat as well (carefully setting its neighboring pores to their 9
new labels in the multiscale network). If one of the pore centers falls within a macropore in the 10
multiscale network, we add this throat: note that the throat is bridging two different scales (for 11
schematic, see blue throats in Figure 2a). Finally, if one of the pores falls within a different grain 12
that has been processed already, then we connect it to the pore that is closest to the pore 13
center we are examining in the multiscale network. The throat (connection) added is bridging 14
the appropriate micropores in the multiscale network. Finally, since neighboring grains in 15
simulated packings analytically touch at a point, the above procedure will not connect 16
microporous networks across a grain contact. We add a throat to connect the partially dissolved 17
grains (and assign it the average microscale radius). 18
19
2.3.2. Construction for pore-filling microporosity 20
21
Similar to the previous discussion, the inter-granular pore spaces are designated as 22
macropores. Unlike partially dissolved grains, a subset of these macropores will be replaced 23
with micropores (see Figure 2b). For each macropore filled with clay, we replace it with a 24
suitably rescaled, reference network that describes the microporosity pore-throat network. The 25
origin of the reference network is irrelevant for the algorithm in itself; however, the inherent 26
assumption of this approach is that there exists a network that is representative of the clay voids 27
(possibly informed from SEM images). The scaling factor b is assumed to be known based on 28
measurements. The reference network volume, of side length, L, (that is to be mapped on each 29
designated pore) is decided as follows: for each designated pore, we find the bounding cube. 30
The minimum of all such cubes has side length M. Then L = bM. We then find a sphere packing 31
of side L, construct the reference network and map it onto the pore bounding box. Only those 32
micropores that are within the macropore are added to the final network. If one pore is within the 33
macropore being replaced, and the pore connected to it is within another macropore then an 34

12
appropriate connection is formed (to either the macropore or to the closest micropore in case 1
the original macropore has been replaced). The macropore that is replaced by micropores is 2
subsequently removed from the network. 3
4
Our current implementation deals with either grain-filling or pore-filling microporosity. In nature 5
they often occur simultaneously, and we will address the current shortcoming of the 6
implemented algorithm in the future. 7
8
2.4. Cementation modeling 9
We finally look into the combined effect of cementation and dissolution on both network 10
characterization and permeability. This combined effect is especially of interest in TGSS and 11
tight carbonates. We implement cementation by uniformly increasing the cement “coat” on the 12
grains as is common in the literature [4], or effectively increasing the grain radius (which is 13
initially R=1). The cementation thickness c is the relative cement thickness normalized by grain 14
radius and is independent of fluid properties. The cement reduces the radii of the macronetwork 15
pores and throats (which are still found by the same Delaunay tessellation algorithm as in case 16
of R=1), but does not affect the micronetwork. As cement thickness is increased, some 17
macropores and macrothroats will naturally become completely closed which affects overall 18
macronetwork connectivity (this happens close to c=0.23). We presently assume that the 19
cement on partially dissolved grains does not affect connectivity between macro- and 20
micronetwork (unless macropores were completely closed (but not necessarily isolated) in the 21
cementation process). 22
23
24
3. Results and Discussion 25
26
3.1. Network characterization 27
28
We first create the macronetwork based on packing of equal spheres measured by Finney [30] 29
a packing of equal spheres. (For REV study in Appendix, we created large packings using the 30
cooperative rearrangement algorithm [35].) The pore network description of sphere packing has 31
been found representative for transport properties in clean sandstones such as the 32
Fontainebleau sandstone [7]. In this work we use a subset of spheres with radii 1 closely 33
packed in a [-10,10]3 volume with a porosity of 39% (as measured by summing network pores; 34

13
note that boundary pores’ volumes are approximated and slightly larger than in reality). Note 1
that the size of the volume was determined from a compromise between the simulation time and 2
size of the network: both absolute permeability as well as residual saturations during drainage 3
and imbibition become relatively constant when the volume size is [-a,a]3 for a>10 (see 4
discussion in Appendix). The subset of this packing and the corresponding networks are 5
visualized in Figure 1a and Figure 1c, respectively. 6
7
For a partially dissolved medium, f determines the fraction of grains to be filled with micropores 8
and b is the scaling factor (i.e. ratio of length scales between intergranular pores and 9
micropores). Table 1 summarizes the technical details. We use f= 0.2, 0.5, and 0.8, and set the 10
length factor to b = 5. An example network is visualized in Figure 3a. Coordination number 11
statistics in Figure 4a (weighted by pore volume) shows that the macropores in some cases can 12
have around 50 neighbors. When only one fifth of the grains is set to be microporous (e.g. when 13
f=0.2), those grains (and thus microporosity networks) do not form a connected structure across 14
the porous medium, whereas at larger fractions they do. The final sample has 80% of its grains 15
filled with micropores and we choose a range of length scales (b=3,4,5). This is similar to the 16
natural media, in which scales are not necessarily discretely separated. In real rocks some pore 17
size distributions are bimodal [16], and some have more continuous distribution [37]. Our 18
modeling so far is rather simplistic with a single value for parameter b creating bimodal 19
distributions; the sample with a mix of parameters b between 3 and 5 is an attempt to 20
approach a more continuous distribution (any range of positive real values can be used). The 21
difference in scale separation can be seen by comparing pore/throat distributions in Figure 5a 22
and Figure 5b. 23
24
For pore-filling microporosity (Section 2.3.2) we choose a fraction of pores to be microporous, 25
and use similar scaling factor(s) as in the partially dissolved grain examples. An example 26
network is visualized in Figure 3b. The statistics on networks are provided in Table 2. Note that 27
the number of pores determines the size of linear systems to be solved during permeability 28
calculation in network modeling. Since micropores are added within pore space only, the 29
contact area between macropores and microporous regions is much smaller in the case of two-30
scale networks with partially dissolved grains. The coordination numbers of macropores are 31
thus comparatively smaller, but nevertheless can go up to 60 (see Figure 4b). Pore/throat 32
distributions for these networks are shown in Figure 6. 33
34
14
1
3.1.1. Measuring Network Complexity 2
3
Pore spaces of heterogeneous media and corresponding multiscale networks have different 4
levels of complexity, and it would be very useful to have a versatile quantitative measure that 5
could compare them. Offdiagonal complexity [40], OdC, is a measure recently introduced in 6
graph theory. It is zero for regular (structured) networks as well as networks where all nodes 7
(pores) are pair-wise connected. OdC is a small number for randomized graphs; and a large 8
number for complex, correlated structures. 9
10
We report the offdiagonal complexity for two-scale networks explored in this work in Table 1 and 11
Table 2, and plot them against total porosity and permeability in Figure 7a and Figure 7b. The 12
complexity of the original macronetwork (which is unstructured, but every pore nevertheless had 13
four neighbors) is 0. Any network on a regular square or cubic grid, which are common in 14
literature, would also have complexity 0. For comparison, the network complexity number for a 15
20% porous, single length scale Berea sandstone from [41] is 1.8 (note that coordination 16
number in that medium ranges from 3 to 25, and averages to 3.8). We observe that for partially 17
dissolved granular media, the offdiagonal complexity increases from 2.93 to 3.04 for f=0 up to 18
f=0.5. This is expected since the addition of porous microcosms inside grains adds to the 19
throats connecting to the adjacent macropore. At f=0.8 we do not observe much change in the 20
complexity number, we argue that in this case the two scale pore network has reached a sense 21
of homogeneity. On the other hand, we observe a trend in decreasing offdiagonal complexity 22
with the increased fraction of clay-filled macropores (the addition of pore-filling microporosity 23
brings the medium close to homogeneity) from 1.84 to 1.477. This range is smaller than the 24
OdC for granular media with partially dissolved grains. This is because the microporosity is 25
added in series to macroporosity (i.e. some of the macronetwork elements were replaced by a 26
multitude of micropores) with much smaller effect to the overall coordination number. 27
Conversely, in networks with partially dissolved grains, microporosity was added in parallel (and 28
opened up additional pore space pathways). In this study we control the network design; 29
however, for natural media one might not know whether the microporosity is acting 30
predominantly in parallel or series to the macronetwork. Network complexity appears to have 31
the potential to differentiate these behaviors. Note that in both cases the mixed length scale 32
(b=3,4,5) case has a lower OdC number than its b=5 counterpart. This is due to the smaller 33
number of microthroats getting connected to the macropore in the mixed length scale cases. 34

15
1
3.2. Capillary pressure and relative permeability 2
3
Absolute permeability is shown along with offdiagonal complexity (OdC) in Figure 7. OdC 4
integrates local network attributes (pore coordination number), but does not directly measure 5
global properties (connectivity or maximum throughput) and is useful in reporting the 6
connectivity variations of a porous medium. Addition of partially dissolved microporosity parallel 7
to the original macronetwork steadily increases the permeability of the network. The 8
permeability and OdC trend seems to be both monotonically increasing with porosity. However, 9
as long as the scale ratio b is 5, the permeability is increased at most by 6% (Figure 7a). The 10
large jump corresponds to the mixed scale ratios (b=3,4,5) of micropores and therefore overall 11
inclusion of larger throats. In Figure 7b, we observe that the replacement of macropores with 12
porous fillers results in a reduction of the overall porosity (since no amount of micropores can 13
perfectly fill the void volume), permeability and OdC. However, permeability/porosity and 14
OdC/porosity trends are not related in a monotonic fashion anymore (and it appears difficult to 15
find a trend). 16
17
Figure 8 shows the drainage capillary-pressure saturation curves for both multiscale cases. 18
Single-scale macronetwork curves (f=0) are shown in both cases for comparison. We note that 19
the initial percolation threshold pressure is at an expected normalized value of 6 [26]. However, 20
a second length scale threshold (b=5 times larger) for partially dissolved cases (Figure 8a) will 21
result as pressure is increased further. The second percolation threshold is most noticeable in a 22
grain fraction of f=0.8 where microporosity is most prevalent. The addition of microporosity 23
affects the residual water saturation in two ways: It can increase the saturation by acting as 24
“isolated” regions that defend themselves from the nonwetting phase. It can also offer escape 25
routes to the trapped nonwetting phase inside macropores and reduce the residual saturation. 26
A range of mixed micropores (with smaller average scale ratio b) decreases the residual wetting 27
phase saturation because of the smaller curvatures of the larger micropores. The mixed scale 28
case also exhibits a gradual slope of the capillary pressure. Figure 8b shows the drainage 29
capillary pressure curves for media with pore-filling microporosity. The initial percolation 30
threshold for fractions f=0, 0.2 does not change significantly from 6 (normalized units) because 31
macropores form a continuous path spanning the medium. At f=0.8, the macro-scale path is 32
disconnected, and we can span the medium only by passing through micropores. Hence the 33
percolation threshold increases up to approximately 30 (normalized units) and a jump becomes 34
16
visible in the appropriate curve. f=0.5 is in between those extremes. Note that the secondary 1
percolation plateau is not prominent since soon we reach residual saturation. This jump is 2
smoothed out in the mixed-scale pore-filling microporosity case due to the fact that there is no 3
clear separation of length scales: this is approaching the behavior observed in natural media 4
([6], see Figure 13). Another interesting observation is the decrease in residual wetting phase 5
saturation for f=0.5: macropores do not completely surround most microporous regions and due 6
to this there is less trapping within. Further increase in the residual wetting phase saturation at 7
f= 0.8 is due to macropore disconnection from inlet/outlet (and thus inability to drain). 8
9
Figure 9 shows the relative permeability diagrams corresponding to the drainage capillary 10
pressure curves. In a partially dissolved media, the micropores act in parallel with respect to the 11
macropores. The relative permeabilities (except for the mixed-scale case) seems to shift without 12
any change in behavior (Figure 9a). That is in contrast to the relative permeability curves of the 13
pore-filling microporosity samples (Figure 9b), where it is hard to find a simple connection of 14
permeability behavior with the fraction of macropores replaced by microporosity. This is 15
because pathways become more tortuous with microporous regions increasingly blocking macro 16
connections. 17
18
Similar to drainage, we simulated imbibition via an invasion percolation algorithm. In this initial 19
study, phenomena such as film or crevice flow and snap off were not included. Figure 10a 20
shows the imbibition capillary pressure curves for the partially dissolved granular medium: We 21
observe that the residual saturation decreases when microporosity is added (f=0.2 and f=0.5). 22
This is due to the additional pathways provided for the macropores. In f=0.8 we see an increase 23
in the residual saturation, this is due to the fact that the wetting phase prefers the micropores 24
(smaller pore radius) and the “isolation” effect switches to macropores. The mixed scale case 25
shows the least residual saturation, this is due to lesser contrast in scale between micro and 26
macropores that reduces the isolations effect. Figure 10b shows the imbibition capillary 27
pressure curves for media with pore-filling microporosity. The residual nonwetting phase 28
increases from f=0 up to f=0.5 due to the preferential pathways for wetting phase created by the 29
micropores which encourages the isolation of macropores. At f=0.8, micropores have become 30
connected across the sample and the isolation of macropores reduces. The mixed-scale 31
micropores’ case further reduces the trapping disposition of a small dominant scale. 32
33

17
Figure 11a shows the relative permeability of imbibition for the partially dissolved cases. Similar 1
to drainage behavior, the relative permeabilities shift whilst keeping a general trend. Figure 11b 2
illustrates the fact that the inclusion of pore-filling microporosity results in a nontrivial trend. We 3
also observe “permeability jail”: an unorthodox petrophysical behavior predominantly observed 4
in TGSS [6] in the relative for the pore-filling microporosity cases. This is again due to the 5
“isolation” effect discussed previously. 6
7
3.3. The effect of cementation on transport properties 8
9
We finally investigate the combined effect of cementation and dissolution (or clay-filling) on the 10
transport properties. We are specifically interested in the limiting behavior as the macronetwork 11
disconnects due to cemented macrothroats. 12
13
As shown in Figure 12a, in case of a single-scale network, cementation increases offdiagonal 14
complexity once a significant number of the smaller throats becomes closed (i.e. the 15
homogenous coordination number of a regular network, 4, ceases to exist). In contrast, Figure 16
12b indicates that cementation actually “lowers” heterogeneity when microporosity exists. 17
Cementation appears to “increase disorder” in a regular network because it reduces the original 18
coordination number in irregular manner. However, it “decreases disorder” in an already 19
heterogeneous network because it disproportionately affects macropores that have large 20
coordination numbers. 21
22
In the absence of microporosity, the drainage capillary pressure curves for cemented media 23
(Figure 13a) closely resemble the steep behavior with high residual water saturation already 24
observed by Mousavi and Bryant [4]. However, in the presence of microporosity (Figure 13b) 25
within partially dissolved grains, the slope of the drainage capillary pressure becomes less 26
steep. This is due to the parallel flow paths provided by the micropores. In addition, the 27
existence of microporosity reduces “dead end” patches (sometimes called dangling ends 28
clusters) of pores with only one connection to the percolation path, and results in a reduction of 29
the residual water saturation. Figure 14 shows the relative permeability curves for drainage. We 30
note that the presence of microporosity reduces the water saturation rel. permeability “gap”. As 31
connectivity is reduced with adding cement, the networks have fewer and fewer cycles, possibly 32
approaching a tree (i.e. a network where no cyclical path exists) for cement fraction c=0.23. 33

18
When few cycles exist, it is hard for a fluid to pick an alternative route out of the system, in other 1
words, the way it goes in is the way it goes out. 2
3
Figure 15 illustrates the tree effect: note the sharp drops in the imbibition capillary pressure 4
curves. Microporosity adds connections and “smooths” the drops. Figure 16a demonstrates 5
permeability jail effects for cementation without microporosity. In Figure 16b we observe that 6
microporosity provides extra pathways that remove the jail effect in imbibition relative 7
permeability curves. A visualization and discussion on flow properties of trees is available in 8
Appendix (Figure 20 and Figure 21). 9
10
4. Summary and Conclusions 11
12
We investigated the effects of microporosity on transport properties by constructing three 13
dimensional, two-scale unstructured pore network models. The second scale was 14
deterministically included into the network. The model construction is somewhat similar to the 15
pore-solid fractal model [42], but here the embedding of the replicated structures stops after the 16
first step, and the region replicas that are embedded into are of irregular shape. We classified 17
microporosity into (1) partially dissolved (acting parallel with macroporosity) and (2) pore filling 18
(acting in series). The capillary pressure and relative permeability were computed through the 19
invasion percolation algorithm. 20
21
In most cases considered, we added microporosity which had a length scale 5 times smaller 22
(and, assuming Carman-Kozeny permeability behavior, its absolute permeability is 25 times 23
smaller) than macroporosity. We varied the amount and spatial distribution/connectivity of the 24
addition. 25
26
Most cases with a partially dissolved (“parallel”) microporosity setting, had a total porosity in the 27
range of [0.39,0.56]. An increase of permeability in the range of 1-7% with respect to the original 28
network macropores was observed. The only case that shows a 14% increase, is the network 29
with a “mix” of scaling parameters b in the range of {3,4,5}. Given the overall larger micropores, 30
this is expected. We find that during drainage, relative permeability to non-wetting phase 31
increases monotonically up to two times with the parallel addition of microporosity to 32
macroporosity, and the relative permeability to wetting phase decreases (up to two times). 33
34

19
However, when the effects of cementation and partial dissolution of grains are combined, the 1
absolute permeability can be reduced up to 4 orders of magnitude in cases where 2
macronetwork throats do not connect across the medium (porosity meanwhile reduces to 3
approximately 0.06). The results help us understand the limited permeability phenomenon 4
observed in tight rocks: a water saturation range in which neither wetting nor nonwetting phases 5
are able to flow at a considerable rate. The contributing factor to this behavior is the tightening 6
of the macroporous pathways, with many throat connections being closed off. When studying 7
permeability of trees, we see that this behavior is approached by simply reducing a network to a 8
tree (by plugging/deleting a number of throats that provide alternate pathways) without 9
reducing/cementing any of the remaining throat radii. This eventually forces the fluid to move 10
through microporosity. 11
12
In cases with clay-filling microporosity within pores (“in series”), if the macroporous network is 13
still percolating, the absolute permeability will decrease approximately 2-40 times. However, 14
once microporosity replaces enough macropores so that they do not percolate anymore, the 15
decrease in permeability will be approximately 300 times (the total porosity reduces down to 16
0.14). During drainage, relative permeability to non-wetting phase in cases where macropores 17
still percolate will increase up to 1.5 times (and relative permeability to wetting will decrease up 18
to 1.5 times). However, once microporosity dominates the medium (f=0.8), relative permeability 19
to both the wetting and non-wetting phases will decrease up to two times. As opposed to 20
partially dissolved grains, the effect is thus non-monotonic (and it lacks a clear trend) when 21
microporosity is added (i.e. replaces parts of) in series with respect to the macroporosity. 22
23
We introduced offdiagonal complexity (OdC) to characterize networks in this work. To our 24
knowledge, OdC has not been applied to porous media thus far. OdC is zero for networks with 25
constant coordination number (such as cubic networks), but is sensitive to the heterogeneity of 26
coordination numbers and is able to distinguish two-scale networks with pore-filling vs. grain-27
filling microporosity. Both OdC and permeability of two-scale networks created in this work 28
exhibit nonlinear relationships with porosity and we will investigate them in more detail as we 29
create larger number of network realizations. 30
31
We implemented a fairly basic invasion-percolation two phase flow algorithm. Phenomena such 32
as film or crevice flow in pores of non-circular cross-sections and snap-off are presently not 33
included in our imbibition simulations. Mechanistic models for imbibition exist for granular 34

20
media [43] that are very close to experimentally observed behavior imbibition [44], but are not 1
so straightforward to implement in the two-scale setting presented here. Nevertheless, the 2
results are telling of the significant impact microporosity can have on two phase flow in tight 3
reservoirs. 4
5
The results show that the spatial distribution and connectivity of macroporosity and 6
microporosity have much stronger effects on transport properties than their respective numerical 7
values. All of the results thus far in this paper were provided from a single network realization 8
for each case. In our future work, we will correct this and include confidence intervals for most 9
presented results. 10
11
4.1. Multiphysics phenomena 12
13
In this paper we assume the same physics on both length scales. Pore network models, with 14
each throat having simplified tube geometries, allow for simultaneous usage of Hagen-Poiseulle 15
flux equation in pores larger than 100nm and the nonlinear flux extensions if the throat cross 16
sectional radius is below 100nm. Diffusion and slip boundary conditions can be incorporated 17
into the flux formulation (and become transport mechanisms competitive with advection [24]). 18
We have recently explored this in simple networks with connectivity of four [25]. The pressure 19
equations become nonlinear, and there is a marked increase in computational effort to solve 20
them. We are currently extending true two-scale networks to two-scale physics scenarios and 21
will report on this in future. 22
23
4.2. Image-informed models 24
25
Pore space characterization on a wide range of scales is now becoming available, albeit from 26
disparate sources. High-resolution, three-dimensional, X-ray microtomography images of 27
multiphase porous media have become widely available over the past decades along with 28
methods to analyze them and use them for pore networks reconstructions [41]. A single image 29
can capture features ranging in size from several microns to one or two millimeters, while larger 30
features can also be probed using this technology. Additionally, many research groups now use 31
process-based and statistical reconstruction techniques to build three-dimensional pore space 32
reconstructions on the submicron scale from electron micrographs [45]–[47]. Focused ion beam 33
tomography has been employed to give true three-dimensional images of similarly small 34

21
volumes of carbonates [48] and of mudrocks [49] with nanometer resolution. It would be of great 1
interest to directly utilize experimental information from two or more length scales (sources) in 2
flow modeling and we offer our two-scale network construction with this utilization in mind. 3
4
This entire investigation has been done using model granular medium as its base. The same 5
conceptual framework can be applied to networks created from imaged rock samples, but 6
implementation is entirely different due to the nature of the original porous structure. We 7
showed the preliminary results in [1], and a detailed separate study is in review (Prodanovic, 8
Mehmani and Sheppard, “Imaged-based multiscale network modeling of microporosity in 9
carbonates”, submitted to special volume of The Geological Society London). 10
11
12
5. Acknowledgements 13
14
Early results from this work were presented at the SPE Unconventional Conference and 15
Exhibition, Woodlands, TX, June 2011, see [1]. Ayaz Mehmani gratefully acknowledges 16
STATOIL student fellowship at the University of Texas at Austin. 17
18

22
Appendix 1
2
The effect of volume size 3
In order to find a representative elementary volume, we investigate the sensitivity of absolute 4
permeability measurements as well as residual saturations at drainage and imbibition. Both 5
single-scale and two-scale networks of different sizes were used. We create networks from 6
closely packed sphere packings in volume [-a,a]3, where we vary volume side half-length a. 7
Spheres are all with radius 1. When creating two-scale networks, we choose a fraction f=0.5 of 8
grains to be microporous and embed microscale networks with b=5 times smaller than the 9
original length scale. Both absolute permeability results (Figure 17) and residual saturations at 10
drainage and imbibition (Figure 18) seem to reasonably stabilize for a=10 or larger. Note that 11
some of the variation in results is due to use of a single network realization for each case. Thus 12
we use a=10 in most of this paper (except in cementation study due to high computational 13
costs). 14
15
The effect of number of open volume boundaries on trapping 16
In cementation investigation, we noticed that boundary conditions (in particular, number of 17
volume sides considered open to flow) affect the residual phase in both drainage and imbibition, 18
though the qualitative capillary pressure and relative permeability curves remain similar. In 19
Figure 19. we report the residual saturations for different volume boundaries during 20
cementation. This is due to relatively high ratio of volume boundary area to the volume, and the 21
reason many authors resort to periodic boundary conditions in pore scale modeling [28]. While 22
the similar observation has already been made for granular media, here we note that with 23
increased cementation, the influence of boundaries is decreased since the trapping becomes 24
dominated by the local throat radii reduction. This is in contrast with imbibition, as reducing the 25
throat sizes (along with pore sizes) facilitates imbibition and the boundaries become dominant. 26
27
Flow properties of trees 28
A tree is a network in which no cyclical paths exist: flow paths which begin and end with the 29
same pore. A tree sub-network of throats that visits all of the pores shown in Figure 1c is 30
visualized in Figure 20a, and capillary pressure curves are shown in Figure 20b. Since there are 31
no cycles, nonwetting fluid has to go out the same way it went in (though possibly at different 32
curvatures). Drainage and imbibition relative permeability curve comparison between regular 33
and tree networks is shown in Figure 21. Since removing any of the inner throats will disconnect 34

23
a part of a tree, it is easy to create a situation where two fluids block each other and we observe 1
“permeability jail” region during imbibition. 2
3 4
References 5
[1] A. Mehmani, A. Tokan-lawal, M. Prodanovic, and A. Sheppard, “The Effect of 6
Microporosity on Transport Properties in Tight Reservoirs,” in SPE Americas 7
Unconventional Gas Conference and Exhibition, 2011, vol. 144384. 8
[2] A. P. Byrnes and R. M. Cluff, “Analysis Of Critical Permeablity, Capillary Pressure And 9
Electrical Properties For Mesaverde Tight Gas Sandstones From Western U.S. Basins,” 10
U.S. Department of Energy, DE-FC26-05NT42660, Dec. 2009. 11
[3] A. Dehghan Khalili, C. Arns, J. Arns, F. Hussain, Y. Cinar, W. Pinczewski, S. Latham, and 12
J. Funk, “Permeability Upscaling for Carbonates from the Pore-Scale Using Multi-Scale 13
Xray-CT Images,” 2012. 14
[4] M. Mousavi, M. Prodanović, and D. Jacobi, “New Classification of Carbonate Rocks for 15
Process-Based Pore-Scale Modeling,” SPE Journal, 2012. 16
[5] J. Jennings and F. Lucia, “Predicting Permeability From Well Logs in Carbonates With a 17
Link to Geology for Interwell Permeability Mapping,” SPE Reservoir Evaluation & 18
Engineering, vol. 6, no. 4, Aug. 2003. 19
[6] M. A. Mousavi and S. L. Bryant, “Connectivity of Pore Space as a Control on Two-Phase 20
Flow Properties of Tight-Gas Sandstones,” Transp Porous Med, vol. 94, no. 2, pp. 537–21
554, Sep. 2012. 22
[7] S. L. Bryant, G. Mason, and D. Mellor, “Quantification of Spatial Correlation in Porous 23
Media and Its Effect on Mercury Porosimetry,” J. Colloid Interface Sci., vol. 177, pp. 88–24
100, 1996. 25
[8] K. W. Shanley, R. M. Cluff, and J. W. Robinson, “Factors controlling prolific gas production 26
from low-permeability sandstone reservoirs: Implications for resource assessment, 27
prospect development, and risk analysis,” Bulletin, vol. 88, no. 8, pp. 1083–1121, Aug. 28
2004. 29
[9] D. Silin, T. Kneafsey, J. Ajo-Franklin, and P. Nico, “A Multimodal 3D Imaging Study of 30
Natural Gas Flow in Tight Sands,” 2011. 31
[10] T. Arbogast, “GRAVITATIONAL FORCES IN DUAL-POROSITY SYSTEMS: 1. MODEL 32
DERIVATION BY HOMOGENIZATION,” Transport in Porous Media, vol. 13, no. 2, pp. 33
179–203, 1993. 34
[11] T. Arbogast, “GRAVITATIONAL FORCES IN DUAL-POROSITY SYSTEMS: 2. 35
COMPUTATIONAL VALIDATION OF THE HOMOGENIZED MODEL,” Transport in Porous 36
Media, vol. 13, no. 2, pp. 205–220, 1993. 37
[12] M. Karimi-Fard, B. Gong, and L. J. Durlofsky, “Generation of coarse-scale continuum flow 38
models from detailed fracture characterization,” Water Res. Research, vol. 42, no. 10, 39
2007. 40
[13] M. T. Balhoff, S. G. Thomas, and M. F. Wheeler, “Mortar coupling and upscaling of pore-41
scale models,” Comput Geosci, vol. 12, no. 1, pp. 15–27, Sep. 2007. 42
[14] K. Wu, M. I. J. V. Dijke, G. D. Couples, Z. Jiang, J. Ma, K. S. Sorbie, J. Crawford, I. Young, 43
and X. Zhang, “3D Stochastic Modelling of Heterogeneous Porous Media – Applications to 44
Reservoir Rocks,” Transp Porous Med, vol. 65, no. 3, pp. 443–467, Dec. 2006. 45
[15] E. Toumelin, “Pore-Scale Petrophysical Models for the Simulation and Combined 46
Interpretation of Nuclear Magnetic Resonance and Wide-Band Electromagnetic 47
Measurements of Saturated Rocks[,” The University of Texas at Austin, 2006. 48

24
[16] S. Youssef, M. Han, D. Bauer, E. Rosenberg, S. Bekri, M. Fleury, and O. Vizika, “High 1
resolution $\mu$CT combined to numerical models to assess electrical properties of 2
bimodal carbonates,” Abu Dhabi, UAE, 2008. 3
[17] Z. Chen, Computational Methods for Multiphase Flows in Porous Media. Society for 4
Industrial and Applied Mathematic, 2006. 5
[18] L. W. Lake, Enhanced Oil Recovery, 1st ed. Prentice Hall, 1996. 6
[19] I. Fatt, “The network model of porous media I. Capillary characreristics,” Pet. Trans. AIME, 7
vol. 207, pp. 144–159, 1956a. 8
[20] I. Fatt, “The network model of porous media II. Dynamic properties of a single size tube 9
network,” Pet. Trans. AIME, vol. 207, pp. 160–163, 1956b. 10
[21] I. Fatt, “The network model of porous media III. Dynamic properties of networks with tube 11
radius distribution,” Pet. Trans. AIME, vol. 207, pp. 164–181, 1956c. 12
[22] P. H. Valvatne and M. J. Blunt, “Predictive pore-scale modeling of two-phase flow in mixed 13
wet media,” Water Resour. Res., vol. 40, p. W07406, 2004. 14
[23] V. Joekar-Niasar and S. M. Hassanizadeh, “Analysis of Fundamentals of Two-Phase Flow 15
in Porous Media Using Dynamic Pore-Network Models: A Review,” Critical Reviews in 16
Environmental Science and Technology, vol. 42, no. 18, pp. 1895–1976, 2012. 17
[24] F. Javadpour, “Nanopores and Apparent Permeability of Gas Flow in Mudrocks (Shales 18
and Siltstone),” Journal of Canadian Petroleum Technology, vol. 48, no. 8, Aug. 2009. 19
[25] A. Mehmani, M. Prodanović, and F. Javadpour, “Multiscale, Multiphysics Network Modeling 20
of Shale Matrix Gas Flows,” Transp Porous Med, pp. 1–14. 21
[26] G. Mason and D. Mellor, “Simulation of drainage and imbibition in a random packing of 22
equal spheres,” J. Colloid Interface Sci., vol. 176, no. 1, pp. 214–225, 1995. 23
[27] Y. Peng, M. Prodanovic, and S. Bryant, “Improving Fidelity of Network Models for Drainage 24
and Imbibition,” 2009. 25
[28] J. Behseresht, S. Bryant, and K. Sepehrnoori, “Infinite-Acting Physically Representative 26
Networks for Capillarity-Controlled Displacements,” SPEJ, 2009. 27
[29] S. Bryant and M. Blunt, “Prediction of relative permeability in simple porous media,” Phys. 28
Rev. A, vol. 46, no. 4, pp. 2004–2011, Aug. 1992. 29
[30] J. L. Finney, “Random Packings and the Structure of Simple Liquids. I. The Geometry of 30
Random Close Packing,” Proceedings of the Royal Society of London. Series A, 31
Mathematical and Physical Sciences, vol. 319, no. 1539, pp. 479–493, 1970. 32
[31] R. I. Al-Raoush, K. Thompson, and C. W. Willson, “Comparison of Network Generation 33
Techniques for Unconsolidated Porous Media,” Soil. Sci. Soc. Am. J., vol. 67, pp. 1687–34
1700, 2003. 35
[32] L. Paterson, S. Painter, M. A. Knackstedt, and W. Val Pinczewski, “Patterns of fluid flow in 36
naturally heterogeneous rocks,” Physica A: Statistical Mechanics and its Applications, vol. 37
233, no. 3–4, pp. 619–628, Dec. 1996. 38
[33] M. A. Knackstedt, A. P. Sheppard, and M. Sahimi, “Pore network modelling of two-phase 39
flow in porous rock: the effect of correlated heterogeneity,” Adv. Wat. Res., vol. 24, pp. 40
257–277, 2001. 41
[34] A.-L. Barabasi and R. Albert, “Emergence of scaling in random networks,” arXiv:cond-42
mat/9910332, Oct. 1999. 43
[35] Cynthia Thane, “Geometry and topology of model sediments and their influence on 44
sediment properties,” Masters Thesis, The University of Texas at Austin, 2006. 45
[36] X. Shi, Masa Prodanovic, J. Holder, K. T. Gray, and David DiCarlo, “Permeability 46
Estimation of Damaged Formations Near Wellbore,” in Proceedings of SPE Annual 47
Technical Conference and Exibition 2011, 2011, vol. SPE paper 146883. 48
[37] L. E. Crandell, C. A. Peters, W. Um, K. W. Jones, and W. B. Lindquist, “Changes in the 49
pore network structure of Hanford sediment after reaction with caustic tank wastes,” 50
Journal of Contaminant Hydrology, vol. 131, no. 1–4, pp. 89–99, Apr. 2012. 51

25
[38] C. A. Peters, “Accessibilities of reactive minerals in consolidated sedimentary rock: An 1
imaging study of three sandstones,” Chemical Geology, vol. 265, no. 1–2, pp. 198–208, 2
Jul. 2009. 3
[39] K. E. Thompson, C. S. Willson, and W. L. Zhang, “Quantitative computer reconstruction of 4
particulate materials from microtomography images,” Powder Technology, vol. 163, no. 3, 5
pp. 169–182, 2006. 6
[40] J. Claussen, “Offdiagonal complexity: A computationally quick complexity measure for 7
graphs and networks,” Physica A: Statistical Mechanics and its Applications, vol. 375, no. 8
1, pp. 365–373, Feb. 2007. 9
[41] M. Prodanovic, W. B. Lindquist, and R. S. Seright, “3D image-based characterization of 10
fluid displacement in a Berea core,” Advances in Water Resources, vol. 30, no. 2, pp. 214–11
226, Feb. 2007. 12
[42] E. Perrier, N. Bird, and M. Rieu, “Generalizing the fractal model of soil structure: the pore–13
solid fractal approach,” Geoderma, vol. 88, no. 3–4, pp. 137–164, Mar. 1999. 14
[43] S. Motealleh, M. Ashouripashaki, D. DiCarlo, and S. Bryant, “Mechanisms of Capillary-15
Controlled Immiscible Fluid Flow in Fractionally Wet Porous Media,” Vadose Zone J., vol. 16
9, no. 3, pp. 610–623, Aug. 2010. 17
[44] J. C. Melrose, “Wettability as Related to Capillary Action in Porous Media,” Soc. Petr. Eng. 18
J., pp. 259–271, Nov. 1965. 19
[45] P.-E. Øren and S. Bakke, “Reconstruction of Berea sandstone and pore-scale modelling of 20
wettability effects,” Journal of Petroleum Science and Engineering, vol. 39, no. 3–4, pp. 21
177–199, Sep. 2003. 22
[46] H. Okabe and M. J. Blunt, “Pore space reconstruction using multiple-point statistics,” J. 23
Petroleum Sci. Eng., vol. 46, no. 1–2, pp. 121–137, 2005. 24
[47] A. Moctezuma-Berthier, O. Vizika, J. F. Thovert, and P. M. Adler, “One- and Two-Phase 25
Permeabilities of Vugular Porous Media,” Transport in Porous Media, vol. 56, no. 2, pp. 26
225–244, 2004. 27
[48] A. Ghous, T. J. Senden, R. M. Sok, A. P. Sheppard, V. W. Pinczewski, and M. A. 28
Knackstedt, “3D Characterization of Microporosity in Carbonate Cores,” in SPWLA Middle 29
East Regional Symposium Proceedings, Abu Dhabi, 2007. 30
[49] T. A. Dewers, J. Heath, R. Ewy, and L. Duranti, “Three-dimensional pore networks and 31
transport properties of a shale gas formation determined from focused ion beam serial 32
imaging,” International Journal of Oil, Gas and Coal Technology, vol. 5, no. 2/3, p. 229, 33
2012. 34 35 36
Table captions 37
38
Table 1. Multiscale networks created for a granular medium with partially dissolved grains and 39
their properties. In all cases, macronetworks contains 8022 pores and 14994 throats, and 40
accounts for macroporosity of 38.92%. 41
42
Table 2. Multiscale networks created for a porous medium with pore-filling microporosity and 43
their properties. In all cases before clay replacements began, the same starting macronetwork 44
with 8022 pores and 14994 throats was used as in Table 1. 45
46
Figure captions 47
48

26
Figure 1. Delaunay tessellation schematic for identifying the pore-throat network in granular 1
media. a) Delaunay tessellation input is a packing of grains (spheres in this work). b) 2
Tetrahedral cell representing a pore defined by four neighboring spheres. The pore space within 3
each tetrahedron represents pore, and the tetrahedral sides are the tightest cross-sections 4
(throats) on the path between two neighboring pore centers. c) The final result is a network of 5
pores (shown as spheres, colored/shaded by size) and throats (identified as cylindrical 6
connections). 7
8
Figure 2. Schematic of two-scale pore network construction for a) grain-filling; and b) pore-filling 9
microporosity. Intergranular (“macro”) network pores are shown as larger blue circles. For 10
designated microporous regions, a network similar to what is observed in available images/data 11
is rescaled with an appropriate length ratio and mapped into the microporous region, in a) grains 12
are microporous, in b) pores are microporous). Throats connecting the two networks across the 13
known boundary of the two are identified in order to get a single network that contains both 14
length scales and are shown in red. The key feature is that the connections between two length 15
scales can be non-planar (and arbitrarily complex). 16
17
Figure 3. Visualization of a [-4,4]3 subset of the two-scale network with a) fraction f=0.5 of grains 18
replaced by grain-filling microporosity (refer to Table 1); b) fraction f=0.5 of pores replaced by 19
pore-filling microporosity (refer to Table 2). 20
21
Figure 4. Coordination number statistics of network models with a) grain-filling and b) pore-filling 22
microporosity corresponding to Figure 3 (we choose f=0.8, and compare single b=5 with mixed 23
b=3,4,5). Instead of number density, we show a fraction of total pore volume (or throat area) 24
occupied by pores (throats) in each bin. 25
26
Figure 5. Inscribed radius statistics for the network model with grain-filling microporosity. Instead 27
of number density, we show a fraction of the total pore volume (or throat area) occupied by 28
pores (throats) in each bin. a) scaling factor b=5 (two separate length scales), for visualization 29
see Figure 3a; b) scaling factor b=3,4,5 (mixture of length scales creating a continuous 30
transition between scales). 31
32
Figure 6. Inscribed radius statistics for the network model with pore-filling microporosity. 33
Instead of number density, we show a fraction of the total pore volume (or throat area) occupied 34
by pores (throats) in each bin. a) scaling factor b=5 (two separate length scales), for 35
visualization see Figure 3b; b) scaling factor is a mix b=3,4,5. 36
Figure 7. Absolute permeability (normalized by the permeability of the macronetwork, blue line) 37
and offdiagonal network complexity (red line) vs. porosity for a) partially dissolved grain (grain-38
filling) model networks (see Table 1) and b) pore-filling model networks (see Table 2). The 39
macronetwork (with total porosity close to 0.4) is included in both figures to enable direct 40
comparison. 41
42
Figure 8. Drainage curvature (proportional to capillary pressure) - saturation relationships for 43
two- scale networks with a) grain-filling and b) pore-filling microporosity. 44

27
1
Figure 9. Relative permeability relationships for drainage in two-scale networks with a) grain-2
filling and b) pore-filling microporosity. 3
4
Figure 10. Imbibition curvature-saturation relationships. Note that curvature is proportional to 5
capillary pressure (Equation (2)). Networks with a) grain-filling and b) pore-filling microporosity 6
are shown. 7
8
Figure 11. Imbibition relative permeability curves for a) grain-filling and b) pore-filling 9
microporosity. 10
11
Figure 12. Absolute permeability and offdiagonal network complexity during addition of uniform 12
cement coating porous medium grains. a) Single-scale, original macronetwork b) two-scale 13
network with grain-filling microporosity (f=1.0, b=7). Compare to Figure 7a. 14
Figure 13. Drainage for cementation c=0.1, 0.13, 0.17, 0.2, 0.23 a) just macronetwork b) two-15
scale pore network relative permeability. 16
17
Figure 14. Drainage relative permeability curves for different cement thickness. a) Single length 18
scale network (i.e. only macronetwork) b) Two-scale pore network (a=5, b=7, f=0.5). In these 19
simulations we let two volume sides (entry and exit in flow direction) be open (please see 20
discussion in Appendix on the effect of open boundaries). 21
22
Figure 15. Imbibition curves for different cement thickness. a) Single length scale network (i.e. 23
only macronetwork) b) Two-scale pore network (a=5, b=7, f=0.5). In these simulations we let 24
two volume sides (entry and exit in flow direction) be open (please see discussion in Appendix 25
on the effect of boundarues). 26
Figure 16. Imbibition relative permeability curves for different cement thickness. a) Single length 27
scale network (i.e. only macronetwork) b) Two-scale pore network (a=5, b=7, f=0.5). In these 28
simulations we let two volume sides (entry and exit in flow direction) be open (cf. Figure 19. in 29
Appendix for difference in residual saturations when one or two sides are considered.) 30
31
Figure 17. Sensitivity of permeability to size of the analyzed volume for macronetwork as well as 32
the network with grain-filling fand pore-filling microporosity. The volume size used in each case 33
is [-a,a]3. We used filling fraction f=0.5 and scaling factor b=5. All values are normalized with the 34
permeability of macronetwork with half length a=5. 35
36

28
Figure 18. Sensitivity of residual saturation to size of the analyzed volume. The network 1
volume in each case is [-a,a]3. We used filling fraction f=0.5 . Residual saturation refers to 2
wetting phase at drainage, and nonwetting phase at imbibition. 3
4
Figure 19. Comparison of boundary conditions used in simulation based on residual wetting (for 5
drainage) and nonwetting (for Imbibition) saturation for different cement thicknesses. ‘1side’ 6
refers to the case where only connection to one volume side is checked when evaluating 7
trapped phase, and ‘2side’ refers to checking connections to two opposite volume sides (in 8
direction of flow). 9
10
Figure 20. a)Three dimensional visualization of a minimal spanning tree that visit all pores, but 11
does not include any cyclic paths in the network (note that only throats are visualized for 12
clarity). b) Capillary pressure curves for regular and tree networks. 13
14
Figure 21. Relative permeability curves comparison for a regular macronetwork, and its sub-15
network reduced to a tree. a) drainage; b) imbibition. 16
17


0
0.1
0.2
0.3
0.4
0.5
0.6
0.7
0.8
0.9
1
0
0.05
0.1
0.15
0.2
0.25
0.3
0.35
Cu
mu
lati
ve f
ract
ion
Frac
tio
n
Coordination Number
f = 0.8
f = 0.8 Mixed
f = 0.8
f = 0.8 Mixed
Figure 4a

0
0.1
0.2
0.3
0.4
0.5
0.6
0.7
0.8
0.9
1
0
0.05
0.1
0.15
0.2
0.25
0.3
0.35
0.4
0.45
0.5
2.76
6.29
9.82
13.3
4
16.8
7
20.3
9
23.9
2
27.4
5
30.9
7
34.5
0
38.0
3
41.5
5
45.0
8
48
.61
52.1
3
55.6
6
59.1
8
62.7
1
66.2
4
Cu
mu
lati
ve f
ract
ion
Frac
tio
n
Coordination Number
Figure 4b

0
0.1
0.2
0.3
0.4
0.5
0.6
0.7
0.8
0.9
1
0
0.02
0.04
0.06
0.08
0.1
0.12
0.14
0.16
0.18
Cu
mu
lati
ve f
ract
ion
Frac
tio
n
log10(rInscribed)
Pores
Throats
Pores Cumulative
Throats Cumulative
Figure 5a

0
0.1
0.2
0.3
0.4
0.5
0.6
0.7
0.8
0.9
1
0
0.02
0.04
0.06
0.08
0.1
0.12
0.14
0.16
0.18
-1.3
1
-1.2
5
-1.1
9
-1.1
2
-1.0
6
-1.0
0
-0.9
4
-0.8
7
-0.8
1
-0.7
5
-0.6
9
-0.6
2
-0.5
6
-0.5
0
-0.4
4
-0.3
7
-0.3
1
-0.2
5
-0.1
9
Cu
mu
lati
ve f
ract
ion
Frac
tio
n
log10(rInscribed)
Figure 5b

0
0.1
0.2
0.3
0.4
0.5
0.6
0.7
0.8
0.9
1
0
0.02
0.04
0.06
0.08
0.1
0.12
0.14
0.16
0.18
0.2
-1.3
1
-1.2
5
-1.1
8
-1.1
2
-1.0
6
-1.0
0
-0.9
4
-0.8
7
-0.8
1
-0.7
5
-0.6
9
-0.6
3
-0.5
7
-0.5
0
-0.4
4
-0.3
8
-0.3
2
-0.2
6
-0.1
9
Cu
mu
lati
ve f
ract
ion
Frac
tio
n
log10(rInscribed)
Pores
Throats
Pores Cumulative
Throats Cumulative
Figure 6a

0
0.1
0.2
0.3
0.4
0.5
0.6
0.7
0.8
0.9
1
0
0.02
0.04
0.06
0.08
0.1
0.12
0.14
0.16
-1.3
1
-1.2
5
-1.1
8
-1.1
2
-1.0
6
-1.0
0
-0.9
4
-0.8
7
-0.8
1
-0.7
5
-0.6
9
-0.6
3
-0.5
7
-0.5
0
-0.4
4
-0.3
8
-0.3
2
-0.2
6
-0.1
9
Cu
mu
lati
ve f
ract
ion
Frac
tio
n
log10(rInscribed)
Figure 6b
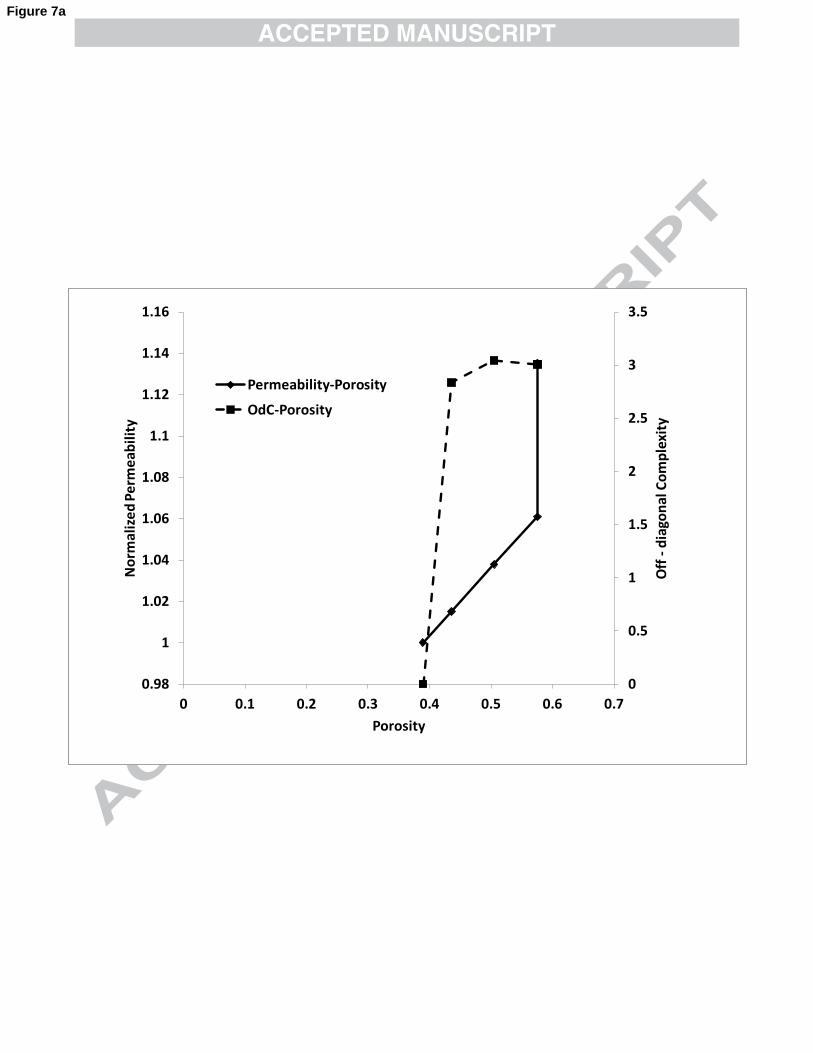
0
0.5
1
1.5
2
2.5
3
3.5
0.98
1
1.02
1.04
1.06
1.08
1.1
1.12
1.14
1.16
0 0.1 0.2 0.3 0.4 0.5 0.6 0.7
Off
- d
iago
nal
Co
mp
lexi
ty
No
rmal
ize
d P
erm
eab
ilit
y
Porosity
Permeability-Porosity
OdC-Porosity
Figure 7a

0
0.2
0.4
0.6
0.8
1
1.2
1.4
1.6
1.8
2
0.001
0.01
0.1
1
0 0.1 0.2 0.3 0.4 0.5
Off
- d
iago
nal
Co
mp
lexi
ty
No
rmal
ize
d P
erm
eab
ilit
y
Porosity
Figure 7b

0 0.2 0.4 0.6 0.8 10
10
20
30
40
50
60
70
80
90
Sw
No
rmal
ized
Pc
f=0f=0.2f=0.5f=0.8f=0.8 Mixed
Figure 8a

0 0.2 0.4 0.6 0.8 10
10
20
30
40
50
60
70
80
90
Sw
No
rmal
ized
Pc
Figure 8b

0 0.2 0.4 0.6 0.8 10
0.1
0.2
0.3
0.4
0.5
0.6
0.7
0.8
0.9
1
Sw
Kr
f0f0.2f0.5f0.8f0.8 Mixed
Figure 9a

0 0.2 0.4 0.6 0.8 10
0.2
0.4
0.6
0.8
1
Sw
Kr
Figure 9b

0 0.2 0.4 0.6 0.8 10
10
20
30
40
50
60
70
80
90
Sw
Nor
mal
ized
Pc
f=0f=0.2f=0.5f=0.8f=0.8 Mixed
Figure 10a

0 0.2 0.4 0.6 0.8 10
10
20
30
40
50
60
70
80
90
Sw
No
rmal
ized
Pc
Figure 10b

0 0.2 0.4 0.6 0.8 10
0.2
0.4
0.6
0.8
1
Sw
Kr
f0f0.2f0.5f0.8f0.8 Mixed
Figure 11a

0 0.2 0.4 0.6 0.8 10
0.1
0.2
0.3
0.4
0.5
Sw
Kr
Figure 11b

0
0.05
0.1
0.15
0.2
0.25
0.3
0.35
0.4
0.0001
0.001
0.01
0.1
1
0 0.1 0.2 0.3 0.4 0.5 O
ff -
dia
gon
al C
om
ple
xity
No
rmal
ized
Per
mea
bili
ty
Porosity
Permeability - Porosity
OdC - Porosity
Figure 12a

2.59
2.595
2.6
2.605
2.61
2.615
2.62
2.625
0
0.2
0.4
0.6
0.8
1
1.2
0 0.2 0.4 0.6 0.8 O
ff -
dia
gon
al C
om
ple
xity
No
rmal
ized
Per
mea
bili
ty
Porosity
Figure 12b

0 0.2 0.4 0.6 0.8 10
10
20
30
40
50
60
70
80
90
Sw
c0c0.1c0.13c0.17c0.2c0.23
Figure 13a

0 0.2 0.4 0.6 0.8 10
10
20
30
40
50
60
70
80
90
Sw
No
rmal
ized
Pc
Figure 13b

0 0.2 0.4 0.6 0.8 10
0.1
0.2
0.3
0.4
0.5
0.6
0.7
0.8
0.9
1
Sw
c0c0.1c0.13c0.17c0.2c0.23
Figure 14a
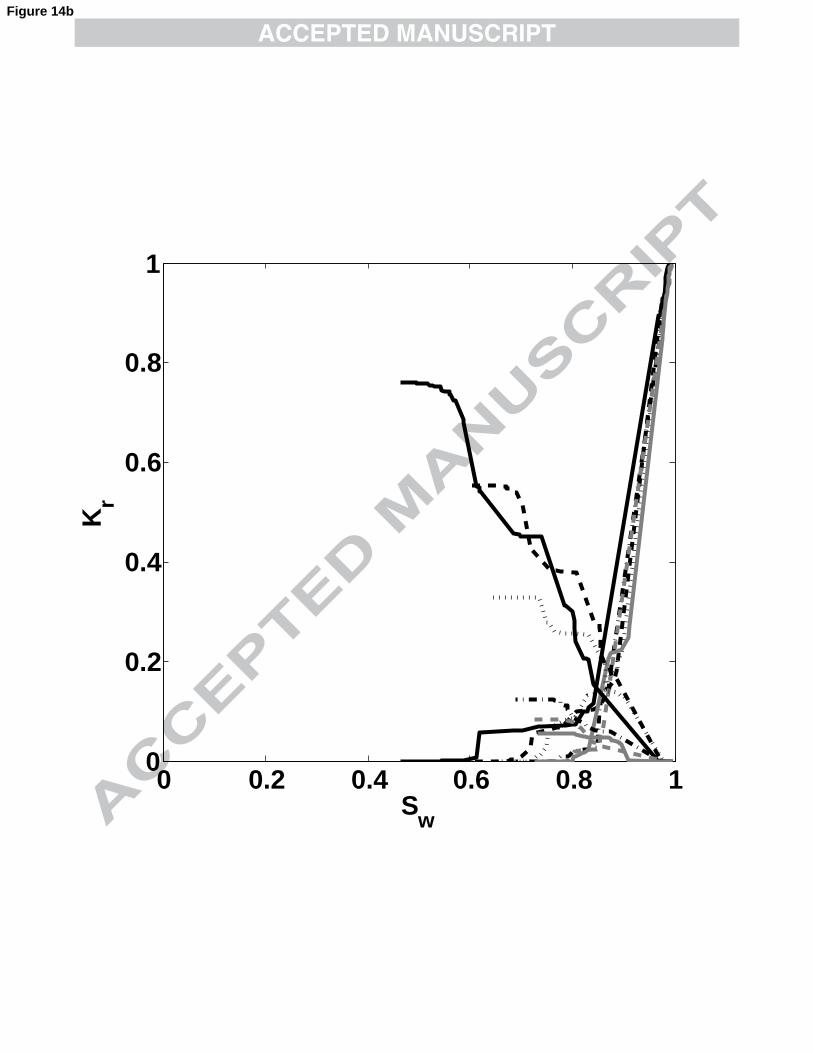
0 0.2 0.4 0.6 0.8 10
0.2
0.4
0.6
0.8
1
Sw
Kr
Figure 14b

0 0.2 0.4 0.6 0.8 10
10
20
30
40
50
60
70
80
90
Sw
No
rmal
ized
Pc
c0c0.1c0.13c0.17c0.2c0.23
Figure 15a

0 0.2 0.4 0.6 0.8 10
10
20
30
40
50
60
70
80
90
Sw
No
rmal
ized
Pc
Figure 15b

0 0.2 0.4 0.6 0.8 10
0.1
0.2
0.3
0.4
0.5
0.6
0.7
Sw
Kr
c0c0.1c0.13c0.17c0.2c0.23
Figure 16a

0 0.2 0.4 0.6 0.8 10
0.1
0.2
0.3
0.4
0.5
0.6
0.7
0.8
Sw
Kr
Figure 16b

5 10 15 200
0.2
0.4
0.6
0.8
1
1.2
1.4
a
Kno
rmal
ized
MacroGrain FilledPore Filled
Figure 17

5 10 15 200
0.1
0.2
0.3
0.4
0.5
0.6
0.7
a
Macro DrainageMacro ImbibitionPore Filled DrainagePore Filled ImbibitionGrain Filled DrainageGrain Filled Imbibition
Figure 18

0 0.05 0.1 0.15 0.2 0.250
0.1
0.2
0.3
0.4
0.5
0.6
0.7
0.8
0.9
1
Cemented Thickness
Sre
sidu
al
Drainage 1 sideImbibition 1 sideImbibition 2 sideDrainage 2 side
Figure 19
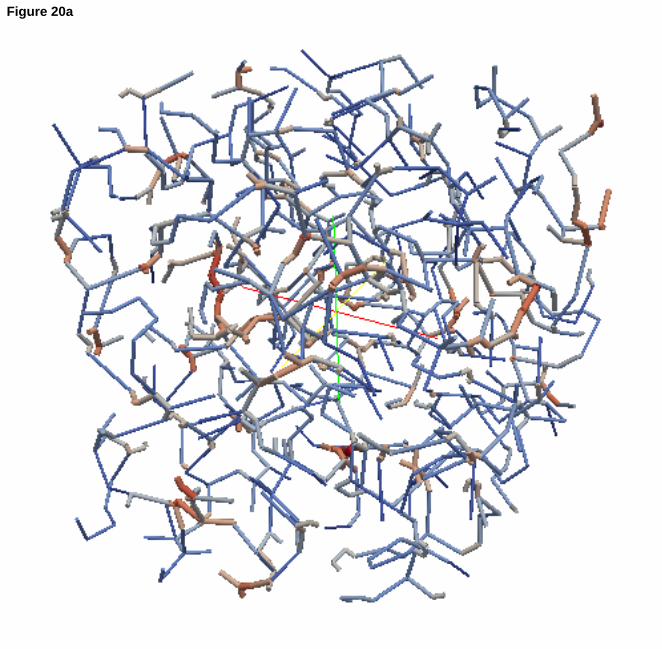

0 0.2 0.4 0.6 0.8 10
2
4
6
8
10
12
Sw
Nor
mal
ized
Pc
regular drainregular imbibetree draintree imbibe

0 0.2 0.4 0.6 0.8 10
0.2
0.4
0.6
0.8
1
Sw
k rnw
0 0.2 0.4 0.6 0.8 10
0.2
0.4
0.6
0.8
1
k0 0.2 0.4 0.6 0.8 1
0
0.2
0.4
0.6
0.8
1regulartree

0 0.2 0.4 0.6 0.8 10
0.2
0.4
0.6
0.8
1
Sw
k rnw
0 0.2 0.4 0.6 0.8 10
0.2
0.4
0.6
0.8
1
k0 0.2 0.4 0.6 0.8 1
0
0.2
0.4
0.6
0.8
1regulartree

29
1
Table 1. Multiscale networks created for a porous medium with clay filled pores and their 2 properties. In all cases before clay replacements began, the same starting macro network with 3 8022 pores and 14994 throats was used as in Table 1. 4
Fraction of clay-filled
macropores
Scaling factor b
Microporosity (%)
Total porosity
(%)
Number of pores
Number of throats
Network complexity
0 NA 0 38.92 8,022 14,994 0
0.2 5 4.62 43.54 128,689 281,062 2.8336
0.5 5 11.57 50.49 310,089 683,321 3.0441
0.8 5 18.63 57.54 494,213 1,091,362 3.0080
0.8 {3 4 5} mix
18.61 57.53 284,035 641,377 3.0038
5

30
1
Table 2. Multiscale networks created for a porous medium with clay filled pores and their 2 properties. In all cases before clay replacements began, the same starting macro network with 3 8022 pores and 14994 throats was used as in Table 1. 4
Fraction of clay-filled
macropores
Scaling factor b
Microporosity (%)
Total porosity
(%)
Number of pores
Number of throats
Network complexity
0 NA 0 38.92 8,022 14,994 0
0.2 5 1.73 32.84 50,656 112,672 1.8475
0.5 5 4.33 23.73 114,880 250,655 1.8015
0.8 5 6.89 14.72 177,923 376,104 1.6038
0.8 {3 4 5} mix
5.79 13.62 94,462 203,417 1.4771
5
6

1) Our deterministic algorithm adds microporosity into two-scale, 3D unstructured network
models.
2) Microporosity is added within partially dissolved grains or within pores.
3) Off-diagonal complexity can distinguish different types of microporosity added.
4) Relative permeability behavior strongly depends on the microporosity type.
5) If cementation disconnects larger scale porosity, sometimes neither fluid flows.