the effect of fast food restaurants on obesity and weight...
TRANSCRIPT
The Effect of Fast Food Restaurants on Obesity and Weight Gain
Janet Currie, Columbia University and NBER Stefano DellaVigna, UC Berkeley and NBER
Enrico Moretti, UC Berkeley and NBER Vikram Pathania, UC Berkeley
September 2009
Abstract. We investigate the health consequences of changes in the supply of fast food using the exact geographical location of fast food restaurants. Specifically, we ask how the supply of fast food affects the obesity rates of 3 million school children and the weight gain of over 3 million pregnant women. We find that among 9th grade children, a fast food restaurant within a tenth of a mile of a school is associated with at least a 5.2 percent increase in obesity rates. There is no discernable effect at .25 miles and at .5 miles. Among pregnant women, models with mother fixed effects indicate that a fast food restaurant within a half mile of her residence results in a 1.6 percent increase in the probability of gaining over 20 kilos, with a larger effect at .1 miles. The effect is significantly larger for African-American and less educated women. For both school children and mothers, the presence of non-fast food restaurants is uncorrelated with weight outcomes. Moreover, proximity to future fast food restaurants is uncorrelated with current obesity and weight gain, conditional on current proximity to fast food. The implied effects of fast-food on caloric intake are at least one order of magnitude larger for students than for mothers, consistent with smaller travel cost for adults. The authors thank John Cawley, the editor, two anonymous referees and participants in seminars at the NBER Summer Institute, the 2009 AEA Meetings, the ASSA 2009 Meetings, the Federal Reserve Banks of New York and Chicago, the FTC, the New School, the Tinbergen Institute, UC Davis, the Rady School at UCSD, and Williams College for helpful comments. We thank Joshua Goodman, Cecilia Machado, Emilia Simeonova, Johannes Schmeider, and Xiaoyu Xia for excellent research assistance. We thank Glenn Copeland of the Michigan Dept. of Community Health, Katherine Hempstead and Matthew Weinberg of the New Jersey Department of Health and Senior Services, and Rachelle Moore of the Texas Dept. of State Health Services for their help in accessing the data. The authors are solely responsible for the use that has been made of the data and for the contents of this article.
1

1. Introduction
In the public debate over obesity it is often assumed the widespread availability of
fast food restaurants is an important determinant of obesity rates. Policy makers in
several cities have responded by restricting the availability or content of fast food, or by
requiring posting of the caloric content of the meals (Abdollah, 2007; Mcbride, 2008;
Mair et al. 2005). But the evidence linking fast food and obesity is not strong. Much of
it is based on correlational studies in small data sets.
In this paper we seek to identify the causal effect of increases in the supply of fast
food restaurants on obesity rates. Specifically, using a detailed dataset on the exact
geographical location of restaurants, we ask how proximity to fast food affects the
obesity rates of over 3 million school children and the weight gain of 3 million pregnant
women. For school children, we observe obesity rates for 9th graders in California over
several years, and we are therefore able to estimate cross-sectional as well as fixed effects
models that control for characteristics of schools and neighborhoods. In the fixed effects
models we focus on the openings of new restaurants and compare the difference in the
change over time in obesity rates between schools that are located .1 miles from a new
fast food restaurant and schools that are located .25 miles or more from a new fast food
restaurant. For mothers, we employ the information on weight gain during pregnancy
reported in the Vital Statistics data for Michigan, New Jersey, and Texas covering fifteen
years. We focus on women who have at least two children so that we can follow a given
woman across two pregnancies and estimate models that include mother fixed effects. In
these models, we relate changes in weight gain for a mother between pregnancies to
changes in proximity to fast food between the pregnancies.
The design employed in this study allows for a more precise identification of the
effect of fast-food on obesity than the previous literature. First, we observe information
on weight for millions of individuals compared to at most tens of thousand in the
standard data sets used previously. This large sample size substantially increases the
power of our estimates. Second, we exploit very detailed geographical location
information, including distances of only one tenth of a mile. By comparing groups of
individuals who are at only slightly different distances to a restaurant, we can arguably
diminish the impact of unobservable differences in characteristics between the two
1
groups. Moreover, we take the idea that fast food location might reflect characteristics of
the area very seriously and test to see whether there are any observable patterns in
restaurant location within the very small areas we focus on. Third, we have a more
precise idea of the timing of exposure than many previous studies: The 9th graders are
exposed to fast food near their new school from September until the time of a spring
fitness test, while weight gain during pregnancy pertains to the 9 months of pregnancy.
While it is clear that fast food is often unhealthy, it is not obvious a priori that
changes in the availability of fast food should be expected to have an impact on health.
On the one hand, it is possible that proximity to a fast food restaurant simply leads local
consumers to substitute away from unhealthy food prepared at home or consumed in
existing restaurants, without significant changes in the overall amount of unhealthy food
consumed. On the other hand, proximity to a fast food restaurant could lower the
monetary and non-monetary costs of accessing unhealthy food.1
Ultimately, the effect of changes in the supply of fast food on obesity is an
empirical question. We find that among 9th grade children, the presence of a fast-food
restaurant within a tenth of a mile of a school is associated with an increase of about 1.7
percentage points in the fraction of students in a class who are obese relative to the
presence of a fast food restaurant at .25 miles. This effect amounts to a 5.2 percent
increase in the incidence of obesity among the affected children. Since grade 9 is the first
year of high school and the fitness tests take place in the spring, the period of fast-food
exposure is approximately 30 weeks, implying an increased caloric intake of 30 to 100
calories per school-day. The effect is larger in models that include school fixed effects.
Consistent with highly non–linear transportation costs, we find no discernable effect at
.25 miles and at .5 miles.
Among pregnant women, we find that a fast food restaurant within a half mile of a
residence results in a 0.19 percentage points higher probability of gaining over 20
kilograms (kg). This amounts to a 1.6 percent increase in the probability of gaining over
20 kilos. The effect increases monotonically and is larger at .25 and yet larger at .1 miles.
The increase in weight gain implies an increased caloric intake of 1 to 4 calories per day
1 In addition, proximity to fast food may increase consumption of unhealthy food even in the absence of any decrease in cost if individuals have self-control problems.
2
in the pregnancy period. The effect varies across races and educational levels. It is largest
for African American mothers and for mothers with a high school education or less. It is
zero for mothers with a college degree or an associate’s degree.
Our findings suggest that increases in the supply of fast food restaurants have a
significant effect on obesity, at least in some groups. On the other hand, our estimates do
not suggest that proximity to fast food restaurants is a major determinant of obesity:
Calibrations using our estimates indicate that increased supply of fast food can account
for 0.5 percent of the increase in obesity over the last 30 years among 9th graders, and for
2.7 percent of the increase in obesity over the past 10 years for women under 30.
It is in principle possible that our estimates reflect unmeasured shifts in the
demand for fast food. Fast food chains are likely to open new restaurants where they
expect demand to be strong, and higher demand for unhealthy food is almost certainly
correlated with higher risk of obesity. The presence of unobserved determinants of
obesity that may be correlated with increases in the number of fast food restaurants would
lead us to overestimate the role of fast food restaurants.
We can not entirely rule out this possibility. However, four points lend credibility
to our interpretation. First, our key identifying assumption for mothers is that, in the
absence of a change in proximity to fast food, and conditional on birth order, age, and so
on, mothers would gain a similar amount of weight in each pregnancy. Given that we are
looking at the change in weight gain for the same mother, this assumption seems credible.
Our key identifying assumption for schools is that, in the absence of a fast food
restaurant, schools that are .1 miles from a fast food and schools that are .25 miles from a
fast food would have similar obesity rates.2
Second, we directly investigate the extent to which there is selection on
observables. We find that observable characteristics of schools are not associated with
changes in the availability of a fast food in the immediate vicinity of a school: Fast food
restaurants are equally likely to be located within .1, .25, and .5 miles of a school. Also,
the observable characteristics of mothers that predict high weight gain are negatively (not
2 This assumption may appear problematic given previous research (Austin et al., 2005) which suggests that fast food restaurants are more prevalent within 1.5 miles of a school. However, we only require that, within a quarter of a mile from a school, the exact location of a new restaurant opening is determined by idiosyncratic factors such as where suitable locations become available.
3
positively) related to the presence of a fast-food chain, suggesting that any bias in our
estimates for mothers may be downward, not upward.
Third, while proximity to a fast food restaurant is associated with increases in
obesity rates and weight gains, proximity to non fast food restaurants has no discernible
effect on obesity rates or weight gains. This suggests that our estimates are not just
capturing increases in the local demand for restaurant establishments.
Finally, while current proximity to a fast food restaurant affects current obesity
rates, proximity to future fast food restaurants, controlling for current proximity, has no
effect on current obesity rates and weight gains. Taken together, the weight of the
evidence is consistent with a causal effect of fast food restaurants on obesity rates among
9th graders and on weight gains among pregnant women.
The estimated effects of fast-food on obesity are consistent with a model in which
access to fast-foods increases obesity by lowering food prices or by tempting consumers
with self-control problems.3 Differences in travel costs between students and mothers
could explain the different effects of proximity. Ninth graders have higher travel costs in
the sense that they are constrained to stay near the school during the school day, and
hence are more affected by fast-food restaurants that are very close to the school. For this
group, proximity to fast-food has a quite sizeable effect on obesity. In contrast, for
pregnant women, proximity to fast-food has a quantitatively small (albeit statistically
significant) impact on weight gain. Our results suggest that concerns about the effects of
fast-foods in the immediate proximity of schools are well-founded, since these restaurants
have a sizeable effect on obesity rates among affected students.
The remainder of the paper is organized as follows. In Section 2 we review the
existing literature. In Section 3 we describe our data sources. In Section 4, we present the
econometric models. In Sections 5 and 6 we present the empirical findings for students
and mothers, respectively. In Section 7 we discuss policy implications and conclude.
2. Existing Literature
3 See DellaVigna (2009). A model of cues in consumption (Laibson, 2001) has similar implications: a fast-food that is in immediate proximity from the school is more likely to trigger a cue that leads to over-consumption.
4

While there is considerable evidence in the epidemiological literature of
correlation between fast food consumption and obesity, it has been more difficult to
demonstrate a causal role for fast food. A recent review of about the relationship
between fast food and obesity (Rosenheck, 2008) concludes that “Findings from
observational studies as yet are unable to demonstrate a causal link between fast food
consumption and weight gain or obesity.”
A rapidly growing economics literature has focused on the link between
declining in food prices and obesity (see Philipson and Posner, 2008 for a review).4 A
series of recent papers explicitly focus on fast food restaurants as potential contributors to
obesity.5 The two papers closest to ours are Anderson and Matsa (2009) and Brennan and
Carpenter (2009). Anderson and Matsa focus on the link between eating out and obesity
using the presence of Interstate highways in rural areas as an instrument for restaurant
density. They find no evidence of a causal link between restaurants and obesity.
Our paper differs from Anderson and Matsa (2009) in three important dimensions,
and these differences are likely to explain the discrepancy in our findings. First, we have
a very large sample that allows us to identify even small effects. Our estimates of weight
gain for mothers are within the confidence interval of Anderson and Matsa’s two stage
least squares estimates. Second, we have the exact location of each restaurant, school
and mother. In contrast, Anderson and Matsa use a telephone exchanges the level of
geographical analysis. Given our findings, it is not surprising that at this level of
aggregation the estimated effect is zero. Third, the populations under consideration are
different. Anderson and Matsa focus on predominantly white rural communities, while
the bulk of both the 9th graders and the mothers we examine are urban. We show that the 4 For example, Lakdawalla and Philipson (2002) argue that about 40% of the increase in obesity from 1976 to 1994 is attributable to lower food prices. Courtemanche and Carden examine the impact on obesity of Wal-Mart and warehouse club retailers such as Sam’s club, Costco and BJ’s wholesale club which compete on price. 5 Chou et al. (2004) estimate models combining state-level price data with individual demographic and weight data from the Behavioral Risk Factor Surveillance surveys and find a positive association between obesity and the per capita number of restaurants (fast food and others) in the state. Rashad, Grossman, and Chou (2005) present similar findings using data from the National Health and Nutrition Examination Surveys. Anderson and Butcher (2005) investigate the effect of school food policies on the BMI of adolescent students. Anderson, Butcher, and Levine (2003) find that maternal employment is related to childhood obesity, and speculate that employed mothers might spend more on fast food. Cawley and Lui (2007) show that employed mothers spend less time cooking. Thomadsen (2001) estimate a discrete choice model of supply and demand that links prices to market structure and geographical dispersion of fast food outlets in California.
5
effects vary considerable depending on race. Indeed, when Dunn (2008) uses an
instrumental variables approach similar to the one used by Anderson and Matsa, he finds
no effect for rural areas or for whites in suburban areas, but strong effect for blacks and
Hispanics. As we show below, we also find stronger effects for minorities.
Brennan and Carpenter (2009) use individual-level student data from the
California Healthy Kids Survey. In contrast to our study, Brennan and Carpenter present
only cross-sectional estimates, and pool data from grades 7-12. They focus on fast food
restaurants within .5 miles of a school, although they also present results for within .25
miles of a school. Their main outcome measure is BMI, which is computed from self-
reported data on height and weight. Relative to their study, our study adds longitudinal
estimates, the focus on 9th graders, a better obesity measure, estimates for pregnant
mothers, and checks for possible unobserved differences between people and schools
located near fast food restaurants and others.
3. Data and Summary Statistics
Data for this project comes from three sources.
(a) School Data. Data on children comes from the California public schools for
the years 1999 and 2001 to 2007. The observations for 9th graders, which we focus on in
this paper, represent 3.06 million student-year observations. In the spring, California 9th
graders are given a fitness assessment, the FITNESSGRAM®. Data is reported at the
class level in the form of the percentage of students who are in the “healthy fitness zone”
with regard to body fat, and who have acceptable levels of abdominal strength, aerobic
capacity, flexibility, trunk strength, and upper body strength. What we will call obesity is
the fraction of students whose body fat measures are outside the healthy fitness zone. For
boys this means that they have body fat measures greater than 25% while for girls, it
means that they have body fat measures greater than 32%. Body fat is measured using
skin-fold calipers and two skinfolds (calf and triceps). This way of measuring body fat is
considerably more accurate than the usual BMI measure (Cawley and Burkhauser, 2006).
6

Since grade 9 is the first year of high school and the fitness tests take place in the Spring,
this impact corresponds to approximately 30 weeks of fast-food exposure.6 7
(b) Mothers Data. Data on mothers come from Vital Statistics Natality data from
Michigan, New Jersey, and Texas. These data are from birth certificates, and cover all
births in these states from 1989 to 2003 (from 1990 in Michigan). Confidential data
including mothers names, birth dates, and addresses, were used to construct a panel data
set linking births to the same mother over time, and then to geocode her location (again
using ArcView).8 The Natality data are very rich, and include information about the
mother’s age, education, race and ethnicity; whether she smoked during pregnancy; the
child’s gender, birth order, and gestation; whether it was a multiple birth; and maternal
weight gain. We restrict the sample to singleton births and to mothers with at least two
births in the sample, for a total of over 3.5 million births.
(c) Restaurant Data. Restaurant data with geo-coding information come from the
National Establishment Time Series Database (Dun and Bradstreet). These data are used
by all major banks, lending institutions, insurance and finance companies as the primary
system for creditworthiness assessment of firms. As such, it is arguably more precise and
comprehensive than yellow pages and business directories.9 We obtained a panel of
virtually all firms in Standard Industrial Classification 58 (“Eating and Drinking Places”)
from 1990 to 2006, with names and addresses. Using this data, we constructed several
different measures of “fast food” and “other restaurants,” as discussed further in
Appendix 1. In this paper, the benchmark definition of fast-food restaurants includes
only the top-10 fast-food chains in the country, namely, Mc Donalds, Subway, Burger
King, Taco Bell, Pizza Hut, Little Caesars, KFC, Wendy’s, Dominos Pizza, and Jack In 6 In very few cases, a high school is in the same location as a middle school, in which case the estimates reflect a longer-term impact of fast-food. 7 This administrative data set is merged to information about schools (including the percent black, white, Hispanic, and Asian, percent immigrant, pupil/teacher ratios, fraction eligible for free lunch etc.) from the National Center for Education Statistic’s Common Core of Data, as well as to the Start test scores for the 9th grade. The location of the school was geocoded using ArcView. Finally, we merged in information about the nearest Census block group of the school from the 2000 Census including the median earnings, percent high-school degree, percent unemployed, and percent urban. 8 In Michigan, the state created the panel and gave us de-identified data with latitude and longitude. In New Jersey, the matching was done at the state offices and then we used de-identified data. The importance of maintaining confidentiality of the data is one reason we do not use continuous distance measures in the paper. 9 The yellow pages are not intended to be a comprehensive listing of businesses - they are a paid advertisement. Companies that do not pay are not listed.
7
The Box. We also show estimates using a broader definition that includes both chain
restaurants and independent burger and pizza restaurants. Finally, we also measure the
supply of non-fast food restaurants. The definition of “other restaurants” changes with the
definition of fast food. Appendix Table 1 lists the top 10 fast food chains as well as
examples of restaurants that we did not classify as fast food.
Matching was performed using information on latitude and longitude of
restaurant location. Specifically, we match the schools and mother’s residence to the
closest restaurants using ArcView software. For the school data, we match the results on
testing for the spring of year t with restaurant availability in year t-1. For the mother
data, we match the data on weight gain during pregnancy with restaurant availability in
the year that overlaps the most with the pregnancy.
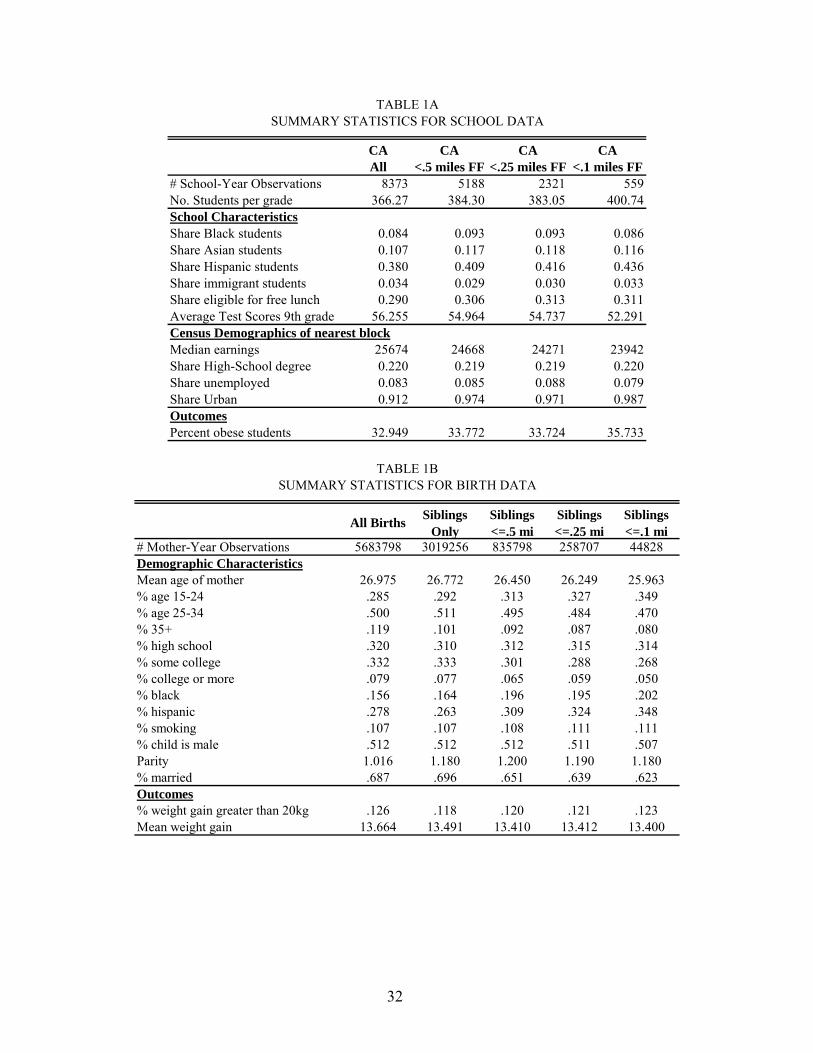
Summary Statistics. Using the data on restaurant, school, and mother’s locations,
we constructed indicators for whether there were fast food or other restaurants within .1,
.25, and .5 miles of either the school or the mother’s residence. Table 1a shows
summary characteristics of the schools data set by distance to a fast food restaurant,
where distances are overlapping. Here, as in most of the paper, we use the narrow
definition of fast-food, including the top-10 fast-food chains. Relatively few schools are
within .1 miles of a fast food restaurant, and the characteristics of these schools are
somewhat different than those of the average California school. Only 7% of schools have
a fast food restaurant within .1 miles, while 65% of all schools have a fast food restaurant
within 1/2 of a mile.10 Schools within .1 miles of a fast food restaurant have more
Hispanic students and lower test scores. They are also located in poorer and more urban
areas. The last row indicates that schools near a fast food restaurant have a higher
incidence of obese students than the average California school. Table 1b shows a similar
summary of the mother data. Again, mothers who live very near fast food restaurants
have different characteristics than the average mother. They are younger, less educated,
more likely to be black or Hispanic, and less likely to be married.
10 The average school in our sample had 4 fast foods within 1 mile and 24 other restaurants within the same radius.
8
4 Econometric Specifications
Our baseline specification for schools is
(1) Yst = α F1st + β F25st + γ F50st + α’ N1st + β’ N25st + γ’ N50st + δ Xst + θ Zst + ds + est,
where Yst is the fraction of students in school s in a given grade who are obese in year t;
F1st is an indicator equal to 1 if there is a fast food restaurant within .1 mile from the
school in year t; F25st is an indicator equal to 1 if there is a fast food restaurant within .25
miles from the school in year t; F50st is an indicator equal to 1 if there is a fast food
restaurant within .5 mile from the school in year t; N1st, N25st and N50st are similar
indicators for the presence of non-fast food restaurants within .1, .25 and .5 miles from
the school; ds is a fixed effect for the school.
The vectors Xst and Zst include school and neighborhood time-varying
characteristics that can potentially affect obesity rates. Specifically, Xst is a vector of
school-grade specific characteristics including fraction African-American, fraction native
American, fraction Hispanic, fraction immigrant, fraction female, fraction eligible for
free lunch, whether the school is qualified for Title I funding, pupil/teacher ratio, and 9th
grade tests scores, as well as school-district characteristics such as fraction immigrants,
fraction of non-English speaking students (LEP/ELL), share of IEP students. Zst is a
vector of characteristics of the Census block closest to the school including median
income, median earnings, average household size, median rent, median housing value,
percent white, percent black, percent Asian, percent male, percent unmarried, percent
divorced, percent with a high school degree, percent with an associate degree, percent
with college degree, percent with a post-graduate degree, percent in the labor force,
percent employed, percent with household income under $10,000, percent with
household income above $200,000, percent urban, percent of the housing stock that is
owner occupied. To account for heteroskedasticity caused by the fact that cells vary in
size, we weight all our models by the number of students in each cell. To account for the
possible correlation of the residual es within a school, we report standard errors clustered
by school. We run specifications both with and without school fixed effects.
9
The key identifying assumption is that after conditioning on the vector X and Z ,
the proximity of non-fast food restaurants and, in the panel specifications, also school
fixed effects, changes in other determinants of obesity rates are not systematically
correlated with changes in the proximity of fast food restaurants. In other words, in the
absence of a fast food, schools that are .1 miles from a fast food and schools that are .25
miles from a fast food are assumed to have similar changes in obesity rates. This
assumption is not incompatible with fast foods targeting schools when opening new
locations. It only requires that, within a quarter of a mile from a school, the exact
location of a new restaurant opening is determined by idiosyncratic factors. Since the
exact location of new retail establishments is determined by many factors, including the
timing of when suitable locations become available, this assumption does not appear
unrealistic. Below we report a number of empirical tests of this assumption.
It is important to note that the fast food indicators F1st, F25st and F50st are not
mutually exclusive. Similarly, we define the non-fast food indicators N1st, N25st and N50st
as not mutually exclusive. This means that the coefficient α, for example, is the
difference in the effect of having a fast food restaurant within .1 mile and the effect of
having a fast food restaurant within .25 miles. To compute the effect of having a fast food
restaurant within .1 mile (relative to the case where there is no fast food restaurant within
at least .5 miles) one needs to sum the three coefficients α+β+γ.
When we use the sample of mothers, our econometric specification is
(2) Yit = α F1it + β F25it + γ F50it + α’ N1it + β’ N25it + γ’ N50it + δ Xit + di + eit,
where Yit is either an indicator equal 1 if mother i gains more than 20Kg (or 15Kg)
during her tth pregnancy or mother i’s weight gain during her tth pregnancy; Xit is a
vector of time-varying mother characteristics including age dummies, four dummies for
education, dummies for race, Hispanic status, an indicator equal to 1 if the mother
smokes during pregnancy, and indicator for male child, dummies for parity, marital status
and year dummies,11 and di is a mother fixed effect. To account for the possible
correlation of the residual eit for the same individual over time, we report standard errors
11 Also included are indicators for missing education, race, Hispanic status, smoking and marital status.
10

clustered by mother. In an alternative set of specifications we include fixed effects for the
zip code of residence of the mother rather than mother fixed effects. This specification is
similar to the fixed effect specification for the schools.
Finally, there are two reasons for proximity to fast food to change for mothers.
They could stay in the same place and have a restaurant open (or close) close to them.
Or, they could move closer or further away from fast food between pregnancies. In
order to determine which of these two effects dominate, we also estimate models using
only women who stayed in the same place between pregnancies (These women are
designated stayers). In these models, the estimates reflect the estimated effects of having
a restaurant open (or close) near by between pregnancies.
One concern is the possible presence of measurement error. While our
information about restaurants comes from one of the most reliable existing data sources
on the location of retailers12, it is probably not immune from measurement error. Our
empirical findings point to an effect of fast food restaurants on obesity that declines with
distance. It is unlikely that measurement error alone is responsible for our empirical
finding. First, measurement error is likely to induce some attenuation bias in our
estimates (i.e. a downward bias). Second, even if measurement error did not induce
downward bias, it would have to vary systematically with distance, and there is no
obvious reason why this would be the case.13
12 Our data on restaurant are considered by some as the “best data source for studying business location” (Kolko and Neumark, 2008). 13 As an additional check, we used Google Map to check the distance between schools and restaurants for a random sample of our schools. This comparison is complicated by three problems. First, Google Map data are not immune from measurement error. In our search, we found some instances in which Google Map significantly misreported or missed the location of a business. Second, our data end in mid-2006, while current Google Maps reflect restaurant location at the end of 2008. There is considerable churning in this industry, so even if our data and Google data were perfectly correct, we could find some discrepancies. Third, our measure of distance is “as the crow flies”, while Google Map only provides driving distance. This latter issue is a problem because the key variable of interest for us is a dummy equal to 1 if the distance between the school and the restaurant is <.1 miles. Even small differences between distance measured “as the crow flies” and driving distance may lead us to incorrectly label our indicator as incorrect, when in fact it is correct. In the sub-sample of 30 schools that we checked by hand, we estimate a reliability ratio of .75. Given the three limitations described above, we consider this evidence as quite encouraging.
11

5. Empirical Findings: School Sample
(a) Benchmark Estimates. Table 2 shows our baseline empirical estimates of
the effect of changes in the supply of fast food restaurants on obesity rates (see equation 1
above). The dependent variable is the percentage of students in the 9th grade who are
classified as obese. Each column is from a different regression. Entries are the coefficient
on a dummy for the existence of a fast food restaurant at a given distance from the school
(coefficients α, β, and γ in equation 1) and coefficients on dummies for the existence of a
non-fast food restaurant at a given distance from the school (α’, β’ and γ’ in equation 1).
Recall that the fast food indicators are not mutually exclusive. Thus, the coefficient on
the .1 miles dummy is to be interpreted as the additional effect of having a fast food
restaurant within .1 mile over and above the effect of having a fast food restaurant within
.25 miles.
In column 1 we report unconditional estimates. There is generally a positive
association between availability of a fast food and obesity rates. Estimates in column 2
condition on school level controls, census block controls and year effects. We note that
standard errors are smaller in column 2 than in column 1, indicating that our controls do a
good job absorbing other determinants of obesity but leave enough variation for the
identification of the effect of interest. With controls, the only statistically significant
effect is associated with the availability of a fast food restaurant within .1 miles. To
illustrate the interpretation of this coefficient, compare two schools that are identical, but
one is located .09 miles from a fast food restaurant while the other one is located .24
miles from a fast food restaurant. The estimate of α in Column 2 indicates that in the
former the obesity rate is 1.7 percentage points higher than in the latter. This estimate is
both statistically significant and economically important: compared to a mean obesity
rate of 32.9, a fast food restaurant within .1 miles from a school results in a 5.2 percent
increase in the incidence of obesity. The coefficients on availability of fast food within
.25 miles (β) and on availability of fast food within .50 miles (γ) are statistically
insignificant. Increases in the number of non-fast food restaurants have no effect on
obesity, indicating that the effect of fast-food restaurants is specific and does not
generalize to any food establishment.
12
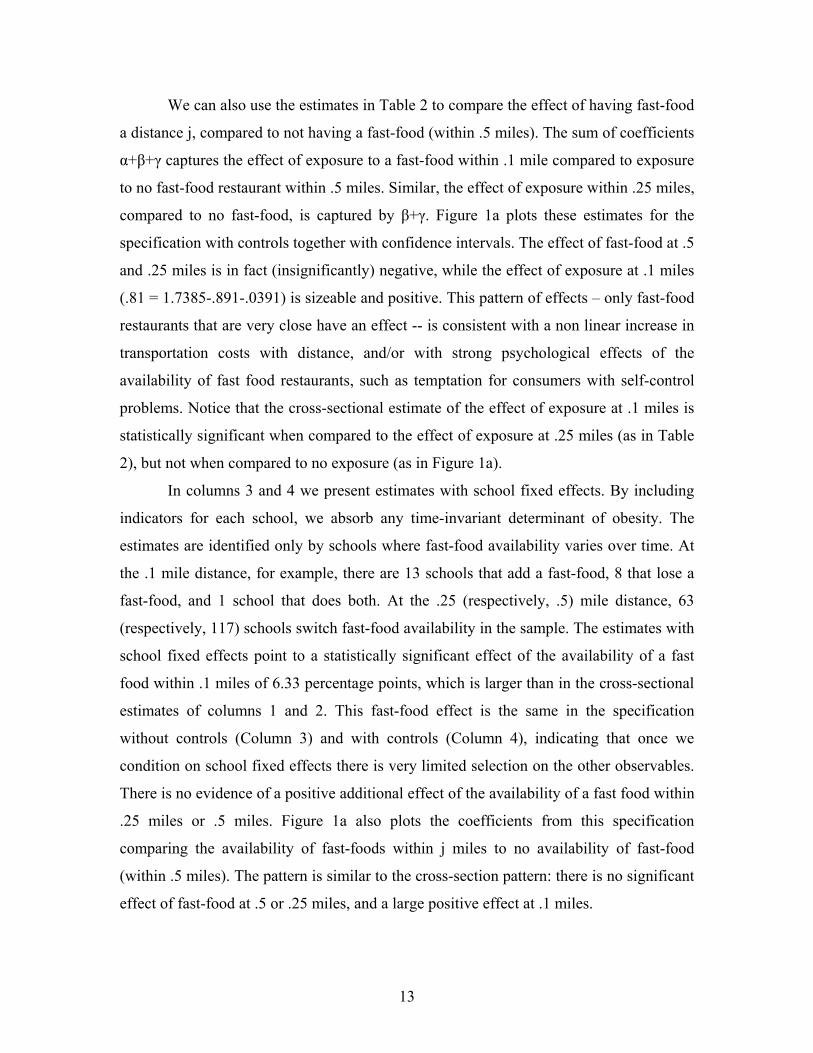
We can also use the estimates in Table 2 to compare the effect of having fast-food
a distance j, compared to not having a fast-food (within .5 miles). The sum of coefficients
α+β+γ captures the effect of exposure to a fast-food within .1 mile compared to exposure
to no fast-food restaurant within .5 miles. Similar, the effect of exposure within .25 miles,
compared to no fast-food, is captured by β+γ. Figure 1a plots these estimates for the
specification with controls together with confidence intervals. The effect of fast-food at .5
and .25 miles is in fact (insignificantly) negative, while the effect of exposure at .1 miles
(.81 = 1.7385-.891-.0391) is sizeable and positive. This pattern of effects – only fast-food
restaurants that are very close have an effect -- is consistent with a non linear increase in
transportation costs with distance, and/or with strong psychological effects of the
availability of fast food restaurants, such as temptation for consumers with self-control
problems. Notice that the cross-sectional estimate of the effect of exposure at .1 miles is
statistically significant when compared to the effect of exposure at .25 miles (as in Table
2), but not when compared to no exposure (as in Figure 1a).
In columns 3 and 4 we present estimates with school fixed effects. By including
indicators for each school, we absorb any time-invariant determinant of obesity. The
estimates are identified only by schools where fast-food availability varies over time. At
the .1 mile distance, for example, there are 13 schools that add a fast-food, 8 that lose a
fast-food, and 1 school that does both. At the .25 (respectively, .5) mile distance, 63
(respectively, 117) schools switch fast-food availability in the sample. The estimates with
school fixed effects point to a statistically significant effect of the availability of a fast
food within .1 miles of 6.33 percentage points, which is larger than in the cross-sectional
estimates of columns 1 and 2. This fast-food effect is the same in the specification
without controls (Column 3) and with controls (Column 4), indicating that once we
condition on school fixed effects there is very limited selection on the other observables.
There is no evidence of a positive additional effect of the availability of a fast food within
.25 miles or .5 miles. Figure 1a also plots the coefficients from this specification
comparing the availability of fast-foods within j miles to no availability of fast-food
(within .5 miles). The pattern is similar to the cross-section pattern: there is no significant
effect of fast-food at .5 or .25 miles, and a large positive effect at .1 miles.
13

(b) Magnitude of the Estimated Effect. Are the estimated effects plausible? To
investigate this question, we compute how many calories it would take per school day to
move a 14-year old boy of median height across different cut-offs for overweight status
and obesity. If a boy at the 80th percentile of BMI moves to the 85th percentile, which is
the cutoff for overweight, this corresponds to about a 5% increase in the fraction
overweight. Based on CDC (2000) growth charts, it only takes a weight gain of 3.6
pounds to move from the 80th to the 85th percentile of the BMI distribution. Over a period
of 30 weeks14, this corresponds to a gain of about 80 additional calories per school day.
Similarly, it would take 300 additional calories to move from the 90th to the 95th
percentile of BMI, where the later is the cutoff for obesity.
Based on these calibrations, the cross-sectional estimate of a 1.7 percentage point
increase in the obesity rate due to the immediate proximity of a fast-food restaurant
(column 2) corresponds to about 30 additional calories per day according to the first
calculation and 100 calories per day according to the second. These amounts can be
compared with the calories from a typical meal at a fast food restaurant, such as 540
calories for McDonald’s Big Mac, 990 calories for Burger King’s Double Whopper, 570
for McDonald’s regular fries, and 200 calories for a 16 ounce regular Coke.15 Even
assuming that a large portion of the calories consumed in fast-food restaurants are offset
by lower consumption at other meals, it is easy to obtain caloric intake increases that are
consistent with the observed effects.16 Ebbeling et al. (2004) report on a controlled
experiment of energy intake among overweight and non-overweight adolescents that
involved offering them a fast food meal during the day and found that energy intake from
14 30 weeks is the average length of time that the 9th graders are exposed to a nearby restaurant between the beginning of high school in Sept. and the fitness test. BMI percentiles and median height for 14 year old boys are taken from the CDC(2000) growth charts available from www.cdc.gov/nchs/data/nhanes/growthcharts/set1/all.pdf. 15 The fast food calories are from http://www.acaloriecounter.com/fast-food.php The estimate that it takes 3500 extra calories per week to gain a pound is from the CDC and is available from http://www.cdc.gov/nccdphp/dnpa/healthyweight/index.htm16 The calorie intake from the typical fast food meal is an order of magnitude larger than any plausible caloric expenditure in a round trip to a fast food restaurant. It would take at most 4 minutes to stroll the distance of 1-2 blocks to a fast food restaurant that is 0.1 miles away and a 14 year old boy of median weight (about 120 lbs) would expend about 30 calories on the trip. The weight for age charts for boys is available at http://www.cdc.gov/growthcharts/data/set1clinical/cj41c021.pdf while the calorie burn rate for walking at 3.5 mph can be computed at http://www.healthdiscovery.net/links/calculators/calorie_calculator.htm.
14

the meal among all participants was extremely large (1652 kcal). What is more striking is
that overweight participants consumed approximately 400 more total calories on fast food
days than non–fast food days while lean participants were able to offset their fast food
intakes. Thus, there appears to be at least a subset of children who do not offset fast food
calories effectively. The estimates in Table 2 appear therefore to be quite plausible.
(c) Additional Specifications. In Table 3 we present estimates from a variety of
alternative specifications. In column 1 we test how sensitive our results are to our
definition of fast food. Our estimates so far are based on our benchmark definition of
fast-food restaurants, which includes the top 10 chains (McDonald’s, Subway, Burger
King, Pizza Hut, Jack in the Box, Kentucky Fried Chicken, Taco Bell, Domino’s Pizza,
Wendy’s, and Little Ceasar’s). As Appendix Table 1 shows, the top 10 restaurants
account for 43 percent of all fast-food restaurants in the four states we study. In column 1
we add an indicator based on a broader definition of fast food based on the Wikipedia list
of fast food chains. Our broad definition starts with this list, excludes ice cream, donut,
and coffee shops, and adds in all independent restaurants that have the words “pizza” or
“burger” in their names. This allows us to capture some of the effect of small independent
restaurants, to the extent that they have the words “pizza” or “burger” in their names.17
The model indicates that this measure does not have any additional impact over and
above our baseline definition of fast food, suggesting that the top 10 fast foods are
qualitatively different from other fast food establishments. In column 2 we show
estimates using another alternative measure of fast food that excludes Subway
restaurants, which are arguably healthier than the other chains, from our list of top 10 fast
food restaurants. The results are essentially the same as using the benchmark definition.18
Column 3 shows estimates of a model in which we do not distinguish between
fast food and non-fast food restaurants. The key independent variable here is an indicator
equal to 1 for any restaurant. This specification is similar to the one emphasized by
17 The top restaurants in this classification are Starbucks, Dairy Queen, Baskin Robbins, and Jamba Juice (Appendix Table 1). 18 We also asked whether the availability of two or more fast foods within .1 miles had a greater impact than the availability of one fast food within .1 miles, but did not find any difference. This is not surprising, given the small number of cases with two or more fast-foods within .1 miles. See the web appendix Table 2 for details.
15

Anderson and Matsa (2009). Consistent with their findings, we find no evidence that the
presence of any restaurant affects obesity.
In columns 4 and 5 we test for racial differences. The estimates for whites (not
shown) are not very different from estimates based on the entire sample. The point
estimates are similar for Hispanic students (larger in the fixed effect estimates) and
smaller and not significant for African American students. One limitation is that reporting
is restricted to groups with at least 10 students. This restriction induces censoring that
varies by demographic group, which is of particular concern for African American
students, since the number of African American residents in California is limited. When
we split the sample by gender (not shown), the effect is substantially larger for female
students than for male students. We also attempted to consider variation in effects by
family income, using whether children were eligible for free school lunch as an income
proxy. The difference in the effects for the groups with and without free lunch status is
small and not statistically significant at conventional levels (not shown).
We have also considered a number of alternative specifications (see the Web
Appendix): (i) an optimal trimming model, where we include only schools that have a
propensity score between .1 and .9; (ii) a nearest neighborhood matching specification,
where we match on all the school level and block level covariates; and a (iii) a proximity
regression where we use only the subsample of schools that are within .25 miles of a fast
food restaurant and examine the effect of being within .1 miles. All of these
specifications yield estimates similar to those described above.
We also present results on the effect of fast food restaurants on alternative
measures of fitness in the web appendix including: abdominal strength, aerobic capacity,
flexibility, trunk strength and upper body strength. Cross-sectional estimates point to a
negative effect of fast food restaurant on flexibility. However, fixed effects estimates are
generally insignificant except for obesity. This finding is consistent with Cutler et al.’s
(2003), and Bleich et al.’s (2007) argument that rising obesity is linked to increased
caloric intake and not to reduced energy expenditure.
(d) Threats to Identification and Placebo Analysis. One concern with our
estimates is that even after conditioning on school fixed effects and time varying student
and neighborhood characteristics, the location of fast food restaurant may still be
16

associated with other determinants of obesity that we cannot control. After all, fast food
chains do not open restaurants randomly. Presumably, they open new restaurants in areas
where they expect demand for fast food to be strong.
We now turn to a discussion of the plausibility of our identifying assumptions.
We begin by asking whether observable characteristics of students are associated with
levels of (and changes in) the availability of a fast food near a school. In Table 4 we
replicate the main regressions of Table 2 but use as dependent variables six
characteristics of the school, such as the fraction of the students in the school who are
Black (column 1), share with free lunch (column 5), and average test scores (column 6).
These models exclude the relevant left hand side variable from the regressions. Panel A
reports cross-sectional estimates, while panel B reports estimates from fixed effects
models. Of the 36 estimated coefficients, only one is statistically significant, indicating
that student characteristics do not appear to be systematically associated with the
presence of fast food restaurants.
To implement a further placebo test, we generate the best linear predictor of the
share of obese students using the full set of controls X and Z. Then in Column 7 we
regress this variable on the variables for fast-food availability, as in Table 2, with no
controls (since these controls are now used as left-hand side variable). The regression
coefficients indicate how much fast-food availability loads on the same observables that
predict obesity. We find that, while this obesity predictor is significantly correlated with
availability of fast-food within .5 miles of a school in the cross-section, it is not
correlated with the availability of fast-food at closer distances (.25 miles or .1 mile), or in
the panel specification. This indicates that selection on unobservables is not likely an
important concern at close distances.
In the Web Appendix, we present an alternative approach to documenting the
extent of selection. We regress the availability of fast-food at different distances on the
set of demographic variables, essentially reversing the dependent and independent
variables relative to Table 4. This alternative specification allows us to conduct F-tests
for on the significance of all the controls. The finding, as in Table 4, is that there is no
evidence of selection at very close distances from a fast-food restaurant.
17
In panel C of Table 4 we present a geographic placebo: we test for whether fast
food restaurant are geographically uniformly distributed in the area around schools. If
they are, we expect the number of fast-foods within .25 (respectively, .5) miles of a
school to be 2.52 (respectively, 52) larger than the number of fast-foods within .1 mile of
a school. To make the test clearer and more conservative, we do not condition on the
controls that we use in the regressions. The results at the bottom of table 2A indicate that
we cannot reject the null hypothesis of uniform placement of fast-foods at either horizon.
While the placement of fast-foods may still be endogenous when comparing availability
at greater distances (Austin et al. 2005), at the distances that we consider in this paper we
find no evidence of endogenous placement. Overall, we find no systematic evidence of an
effect of demographic controls on fast-food availability at very small distances from a
school.
Table 5 presents a placebo test based on timing. This specification asks whether
changes in obesity rates are a function of future fast food restaurant locations and past
fast-food locations. If fast food restaurants open in areas that experience unobserved
upward trends in the demand for fast food, it is possible that current obesity rates may be
correlated with future (or lagged) fast food restaurant availability. Otherwise, we expect
that future fast-food exposure should not affect obesity rates. Similarly, lagged fast-food
presence near the school should not affect obesity rates since students in 9th grade are
typically starting high-school in a different location from where they attended middle
school. We include availability in year t and in year t+3 (t-3) of restaurants (fast-food and
not) within .1 miles, as well as the availability in year t of restaurants (fast-food and not)
within .25 and .5 miles (coefficients on .25 and .5 miles not reported in the Table).19
The findings in column 1 indicate that conditional on the availability of fast food
restaurants in year t, availability in year t+3 does not appear to be positively correlated
with obesity rates. The coefficient on availability of fast food restaurants 3 years later is
not statistically significant at conventional levels. Of course, since the availability of fast
food restaurants now and in 3 years is highly correlated, the standard errors are fairly
large. In column 2 the sample is restricted to schools that did not have a fast food
restaurant within .1 miles at time t. For these schools, the opening of a fast food
19 The results are similar if we use as placebo the availability of fast-food 2 years ahead and 2 years earlier.
18
restaurant 3 years later has virtually no correlation with current obesity rates. In Column
3 we report the results of exposure to lagged fast-food. We do not find any significant
effect of fast-food presence within .1 mile of the school 3 years prior, even though the
estimates are noisy and the contemporaneous effect is no longer significant.
(e) Effect by Grade. While in the remainder of the paper we focus on 9th graders
who are the most likely to be able to access fast-foods, Table 6 shows estimates for 5th
and 7th graders. We expect that younger students should have less freedom to leave
school for lunch and less pocket money, and hence that the effects should be smaller.
The estimates are largely supportive of this hypothesis, with one exception. Compared to
the estimates for 9th graders (reported for convenience in Columns 1 and 2), the estimated
effect of fast-food at .1 miles for 7th graders is much smaller and close to zero. The effect
is also small for 5th graders in the cross-section, but quite large (and significant) in the
panel. We do not see an obvious interpretation of this isolated finding.
6. Empirical Findings: Mother Sample
We now turn to results based on weight gain during pregnancy from the Vital
Statistics data. There are several motivations for this part of our analysis. While an
important reason for focusing on pregnant women is the availability of geographically
detailed data on weight measures for a very large sample, weight gain for pregnant
women is an important outcome in its own right. Excessive weight gain during pregnancy
is often associated with higher rates of hypertension, C-section, and large-for-gestational
age infants, as well as with a higher incidence of later maternal obesity (Gunderson and
Abrams, 2000; Lin, forthcoming; Rooney and Schauberger, 2002; Thorsdottir et al.,
2002; Wanjiku and Raynor, 2004). Figure 2 indicates that the incidence of low APGAR
scores (APGAR scores less than 8), an indicator of poor fetal health, increases
significantly with weight gain above about 15-20kg.
From the statistical point of view, the mother sample has important advantages
over the school sample, since it varies at the individual level and is longitudinally linked.
Since we observe weight gains for multiple pregnancies for the same mother, we can ask
how weight gain is affected by changes in the proximity to fast food between
pregnancies. It is important to examine the impact of exposure to fast foods on adults, as
19
well as school children. Moreover, one advantage of the weight gain measure is that
unlike weight in levels, only recent exposure to fast food should matter. For these
reasons, despite the lack of information on weight level and therefore obesity for
mothers, the results for mothers complement the results for school children.
(a) Benchmark Estimates. Table 7 presents our estimates of equation 2. The
dependent variable in columns 1, 2 and 3 is an indicator equal to 1 if weight gain is above
20kg. The dependent variable in column 4 is an indicator equal to 1 if weight gain is
above 15kg. We chose these measures given that the cutoff for adverse affects of
pregnancy weight gain is around 15-20kg. However, we also show estimates for
continuous weight gain in column 5.
The fixed-effect models with zip-code fixed effects (Column 1) and with mother
fixed effects (column 2) point to a positive effect of proximity to fast food on probability
of weight gain above 20 kg. We obtain similar results for the probability of weight gain
above 15kg. (Column 4) and continuous weight gain (Column 5), in both cases using the
specification with mother fixed effects. The availability of a fast food restaurant within .5
miles is associated with an increase of .19 percentage points (1.6 percent) in the
probability of weight gain larger than 20kg, an increase of .44 percentage points (1.3
percent) in the probability of weight gain larger than 15kg, and an increase of 0.049kg
(04 percent) in weight gain. Compared to the effect of exposure at .5 miles, the effect is
larger at .25 miles or at .1 miles, though the difference from the effect at .5 miles is not
statistically significant. As in the school sample, we find no evidence that non-fast food
restaurants are associated with positive effects on weight gain.
In these mother fixed effects models, proximity to a restaurant may change either
because a restaurant opens or closes, or because the mother changes location. In order to
isolate the effect of the former, we restrict the sample to mothers who did not move
between births. Results for this subsample (Column 3) on the effect of fast food
availability are somewhat larger than for the full sample (Column 2).
As we did for the school sample, we plot the cumulative effect of fast-food
exposure compared to no fast-food availability. Figure 1b shows the benchmark estimates
(from Column 2). There is a monotonic increase in the effect of availability from .5
miles, to .25 miles, and .1 miles. The effect of fast-food is significantly different from
20
zero at all distances. For 9th graders, instead, only availability of fast food within .1 miles
seems to matter, and fast food restaurants further away have no discernible impact on
obesity.
(b) Magnitude of the Estimated Effect. The estimated effect of exposure to
fast-food restaurants at a .5 mile distance is to increase the weight gain of mothers during
pregnancy by 49 grams (Table 7, Column 5). Dividing this weight gain of about 0.1
pounds by the approximately 270 days of pregnancy yields an increase in caloric intake
due to fast-food of about 1.3 calories per day. (This calculation uses the CDC estimate
that 3,500 additional calories induces a 1-pound weight increase). Even the larger
estimate of weight gain for fast-food proximity at .1 mile corresponds to only an
additional 4 calories per day. It is the large size of the data set that provides us with the
precision needed to identify such small effects. Overall, the caloric impacts of fast food
proximity for mothers are one to two orders of magnitude smaller than the estimates for
children. The findings are consistent with higher transport costs for the 9th graders (who
cannot drive) relative to mothers.
(c) Additional Specifications. Table 8 shows estimates from a number of
additional specifications. This Table follows the structure of Table 3. Columns 1 to 3
present estimate models in which only one measure of restaurant availability is included
in each regression, namely availability within .5 miles.
In column 1, we test whether a broader definition of fast food generates different
results. As we did for schools, the broader definition is based on the Wikipedia, excludes
ice cream, donut, and coffee shops, and adds in all independent restaurants that have the
words “pizza” or “burger” in their names. The model includes the indicator for one of the
top 10 fast food restaurants within .5 miles, an indicator for the presence of another fast
food restaurant within .5 miles, and an indicator for the presence of a non fast food
restaurant in this radius. The broader definition does not have any additional impact over
and above the baseline “top 10” definition, suggesting that there is something unique
about the largest and most widely known fast food brands.20 Column 2 shows estimates
from a model which excludes Subway from the top 10, since Subway is arguably
20 Robinson et al. (2007) report that young children consistently prefer food wrapped in familiar fast food packaging, suggesting that the advertising conducted by large chains is effective in spurring demand.
21
healthier than the other chains. Column 3 reports estimates of a model where the
independent variable is an indicator equal to 1 for any restaurant. Similar to our findings
for schools and consistent with Anderson and Matsa (2009), we find no evidence that the
presence of any restaurant affects weight gain during pregnancy.
In columns 4 to 7 we investigate whether weight gain varies by ethnicity and
maternal education. The effect of a new fast food restaurant is largest for African
American mothers followed by Hispanic mothers, with no effect for non-Hispanic white
mothers. In particular, the coefficient for African American mothers, .0066, is three times
the coefficient for the average mother. Relative to the average of the dependent variable
for African-Americans this amounts to a 5 percent increase in the probability of weight
gain over 20 kilos, a large effect. When we consider differences on the basis of education,
we find that the impact is much larger in the less educated group, and that indeed, there is
no effect on more educated mothers. The effect of non fast food restaurants is reliably
zero across the different racial and educational categories.
We have also estimated the effects of fast food on some additional birth
outcomes. The results suggest that the availability of a top 10 fast food restaurant within
.5 miles of the mother’s residence is associated with a slightly higher incidence of
diabetes. There is no effect on the probability that the mother had a very low weight gain
(clinically defined as less than 7.26kg) or on the probability of low birth weight.21
(d) Threats to Identification and Placebo Analysis. In column 1 of Table 9 we
ask whether there is evidence of changes in pregnancy weight gain as a function of future
fast food restaurant openings. While current fast food restaurants within 0.50 miles
increase the current probability of weight gain above 20Kg, there is no evidence that
future fast food restaurants increase weight gain. This is consistent with our identifying
assumption. Column 2 shows estimates from models that include indicators for whether
there was a fast food restaurant in the mother’s current location 3 years ago. This test is
not as strong as the other because it is possible that lagged fast food exposure could have
an effect on current weight gain. Here both current fast food and lagged fast food have
21 We also estimated an optimal trimming model, where we included only mothers with a propensity to have weight gain over 20kg of between .1 and .9 and models that only used the sample of mothers who lived within 1 mile of a fast food restaurant. The results were consistent with the benchmark estimates.
22

positive coefficients in the regression for weight gain over 20Kg, but neither coefficient
is statistically significant.22
In columns 3 and 4, we undertake a placebo test of a different type, asking
whether the availability of fast-food restaurants is correlated with individual-level
demographics, conditional on mother fixed effects. The few variables that are time-
varying within mothers include smoking during pregnancy and marital status. If our
identifying assumption is correct, these two outcome variables should not be correlated
with availability of fast food restaurants. Indeed, we find no evidence that probability of
smoking or marriage rates are correlated with fast food restaurants at any distance,
although the probability of smoking appears to be correlated with availability of non fast
food restaurants. In the Web Appendix we present further evidence on predictors of the
availability of fast-food restaurants.
7. Conclusions
This paper investigates the health consequences of proximity to fast food for two
vulnerable groups: young teens and pregnant women. The focus on very close distances
and the presence of a large array of controls alleviates issues of endogenous fast-food
placement. Our results point to a significant effect of proximity to fast food restaurant on
the risk of obesity, though the magnitude of the effect is very different for school children
and adults. The presence of a fast food restaurant within a tenth of a mile of a school is
associated with at least a 5.2 percent increase in the obesity rate in that school (relative to
the presence at .25 miles). Consistent with highly non-linear transportation costs for
school children, we find no evidence of an effect at .25 miles and at .5 miles. The effect
at .1 miles distance is equivalent to an increase in daily caloric consumption of 30 to 100
calories due to proximity of fast-food. The effect for pregnant women is quantitatively
smaller and more linear in distance. A fast food restaurant within half a mile of a
residence results in a 1.6 percent increase in the probability of gaining over 20 kilos. This
effect increases to a 5.5 percent increase when a fast-food is within .1 miles from the
22 We obtained very similar results if we examined 1 year or 2 year leads and lags.
23
residence of the mother. The effect at .5 miles translates into a daily caloric intake of 1 to
4 calories, two orders of magnitudes smaller than for school children.
The quantitative difference in the impact of fast-food between school children and
mothers has policy implications. To the extent that the estimates for mothers are
representative of the estimates for adults, attempts to limit the presence of fast-food
throughout residential areas are unlikely to have a sizeable impact on obesity. Instead,
narrower policies aimed at limiting access to fast food could have a sizable impact on
populations with limited ability to travel, such as school children.
Using our estimates, we can do a calibration of the impact of fast-food penetration
on school children and women. Taking into account that only about 6.7 percent of
schools (in our sample) have a fast-food restaurant within .1 miles, fast-food restaurants
near schools can be responsible for only 0.5 percent of the increase in obesity over the
last 30 years among 9th graders.23 This is because, although having a fast food restaurant
very close to the school has a large effect on affected ninth graders, relatively few
children have a restaurant so close. Still, the results suggest that measures designed to
limit access to fast food among teenagers more broadly (such as restrictions on
advertising to children, or requirements to post calorie counts) could have a beneficial
effect.24
For mothers, if we assume that the effect of fast-food on weight gain for pregnant
mothers is the same as for non-pregnant women, then fast-food restaurants near a
women’s residence could be responsible for about 2.7 percent of the increase in weight in
the last ten years among women.25 While we cannot explain a large share of the changes
23 According to our measure, about 33% of 9th graders in California were obese during 1999-2007. Since obesity among adolescents (age 12-19) approximately tripled from 1970 to late 1990s, we estimate the increase in obesity of 9th graders in the past 30 years to be about 22 percentage points. Hence, we compute the effect as 1.7 percentage points (the estimated impact of fast-food on obesity at .1 miles) multiplied by .067 (the share of schools at .1 miles in 1999-2007, assumed to be zero in the 1960s) divided by 22 percentage points. 24 Bollinger et al. (2009) find that posting calorie counts in Starbucks in New York City reduced calories consumed by about 6%, which is significant, but not large enough to have a major impact on obesity rates by itself. 25 CDC (using NHANES data) reports that obesity has risen by about 10 percentage points for 20-34 year old females over the past 10 years (from 18.5% in the 1988-94 wave to 28.4% in the 1999-2002 wave) and that the average weight in this group has increased by about 6.7 kilograms. Our estimates indicate that a fast-food restaurant within .5 miles of a residence increases weight gain by 49 grams over 9 months, which over a ten-year period translate to 650 grams. Since fast-foods are within .5 miles of a residence (in our
24
in obesity and weight in either case, one explanation of the larger fraction explained for
mothers is that the effect is found at a longer distance (.5 miles); the second is the longer
assumed exposure time. If, for example, having a fast food restaurant near the school
continued to influence children’s eating habits throughout highschool, then the
cumulative effect for teens might well be larger than that estimated here.
These findings add new evidence to the debate about the impact of fast-food on
obesity by providing credible evidence on magnitudes of the effect of fast-food. Still,
this research leaves several questions unanswered. We cannot speculate about the
generalizability of our research to other samples; it is possible that adolescents and
pregnant women are uniquely vulnerable to the temptations of fast food. In addition, our
research cannot distinguish between a rational price-based explanation of the findings
and a behavioral self-control-based explanation. Finally, since fast food is ubiquitous in
America, we cannot study the impact of fast-food entry in a society where fast food is
scarce. We hope that some of these questions will be the focus of future research.
data) for 27.7 percent of women, fast-food can have contributed to 650 grams times .277 divided by 6,700 grams, which equals 2.7 percent.
25

References Abdollah, Tami, “A Strict Order for Fast Food,” Los Angeles Times, A-1, Sept. 10, 2007. Anderson, Michael. and D.A. Matsa, “Are Restaurants Really Supersizing America?," Mimeo, UC Berkeley and Northwestern University, 2009. Anderson, P.M. and Kristin F. Butcher, “Reading, Writing and Raisinets: Are School Finances Contributing to Children's Obesity?," NBER Working Paper 11177, 2005. Anderson, P.M., Butcher, K.F., and Phillip Levine, “Maternal Employment and Overweight Children,” Journal of Health Economics, 22:477-504, 2002. Austin, S.B., Melly, S.J., Sanchez, B.N., Patel, A., Buka, S., and S.L. Gortmaker, “Clustering of Fast-Food Restaurants Around Schools: A Novel Application of Spatial Statistics to the Study of Food Environments,” American Journal of Public Health, 95(9): 1575-81, September 2005. Bleich, S., Cutler D.M., Murray, C.J., and A. Adams, “Why is the Developed World Obese?," NBER Working Paper 12954. 2007. Bollinger, B., Leslie, P., and Alan Sorensen, “Calorie Posting in Chain Restaurants,” Stanford University Department of Economics Working Paper, July 2009. Brennan, Davis and Christopher Carpenter, “Proximity of Fast-Food Restaurants to Schools and Adolescent Obesity” American Journal of Public Health, 99(3): 1-6, 2009. Cawley, John and Richard Burkhauser, “Beyond BMI: The Value of More Accurate Measures of Fatness and Obesity in Social Science Research,” NBER Working Paper 12291, July 2006. Cawley, John and Feng Liu, “Maternal Employment and Childhood Obesity: A Search for Mechanisms in Time Use Data,” NBER Working Paper 13600, November 2007. Chou, Shin-Yi, Grossman, M., and Henry Saffer, “An Economic Analysis of Adult Obesity : Results from the Behavioral Risk Factor Surveillance System," Journal of Health Economics, 23 (3): 565-587, 2004. Chou, Shin-Yi, Rashad, I., and Michael Grossman, “Fast-Food Restaurant Advertising on Television and its Influence on Childhood Obesity,” Journal of Law and Economics, forthcoming. Courtemance, Charles and Art Carden, “The Skinny on Big-Box Retailing: Wal-Mart, Warehouse Clubs, and Obesity,” Mimeo, University of North Carolina, Greensboro and Rhodes College, 2008.
26
Cutler, David M., Edward Glaeser, and Jesse M Shapiro, “Why have Americans become more obese?," Journal of Economic Perspectives, 17: 93-118, 2003 DellaVigna, Stefano, “Psychology and Economics: Evidence from the Field,” Journal of Economic Literature, 47: 315-372, 2009. Dunn, Richard “Obesity and the Availability of Fast-food: an instrumental variables approach, mimeo, 2008. Ebbeling, C.B., Sinclair, K.B., Pereira, M.A., Garcia-Lago., E., Feldman, H.A., and D.S. Ludwig, “Compensation for energy intake from last fast food among overweight and lean adolescents.," JAMA, 291: 2828-2833, 2004. Gunderson, Erica and Barbara Abrams. “Epidemiology of Gestational Weight Gain and Body Weight Changes after Pregnancy,” Epidemiology Review, 22(2): 261-274, 2000. Kolko, Jed and David Neumark, “Business Employment Decisions and Employment Dynamics in California”, Public Policy Institute of California, 2008. Lakdawalla, Darius and Thomas Philipson, “The Growth of Obesity and Technological Change : A Theoretical and Empirical Examination," NBER Working Paper 8946, 2002. Laibson, David, “A Cue-Theory of Consumption.” The Quarterly Journal of Economics, 116: 81-119, 2001.
Lin, Wanchuan, “Why has Health Inequality among Infants in the US Declined? Accounting for the Shrinking Gap,” forthcoming, Health Economics.
Mair, J., Pierce, M., and Stephen Teret. “The Use of Zoning to Restrict Fast Food Outlets: A Potential Strategy to Combat Obesity,” The Center for Law and the Public’s Health at Johns Hopkins and Georgetown Universities, October, 2005.
Mcbride, Sarah. “Exiling the Happy Meal,” Wall Street Journal, July 30, 2008. Philipson, Thomas and Richard Posner, “Economics of Obesity: A Decade of Research," forthcoming, Journal of Economic Literature. Rashad, I., Grossman, M., and Shin-Yi Chou. “The Super Size of America: An Economic Estimation of Body Mass Index and Obesity in Adults,” Eastern Economic Journal, 32(1): 133-148, Winter 2006. Rooney, Brenda and Charles Schauberger. “Excess Pregnancy Weight Gain and Long-Term Obesity: One Decade Later,” Obstetrics and Gynecology, 100(2): 245-253, 2002.
27
Rosenheck, R., “Fast Food Consumption and increased caloric intake: a systematic review of a trajectory towards weight gain and obesity risk," Obesity Reviews, 1-13, 2008. Thomadsen, Raphael, “Price Competition in Industries with Geographic Differentiation: Measuring the Effect of Location on Price in the Fast Food Industry”, Mimeo, Columbia Business School, 2001. Thorsdottir, I., Torfadottir. J.E., Birgisdottir, B.E., and R.T. Geirsson. “Weight Gain in Women of Normal Weight before Pregnancy: Complications in Pregnancy or Delivery and Birth Outcome,” Obstetrics and Gynecology, 99: 799-806, May 2002. Wanjiku, K., and B.D. Raynor. “Obstetric Outcomes Associated with Increase in BMI Category During Pregnancy,” American Journal of Obstetrics and Gynecology, 191(3): 928-932, 2004.
28

Appendix 1: Definition of Fast Food Restaurant
There is little consensus about the definition of fast food in the literature. For example, the American Heritage Dictionary definies fast food as “Inexpensive food, such as hamburgers and fried chicken, prepared and served quickly.” While everyone agrees that prominent chains such as McDonald’s serve fast food, there is less agreement about whether smaller, independent restaurants are also “fast food.”
The Census of Retail trade defines a fast food establishment as one that does not offer table service. Legislation recently passed in Los Angeles imposing a moratorium on new fast food restaurants in south central L.A. defined fast food establishments as those that have a limited menu, items prepared in advance or heated quickly, no table service, and disposable wrappings or containers (Abdollah, 2007). However, these definitions do not get at one aspect of concern about fast food restaurants, which is their heavy reliance on advertising, and easy brand recognition.
We constructed several different measures of fast food. Our benchmark definition of fast-food restaurants focuses on the top 10 chains, which are McDonald’s, Subway, Burger King, Pizza Hut, Jack in the Box, Kentucky Fried Chicken, Taco Bell, Domino’s Pizza, Wendy’s, and Little Ceasar’s. We have also constructed a broader definition using Wikipedia’s list of national fast food chains (en.wikipedia.org/wiki/Fast_food). Wikipedia considers fast food to be “Food cooked in bulk and in advance and kept warm, or reheated to order.” Our broadest definition starts with this list, excludes ice cream, donut, and coffee shops, and adds in all independent restaurants from our Dun and Bradstreet list that have the words “pizza” or “burger” in their names. The definition of “other restaurant” depends on the definition of fast food.
As discussed in the paper, we find a larger impact of the top 10 fast-food chains than for the broader definition of fast-foods. To conserve space, we show estimates for the broad definition excluding ice cream, donuts, and coffee shops, and for the top 10 chains.
Appendix Table 1 shows more information about the top 10 fast food restaurants, other major restaurant chains, and chains that are not counted as fast food for the four states in our study (California, Michigan, New Jersey, and Texas).
29
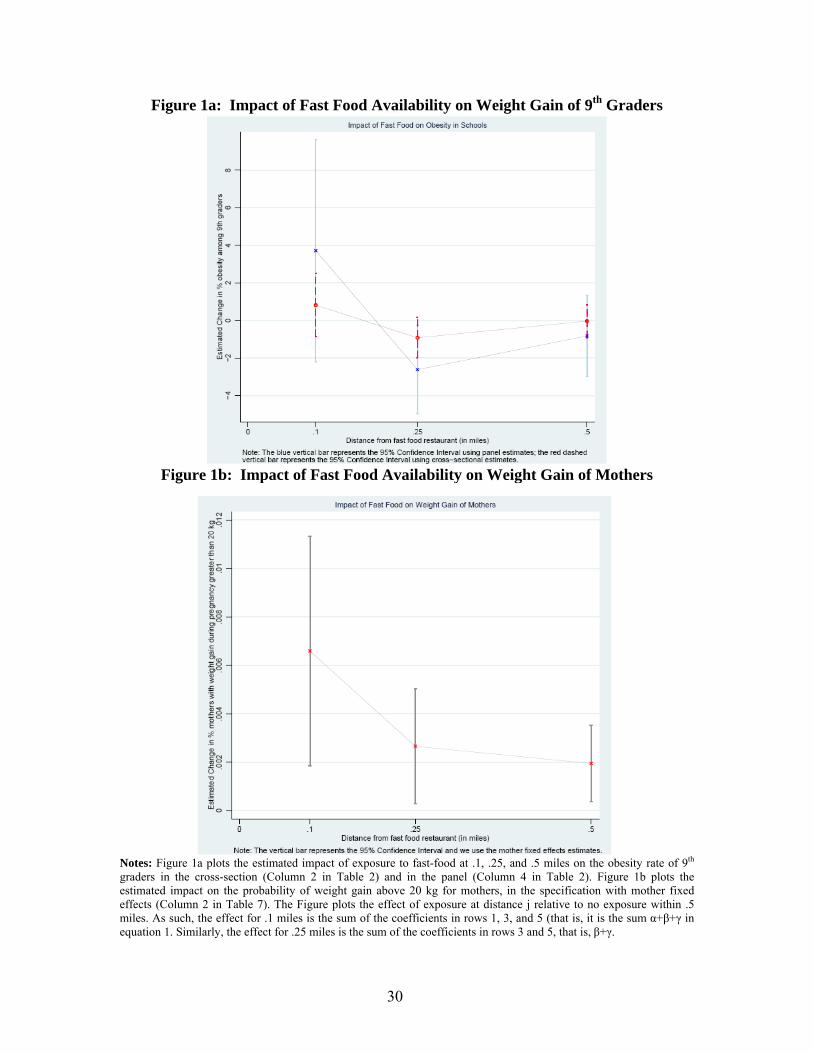
Figure 1a: Impact of Fast Food Availability on Weight Gain of 9th Graders
Figure 1b: Impact of Fast Food Availability on Weight Gain of Mothers
Notes: Figure 1a plots the estimated impact of exposure to fast-food at .1, .25, and .5 miles on the obesity rate of 9th graders in the cross-section (Column 2 in Table 2) and in the panel (Column 4 in Table 2). Figure 1b plots the estimated impact on the probability of weight gain above 20 kg for mothers, in the specification with mother fixed effects (Column 2 in Table 7). The Figure plots the effect of exposure at distance j relative to no exposure within .5 miles. As such, the effect for .1 miles is the sum of the coefficients in rows 1, 3, and 5 (that is, it is the sum α+β+γ in equation 1. Similarly, the effect for .25 miles is the sum of the coefficients in rows 3 and 5, that is, β+γ.
30
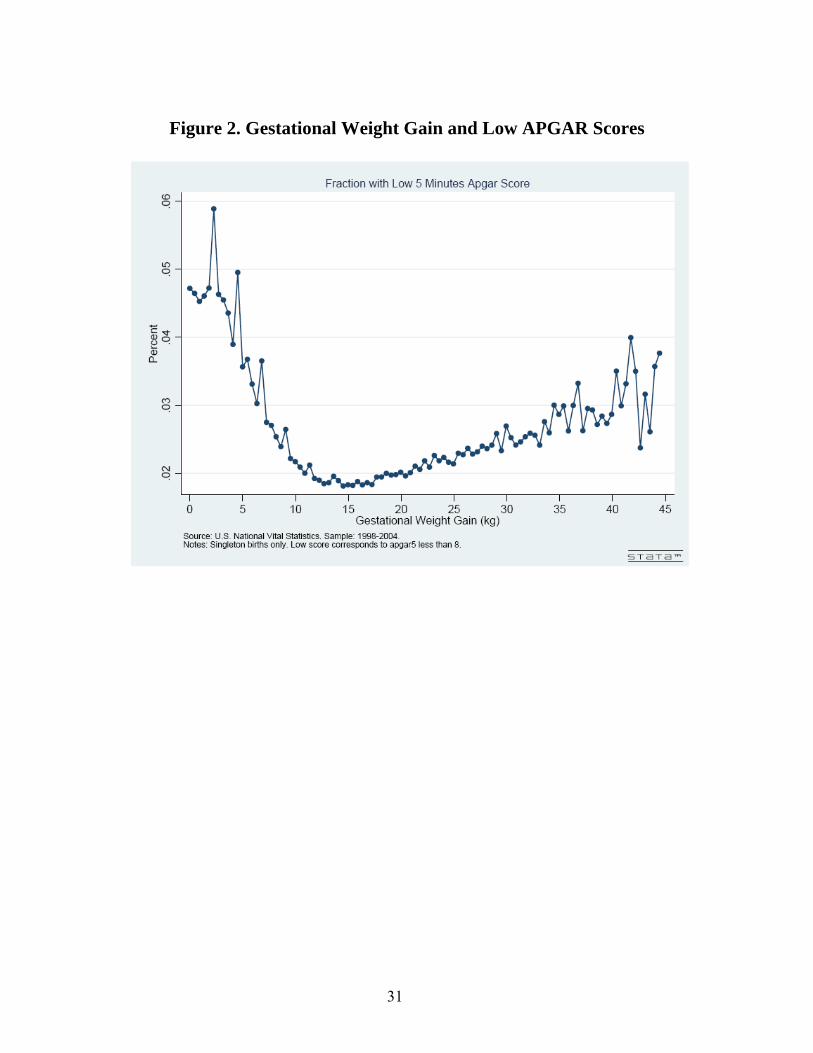
Figure 2. Gestational Weight Gain and Low APGAR Scores
31
CA CA CA CAAll <.5 miles FF <.25 miles FF <.1 miles FF
# School-Year Observations 8373 5188 2321 559No. Students per grade 366.27 384.30 383.05 400.74School CharacteristicsShare Black students 0.084 0.093 0.093 0.086Share Asian students 0.107 0.117 0.118 0.116Share Hispanic students 0.380 0.409 0.416 0.436Share immigrant students 0.034 0.029 0.030 0.033Share eligible for free lunch 0.290 0.306 0.313 0.311Average Test Scores 9th grade 56.255 54.964 54.737 52.291Census Demographics of nearest blockMedian earnings 25674 24668 24271 23942Share High-School degree 0.220 0.219 0.219 0.220Share unemployed 0.083 0.085 0.088 0.079Share Urban 0.912 0.974 0.971 0.987OutcomesPercent obese students 32.949 33.772 33.724 35.733
TABLE 1ASUMMARY STATISTICS FOR SCHOOL DATA
All Births Siblings Only
Siblings <=.5 mi
Siblings <=.25 mi
Siblings <=.1 mi
# Mother-Year Observations 5683798 3019256 835798 258707 44828Demographic CharacteristicsMean age of mother 26.975 26.772 26.450 26.249 25.963% age 15-24 .285 .292 .313 .327 .349% age 25-34 .500 .511 .495 .484 .470% 35+ .119 .101 .092 .087 .080% high school .320 .310 .312 .315 .314% some college .332 .333 .301 .288 .268% college or more .079 .077 .065 .059 .050% black .156 .164 .196 .195 .202% hispanic .278 .263 .309 .324 .348% smoking .107 .107 .108 .111 .111% child is male .512 .512 .512 .511 .507Parity 1.016 1.180 1.200 1.190 1.180% married .687 .696 .651 .639 .623Outcomes% weight gain greater than 20kg .126 .118 .120 .121 .123Mean weight gain 13.664 13.491 13.410 13.412 13.400
TABLE 1BSUMMARY STATISTICS FOR BIRTH DATA
32
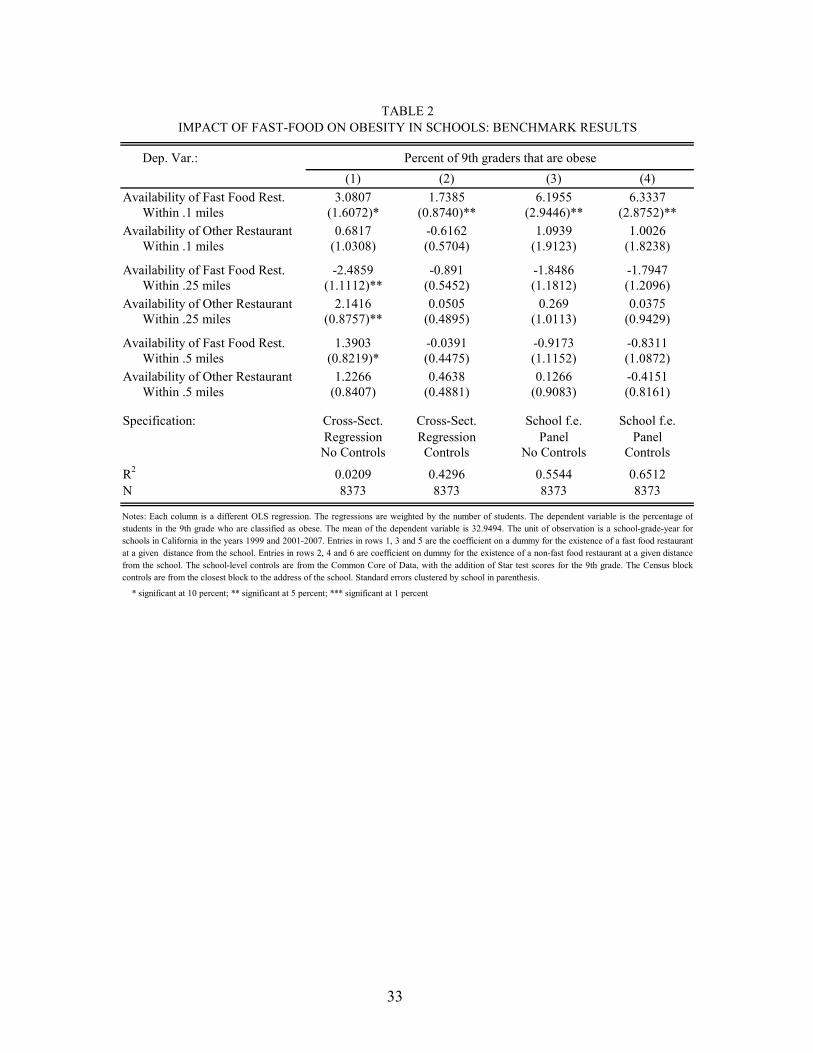
Dep. Var.:(1) (2) (3) (4)
3.0807 1.7385 6.1955 6.3337Within .1 miles (1.6072)* (0.8740)** (2.9446)** (2.8752)**
0.6817 -0.6162 1.0939 1.0026Within .1 miles (1.0308) (0.5704) (1.9123) (1.8238)
-2.4859 -0.891 -1.8486 -1.7947Within .25 miles (1.1112)** (0.5452) (1.1812) (1.2096)
2.1416 0.0505 0.269 0.0375Within .25 miles (0.8757)** (0.4895) (1.0113) (0.9429)
1.3903 -0.0391 -0.9173 -0.8311Within .5 miles (0.8219)* (0.4475) (1.1152) (1.0872)
-0.4151(0.8161)
School f.e.Panel
Controls
0.65128373
ble is the percentage o
1.2266 0.4638 0.1266Within .5 miles (0.8407) (0.4881) (0.9083)
Cross-Sect. Cross-Sect. School f.e.Regression Regression PanelNo Controls Controls No Controls
0.0209 0.4296 0.55448373 8373 8373
R2
N
Notes: Each column is a different OLS regression. The regressions are weighted by the number of students. The dependent varia fstudents in the 9th grade who are classified as obese. The mean of the dependent variable is 32.9494. The unit of observation isschools in California in the years 1999 and 2001-2007. Entries in rows 1, 3 and 5 are the coefficient on a dummy for the existenceat a given distance from the school. Entries in rows 2, 4 and 6 are coefficient on dummy for the existence of a non-fast food restaufrom the school. The school-level controls are from the Common Core of Data, with the addition of Star test scores for the 9th grcontrols are from the closest block to the address of the school. Standard errors clustered by school in parenthesis.
* significant at 10 percent; ** significant at 5 percent; *** significant at 1 percent
Specification:
Availability of Other Restaurant
a school-grade-year forof a fast food restaurantrant at a given distanceade. The Census block
Availability of Fast Food Rest.
Availability of Other Restaurant
TABLE 2IMPACT OF FAST-FOOD ON OBESITY IN SCHOOLS: BENCHMARK RESULTS
Percent of 9th graders that are obese
Availability of Fast Food Rest.
Availability of Fast Food Rest.
Availability of Other Restaurant
33

Dep. Var.:Hispanic St. Black Stud.
(1) (2) (3) (4) (5)3.015 2.0067 -1.5417
Within .1 miles (1.6378)* (1.0135)** (1.2056)0.0887
Restaurant Within .1 miles (1.7305)0.3447
Within .1 miles (1.0437)1.7223
Subway) Within .1 miles (0.9071)*-0.6134 -0.3049 -0.4451
Within .1 miles (0.5648) (0.6169) (0.8610)-0.4719
Within .1 miles (0.5393)
Cross-Section Cross-Section Cross-Section Cross-Section Cross-SectionOLS OLS OLS OLS OLS
Yes Yes Yes Yes Yesat .25 and .5 miles
32.9494 32.9494 32.9494 36.9517 35.4517
0.0219 0.4295 0.4287 0.2215 0.25128373 8373 8373 6946 2851
The school-level controls are from the Common Core of Data, with the addition of Star test scores for the 9th grade. The Census block controls are from the closestblock to the address of the school. Standard errors clustered by school in parenthesis. The specifications in Columns (4) and (5) include fewer observations because onlyschool-year observations with at least 10 students in the race category report the data.
Notes: Each column is a different OLS regression. The regressions are weighted by the number of students. The dependent variable in columns 1-3 is the percentage ofstudents in the 9th grade who are classified as obese. The dependent variable in columns 4 and 5 is the percentage of Hispanic and Black students respectively in the 9thgrade who are classified as obese.The unit of observation is a school-grade-year for schools in California in the years 1999 and 2001-2007. Entries in row 1 and 3 are thecoefficient on a dummy for the existence of a fast fast food restaurant and a non-fast food restaurant closer than .1 miles from the school. The entry in row 2 is thecoefficient on a dummy for whether there is a fast food restaurant according to a broader definition (and not included in the benchmark definition) less than .1 miles fromthe school. The broad definition includes all restaurants classified as fast-foods by Wikipedia. The entry in row 4 is the coefficient on a dummy for proximity to one ormore of the top 10 fast food chains excluding Subway.
* significant at 10 percent; ** significant at 5 percent; *** significant at 1 percent
N
TABLE 3IMPACT OF FAST-FOOD ON OBESITY IN SCHOOLS: ADDITIONAL MODELS
Availability of Fast Food Rest.
Availability of Other Rest.
Percent of 9th graders that are obeseAll Students
R2
Availability of Fast Food (Broad Def.)
Specification:
Includes Controls for Restaurants
Availability of Non-Fast Food Rest.
Availability of Fast Food Rest. (Exclud.
Availability of Any Restaurant
Average of Dependent Variable
34

Dep. Var.: Share BlackShare
Hispanic Share AsianShare Title I
StudentsShare Free
LunchAverage
Test ScorePred. Obesity
Based on Controls(1) (2) (3) (4) (5) (6) (7)
Panel A. Cross-Section-0.0072 -0.004 -0.0205 0.0459 -0.0426 -2.6323 1.4362
Within .1 miles (0.0097) (0.0215) (0.0158) (0.0678) (0.0260) (1.4392)* (1.3380)-0.0062 0.0186 0.0092 -0.0633 0.0165 1.2676 -1.6125
Within .25 miles (0.0073) (0.0145) (0.0093) (0.0375)* (0.0135) (0.9118) (0.9583)*0.0113 -0.0026 -0.0021 0.0266 0.0004 0.8849 1.4154
Within .5 miles (0.0058)* (0.0105) (0.0068) (0.0303) (0.0088) (0.5992) (0.6624)**
Controls for availability ofOther Restaurants X X X X X X X
Panel B. Fixed-Effect Panel-0.004 -0.0016 -0.0037 -0.0365 -0.0408 -0.332 -0.0092
Within .1 miles (0.0042) (0.0081) (0.0036) (0.0390) (0.0281) (1.4578) (0.5481)0.0028 -0.0017 0.0064 0.0403 0.0028 0.6032 -0.0483
Within .25 miles (0.0025) (0.0061) (0.0037)* (0.0482) (0.0153) (1.1248) (0.4146)-0.0033 -0.0038 0.0009 0.0028 0.0137 -2.6662 -0.2734
Within .5 miles (0.0021) (0.0047) (0.0026) (0.0346) (0.0120) (0.8019)*** (0.1914)
Controls for availability ofOther Restaurants X X X X X X X
Controls included No school No school No school No school No school No test No demographicsDemogr. Demogr. Demogr. Demogr. Demogr. Score
Average of Dependent Variable 0.0843 0.3804 0.1072 0.3971 0.2901 57.6665 32.8015
8373 8373 8373 8373 8373 8168 8373Panel C. Test of Uniform Distribution of Fast-FoodsNo. fast foods at .25 miles - (No. fast foods at .1 miles * (2.5)^2) = -.0135 (s.e. .0552), n.s.No. fast foods at .5 miles - (No. fast foods at .1 miles * 5^2) = -.1335 (s.e. .2245), n.s.
* significant at 10 percent; ** significant at 5 percent; *** significant at 1 percent
Availability of Fast Food Rest.
Availability of Fast Food Rest.
Availability of Fast Food Rest.
N
Notes: Each column is a different OLS regression. The regressions are weighted by the number of students. The dependent variables are different school-level demographic variables. The dependentvariable in Column 7 is the predicted share of obese students based on a regression of the share obese on all the demographic controls. The unit of observation is a school-grade-year for schools inCalifornia in the years 1999 and 2001-2007. The school-level controls are from the Common-Core data, with the addition of Star test scores for the 9th grade. The Census block controls are from theclosest block to the address of the school. Standard errors clustered by school in parenthesis.
Availability of Fast Food Rest.
Availability of Fast Food Rest.
Availability of Fast Food Rest.
TABLE 4IMPACT OF FAST-FOOD ON OBESITY IN SCHOOLS: PLACEBOS USING DEMOGRAPHIC VARIABLES
35
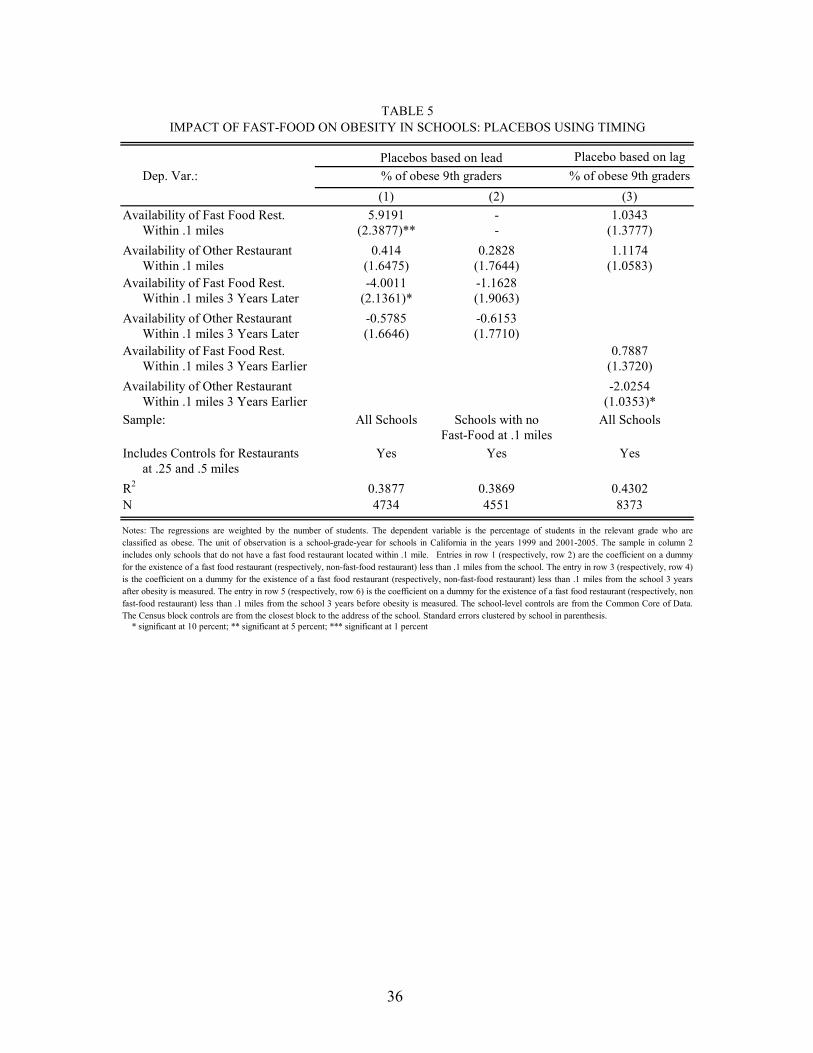
36
Placebo based on lagDep. Var.: % of obese 9th graders
(1) (2) (3)5.9191 - 1.0343
Within .1 miles (2.3877)** - (1.3777)0.414 0.2828 1.1174
Within .1 miles (1.6475) (1.7644) (1.0583)-4.0011 -1.1628
Within .1 miles 3 Years Later (2.1361)* (1.9063)-0.5785 -0.6153
Within .1 miles 3 Years Later (1.6646) (1.7710)0.7887
0)25453)*
ools
2
Availability of Fast Food Rest.
Availability of Other Restaurant
Availability of Fast Food Rest.
TABLE 5IMPACT OF FAST-FOOD ON OBESITY IN SCHOOLS: PLACEBOS USING TIMING
Availability of Fast Food Rest.
Availability of Other Restaurant
Placebos based on lead% of obese 9th graders
grade who aree in column 2t on a dummytively, row 4)
school 3 yearspectively, non
Within .1 miles 3 Years Earlier (1.372-2.0
Within .1 miles 3 Years Earlier (1.03All Schools Schools with no All Sch
Fast-Food at .1 milesYes Yes Yes
at .25 and .5 miles0.3877 0.3869 0.4304734 4551 8373
Includes Controls for Restaurants
Sample:
Availability of Other Restaurant
R2
N
Notes: The regressions are weighted by the number of students. The dependent variable is the percentage of students in the relevantclassified as obese. The unit of observation is a school-grade-year for schools in California in the years 1999 and 2001-2005. The samplincludes only schools that do not have a fast food restaurant located within .1 mile. Entries in row 1 (respectively, row 2) are the coefficienfor the existence of a fast food restaurant (respectively, non-fast-food restaurant) less than .1 miles from the school. The entry in row 3 (respecis the coefficient on a dummy for the existence of a fast food restaurant (respectively, non-fast-food restaurant) less than .1 miles from theafter obesity is measured. The entry in row 5 (respectively, row 6) is the coefficient on a dummy for the existence of a fast food restaurant (res -fast-food restaurant) less than .1 miles from the school 3 years before obesity is measured. The school-level controls are from the CommonThe Census block controls are from the closest block to the address of the school. Standard errors clustered b
Core of Data.y school in parenthesis.
* significant at 10 percent; ** significant at 5 percent; *** significant at 1 percent
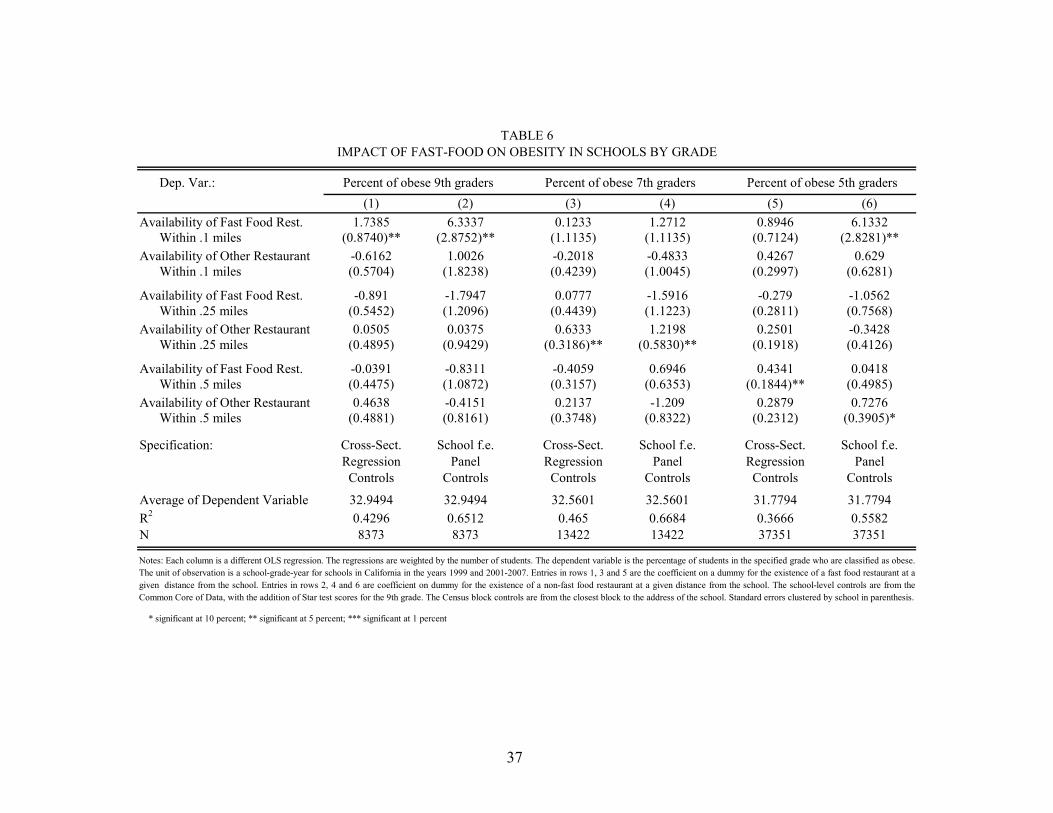
Dep. Var.:(1) (2) (3) (4) (5) (6)
1.7385 6.3337 0.1233 1.2712 0.8946 6.1332Within .1 miles (0.8740)** (2.8752)** (1.1135) (1.1135) (0.7124) (2.8281)**
-0.6162 1.0026 -0.2018 -0.4833 0.4267 0.629Within .1 miles (0.5704) (1.8238) (0.4239) (1.0045) (0.2997) (0.6281)
-0.891 -1.7947 0.0777 -1.5916 -0.279 -1.0562Within .25 miles (0.5452) (1.2096) (0.4439) (1.1223) (0.2811) (0.7568)
0.0505 0.0375 0.6333 1.2198 0.2501 -0.3428Within .25 miles (0.4895) (0.9429) (0.3186)** (0.5830)** (0.1918) (0.4126)
-0.0391 -0.8311 -0.4059 0.6946 0.4341 0.0418Within .5 miles (0.4475) (1.0872) (0.3157) (0.6353) (0.1844)** (0.4985)
0.4638 -0.4151 0.2137 -1.209 0.2879 0.7276Within .5 miles (0.4881) (0.8161) (0.3748) (0.8322) (0.2312) (0.3905)*
Cross-Sect. School f.e. Cross-Sect. School f.e. Cross-Sect. School f.e.Regression Panel Regression Panel Regression PanelControls Controls Controls Controls Controls Controls
32.9494 32.9494 32.5601 32.5601 31.7794 31.77940.4296 0.6512 0.465 0.6684 0.3666 0.55828373 8373 13422 13422 37351 37351
R2
N
Average of Dependent Variable
Notes: Each column is a different OLS regression. The regressions are weighted by the number of students. The dependent variable is the percentage of students in the specified grade who are classified as obese.The unit of observation is a school-grade-year for schools in California in the years 1999 and 2001-2007. Entries in rows 1, 3 and 5 are the coefficient on a dummy for the existence of a fast food restaurant at agiven distance from the school. Entries in rows 2, 4 and 6 are coefficient on dummy for the existence of a non-fast food restaurant at a given distance from the school. The school-level controls are from theCommon Core of Data, with the addition of Star test scores for the 9th grade. The Census block controls are from the closest block to the address of the school. Standard errors clustered by school in parenthesis.
* significant at 10 percent; ** significant at 5 percent; *** significant at 1 percent
Availability of Fast Food Rest.
Availability of Other Restaurant
Specification:
Availability of Other Restaurant
TABLE 6IMPACT OF FAST-FOOD ON OBESITY IN SCHOOLS BY GRADE
Availability of Fast Food Rest.
Availability of Fast Food Rest.
Availability of Other Restaurant
Percent of obese 9th graders Percent of obese 5th gradersPercent of obese 7th graders
37
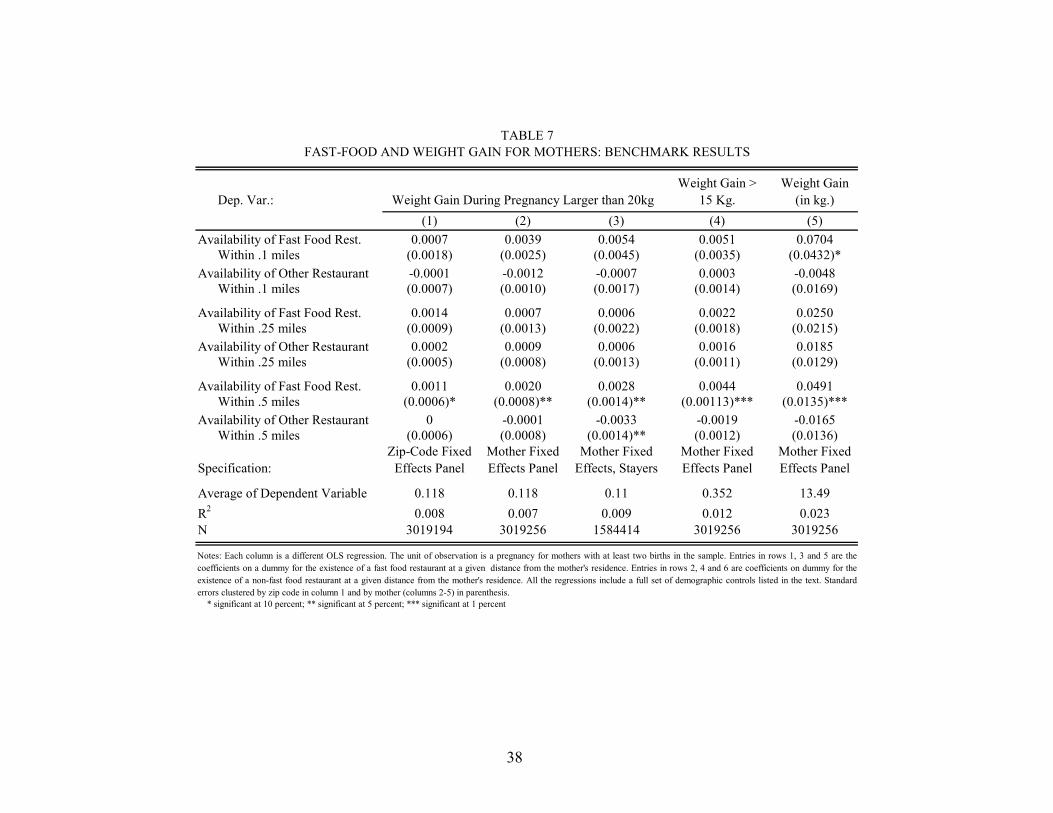
Dep. Var.:Weight Gain >
15 Kg.Weight Gain
(in kg.)(1) (2) (3) (4) (5)
0.0007 0.0039 0.0054 0.0051 0.0704Within .1 miles (0.0018) (0.0025) (0.0045) (0.0035) (0.0432)*
-0.0001 -0.0012 -0.0007 0.0003 -0.0048Within .1 miles (0.0007) (0.0010) (0.0017) (0.0014) (0.0169)
0.0014 0.0007 0.0006 0.0022 0.0250Within .25 miles (0.0009) (0.0013) (0.0022) (0.0018) (0.0215)
0.0002 0.0009 0.0006 0.0016 0.0185Within .25 miles (0.0005) (0.0008) (0.0013) (0.0011) (0.0129)
0.0011 0.0020 0.0028 0.0044 0.0491Within .5 miles (0.0006)* (0.0008)** (0.0014)** (0.00113)*** (0.0135)***
0 -0.0001 -0.0033 -0.0019 -0.0165Within .5 miles (0.0006) (0.0008) (0.0014)** (0.0012) (0.0136)
Specification:Zip-Code Fixed
Effects Panel Mother Fixed Effects Panel
Mother Fixed Effects, Stayers
Mother Fixed Effects Panel
Mother Fixed Effects Panel
0.118 0.118 0.11 0.352 13.490.008 0.007 0.009 0.012 0.023
3019194 3019256 1584414 3019256 3019256
TABLE 7
Notes: Each column is a different OLS regression. The unit of observation is a pregnancy for mothers with at least two births in the sample. Entries in rows 1, 3 and 5 are thecoefficients on a dummy for the existence of a fast food restaurant at a given distance from the mother's residence. Entries in rows 2, 4 and 6 are coefficients on dummy for theexistence of a non-fast food restaurant at a given distance from the mother's residence. All the regressions include a full set of demographic controls listed in the text. Standarderrors clustered by zip code in column 1 and by mother (columns 2-5) in parenthesis.
FAST-FOOD AND WEIGHT GAIN FOR MOTHERS: BENCHMARK RESULTS
Availability of Fast Food Rest.
Availability of Other Restaurant
Availability of Other Restaurant
* significant at 10 percent; ** significant at 5 percent; *** significant at 1 percent
R2
N
Average of Dependent Variable
Availability of Fast Food Rest.
Availability of Other Restaurant
Availability of Fast Food Rest.
Weight Gain During Pregnancy Larger than 20kg
38

Dep. Var.:
Sample:Hispanic Mothers
Black Mothers
High School or Less
Some College or More
(1) (2) (3) (4) (5) (6) (7)0.0019 0.0022 0.0066 0.0033 0.0002
Within .5 miles (0.0009)* (0.0013)* (0.0016)*** (0.0009)*** (0.0012)0.0009
Restaurant Within .5 miles (0.0009)-0.0002 -0.0015 -0.0032 0.0000 0.0004
Within .5 miles (0.0008) (0.0015) (0.0021) (0.0010) (0.0011)0.0025
Within .5 miles excluding Subway (0.0007)***0.0002
Within .5 miles (0.0008)0.0011
Within .5 miles (0.0007)Mother Mother Mother Mother Mother Mother Mother
Fixed Effects Fixed Effects Fixed Effects Fixed Effects Fixed Effects Fixed Effects Fixed Effects0.126 0.126 0.126 0.101 0.131 0.126 0.1060.006 0.007 0.007 0.011 0.002 0.007 0.007
3019256 3019256 3019256 794535 495045 1779895 1236989
* significant at 10 percent; ** significant at 5 percent; *** significant at 1 percent
Specification:
TABLE 8IMPACT OF FAST-FOOD ON WEIGHT GAIN LARGER THAN 20KG: ADDITIONAL MODELS
N
Weight Gain During Pregnancy Larger Than 20kg
Availability of Fast Food (Broad Def.)
Availability of Non-Fast Food Rest.
Availability of Fast Food Rest.
All Mothers
Availability of Any Restaurant
Notes: Each column is a different OLS regression. The unit of observation is a pregnancy for mothers with at least two births in the sample. Entries in row 1 and 3 are the coefficients on a dummy for theexistence of a fast fast food restaurant and a non-fast food restaurant within 0.5 miles from the mother's residence. The entry in row 2 is the coefficient on a dummy for whether there is a fast food restaurantaccording to a broader definition (and not included in the benchmark definition) within 0.5 miles from the mother's residence. The entry in row 4 is the coefficient on a dummy for the existence of a fast foodrestaurant from one of the top 10 fast food chains excluding Subway. All the regressions include a full set of demographic controls listed in the text. Standard errors clustered by mother in parenthesis.
Availability of Fast Food Rest.
Availability of Other Rest.
R2
Average of Dependent Variable
39

Dep. Var.:
Mother Smokes
Mother is Married
Placebos based on leads
Placebos based on lags
(1) (2) (3) (4)0.0001 0.0007
Within .1 miles (0.0019) (0.0028)0.0012 -0.0016
Within .1 miles (0.0007) (0.0011)0.0002 -0.0002
Within .25 miles (0.0009) (0.0014)0.0001 -0.0008
Within .25 miles (0.0006) (0.0008)0.0035 0.0010 0.0007 0.0002
Within .5 miles (0.0011)*** (0.0012) (0.0006) (0.0009)-0.0006 -0.0021 0.0021 -0.0001
Within .5 miles (0.0011) (0.0012)* (0.0006)*** (0.0009)-0.0014
Within .5 miles 3 Years Later (0.0011)0.0012
Within .5 miles 3 Years Later (0.0012)0.0019
Within .5 miles 3 Years Earlier (0.0013)0.0025
Within .5 miles 3 Years Earlier (0.0012)**Mother Mother Mother Mother
Fixed Effects Fixed Effects Fixed Effects Fixed Effects0.007 0.008 0.008 0.047
3019256 2694834 3005825 2889618
* significant at 10 percent; ** significant at 5 percent; *** significant at 1 percent
Specification:
Availability of Other Restaurant
Availability of Other Restaurant
Availability of Fast Food Rest.
Notes: Each column is a different OLS regression. The unit of observation is a pregnancy for mothers with at least two births in the sample. Entries in rows 1, 3 and 5are coefficients on dummies for the existence of a fast food restaurant and the entries in rows 2, 4 and 6 are coefficients on dummies for the existence of a non-fast foodrestaurant respectively within the specified distances from the mother's residence. Entries in rows 7 and 8 are coefficients on a dummy for the existence of a fast foodrestaurant and a non-fast food restaurant respectively within 0.5 miles from the mother's residence three years after the pregnancy. Entries in rows 9 and 10 arecoefficients on a dummy for the existence of a fast food restaurant and a non-fast food restaurant respectively within 0.5 miles from the mother's residence three yearsbefore the pregnancy. All the regressions include a full set of demographic controls listed in the text. Standard errors clustered by mother in parenthesis.
Weight Gain During Pregnancy > 20 Kg.
Availability of Fast Food Rest.
TABLE 9IMPACT OF FAST-FOOD ON WEIGHT GAIN: PLACEBOS
Availability of Other Restaurant
Availability of Fast Food Rest.
N
Placebos based on demographic variables
Availability of Fast Food Rest.
Availability of Other Restaurant
Availability of Fast Food Rest.
Availability of Other Restaurant
R2
40

Rank Name Percent Rank Name Percent Rank Name Percent(1) (2) (3) (4) (5) (6) (7) (8) (9)1 Mc Donalds 8% 1 Starbucks 12% 1 Ihop 0.002%2 Subway 7% 2 Dairy Queen 7% 2 Sizzler 0.002%3 Burger King 5% 3 Baskin Robbins 6% 3 Togos Eatery 0.001%4 Taco Bell 4% 4 Jamba Juice 5% 4 Chilis 0.001%5 Pizza Hut 4% 5 Fosters Freeze 5% 5 Applebees 0.001%6 Little Caesars 3% 6 Orange Julius 4% 6 Tcby 0.001%7 Kfc 3% 7 Smoothie King 4% 7 Cocos 0.001%8 Wendys 3% 8 Juice Stop 4% 8 Aramark 0.001%9 Dominos Pizza 3% 9 Braums 3% 9 Big Boy 0.001%
10 Jack In The Box 3% 10 Moes Southwest 2% 10 Outbak 0.001%
APPENDIX TABLE 1FAST-FOOD RESTAURANTS AND OTHER RESTAURANTS
Notes: Data on restaurant establishments are from Dun & Bradstreet. "Percent" in column 3 is the number of establishments of the relevant chain over the total number offast food restaurants. "Percent" in column 6 is the number of establishments of the relevant chain over the total number of restaurants in the Wikipedia list excluding the top10 chains. "Percent" in column 9 is the number of establishments of the relevant chain over the total number of restaurants, excluding fast food restaurants and restaurants onthe Wikipedia list. See discussion in Appendix 1 for more details on our classification of restaurants.
Top-10 Fast-Food RestaurantsMajor Fast-Food Restaurants in
Wikipedia List and not in top-10 ListMajor Restaurants in non-Fast Food
Category
41