the effect of drying on timber frame connections post flooding · &1 alistair bradley meng ......
TRANSCRIPT
This is a repository copy of The effect of drying on timber frame connections post flooding.
White Rose Research Online URL for this paper:http://eprints.whiterose.ac.uk/124965/
Version: Published Version
Article:
Bradley, A., Chang, W-S. orcid.org/0000-0002-2218-001X and Harris, R. (2015) The effect of drying on timber frame connections post flooding. Proceedings of the Institution of Civil Engineers - Construction Materials, 168 (3). pp. 144-157. ISSN 1747-650X
https://doi.org/10.1680/coma.14.00042
[email protected]://eprints.whiterose.ac.uk/
Reuse
Unless indicated otherwise, fulltext items are protected by copyright with all rights reserved. The copyright exception in section 29 of the Copyright, Designs and Patents Act 1988 allows the making of a single copy solely for the purpose of non-commercial research or private study within the limits of fair dealing. The publisher or other rights-holder may allow further reproduction and re-use of this version - refer to the White Rose Research Online record for this item. Where records identify the publisher as the copyright holder, users can verify any specific terms of use on the publisher’s website.
Takedown
If you consider content in White Rose Research Online to be in breach of UK law, please notify us by emailing [email protected] including the URL of the record and the reason for the withdrawal request.
The effect of drying on timber frameconnections post flooding
&1 Alistair Bradley MEngPhD Researcher, Department of Architecture and Civil Engineering,University of Bath, Bath, UK
&2 Wen-Shao Chang MS Arch, PhD, FHEALecturer in Timber Engineering, Department of Architecture and CivilEngineering, University of Bath, Bath, UK
&3 Richard Harris BSc, CEng, FICE, FIStructE, FIMMMProfessor of Timber Engineering, BRE Centre for Innovative
Construction Materials, Department of Architecture and Civil
Engineering, University of Bath, Bath, UK
1 2 3
Timber structures face a unique risk from flooding. Elevations in moisture content due to prolonged wetting will lead
to a reduction in the mechanical properties of the building. Despite recent growth of timber construction in the UK
and a known increased risk from flooding, little research has been conducted into its effects on light frame timber
construction and the most efficacious drying method. This paper presents the results of experiments to determine the
optimum drying conditions for light timber frame construction with oriented strand board sheathing after simulated
flooding. A series of specimens were wetted for 5 d to simulate flooding before exposure to different environments.
The specimens were load tested and values of ultimate strength, yield strength and stiffness were compared to those
of un-wetted control specimens. It was found that the optimum drying condition for recovery of the maximum pre-
wetting mechanical properties was an environment of 38˚C and 40% relative humidity. Although this is an optimal
setting there is still a permanent reduction in the mechanical properties of approximately 40% for strengths and 20%
for stiffness. Stiffness is dependent on grain orientation; however, strength was found to be independent of grain
orientation, as it is governed by the oriented strand board failure.
Notation
Fu ultimate strength, defined as maximum
load on specimen during deformation
Fy yield strength, intersection of straight line
extensions of initial and plastic sections of
load–slip curve for a well-defined bi-linear
load–slip curve. See also BSI 12512 (BSI,
2001)
kt, kp initial stiffness values for tangential and
parallel specimens respectively. Stiffness is
defined as the secant stiffness between 0?1
and 0?4Fu
MC0 moisture content prior to testing
MC5 moisture content after 5 d of soaking
MCtest moisture content at testing after exposure
to a drying environment; always less than
20%
T temperature
1. Introduction
As a result of climate change (IPCC, 2013), flooding is
becoming an ever more likely occurrence. More intense periods
of heavy rain are expected, leading to an increase in flood
events (Otto et al., 2014). In fact, the likelihood of a ‘very wet
winter’ has increased by 25% (Huntingford et al., 2014). In
conjunction with a change in climate and subsequent increases
in extreme weather events, the UK also faces the need to
construct more affordable, sustainable housing stock. One
method by which these demands can be met is through the use
of light timber frame, a sustainable approach that is ideally
suited to meeting these targets through exploiting lean
manufacturing processes (Menendez et al., 2014). Platform
timber frame (PTF), the most common form of light timber
framing, is in a period of rapid growth. In 2012 it accounted
for nearly 25% of the UK market as a whole, with initiatives in
place to grow this to 30% by 2015 (United Kingdom Forestry
Commission, 2013).
Construction Materials
The effect of drying on timber frameconnections post floodingBradley, Chang and Harris
Proceedings of the Institution of Civil Engineers
http://dx.doi.org/10.1680/coma.14.00042
Paper 1400042
Received 01/09/2014 Accepted 03/11/2014
Keywords: floods & floodworks/timber structures
ice | proceedings ICE Publishing: All rights reserved
1
Offprint provided courtesy of www.icevirtuallibrary.com
Author copy for personal use, not for distribution
Timber structures, owing to their hygroscopic nature, face
a unique threat from flooding. The relationship between
moisture content (MC) and timber strength is well documented
(Dinwoodie, 2000). Increases in MC lead to a reduction in the
mechanical properties of timber (Rammer and Winistorfer,
2001) as well as a loss of strength in oriented strand board
(OSB) (Wu and Piao, 1999; Wu and Suchsland, 1997). It is thus
reasonable to assume that exposure to flooding may lead to
temporary or permanent reductions in the mechanical proper-
ties of timber structures. With respect to PTF specifically,
increases in MC will affect the mechanical properties of the
nailed shear connections between the OSB sheathing and the
softwood timber frame.
Following flooding it is important to dry any structure
sufficiently; however, it is especially important with timber as
elevated moisture levels will cause decay in the material (Blass,
1995; Forest Products Laboratory (US), 1999; Rammer and
Winistorfer, 2001). The majority of drying guidance suggests
that a MC of less than 20% is sufficiently dry to prevent such
decay. Below 20% the timber is generally considered to be at
reduced risk from rot (BRE, 1974, 1997; BSI, 2013; Garvin
et al., 2005).
The methods of drying structures following a flood can be
grouped into three main categories: naturally ventilated drying,
convection drying and artificial dehumidification (BSI, 2013;
Garvin et al., 2005). The manner in which each of these
conditions is achieved varies in practice, but common to them
all is the control and alteration of temperature and relative
humidity. The UK document, Publicly Available Specification
64 (PAS 64) (BSI, 2013), is designed as a single reference source
when dealing with flooding. PAS 64 discusses how the
aforementioned drying methods can be implemented, as well
as floor restoration practicalities such as the removal of
plasterboard and insulation to facilitate drying; however, it
offers no guidance as to which is the most appropriate method
for a particular structure or situation. Lamond et al. (2013) have
performed an in-depth study of available flood guidance. The
study concluded that new guidance would be welcomed and that
for drying, ‘mapping building type to optimum method’ is
needed (Lamond et al., 2013). The current scenario in the UK is
one in which there is a known increased risk of flooding
combined with a growth in use of platform timber frame, a
construction type with a unique susceptibility to wetting.
Exposure of timber frame to water results in weakening of
timber and its products in a way that does not happen with other
structural materials. Furthermore, there is a lack of research
into the effects of flooding on timber frame despite the increase
in risk of exposure to flood.
As mentioned earlier, there is very little previous work into the
relationship between drying methodology and recovery of
mechanical properties. Escarameia et al. (2007) studied a
number of different wall constructions and investigated the
leakage and subsequent drying rates. Only naturally ventilated
drying was explored and no strength tests were conducted.
Their work focused on absorption rate and performance of
different constructions and renders exposed to flooding. It did
not assess drying methods for efficacy and, owing to the variety
of structural types investigated, has limited data with respect to
timber construction. Additionally the study did not investigate
the mechanical properties of any of the test specimens.
Leichti et al. (2002) studied the effect of flooding and drying on
the load capacity of full-size shear walls. Their study tested
walls after air drying only and concluded that the wetting/
drying cycle had little effect on the walls’ lateral load resistance
or energy absorption capacity, with only a loss of stiffness
evident (Leichti et al., 2002). The study did not, however,
investigate the effect of different drying methods on the
capacity of the structure following flooding, but rather focused
only on natural, unassisted drying.
Both of the aforementioned studies assume that the tested
structures are sufficiently dry after either a set time span or a
non-direct measurement of MC. In practice, a structure is only
declared dry after it has been measured to be , 20% MC (BSI,
2013; Garvin et al., 2005). Experience from drying fresh felled
lumber suggests that incorrect drying can result in undesirable
effects such as warping, cracking or case hardening (Forest
Products Laboratory (US), 1999). It is therefore important
to understand the influence that artificial dehumidification
and convection heating have on the mechanical properties.
Removal of moisture by some artificially accelerated means
may result in changes to the timber and sheathing that affect
their ability to carry design loads safely.
2. Experimental programme
Previous work by the present authors (Bradley et al., 2014)
showed that the drying environment does affect the recovery
of mechanical properties and that a balanced environment of
low humidity and slightly elevated temperature produces the
greatest return to original, pre-flood properties. Excessively
high temperatures produced the worst recovery of mechanical
properties. In all cases a permanent loss of strength and
stiffness was observed.
Owing to the limited research into drying effects, a series of
tests was designed and conducted in order to understand the
consequences of different drying methods on the behaviour of
nailed sheathing to timber joints. In order to assess rapidly the
impact of different environments, a series of connection details
was produced that allow the investigation of the nailed
connection between OSB and timber.
Construction Materials The effect of drying on timberframe connections postfloodingBradley, Chang and Harris
2
Offprint provided courtesy of www.icevirtuallibrary.com
Author copy for personal use, not for distribution
The area of interest in a flooded structure is the section below
the flood water line. It is this wetted area that will suffer the
majority of the detrimental effects to mechanical properties as
a result of flooding. It was therefore decided to test connection
details rather than full-size walls. As the critical component in
a shear wall assembly is often the connection between the
timber frame and sheathing, this approach allows rapid
characterisation of the impact of drying on the typical failure
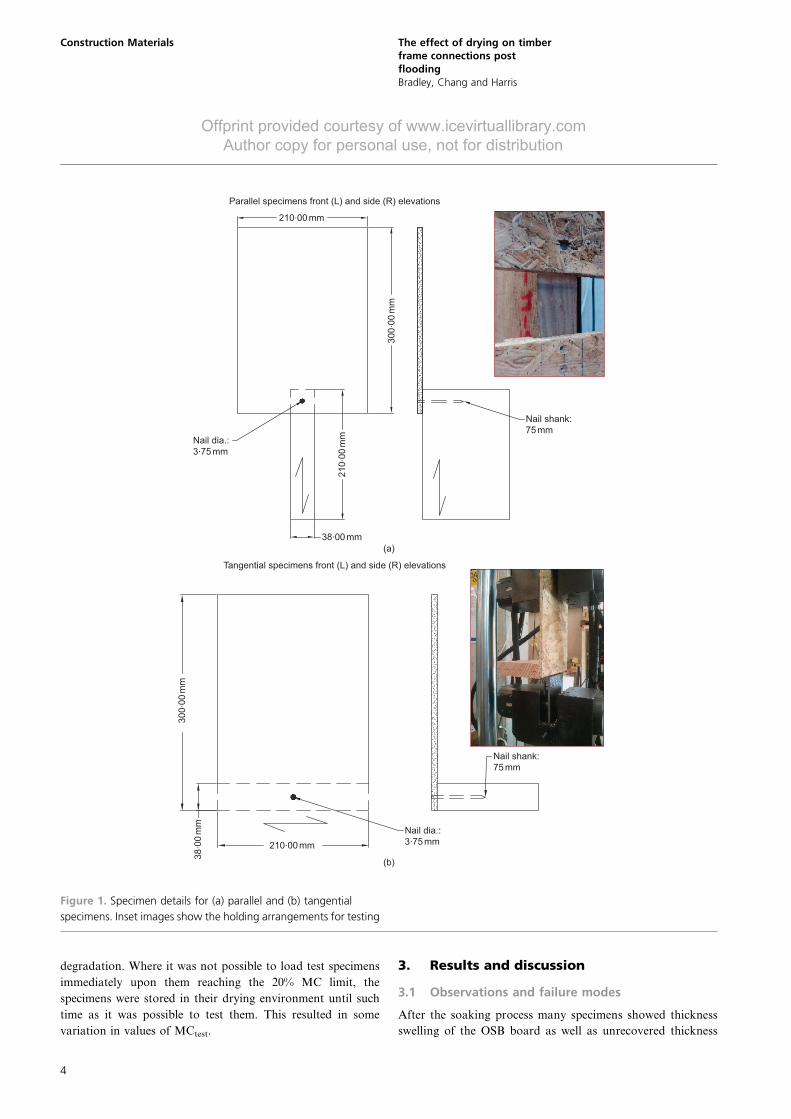
point. The test specimens are single nailed connections between
a section of the timber frame and the OSB sheathing, as
detailed in Figures 1(a) and 1(b).
2.1 Specimen designThe test specimens were constructed with quarter sawn
Douglas fir sourced from a local saw mill with 9 mm OSB/3
sheathing nailed to the timber using 3?75 mm dia. smooth
shank nails as prescribed by Eurocode 5 (BSI, 2003). Two
different grain orientations were considered, parallel to grain
and tangential to grain (Figures 1(a) and 1(b)).
The specimens were fully immersed in water for 5 d, then dried
according to one of the environments given in Table 1. Three
specimens of each orientation were tested in each drying
condition.
2.2 Experimental designThe work of Bradley et al. (2014) investigated a broad range of
drying climates, some of which were outside the scope of normal
drying procedures. The current work focuses instead on a more
realistic range of environments around the conditions found to be
most optimal by Bradley et al. (2014). To maximise experimental
returns, design of experiments (DoE) techniques were implemen-
ted, specifically Taguchi methods (Belavendram, 1995).
In an experiment using Taguchi methods, various ‘control
factors’ are chosen. Control factors influence the outcome of the
process that is being studied, for example, temperature or speed.
Factors are the experimental variables. For each factor, ‘levels’
are assigned. These levels are the different values that each
factor will take during the experiment. The Taguchi method
then assigns each of these factors and levels to an orthogonal
array. The construction of the array produces a set of
experiments which minimises the number of tests that must be
performed while still capturing the effects of each factor level
contribution. Each experiment in an array is unique and allows
the isolation of one factor and its subsequent effect on output.
This method allows the study of the influence and relative
significance of multiple variables at the same time. By grouping
outputs according to each factor level it is possible to isolate the
effect of a factor on the output being studied. Optimum levels
are then identified through the use of response charts. Response
charts are a method by which the influence of each factor on an
experiment can be represented visually, see Figures 6 and 7 later
(in Sections 3.4 and 3.5). Further information on the Taguchi
method can be found in Belavendram (1995) and Taguchi
(1986).
In the current study two control factors were selected:
temperature (T) and relative humidity (RH). These factors
were assigned three levels each, as given in Table 1. They
were then arranged in an orthogonal array (Table 1). Each
experiment number in the array represents a unique combina-
tion of T and RH levels. The effect of grain orientation is
studied by repeating the set of experiments with the second
grain orientation. Factors and levels are referred to by their
shortened format, with the level indicated by the appropriate
number; T3 is temperature at level three for example.
Each experiment has three repeat specimens, loaded mono-
tonically, that is, pulled in a single direction until failure, not
loaded cyclically. There are also three control specimens of
each orientation giving a total for both grain orientations of 60
specimens. The control specimens are used as references for all
other values and are assumed to represent the pre-wetting,
original values of the connections.
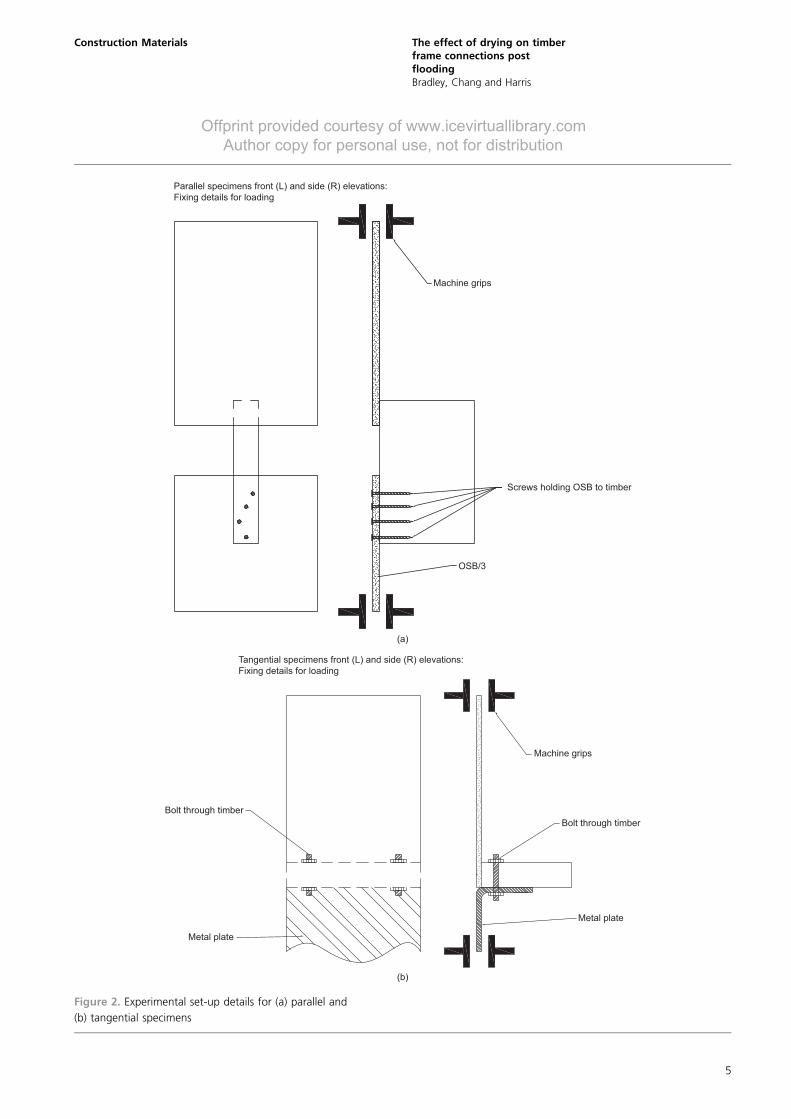
2.3 Experimental equipment
In order to achieve the desired drying environments an
environmental chamber capable of maintaining environmental
conditions within the ranges given in Table 1 was used. The
chamber produces turbulent air flow of 0?2 m/s and is capable
of four air changes per hour. The specimens were loaded
monotonically under displacement control at 2 mm/min
in a universal testing frame. The experimental set-up is as
illustrated in Figures 2(a) and 2(b).
2.4 Moisture measurement
Moisture content is measured using a two pin capacitance type
moisture meter. Uninsulated pins were inserted 4 mm into the
sheathing and timber of each specimen. MC was taken as a
surface reading on the OSB sheathing and timber. This method
is the least invasive type of measurement and allows MC to
be determined without unduly affecting the strength of the
specimen through removal of material.
Moisture content was measured before wetting (MC0), after
wetting for 5 d (MC5) and prior to load testing after being
dried (MCtest). The MC meter is capable of reading 6–43%
MC. Any MCs measured beyond this scale are recorded as
+44%.
As previously discussed a MC of 20% or less is desired to
ensure that wood-based products are not at risk from further
Construction Materials The effect of drying on timberframe connections postfloodingBradley, Chang and Harris
3
Offprint provided courtesy of www.icevirtuallibrary.com
Author copy for personal use, not for distribution
degradation. Where it was not possible to load test specimens
immediately upon them reaching the 20% MC limit, the
specimens were stored in their drying environment until such
time as it was possible to test them. This resulted in some
variation in values of MCtest.
3. Results and discussion
3.1 Observations and failure modes
After the soaking process many specimens showed thickness
swelling of the OSB board as well as unrecovered thickness
(a)
(b)
210.00 mm
Parallel specimens front (L) and side (R) elevations
Tangential specimens front (L) and side (R) elevations
38.00 mm
Nail shank:
75 mmNail dia.:
3.75 mm
30
0. 0
0 m
m
21
0. 0
0 m
m
38
. 00
mm
Nail shank:
75 mm
Nail dia.:
3.75 mm
30
0. 0
0 m
m
210.00 mm
Figure 1. Specimen details for (a) parallel and (b) tangential
specimens. Inset images show the holding arrangements for testing
Construction Materials The effect of drying on timberframe connections postfloodingBradley, Chang and Harris
4
Offprint provided courtesy of www.icevirtuallibrary.com
Author copy for personal use, not for distribution
Machine grips
Parallel specimens front (L) and side (R) elevations:
Fixing details for loading
Screws holding OSB to timber
OSB/3
(a)
(b)
Tangential specimens front (L) and side (R) elevations:
Fixing details for loading
Machine grips
Bolt through timber
Bolt through timber
Metal plate
Metal plate
Figure 2. Experimental set-up details for (a) parallel and
(b) tangential specimens
Construction Materials The effect of drying on timberframe connections postfloodingBradley, Chang and Harris
5
Offprint provided courtesy of www.icevirtuallibrary.com
Author copy for personal use, not for distribution
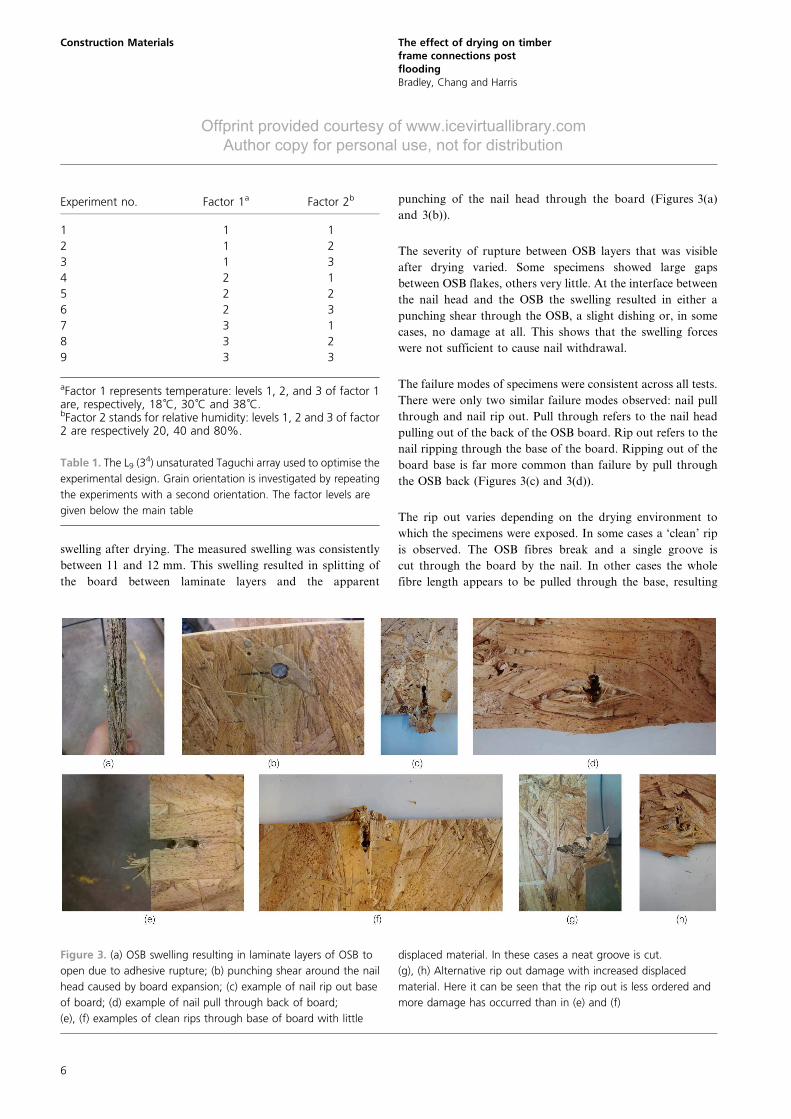
swelling after drying. The measured swelling was consistently
between 11 and 12 mm. This swelling resulted in splitting of
the board between laminate layers and the apparent
punching of the nail head through the board (Figures 3(a)
and 3(b)).
The severity of rupture between OSB layers that was visible
after drying varied. Some specimens showed large gaps
between OSB flakes, others very little. At the interface between
the nail head and the OSB the swelling resulted in either a
punching shear through the OSB, a slight dishing or, in some
cases, no damage at all. This shows that the swelling forces
were not sufficient to cause nail withdrawal.
The failure modes of specimens were consistent across all tests.
There were only two similar failure modes observed: nail pull
through and nail rip out. Pull through refers to the nail head
pulling out of the back of the OSB board. Rip out refers to the
nail ripping through the base of the board. Ripping out of the
board base is far more common than failure by pull through
the OSB back (Figures 3(c) and 3(d)).
The rip out varies depending on the drying environment to
which the specimens were exposed. In some cases a ‘clean’ rip
is observed. The OSB fibres break and a single groove is
cut through the board by the nail. In other cases the whole
fibre length appears to be pulled through the base, resulting
Experiment no. Factor 1a Factor 2b
1 1 1
2 1 2
3 1 3
4 2 1
5 2 2
6 2 3
7 3 1
8 3 2
9 3 3
aFactor 1 represents temperature: levels 1, 2, and 3 of factor 1are, respectively, 18 ˚C, 30˚C and 38˚C.bFactor 2 stands for relative humidity: levels 1, 2 and 3 of factor2 are respectively 20, 40 and 80%.
Table 1. The L9 (34) unsaturated Taguchi array used to optimise the
experimental design. Grain orientation is investigated by repeating
the experiments with a second orientation. The factor levels are
given below the main table
Figure 3. (a) OSB swelling resulting in laminate layers of OSB to
open due to adhesive rupture; (b) punching shear around the nail
head caused by board expansion; (c) example of nail rip out base
of board; (d) example of nail pull through back of board;
(e), (f) examples of clean rips through base of board with little
displaced material. In these cases a neat groove is cut.
(g), (h) Alternative rip out damage with increased displaced
material. Here it can be seen that the rip out is less ordered and
more damage has occurred than in (e) and (f)
Construction Materials The effect of drying on timberframe connections postfloodingBradley, Chang and Harris
6
Offprint provided courtesy of www.icevirtuallibrary.com
Author copy for personal use, not for distribution
in far more displaced material. Figures 3(e)–3(h) show this
difference.
The similarity in failure mechanisms suggests two conclusions.
First, it is the OSB that is the critical factor in the specimen
failure. Failure due to any other component of the connection
was never observed. Second, the differences in the expelled
material from specimens are attributable to the different
conditions of drying to which each specimen was exposed.
This is evidence to suggest that each drying environment
affected the material properties of the specimens differently.
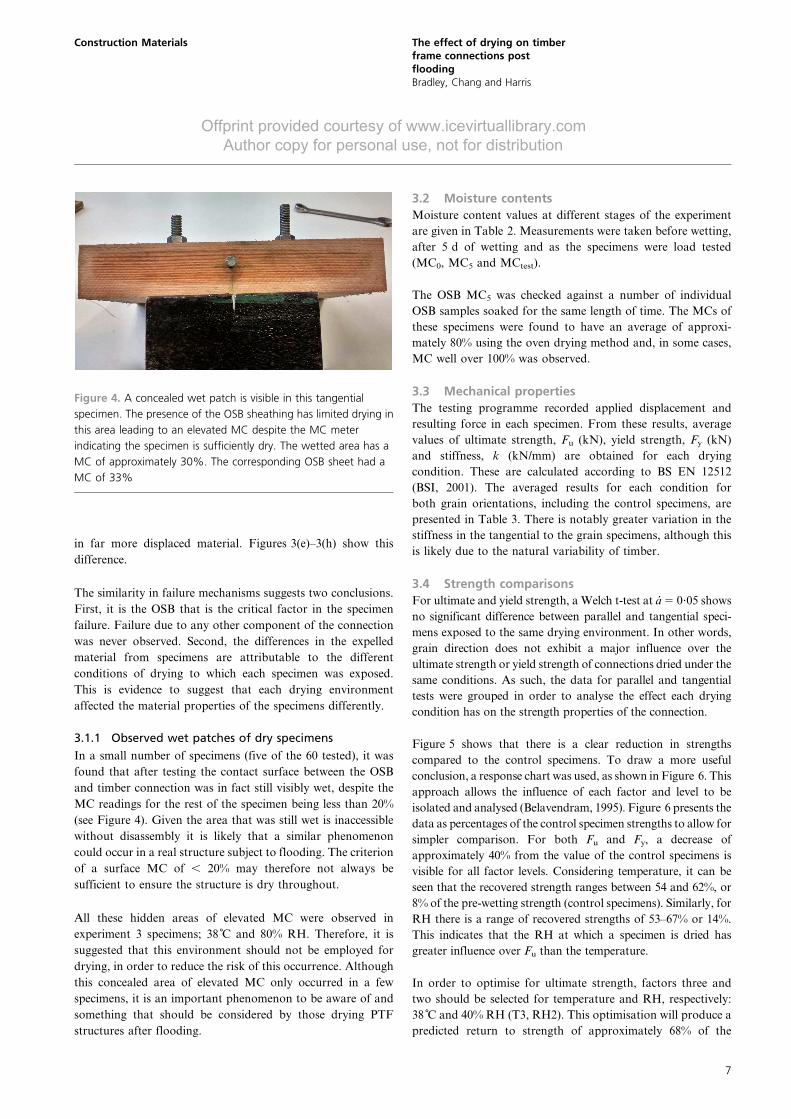
3.1.1 Observed wet patches of dry specimens
In a small number of specimens (five of the 60 tested), it was
found that after testing the contact surface between the OSB
and timber connection was in fact still visibly wet, despite the
MC readings for the rest of the specimen being less than 20%
(see Figure 4). Given the area that was still wet is inaccessible
without disassembly it is likely that a similar phenomenon
could occur in a real structure subject to flooding. The criterion
of a surface MC of , 20% may therefore not always be
sufficient to ensure the structure is dry throughout.
All these hidden areas of elevated MC were observed in
experiment 3 specimens; 38 C and 80% RH. Therefore, it is
suggested that this environment should not be employed for
drying, in order to reduce the risk of this occurrence. Although
this concealed area of elevated MC only occurred in a few
specimens, it is an important phenomenon to be aware of and
something that should be considered by those drying PTF
structures after flooding.
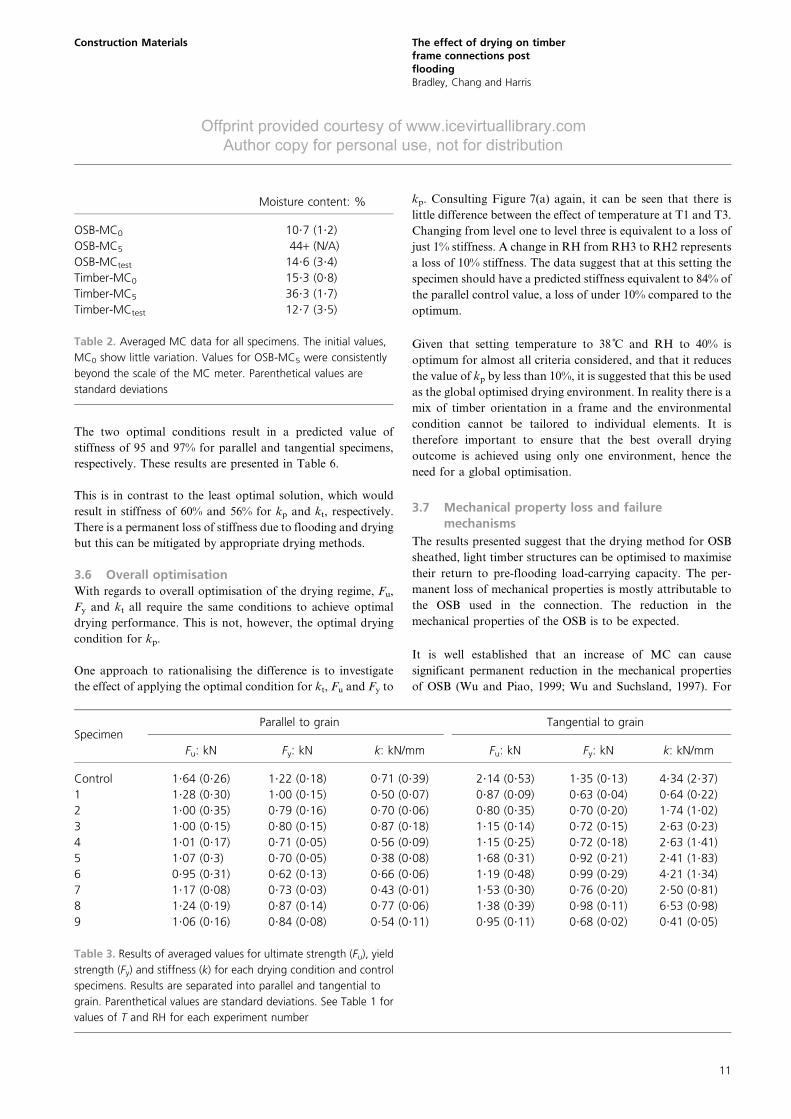
3.2 Moisture contents
Moisture content values at different stages of the experiment
are given in Table 2. Measurements were taken before wetting,
after 5 d of wetting and as the specimens were load tested
(MC0, MC5 and MCtest).
The OSB MC5 was checked against a number of individual
OSB samples soaked for the same length of time. The MCs of
these specimens were found to have an average of approxi-
mately 80% using the oven drying method and, in some cases,
MC well over 100% was observed.
3.3 Mechanical properties
The testing programme recorded applied displacement and
resulting force in each specimen. From these results, average
values of ultimate strength, Fu (kN), yield strength, Fy (kN)
and stiffness, k (kN/mm) are obtained for each drying
condition. These are calculated according to BS EN 12512
(BSI, 2001). The averaged results for each condition for
both grain orientations, including the control specimens, are
presented in Table 3. There is notably greater variation in the
stiffness in the tangential to the grain specimens, although this
is likely due to the natural variability of timber.
3.4 Strength comparisons
For ultimate and yield strength, a Welch t-test at a5 0?05 shows
no significant difference between parallel and tangential speci-
mens exposed to the same drying environment. In other words,
grain direction does not exhibit a major influence over the
ultimate strength or yield strength of connections dried under the
same conditions. As such, the data for parallel and tangential
tests were grouped in order to analyse the effect each drying
condition has on the strength properties of the connection.
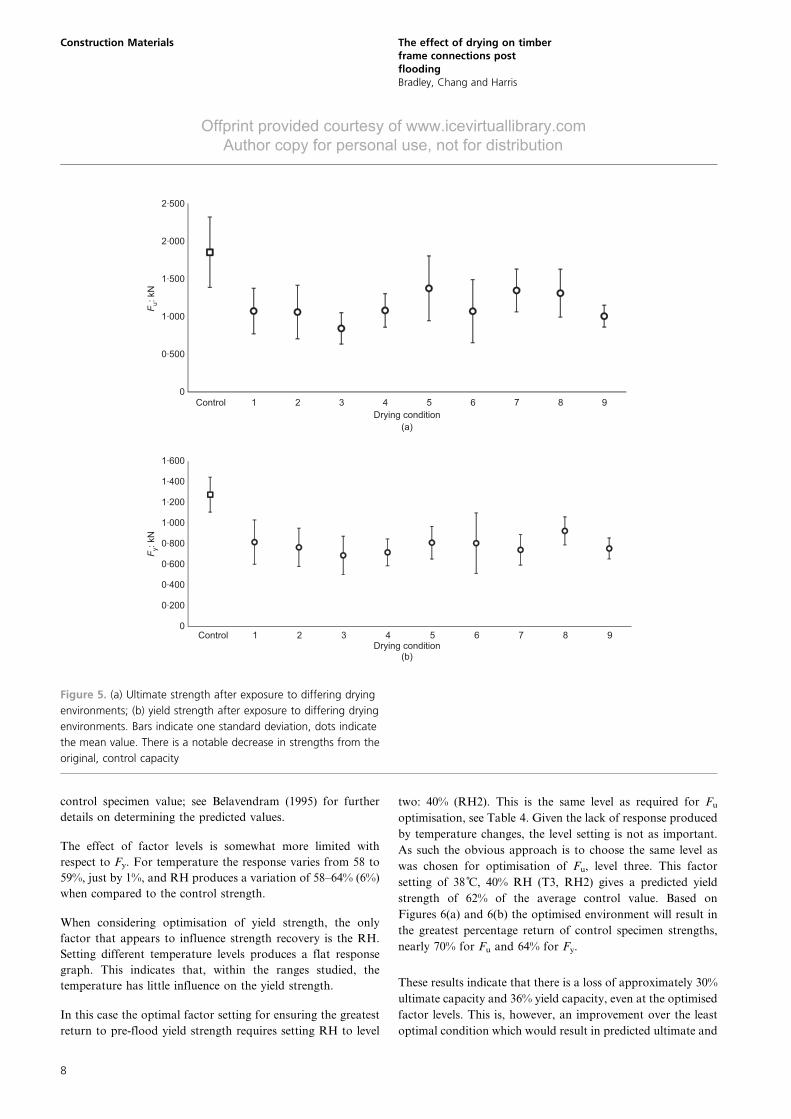
Figure 5 shows that there is a clear reduction in strengths
compared to the control specimens. To draw a more useful
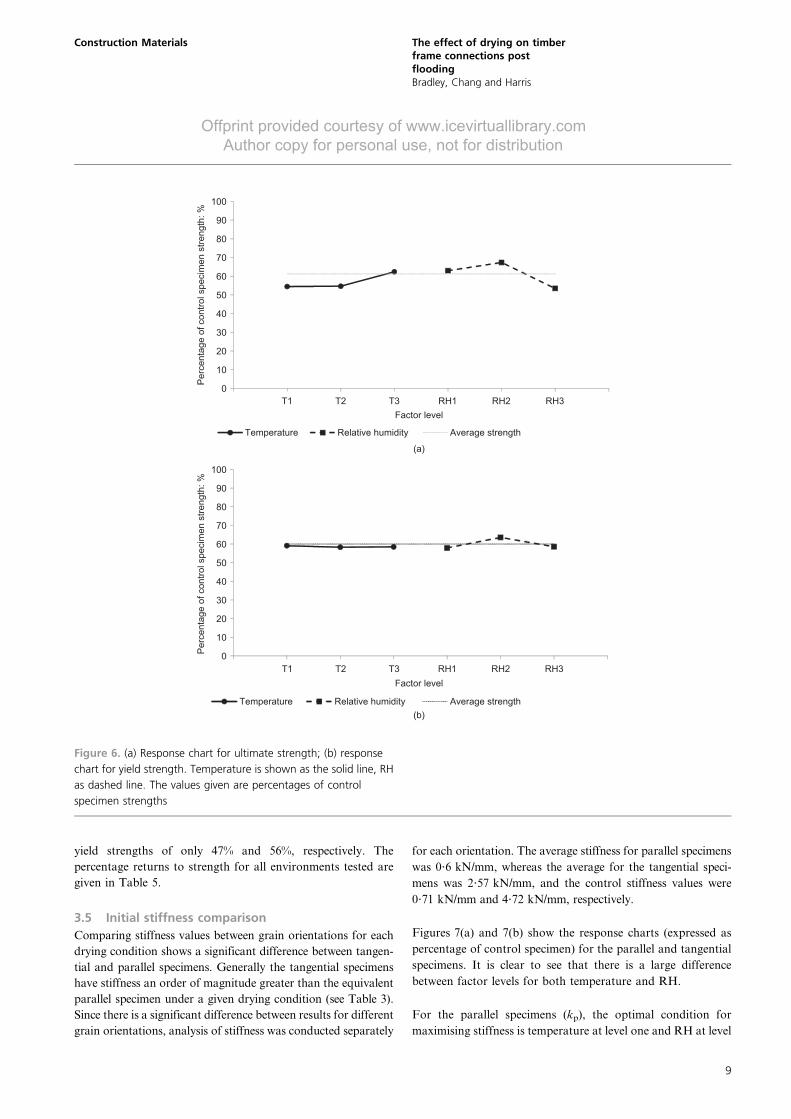
conclusion, a response chart was used, as shown in Figure 6. This
approach allows the influence of each factor and level to be
isolated and analysed (Belavendram, 1995). Figure 6 presents the
data as percentages of the control specimen strengths to allow for
simpler comparison. For both Fu and Fy, a decrease of
approximately 40% from the value of the control specimens is
visible for all factor levels. Considering temperature, it can be
seen that the recovered strength ranges between 54 and 62%, or
8% of the pre-wetting strength (control specimens). Similarly, for
RH there is a range of recovered strengths of 53–67% or 14%.
This indicates that the RH at which a specimen is dried has
greater influence over Fu than the temperature.
In order to optimise for ultimate strength, factors three and
two should be selected for temperature and RH, respectively:
38 C and 40% RH (T3, RH2). This optimisation will produce a
predicted return to strength of approximately 68% of the
Figure 4. A concealed wet patch is visible in this tangential
specimen. The presence of the OSB sheathing has limited drying in
this area leading to an elevated MC despite the MC meter
indicating the specimen is sufficiently dry. The wetted area has a
MC of approximately 30%. The corresponding OSB sheet had a
MC of 33%
Construction Materials The effect of drying on timberframe connections postfloodingBradley, Chang and Harris
7
Offprint provided courtesy of www.icevirtuallibrary.com
Author copy for personal use, not for distribution
control specimen value; see Belavendram (1995) for further
details on determining the predicted values.
The effect of factor levels is somewhat more limited with
respect to Fy. For temperature the response varies from 58 to
59%, just by 1%, and RH produces a variation of 58–64% (6%)
when compared to the control strength.
When considering optimisation of yield strength, the only
factor that appears to influence strength recovery is the RH.
Setting different temperature levels produces a flat response
graph. This indicates that, within the ranges studied, the
temperature has little influence on the yield strength.
In this case the optimal factor setting for ensuring the greatest
return to pre-flood yield strength requires setting RH to level
two: 40% (RH2). This is the same level as required for Fu
optimisation, see Table 4. Given the lack of response produced
by temperature changes, the level setting is not as important.
As such the obvious approach is to choose the same level as
was chosen for optimisation of Fu, level three. This factor
setting of 38 C, 40% RH (T3, RH2) gives a predicted yield
strength of 62% of the average control value. Based on
Figures 6(a) and 6(b) the optimised environment will result in
the greatest percentage return of control specimen strengths,
nearly 70% for Fu and 64% for Fy.
These results indicate that there is a loss of approximately 30%
ultimate capacity and 36% yield capacity, even at the optimised
factor levels. This is, however, an improvement over the least
optimal condition which would result in predicted ultimate and
0
0.500
1.000
1.500
2.000
2.500
Control 1 2 3 4 5 6 7 8 9
Fu: kN
Drying condition
(a)
(b)
0
0.200
0.400
0.600
0.800
1.000
1.200
1.400
1.600
Control 1 2 3 4 5 6 7 8 9
Fy: kN
Drying condition
Figure 5. (a) Ultimate strength after exposure to differing drying
environments; (b) yield strength after exposure to differing drying
environments. Bars indicate one standard deviation, dots indicate
the mean value. There is a notable decrease in strengths from the
original, control capacity
Construction Materials The effect of drying on timberframe connections postfloodingBradley, Chang and Harris
8
Offprint provided courtesy of www.icevirtuallibrary.com
Author copy for personal use, not for distribution
yield strengths of only 47% and 56%, respectively. The
percentage returns to strength for all environments tested are
given in Table 5.
3.5 Initial stiffness comparison
Comparing stiffness values between grain orientations for each
drying condition shows a significant difference between tangen-
tial and parallel specimens. Generally the tangential specimens
have stiffness an order of magnitude greater than the equivalent
parallel specimen under a given drying condition (see Table 3).
Since there is a significant difference between results for different
grain orientations, analysis of stiffness was conducted separately
for each orientation. The average stiffness for parallel specimens
was 0?6 kN/mm, whereas the average for the tangential speci-
mens was 2?57 kN/mm, and the control stiffness values were
0?71 kN/mm and 4?72 kN/mm, respectively.
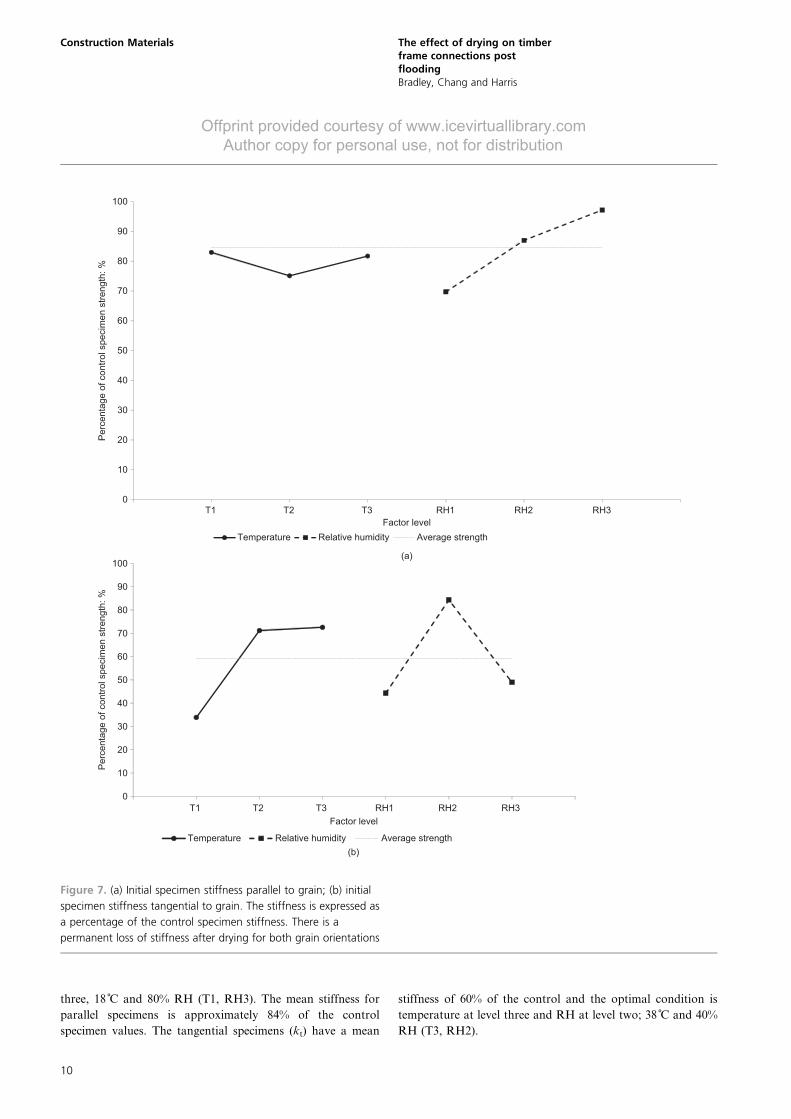
Figures 7(a) and 7(b) show the response charts (expressed as
percentage of control specimen) for the parallel and tangential
specimens. It is clear to see that there is a large difference
between factor levels for both temperature and RH.
For the parallel specimens (kp), the optimal condition for
maximising stiffness is temperature at level one and RH at level
0
10
20
30
40
50
60
70
80
90
100
T1 T2 T3 RH1 RH2 RH3
Pe
rce
nta
ge
of co
ntr
ol sp
ecim
en
str
en
gth
: %
Factor level
(a)
(b)
Temperature Relative humidity Average strength
0
10
20
30
40
50
60
70
80
90
100
T1 T2 T3 RH1 RH2 RH3
Pe
rce
nta
ge
of co
ntr
ol sp
ecim
en
str
en
gth
: %
Factor level
Temperature Relative humidity Average strength
Figure 6. (a) Response chart for ultimate strength; (b) response
chart for yield strength. Temperature is shown as the solid line, RH
as dashed line. The values given are percentages of control
specimen strengths
Construction Materials The effect of drying on timberframe connections postfloodingBradley, Chang and Harris
9
Offprint provided courtesy of www.icevirtuallibrary.com
Author copy for personal use, not for distribution
three, 18 C and 80% RH (T1, RH3). The mean stiffness for
parallel specimens is approximately 84% of the control
specimen values. The tangential specimens (kt) have a mean
stiffness of 60% of the control and the optimal condition is
temperature at level three and RH at level two; 38 C and 40%
RH (T3, RH2).
0
10
20
30
40
50
60
70
80
90
100
T1 T2 T3 RH1 RH2 RH3
Pe
rce
nta
ge
of co
ntr
ol sp
ecim
en
str
en
gth
: %
Factor level
(a)
(b)
Temperature Relative humidity Average strength
0
10
20
30
40
50
60
70
80
90
100
T1 T2 T3 RH1 RH2 RH3
Perc
enta
ge o
f contr
ol specim
en s
trength
: %
Factor level
Temperature Relative humidity Average strength
Figure 7. (a) Initial specimen stiffness parallel to grain; (b) initial
specimen stiffness tangential to grain. The stiffness is expressed as
a percentage of the control specimen stiffness. There is a
permanent loss of stiffness after drying for both grain orientations
Construction Materials The effect of drying on timberframe connections postfloodingBradley, Chang and Harris
10
Offprint provided courtesy of www.icevirtuallibrary.com
Author copy for personal use, not for distribution
The two optimal conditions result in a predicted value of
stiffness of 95 and 97% for parallel and tangential specimens,
respectively. These results are presented in Table 6.
This is in contrast to the least optimal solution, which would
result in stiffness of 60% and 56% for kp and kt, respectively.
There is a permanent loss of stiffness due to flooding and drying
but this can be mitigated by appropriate drying methods.
3.6 Overall optimisation
With regards to overall optimisation of the drying regime, Fu,
Fy and kt all require the same conditions to achieve optimal
drying performance. This is not, however, the optimal drying
condition for kp.
One approach to rationalising the difference is to investigate
the effect of applying the optimal condition for kt, Fu and Fy to
kp. Consulting Figure 7(a) again, it can be seen that there is
little difference between the effect of temperature at T1 and T3.
Changing from level one to level three is equivalent to a loss of
just 1% stiffness. A change in RH from RH3 to RH2 represents
a loss of 10% stiffness. The data suggest that at this setting the
specimen should have a predicted stiffness equivalent to 84% of
the parallel control value, a loss of under 10% compared to the
optimum.
Given that setting temperature to 38 C and RH to 40% is
optimum for almost all criteria considered, and that it reduces
the value of kp by less than 10%, it is suggested that this be used
as the global optimised drying environment. In reality there is a
mix of timber orientation in a frame and the environmental
condition cannot be tailored to individual elements. It is
therefore important to ensure that the best overall drying
outcome is achieved using only one environment, hence the
need for a global optimisation.
3.7 Mechanical property loss and failure
mechanisms
The results presented suggest that the drying method for OSB
sheathed, light timber structures can be optimised to maximise
their return to pre-flooding load-carrying capacity. The per-
manent loss of mechanical properties is mostly attributable to
the OSB used in the connection. The reduction in the
mechanical properties of the OSB is to be expected.
It is well established that an increase of MC can cause
significant permanent reduction in the mechanical properties
of OSB (Wu and Piao, 1999; Wu and Suchsland, 1997). For
Moisture content: %
OSB-MC0 10?7 (1?2)
OSB-MC5 44+ (N/A)
OSB-MCtest 14?6 (3?4)
Timber-MC0 15?3 (0?8)
Timber-MC5 36?3 (1?7)
Timber-MCtest 12?7 (3?5)
Table 2. Averaged MC data for all specimens. The initial values,
MC0 show little variation. Values for OSB-MC5 were consistently
beyond the scale of the MC meter. Parenthetical values are
standard deviations
SpecimenParallel to grain Tangential to grain
Fu: kN Fy: kN k: kN/mm Fu: kN Fy: kN k: kN/mm
Control 1?64 (0?26) 1?22 (0?18) 0?71 (0?39) 2?14 (0?53) 1?35 (0?13) 4?34 (2?37)
1 1?28 (0?30) 1?00 (0?15) 0?50 (0?07) 0?87 (0?09) 0?63 (0?04) 0?64 (0?22)
2 1?00 (0?35) 0?79 (0?16) 0?70 (0?06) 0?80 (0?35) 0?70 (0?20) 1?74 (1?02)
3 1?00 (0?15) 0?80 (0?15) 0?87 (0?18) 1?15 (0?14) 0?72 (0?15) 2?63 (0?23)
4 1?01 (0?17) 0?71 (0?05) 0?56 (0?09) 1?15 (0?25) 0?72 (0?18) 2?63 (1?41)
5 1?07 (0?3) 0?70 (0?05) 0?38 (0?08) 1?68 (0?31) 0?92 (0?21) 2?41 (1?83)
6 0?95 (0?31) 0?62 (0?13) 0?66 (0?06) 1?19 (0?48) 0?99 (0?29) 4?21 (1?34)
7 1?17 (0?08) 0?73 (0?03) 0?43 (0?01) 1?53 (0?30) 0?76 (0?20) 2?50 (0?81)
8 1?24 (0?19) 0?87 (0?14) 0?77 (0?06) 1?38 (0?39) 0?98 (0?11) 6?53 (0?98)
9 1?06 (0?16) 0?84 (0?08) 0?54 (0?11) 0?95 (0?11) 0?68 (0?02) 0?41 (0?05)
Table 3. Results of averaged values for ultimate strength (Fu), yield
strength (Fy) and stiffness (k) for each drying condition and control
specimens. Results are separated into parallel and tangential to
grain. Parenthetical values are standard deviations. See Table 1 for
values of T and RH for each experiment number
Construction Materials The effect of drying on timberframe connections postfloodingBradley, Chang and Harris
11
Offprint provided courtesy of www.icevirtuallibrary.com
Author copy for personal use, not for distribution
example, Wu and Suchsland report that, in bending tests, for a
MC increase from 4 to 24% there is a modulus of elasticity loss
of 72% in the parallel direction and 83% in the perpendicular
direction. Similarly, there is an average modulus of rupture loss
of 58% and 67%. This loss of capacity is a result of adhesive
rupture due to thickness swelling.
As shown in Table 2, there was an average increase in the OSB
MC of more than 33%. It is therefore reasonable to expect a
reduction in the board strength of the tested specimens. The
specimens in these experiments were not tested in bending,
rather, in effect, bearing. Clearly the loss of capacity will
therefore not be identical to that reported by Wu and
Suchsland (1997), but should be of a similar order and a result
of the same mechanism.
The experimental results have also shown that the strength of
the connection specimens is independent of the grain; only
initial stiffness is affected by grain orientation.
3.8 Grain dependency
Visual observations of connection failures showed that it is
always the OSB that ultimately fails, either as nail pull through
or rip out. The consistency of the failure mode, combined with
the lack of influence of grain orientation with respect to Fu
or Fy, demonstrates that it is the OSB that is ultimately
responsible for the strength of the connection and that this
capacity is independent of the grain orientation of the timber.
The initial stiffness is, however, dependent on the orientation,
with kt generally an order of magnitude greater than kp
(Table 2). This indicates that at some point the connection
behaviour must switch from one governed by the timber to one
governed by the OSB.
The connection is loaded so that the OSB moves relative to the
timber. It is suggested that the initial displacement causes the
nail to crush the timber at the edge of the upper side of the nail
hole. At this stage the nail bearing pressure on the OSB is less
than the crushing resistance of the OSB. The displacement at
this stage pulls the nail upwards, bending it and resulting in the
crushing of the timber. Increased deflection causes an increase in
nail bending. This increase in the nail bend causes more of the
length of the nail to actively bear into the timber, resulting in a
greater timber contact surface. When this surface is sufficiently
large, the bearing pressure of the nail and the bearing resistance
of the timber reach equilibrium, resulting in no more nail
bending. There is, however, still displacement being applied to
the specimen and so one of two things must happen. Either the
nail can withdraw from the timber or the OSB can begin to rip as
it moves relative to the nail. The withdrawal capacity of the nail
in the timber is always greater than the axial force exerted by the
loading and as such the OSBmust rip. This has been observed in
all tested specimens. The withdrawal capacity of the nail is a
result of the friction between the nail and the timber into which
it is embedded. This utilisation of the withdrawal resistance of
the nail at large angles of connection deflection is commonly
referred to as the ‘rope effect’.
During this ripping of the OSB board, the nail is not cutting
and removing fibres as a saw would, but rather displacing them
within the sheet, leading to compression in the board around
the nail bearing surface and push out of fibres (Figures 3(c),
3(e), 3(f) and 3(g)).
This proposed mechanism accounts for the influence of grain
orientation on connection stiffness and its lack of influence
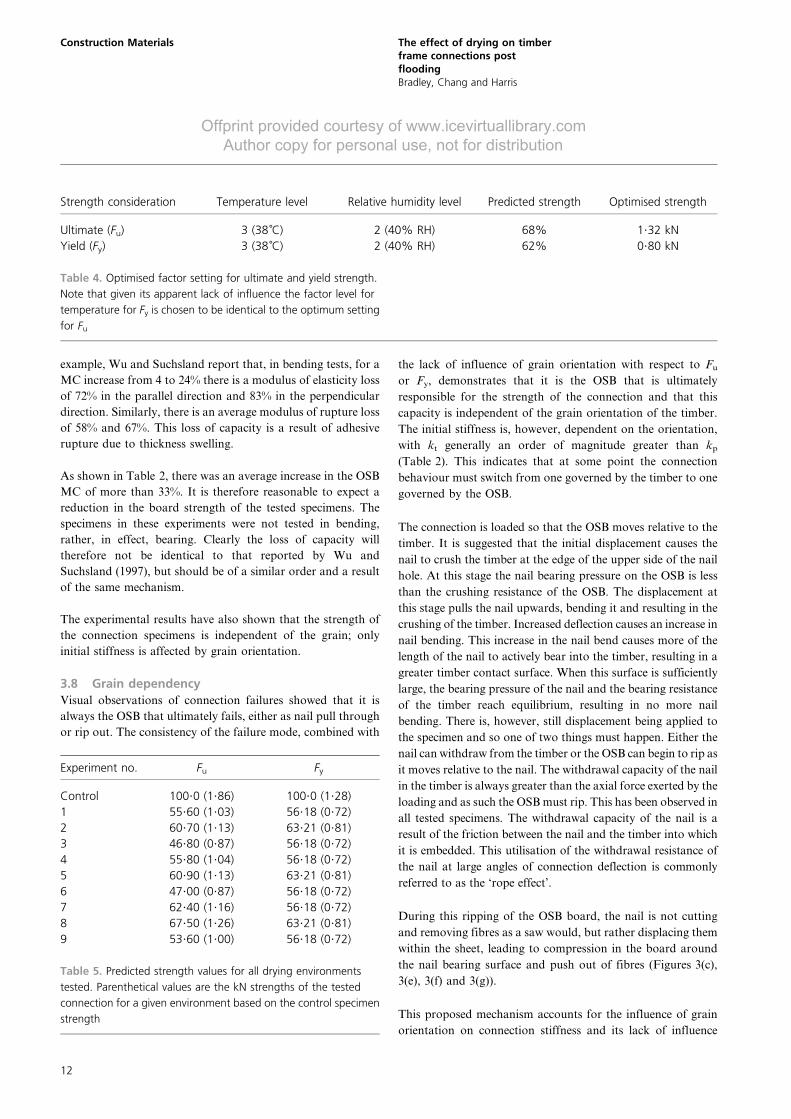
Strength consideration Temperature level Relative humidity level Predicted strength Optimised strength
Ultimate (Fu) 3 (38 ˚C) 2 (40% RH) 68% 1?32 kN
Yield (Fy) 3 (38 ˚C) 2 (40% RH) 62% 0?80 kN
Table 4. Optimised factor setting for ultimate and yield strength.
Note that given its apparent lack of influence the factor level for
temperature for Fy is chosen to be identical to the optimum setting
for Fu
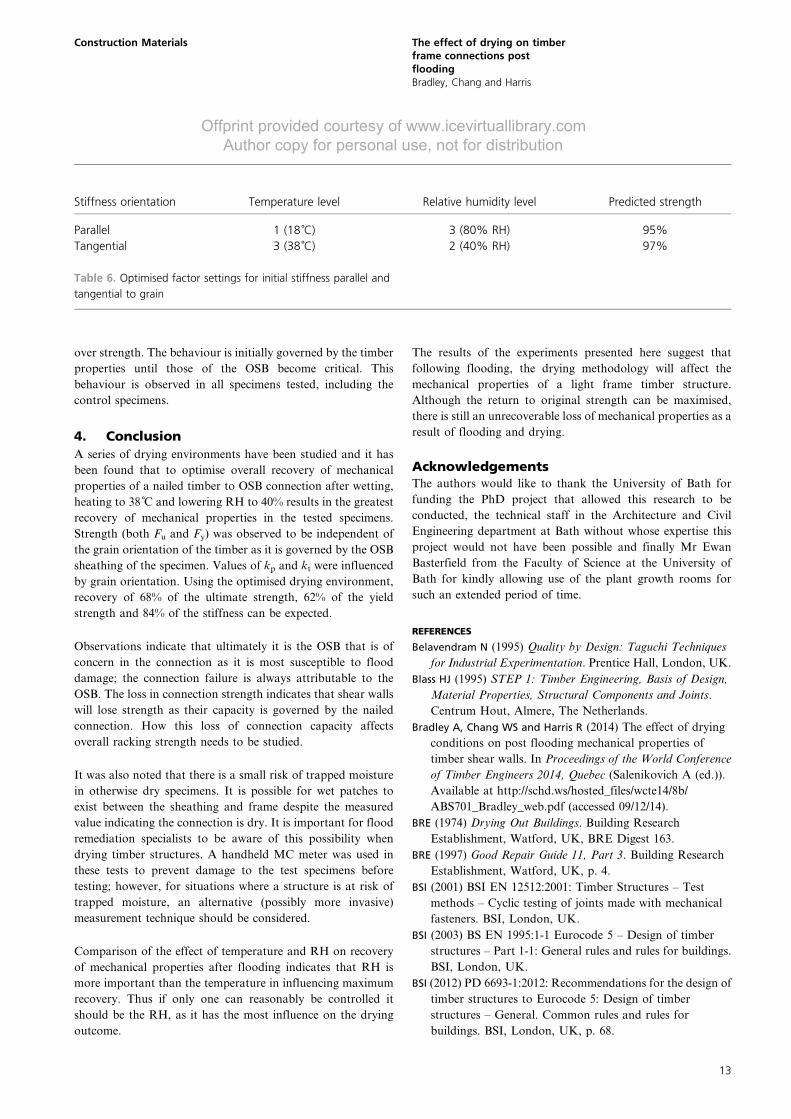
Experiment no. Fu Fy
Control 100?0 (1?86) 100?0 (1?28)
1 55?60 (1?03) 56?18 (0?72)
2 60?70 (1?13) 63?21 (0?81)
3 46?80 (0?87) 56?18 (0?72)
4 55?80 (1?04) 56?18 (0?72)
5 60?90 (1?13) 63?21 (0?81)
6 47?00 (0?87) 56?18 (0?72)
7 62?40 (1?16) 56?18 (0?72)
8 67?50 (1?26) 63?21 (0?81)
9 53?60 (1?00) 56?18 (0?72)
Table 5. Predicted strength values for all drying environments
tested. Parenthetical values are the kN strengths of the tested
connection for a given environment based on the control specimen
strength
Construction Materials The effect of drying on timberframe connections postfloodingBradley, Chang and Harris
12
Offprint provided courtesy of www.icevirtuallibrary.com
Author copy for personal use, not for distribution
over strength. The behaviour is initially governed by the timber
properties until those of the OSB become critical. This
behaviour is observed in all specimens tested, including the
control specimens.
4. Conclusion
A series of drying environments have been studied and it has
been found that to optimise overall recovery of mechanical
properties of a nailed timber to OSB connection after wetting,
heating to 38 C and lowering RH to 40% results in the greatest
recovery of mechanical properties in the tested specimens.
Strength (both Fu and Fy) was observed to be independent of
the grain orientation of the timber as it is governed by the OSB
sheathing of the specimen. Values of kp and kt were influenced
by grain orientation. Using the optimised drying environment,
recovery of 68% of the ultimate strength, 62% of the yield
strength and 84% of the stiffness can be expected.
Observations indicate that ultimately it is the OSB that is of
concern in the connection as it is most susceptible to flood
damage; the connection failure is always attributable to the
OSB. The loss in connection strength indicates that shear walls
will lose strength as their capacity is governed by the nailed
connection. How this loss of connection capacity affects
overall racking strength needs to be studied.
It was also noted that there is a small risk of trapped moisture
in otherwise dry specimens. It is possible for wet patches to
exist between the sheathing and frame despite the measured
value indicating the connection is dry. It is important for flood
remediation specialists to be aware of this possibility when
drying timber structures. A handheld MC meter was used in
these tests to prevent damage to the test specimens before
testing; however, for situations where a structure is at risk of
trapped moisture, an alternative (possibly more invasive)
measurement technique should be considered.
Comparison of the effect of temperature and RH on recovery
of mechanical properties after flooding indicates that RH is
more important than the temperature in influencing maximum
recovery. Thus if only one can reasonably be controlled it
should be the RH, as it has the most influence on the drying
outcome.
The results of the experiments presented here suggest that
following flooding, the drying methodology will affect the
mechanical properties of a light frame timber structure.
Although the return to original strength can be maximised,
there is still an unrecoverable loss of mechanical properties as a
result of flooding and drying.
Acknowledgements
The authors would like to thank the University of Bath for
funding the PhD project that allowed this research to be
conducted, the technical staff in the Architecture and Civil
Engineering department at Bath without whose expertise this
project would not have been possible and finally Mr Ewan
Basterfield from the Faculty of Science at the University of
Bath for kindly allowing use of the plant growth rooms for
such an extended period of time.
REFERENCES
Belavendram N (1995) Quality by Design: Taguchi Techniques
for Industrial Experimentation. Prentice Hall, London, UK.
Blass HJ (1995) STEP 1: Timber Engineering, Basis of Design,
Material Properties, Structural Components and Joints.
Centrum Hout, Almere, The Netherlands.
Bradley A, Chang WS and Harris R (2014) The effect of drying
conditions on post flooding mechanical properties of
timber shear walls. In Proceedings of the World Conference
of Timber Engineers 2014, Quebec (Salenikovich A (ed.)).
Available at http://schd.ws/hosted_files/wcte14/8b/
ABS701_Bradley_web.pdf (accessed 09/12/14).
BRE (1974) Drying Out Buildings. Building Research
Establishment, Watford, UK, BRE Digest 163.
BRE (1997) Good Repair Guide 11, Part 3. Building Research
Establishment, Watford, UK, p. 4.
BSI (2001) BSI EN 12512:2001: Timber Structures – Test
methods – Cyclic testing of joints made with mechanical
fasteners. BSI, London, UK.
BSI (2003) BS EN 1995:1-1 Eurocode 5 – Design of timber
structures – Part 1-1: General rules and rules for buildings.
BSI, London, UK.
BSI (2012) PD 6693-1:2012: Recommendations for the design of
timber structures to Eurocode 5: Design of timber
structures – General. Common rules and rules for
buildings. BSI, London, UK, p. 68.
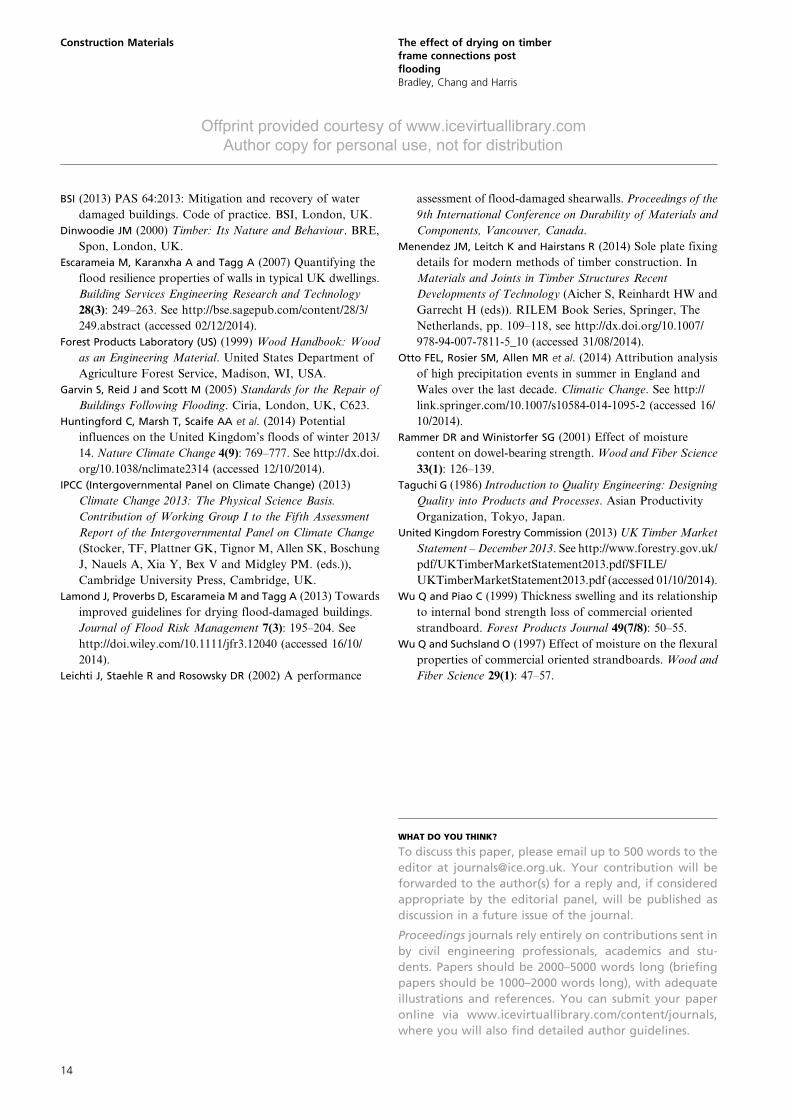
Stiffness orientation Temperature level Relative humidity level Predicted strength
Parallel 1 (18 ˚C) 3 (80% RH) 95%
Tangential 3 (38 ˚C) 2 (40% RH) 97%
Table 6. Optimised factor settings for initial stiffness parallel and
tangential to grain
Construction Materials The effect of drying on timberframe connections postfloodingBradley, Chang and Harris
13
Offprint provided courtesy of www.icevirtuallibrary.com
Author copy for personal use, not for distribution
BSI (2013) PAS 64:2013: Mitigation and recovery of water
damaged buildings. Code of practice. BSI, London, UK.
Dinwoodie JM (2000) Timber: Its Nature and Behaviour. BRE,
Spon, London, UK.
Escarameia M, Karanxha A and Tagg A (2007) Quantifying the
flood resilience properties of walls in typical UK dwellings.
Building Services Engineering Research and Technology
28(3): 249–263. See http://bse.sagepub.com/content/28/3/
249.abstract (accessed 02/12/2014).
Forest Products Laboratory (US) (1999) Wood Handbook: Wood
as an Engineering Material. United States Department of
Agriculture Forest Service, Madison, WI, USA.
Garvin S, Reid J and Scott M (2005) Standards for the Repair of
Buildings Following Flooding. Ciria, London, UK, C623.
Huntingford C, Marsh T, Scaife AA et al. (2014) Potential
influences on the United Kingdom’s floods of winter 2013/
14. Nature Climate Change 4(9): 769–777. See http://dx.doi.
org/10.1038/nclimate2314 (accessed 12/10/2014).
IPCC (Intergovernmental Panel on Climate Change) (2013)
Climate Change 2013: The Physical Science Basis.
Contribution of Working Group I to the Fifth Assessment
Report of the Intergovernmental Panel on Climate Change
(Stocker, TF, Plattner GK, Tignor M, Allen SK, Boschung
J, Nauels A, Xia Y, Bex V and Midgley PM. (eds.)),
Cambridge University Press, Cambridge, UK.
Lamond J, Proverbs D, Escarameia M and Tagg A (2013) Towards
improved guidelines for drying flood-damaged buildings.
Journal of Flood Risk Management 7(3): 195–204. See
http://doi.wiley.com/10.1111/jfr3.12040 (accessed 16/10/
2014).
Leichti J, Staehle R and Rosowsky DR (2002) A performance
assessment of flood-damaged shearwalls. Proceedings of the
9th International Conference on Durability of Materials and
Components, Vancouver, Canada.
Menendez JM, Leitch K and Hairstans R (2014) Sole plate fixing
details for modern methods of timber construction. In
Materials and Joints in Timber Structures Recent
Developments of Technology (Aicher S, Reinhardt HW and
Garrecht H (eds)). RILEM Book Series, Springer, The
Netherlands, pp. 109–118, see http://dx.doi.org/10.1007/
978-94-007-7811-5_10 (accessed 31/08/2014).
Otto FEL, Rosier SM, Allen MR et al. (2014) Attribution analysis
of high precipitation events in summer in England and
Wales over the last decade. Climatic Change. See http://
link.springer.com/10.1007/s10584-014-1095-2 (accessed 16/
10/2014).
Rammer DR and Winistorfer SG (2001) Effect of moisture
content on dowel-bearing strength. Wood and Fiber Science
33(1): 126–139.
Taguchi G (1986) Introduction to Quality Engineering: Designing
Quality into Products and Processes. Asian Productivity
Organization, Tokyo, Japan.
United Kingdom Forestry Commission (2013) UK Timber Market
Statement – December 2013. See http://www.forestry.gov.uk/
pdf/UKTimberMarketStatement2013.pdf/$FILE/
UKTimberMarketStatement2013.pdf (accessed 01/10/2014).
Wu Q and Piao C (1999) Thickness swelling and its relationship
to internal bond strength loss of commercial oriented
strandboard. Forest Products Journal 49(7/8): 50–55.
Wu Q and Suchsland O (1997) Effect of moisture on the flexural
properties of commercial oriented strandboards. Wood and
Fiber Science 29(1): 47–57.
WHAT DO YOU THINK?
To discuss this paper, please email up to 500 words to the
editor at [email protected]. Your contribution will be
forwarded to the author(s) for a reply and, if considered
appropriate by the editorial panel, will be published as
discussion in a future issue of the journal.
Proceedings journals rely entirely on contributions sent in
by civil engineering professionals, academics and stu-
dents. Papers should be 2000–5000 words long (briefing
papers should be 1000–2000 words long), with adequate
illustrations and references. You can submit your paper
online via www.icevirtuallibrary.com/content/journals,
where you will also find detailed author guidelines.
Construction Materials The effect of drying on timberframe connections postfloodingBradley, Chang and Harris
14