the effect of cognitive style and mode of presentation on learning performance
TRANSCRIPT

British Journal of Educational Psychology (1993). 63,291-307 Printed in Great Britain 0 1993 The British Psychological Society
The effect of cognitive style and mode of presentation on learning performance
Richard Riding* and Graeme Douglas Assessment Research Unit, University of Birmingham
The effect of text-plus-text versus text-plus-picture computer presentation conditions, and the students’ cognitive styles, on learning performance was investigated. In the text-plus-text condition, the learning material content described the working of car braking systems. The text-plus-picture condition consisted of text with additional pictorial information. Fifty-nine 15- 16-year-old students in a secondary school were randomly assigned, within sexes, to one of the conditions. Having worked through the computer presented material, they were given a post-test overall learning perform- ance. Immediately following this, they did the Cognitive Styles Analysis (CSA) (Riding, 1991) which measures an individual’s position on two cognitive style dimensions; Verbal-Imagery and Wholist-Analytic. It was found that the Verbal- Imagery cognitive style and presentation condition interacted in their effect on overall learning performance (pe.05). In the text-plus-picture condition Imagers were supe- nor to Verbalisers, while the text-plus-text condition Verbalisers did better than Imagers. It was also observed that Imagers used more diagrams to illustrate their answers than Verbalisers. The results are discussed in terms of their implications for instruction.
Previous work has suggested that diagrams and pictures which directly illustrate the content of text facilitate its comprehension, (see, for example, the review by Levie & Lentz, 1982). Mayer (1989) compared illustrated text versus text alone. Female college students worked through learning material on the topic of ‘brakes’. For half of the sample the learning material contained only text, while for the rest half the text had additional labelled illustra- tions. The learning period was followed by learning performance tests including recall, problem solving, and verbatim recognition. Problem solving and recall of explanatory de- tails were superior when the pictures were included in the learning material. However, it should be noted that the illustrations were in addition to the text, and not in place of a portion of it.
Also, the issue of individual differences was not addressed by either Levie & Lentz (1982), or by Mayer (1989). It was assumed that all people learn in a similar way. In fact, the effect of the diagrams in facilitating learning may only apply for certain individuals. The present paper will consider learning from text and illustrations within the context of two fundamental cognitive style dimensions of individual differences.
*Requests for reprints should be addressed to Dr R.J. Riding, Assessment Research Unit, School of Education, University of Birmingham, Birmingham B15 2”.
D

298 Richard Riding and Graeme Douglas
Cognitive styles In the present context, a cognitive style is considered to be a fairly fixed characteristic of an individual, while cognitive strategies are the ways that may be used to cope with situations and tasks. Strategies may vary from time to time and may be learned and developed. Styles, by contrast, are static and are relatively in-built features of the individual. Cognitive style has been defined succinctly by Tennant (1988): ‘an individual’s characteristic and consist- ent approach to organising and processing information’.
A number of different labels have been given to cognitive styles and it has been argued that many of these are but different conceptions of the same dimensions (Brumby, 1982; Coan, 1974; Fowler, 1980; Miller, 1987; Riding & Buckle, 1990). Riding & Cheema (1991) surveyed the various labels and, after reviewing the descriptions, correlations, methods of assessment and effect on behaviour, concluded that they may be grouped into two principal cognitive styles; the Wholist-Analytic and the Verbal-Imagery dimensions.
Two basic dimensions of cognitive style may be summarised as follows. (1) The Wholist-Analytic style of whether an individual tends to process information in
(2) The Verbal-Imagery style of whether an individual is inclined to represent informa- wholes or parts.
tion during thinking verbally or in mental images. The two styles are independent of one another.
These two dimensions may be assessed using the Cognitive Styles Analysis (Riding, 199 I ) , which positively assesses both ends of the Wholist-Analytic and Verbal-Imagery dimensions.
The Cognitive Styles Analysis comprises three subtests. The first assesses the Verbal- Imagery dimension by presenting statements one at a time to be judged true or false. Half of the statements contained information about conceptual categories while the rest described the appearance of items. Half of the statements of each type were true and the rest false. It was assumed that Imagers would respond more quickly to the appearance statements, because the objects could be readily represented as mental pictures and the information for the comparison could be obtained directly and rapidly from these images. In the case of the conceptual category items, it was assumed that Verbalisers would have a shorter response time because the semantic conceptual category membership is verbally abstract in nature and cannot be represented in visual form. The computer records the response time to each statement and calculates the Verbal-Imagery ratio. A ratio of less than one corresponds to a verbaliser and a ratio of more than one to an imager. It may be noted that in this approach individuals have to read both the verbal and the imagery items so that it is not a test of reading ability or of reading speed.
The other two subtests assess the Wholist-Analytic dimension. The first of these presents items containing pairs of complex geometrical figures which the individual is required to judge either the same or different. Since this task involves judgments about the overall similarity of the two figures it was assumed that a relatively fast response to this task would be possible by Wholists. The second presents items each comprising a simple geometrical shape (e.g., a square or a triangle) and a complex geometrical figure, and the individual is asked to indicate whether or not the simple shape is contained in the complex one by pressing one of the two marked response keys. This task requires a degree of disembedding of the simple shape within the complex geometrical figure in order to establish that it is the same as the stimulus simple shape displayed, and it was assumed that Analytics would be

Cognitive style and presentation mode 299
relatively quicker at this. The computer records the latency of the responses, and from these calculates the Wholist-Analytic ratio. A ratio of less than one corresponds to a Wholist and a ratio of more than one to an Analytic.
The Cognitive Styles Analysis provides a simple and convenient means of assessing an individual’s position on the two fundamental cognitive style dimensions. It takes only about 10 minutes per person to administer and is self-scoring.
It may be argued that this approach to assessment of learning styles is preferable to that of using questionnaires, such as the Learning Styles Questionnaire of Honey & Mumford (1986), and the Learning Styles Inventory (Kolb, 1981), which seek to assess styles less directly by looking at the strategies that may arise from them. The CSA is a more direct measure, assessing the fundamental underlying mechanisms which determine behaviour.
Cognitive styles and learning pegormance Verbal-Imagery style. Verbal-Imagery cognitive style has been found to be related to cogni- tive tasks relevant to training. These findings fall into two categories. Firstly, mode of presentation of learning material and, secondly, the type of content of learning material.
Generally Imagers learn best from pictorial presentations, while Verbalisers learn best from verbal presentations (Riding & Ashmore, 1980; Riding & Buckle, 1990; Riding, Buckle, Thompson & Hagger, 1989). Therefore, it is possible that the main effects of the addition of diagrams on the recall of text (in experiments such as Mayer, 1989) may be caused by an improvement in the learning performance of just the Imagers, while the Verbalisers are unaffected.
In the case of the type of content of learning material it has been found that Imagers recall highly descriptive text better than acoustically complex and unfamiliar text. The reverse is true for Verbalisers (Riding & Calvey, 1981; Riding & Dyer, 1980).
In terms of both presentation mode and content type, individuals appear to learn best when information can be readily transferred to their mode of representation.
The Riding & Ashmore (1980) study compared the effect of text-only with picture-only presentation modes on an individual’s learning performance. The content of the information was textual description with a picture alternative. In many real instructional situations it is not possible to represent all the information in pictorial form, particularly when it is of an explanatory nature. In this case it is likely to be either text-plus-text or text-plus-picture, where the pictorial material replaces the additional text.
The study by Mayer (1989) had a content of an explanatory nature, which could not be represented in only pictorial form. He investigated the effect of the addition of diagrams to the text, but these did not actually replace any text. From the point of view of individual differences, the format of his study would not allow the clear attribution of any effects to the mode of presentation because of the presence of the additional information provided by the pictures.
In order to test the effects of the mode of presentation, it is necessary to provide the same informational content in each mode. This study seeks to test different individual learning performance of complex explanatory information in different presentation modes.
Wholist-Analytic style. An individual’s position on the Wholist-Analytic dimension often interacts with the structure of the learning material to affect performance (see, for instance, Riding & Sadler-Smith, 1992).
The aim of the present study was to investigate the effects of cognitive styles, particularly
300 Richard Riding and Graeme Douglas
the Verbal-Imagery dimension, and learning material presentation mode (texvpicture), on learning performance. The intention was to compare performance of two forms of a compu- ter-presented package. These were a purely text condition (text with additional text infor- mation), and a text with pictures condition (text with additional picture information).
Method
Sample The sample comprised 59, year 11 students (15- to 16-year-old, 26 female and 33 male) of an urban secondary school. They were randomly allocated to the two conditions (29 in the text plus additional text condition, and 30 in the text and picture condition).
Materials Cognitive styles measure. The position of the participants on each of the cognitive style dimensions (VI and WA) was determined using the computer-presented Cognitive Styles Analysis (CSA) (Riding, 1991). The CSA indicates the position on the two dimensions by means of two ratios.
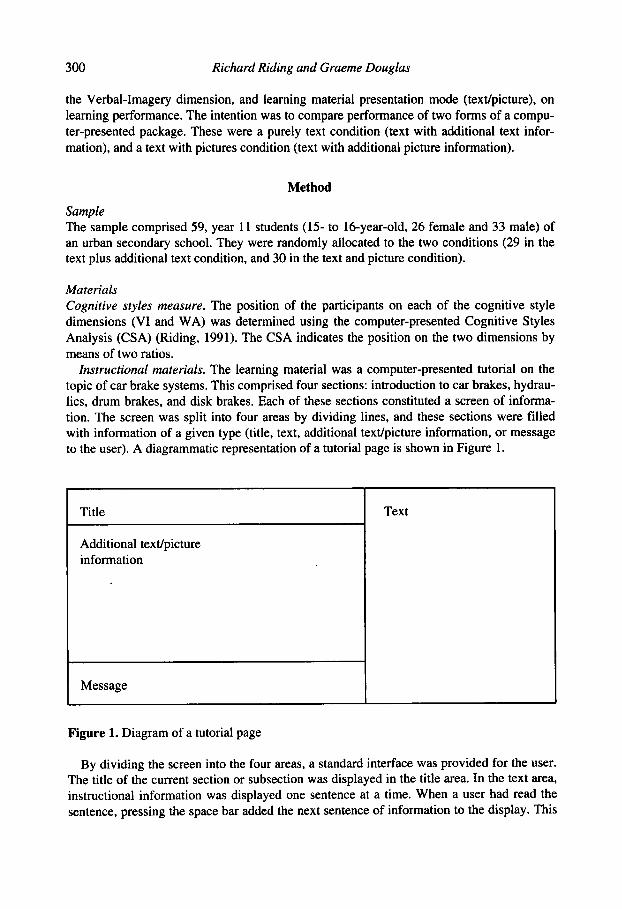
Insrructional materials. The learning material was a computer-presented tutorial on the topic of car brake systems. This comprised four sections: introduction to car brakes, hydrau- lics, drum brakes, and disk brakes. Each of these sections constituted a screen of informa- tion. The screen was split into four areas by dividing lines, and these sections were filled with information of a given type (title, text, additional texdpicture information, or message to the user). A diagrammatic representation of a tutorial page is shown in Figure 1.
Title
Additional texdpicture information
Message
Figure 1. Diagram of a tutorial page
Text
By dividing the screen into the four areas, a standard interface was provided for the user. The title of the current section or subsection was displayed in the title area. In the text area, instructional information was displayed one sentence at a time. When a user had read the sentence, pressing the space bar added the next sentence of information to the display. This

Cognitive style and presentation mode 30 1
was prompted by a message of ‘Press the space bar to continue’ displayed in the message area. The information in the text area was derived from information in the World Book Encyclopaedia (1988), which Mayer (1989) used.
In the additional texdpicture information area, further material was displayed. The type of information in this area determined the presentation condition. The text-plus-text presen- tation condition displayed verbal descriptions of the pictures and animation which were presented in the text-plus-picture presentation condition. (Examples are cross-section pic- tures of drum and disk brakes.) Other than the differences in the information in this area, the two presentation conditions were identical.
Because of the constraint of the availability of equipment, the two presentation condi- tions were implemented on two different types of computer. The text with pictures condi- tion was implemented (using Microsoft Basic Version 7.0, in EGA - 640 by 350 pixels - graphics mode) on IBM compatible machines, whereas the text only condition was imple- mented (using BBC Basic Version 5, in graphics mode 12 - 248 by 640 pixels) on Archimedes machines. Visually, the two displays were very similar in terms of colour, layout and size of text.
Learning pe?formance Learning performance .was obtained for each participant by measuring their attainment on four paper-presented subtests:
(a ) Short recall questions. This consisted of eight questions. Each question demanded the recall of a single word or sentence of non-explanatory information such as definitions, descriptions, and supplying missing words. Maximum marks possible for these questions were 12.
(b ) Explanation question. This was a single question which asked for an explanation of how a drum brake works. Therefore, the question demanded the recall of explanatory type information. Maximum marks possible for this question were 15.
( c ) Problem solving question. This was a single question which asked for a list of as many possible solutions to a problem as possible. The problem described a scenario of a driver pressing the brake pedal but the brakes not working. The participant was asked to list as many things that might have gone wrong as possible. A similar question was used by Mayer (1989). Maximum marks possible for this question were 14.
(d) Labelling questions. This task consisted of three diagrams similar to some of those in the picture and text condition of the tutorial (cross-sections of an hydraulic system, a drum brake, and a disk brake). The participant was asked to fill in missing labels on each diagram (five on the first, four on the second, and five on the third). Maximum marks possible for this question were 14.
In the case of section A and section D (short answers and labelling questions) marking was based upon the equivalent words and phrases given in the learning material. Section A was marked out of 12 (questions 1,3 ,4 and 5 could each score two marks, while 2,6 ,7 and 8 could each score one mark); and section D was out of 14 (one mark for each correct label). The marking of section B was carried out according to the method outlined by Mayer (1985) and used by Mayer (1989). In short, it was marked by deriving a model answer for the learning material and splitting this into idea units (a total of 15). If the answer included an idea unit then a mark was awarded (each idea unit could only score one
302 Richard Riding and Graeme Douglas
mark). If a drawing was used in answering the question then these were marked in the same way. For section C, a list of possible answers was constructed. Some of these were arranged in an hierarchical manner. This allowed more detailed answers to attain more marks than less complete ones. For example, ‘broken cylinder’ would receive one mark, and ‘broken wheel cylinder’ and ‘broken master cylinder’ would receive one mark each. However, it would not be possible to receive all three marks. This gave a maximum possible score of 14.
Procedure Testing took 50 minutes and a maximum of 10 participants could be tested in a single session, using the 10 computers available (five IBM compatible machines, and five Archimedes) .
Participants were given a booklet containing instructions and the learning tests, and randomly assigned (within the constraint of controlling for sex) to a computer. They were told only to look at sections when instructed. They read the instructions on the front of the booklet, filled in some demographic details, and answered three simple questions (for example ‘Have you ever seen a car wheel changed?’) which provided introductory context for the following tutorial.
When participants had completed the tutorial they were told to work through the question booklet. The booklet contained the first three subtests (sections A, B, and C), and when these had been completed the booklet was collected and the final subtest (section D, the labelling questions) was administered. On completing this, participants did the CSA on the IBM compatible computers.
Results
Characteristics of the sample The Verbal-Imagery style ratios ranged from 0.63 to 1.47 (mean = 1.067, median = 1.044, SD = 0.163). The Wholist-Analytic style ratios ranged from 0.54 to 1.92 (mean = 1.092, median = 1.077, SD = 0.335). The correlation between the two styles was low ( r = -.03), confirming the independence of the measures (see also Riding & Douglas, 1992; Riding & Mathias, 1991). The correlations between sex and Verbal-Imagery (r=-.05) and sex and Wholist-Analytic style (r=-.22) were also low.
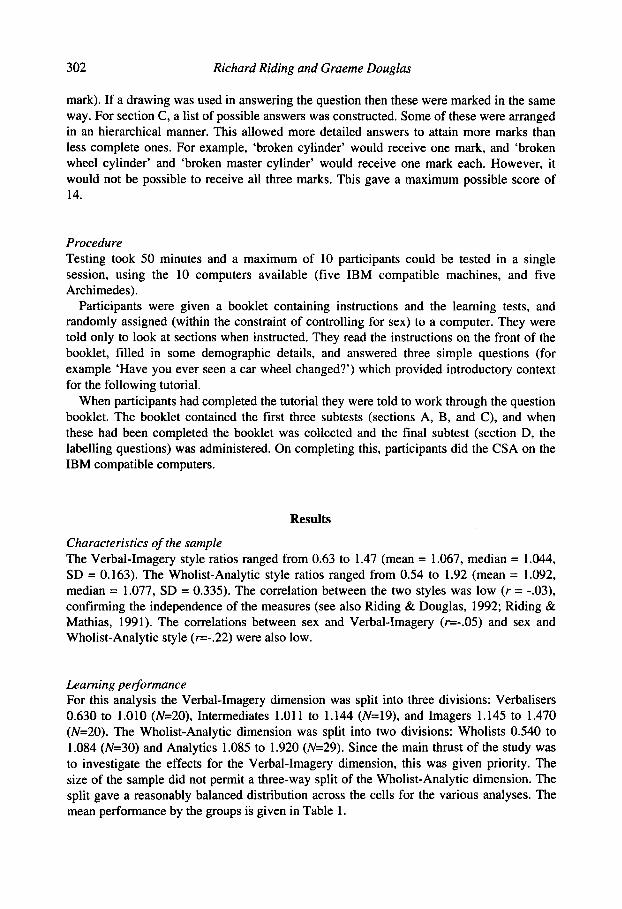
Learning performance For this analysis the Verbal-Imagery dimension was split into three divisions: Verbalisers 0.630 to 1.010 (N=20), Intermediates 1.011 to 1.144 (N=19), and Imagers 1.145 to 1.470 (N=20). The Wholist-Analytic dimension was split into two divisions: Wholists 0.540 to 1.084 (N=30) and Analytics 1.085 to 1.920 (N=29). Since the main thrust of the study was to investigate the effects for the Verbal-Imagery dimension, this was given priority. The size of the sample did not permit a three-way split of the Wholist-Analytic dimension. The split gave a reasonably balanced distribution across the cells for the various analyses. The mean performance by the groups is given in Table 1.
Cognitive style and presentation mode 303
Table 1. Mean percentage performance for subtests (SDs in brackets)
Cognitive Style Condition Subtest Overall A B C D Means
Verbaliser Wholist Text 55.0 (22.5) 20.0 (22.1) 40.0 (20.0) 40.7 (27.4) 38.9 (18.2) Picture 58.3 (11.8) 23.3 (16.2) 50.0 (27.6) 43.5 (16.0) 43.8 (10.6)
Analytic Text 56.0 (16.5) 30.5 (18.4) 42.8 (31.5) 51.5 (18.7) 45.2 (16.9) Picture 75.0 (11.8) 43.3 (14.1) 40.0 (28.3) 46.4 (45.5) 51.2 (24.9)
Inter- Wholist Text 61.7 (22.5) 13.3 (20.5) 48.0 (17.9) 45.0 (34.1) 42.0 (18.6) mediate Picture 50.0 (22.0) 28.9 (13.9) 13.3 (23.1) 27.4 (08.2) 29.9 (14.7)
Analytic Text 66.7 (20.4) 30.0 (25.8) 40.0 (28.3) 40.2 (29.4) 44.2 (22.5) Picture 64.3 (13.4) 35.2 (24.9) 54.3 (19.0) 56.6(18.0) 52.6 (11.5)
Imager Wholist Text 46.7 (13.9) 13.3 (26.2) 32.0 ( 1 1.0) 29.3 (06.9) 30.3 (09.7) Picture 69.4 (16.4) 40.0 (15.8) 60.0 (25.3) 54.2 (29.5) 55.9 (14.5)
Analytic Text 61.7 (12.7) 15.6 (16.8) 33.3 (23.1) 31.0 (20.3) 35.2 ( 1 1.3) Picture 70.8 (19.5) 40.0 (11.9) 56.7 (15.1) 66.1 (26.8) 58.4 (15.9)
Overall 61.0 (17.4) 28.0 (20.4) 45.1 (23.7) 46.5 (24.2) 45.2 (16.5)
Text = text-plus-text condition Picture = text-plus-picture condition Subtest A = short recall questions Subtest B = explanation question Subtest C = problem-solving question Subtest D = labelling questions
A three-way analysis of variance of Verbal-Imagery cognitive style, Wholist-Analytic cognitive style, and presentation condition with repeated measures on the four subtests of learning performance was performed on the data. The only significant within-subject effect was of a difference between the four subtests with the short recall questions being the easiest ( F = 34.63; d.f. = 3,141; pc.001). Type of test did not interact with any of the other variables.
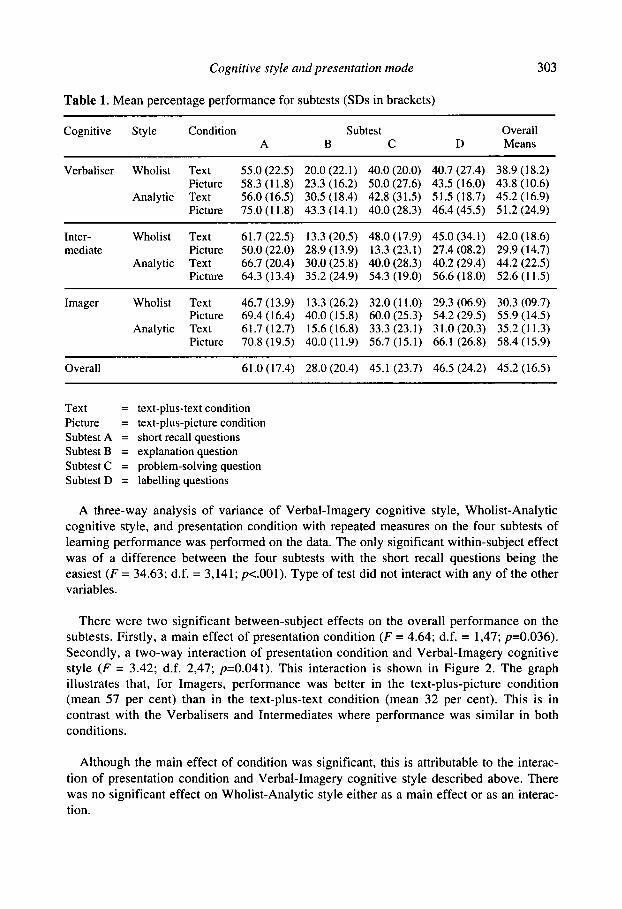
There were two significant between-subject effects on the overall performance on the subtests. Firstly, a main effect of presentation condition ( F = 4.64; d.f. = 1,47; p=0.036). Secondly, a two-way interaction of presentation condition and Verbal-Imagery cognitive style ( F = 3.42; d.f. 2,47; p=0.041). This interaction is shown in Figure 2. The graph illustrates that, for Imagers, performance was better in the text-plus-picture condition (mean 57 per cent) than in the text-plus-text condition (mean 32 per cent). This is in contrast with the Verbalisers and Intermediates where performance was similar in both conditions.
Although the main effect of condition was significant, this is attributable to the interac- tion of presentation condition and Verbal-Imagery cognitive style described above. There was no significant effect on Wholist-Analytic style either as a main effect or as an interac- tion.
Richard Riding and Graeme Douglas
Presentation condition
0 Text-plus-Text
Text-plus-Picture
Verbaliser Intermediate Imager VI Cognitive Style
Figure 2. Overall recall score against VI cognitive style
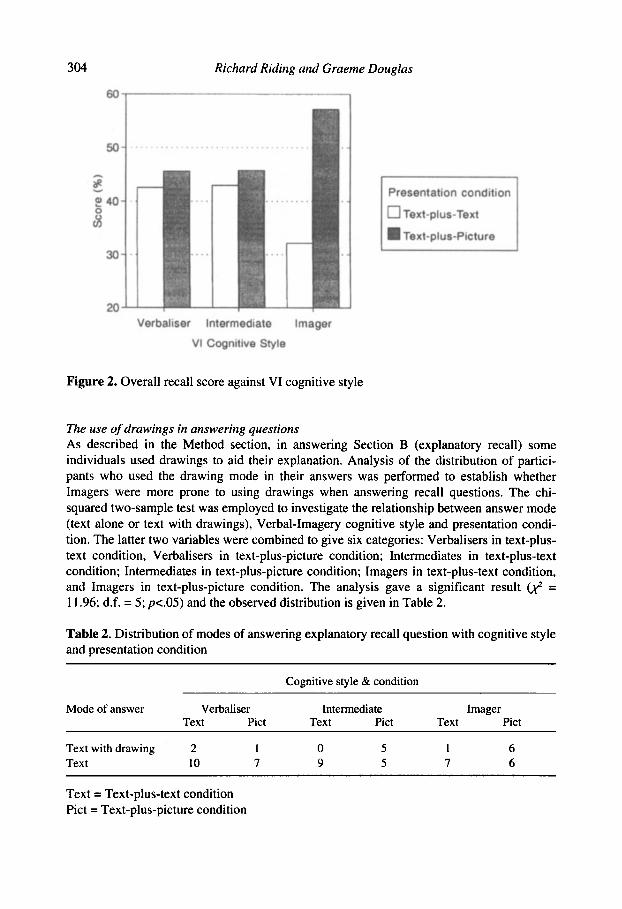
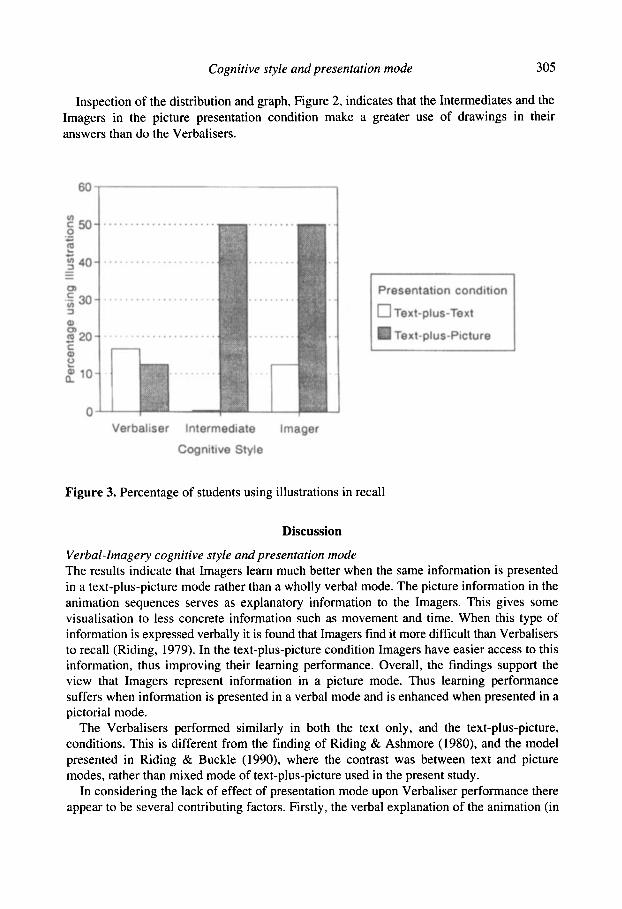
The use of drawings in answering questions As described in the Method section, in answering Section B (explanatory recall) some individuals used drawings to aid their explanation. Analysis of the distribution of partici- pants who used the drawing mode in their answers was performed to establish whether Imagers were more prone to using drawings when answering recall questions. The chi- squared two-sample test was employed to investigate the relationship between answer mode (text alone or text with drawings), Verbal-Imagery cognitive style and presentation condi- tion. The latter two variables were combined to give six categories: Verbalisers in text-plus- text condition, Verbalisers in text-plus-picture condition; Intermediates in text-plus-text condition; Intermediates in text-plus-picture condition; Imagers in text-plus-text condition, and Imagers in text-plus-picture condition. The analysis gave a significant result @ = 1 1.96; d.f. = 5 ; pc.05) and the observed distribution is given in Table 2.
Table 2. Distribution of modes of answering explanatory recall question with cognitive style and presentation condition
Cognitive style & condition
Mode of answer Verbaliser Intermediate Imager Text Pict Text Pict Text Pict
Text with drawing 2 1 0 5 1 6 Text 10 7 9 5 7 6
Text = Text-plus-text condition Pict = Text-plus-picture condition
Cognitive style and presentation mode 305
Inspection of the distribution and graph, Figure 2, indicates that the Intermediates and the Imagers in the picture presentation condition make a greater use of drawings in their answers than do the Verbalisers.
60 I
...............
...............
. . . . . . . . . . . . . . . Presentation condition
Verbaliser Intermediate Imager
Cognitive Style
Figure 3. Percentage of students using illustrations in recall
Discussion
Verbal-Imagery cognitive style and presentation mode The results indicate that Imagers learn much better when the same information is presented in a text-plus-picture mode rather than a wholly verbal mode. The picture information in the animation sequences serves as explanatory information to the Imagers. This gives some visualisation to less concrete information such as movement and time. When this type of information is expressed verbally it is found that Imagers find it more difficult than Verbalisers to recall (Riding, 1979). In the text-plus-picture condition Imagers have easier access to this information, thus improving their learning performance. Overall, the findings support the view that Imagers represent information in a picture mode. Thus learning performance suffers when information is presented in a verbal mode and is enhanced when presented in a pictorial mode.
The Verbalisers performed similarly in both the text only, and the text-plus-picture, conditions. This is different from the finding of Riding & Ashmore (1980), and the model presented in Riding & Buckle (1990), where the contrast was between text and picture modes, rather than mixed mode of text-plus-picture used in the present study.
In considering the lack of effect of presentation mode upon Verbaliser performance there appear to be several contributing factors. Firstly, the verbal explanation of the animation (in

306 Richard Riding and Graeme Douglas
the text only condition) tended to reiterate the verbal explanation given in the text (pre- sented in the text area of the screen) common to both conditions. Therefore, there was little reason why the Verbalisers should change in performance across the two conditions, and more consideration should be given to what additional verbal information would give the same increase in performance to the Verbalisers, as the pictures and animations do for Imagers.
Another possible contribution to the effect, is that information type also has an effect upon recall performance by different cognitive styles. For example, some studies (Riding, 1979; Riding & Calvey, 1981; Riding & Dyer, 1980; Riding & Taylor, 1976) suggest that verbal descriptive information which is easy to visualise is recalled better by Imagers. This suggests that verbal information falls upon a continuum of ease of visualisation, and that a clear prediction of descriptive recall performance requires a model that embodies both the effects of mode of presentation and type of content, and hence a study to investigate the relative ease of visualisation of text is warranted.
Individual differences in answering style With the explanation question some participants used diagrams in their answer. The results indicate that Intermediates and Imagers are more inclined to use diagrams when recalling explanatory information. These results suggest that because these individuals have a greater tendency to represent and manipulate information in image mode they also attempt to express themselves in their habitual mode. It is noticeable that the Imagers do not make a greater use of diagrams in their answers in the text only condition. This suggests that the Imagers were forced to use cognitive strategies to work in the verbal mode of representa- tion, as reflected by their poor learning performance. This finding appears to add further validity to the assertion that the Verbal-Imagery ratio reflects an individual’s habitual mode of representation.
Acknowledgments
The authors wish to acknowledge the co-operation of the staff and students of Sheldon School, Chippenham, Wiltshire in the conduct of this study.
References
Brumby, M. N. (1982). Consistent differences in cognitive styles shown for qualitative biological problem-solving. British Journal of Educational Psychology, 52,244-257.
Coan, R. (1974). The Optimal Personality: An Empirical and Theoretical Analysis. New York Columbia University Press.
Fowler, W. (1980). Cognitive differentiation and developmental learning. In H. Rees & L. Lipsitt (Eds), Advances in Child Development and Behaviour, Vol. 15, pp. 163-206. New York: Academic Press.
Honey, P. & Mumford, A. (1986). The Manual of Learning Styles. Maidenhead: Honey. Kolb, D. A. (1981). The Learning Style Inventory. Boston, Mass.: McBer & CO. Levie, W. H. & Lentz, R. (1982). Effects of text illustrations: a review of research. Educational
Communications and Technology: A Journal of Theory, Research and Development, 30, 195-232. Mayer, R. E. (1985). Structural analysis of science prose: can we increase problem solving performance?
In J. Black & B. Britton (Eds), Understanding Expository Prose, pp. 67-87. Hillsdale, NJ: Erlbaum. Mayer, R. E. (1989). Systematic thinking fostered by illustrations in scientific text. Journal ofEducationa1
Psychology, 81,240-246.

Cognitive style and presentation mode 307
Miller, A. ( 1 987). Cognitive styles: an integrated model. Educational Psychology, 7,25 1-268. Riding, R. J. (1979). The effect of extraversion and detail content on the recall of prose by eleven-year-
Riding, R. J. ( 1 991). Cognitive Styles Analysis. Birmingham: Learning and Training Technology. Riding, R. J. & Ashmore, J. (1980). Verbaliser-imager learning style and children’s recall of information
presented in pictorial versus written form. Educational Studies, 6 , 141 -145. Riding, R. J. & Buckle, C. F. (1990). Learning Styles and Training Performance. Sheffield: Training
Agency. Riding, R. J., Buckle, C. F., Thompson, S. & Hagger, E. (1989). The computer determination of learning
styles as an aid to individualised computer-based training. Educational and Training Technology International, 26, 293-298.
Riding, R. J. & Calvey, I. (1981). The assessment of verbal-imagery learning styles and their effect on the recall of concrete and abstract prose passages by eleven-year-old children. British Journal of Psychology, 72, 59-64.
Riding, R. J. & Cheema, I. (1991). Cognitive styles - an overview and integration. Educational
Riding, R. J. & Douglas. G. (1992). Pedormance on, and Attitudes to, Computer Based Training within
Riding, R. J. & Dyer, V. A. (1980). The relationship between extraversion and verbal-imagery learning
Riding, R. J. & Mathias, D. (199 1). Cognitive styles and preferred learning mode, reading attainment and
Riding, R. J. & Sadler-Smith, E. (1992). Type of instructional material, cognitive style and learning
Riding, R. J. & Taylor, E. M. (1976). Imagery performance and prose comprehension in 7-year-old
Tennant, M. (1988). Psychology and Adult Learning. London: Routledge. World Book Encyclopaedia (1988). Chicago: World Book Encyclopaedia.
old children. British Journal of Educational Psychology, 49,297-303.
Psychology, 11, 193-215.
Service Industries. Sheffield: Learning Technologies Unit, Department of Employment.
style in twelve-year-old children. Personality and Individual Differences, 1,273-279.
cognitive ability in 1 1 -year-old children. Educational Psychology, 11,383-393.
performance. Educational Studies, 18,323-340.
children. Educational Studies, 2.21-27.
(Manuscript received 6th July 1992)