the effect of admixtures in concrete containing ... of southern queensland faculty of engineering...
TRANSCRIPT
University of Southern Queensland
Faculty of Engineering and Surveying
The Effect of Admixtures in Concrete Containing Manufactured Sand
A dissertation submitted by
Mark James Krinke
in fulfilment of the requirements of
Courses ENG4111 and ENG 4112 Research Project
towards the degree of
Bachelor of Civil Engineering
Submitted: October 2004
ABSTRACT
This project investigates the effects that varying water cement ratios and superplasticiser
have on concrete containing manufactured sand as a complete replacement for natural
sand. Due to current levels of construction in Australia there is an ever decreasing
availability of natural sands suitable for use as a fine aggregate in concrete. Manufactured
sands which are a by-product of rock crushing operations offer a viable solution to the
declining availability of natural sands. However there are a number of drawbacks to the
use of manufactured sand, particularly the poor workability and finish obtained. This is
caused by the High fines content (<75 microns) and the irregular particle shape of the
manufactured sand. For these reasons manufactured sand has a very poor reputation in
the construction industry.
An experimental approach has been taken to study the effect of the varying water cement
ratios and the effect of the superplasticiser. This has be done by making a number of
concrete mixes each with either a different water cement ratio or amount of
superplasticiser added to the mix. The properties of these concrete mixes have been
assessed by measuring both the fresh and hardened state properties of the concrete mix.
The results of the tests have shown that a reasonable workability and a medium strength
can be achieved with a high water cement ratio in a concrete mix. The addition of a
superplasticiser to a concrete mix allows the mix to achieve a high strength while also
having a good workability.
University of Southern Queensland
Faculty of Engineering and Surveying
Limitations of Use
The Council of the University of Southern Queensland, its Faculty of Engineering and
Surveying, and the staff of the University of Southern Queensland, do not accept any
responsibility for the truth, accuracy or completeness of material contained within or
associated with this dissertation.
Persons using all or any part of this material do so at their own risk, and not at the risk of
the Council of the University of Southern Queensland, its Faculty of Engineering and
Surveying or the staff of the University of Southern Queensland.
This dissertation reports an educational exercise and has no purpose or validity beyond
this exercise. The sole purpose of the course pair entitled “Research Project” is to
contribute to the overall education within the student’s chosen degree program. This
document, the associated hardware, software, drawings, and other material set out in the
associated appendices should not be used for any other purpose: if they are so used, it is
entirely at the risk of the user.
Prof G Baker
Dean
Faculty of Engineering and Surveying
ENG4111/2 Research Project
Certification
I certify that the ideas, designs and experimental work, results, analyses and conclusions
set out in this dissertation are entirely my own effort, except where otherwise indicated
and acknowledged.
I further certify that the work is original and has not been previously submitted for
assessment in any other course or institution, except where specifically stated.
Mark James Krinke
0011215007
Signature Date

Acknowledgements I would like to thank the faculty of Engineering and Surveying for sponsoring my project
and making it possible. I would also like to thank Dr Thiru Aravinthian for his expert
guidance and assistance throughout this project. Without which this project would not
have been possible.
I would like to thank the technical staff at the USQ concrete Lab, Mr Glen Bartkowski
and Mr Bernard Black for their guidance and assistance during the testing phase of this
project.
I would also like to thank my family and friends for their support and motivation
provided throughout this project.
Table of Contents
CERTIFICATION.......................................................................................................... IV
ACKNOWLEDGEMENTS ............................................................................................ V
LIST OF FIGURES .....................................................................................................VIII
LIST OF TABLES .......................................................................................................... IX
CHAPTER 1
INTRODUCTION............................................................................................................. 1
1.1 BACKGROUND INFORMATION..................................................................................... 1
1.1.1 History of Concrete............................................................................................ 1
1.1.2 Aggregates ......................................................................................................... 2
1.1.3 Manufactured Sands .......................................................................................... 3
1.2 AIMS OF THIS PROJECT ............................................................................................... 3
1.3 OVERVIEW OF THIS DISSERTATION ............................................................................ 5
CHAPTER 2
LITERATURE REVIEW ................................................................................................ 6
2.1 MANUFACTURED SANDS............................................................................................ 6
2.2 ADMIXTURES ............................................................................................................. 9
CHAPTER 3
EXPERIMENTAL METHODOLOGY........................................................................ 12
3.1 AGGREGATES ........................................................................................................... 13
3.2 CONCRETE MIX DESIGN........................................................................................... 14
3.3 FRESH CONCRETE PROPERTIES ................................................................................ 16
3.4 HARDENED CONCRETE PROPERTIES......................................................................... 18
3.4.1 Compressive Strength ...................................................................................... 18
3.4.2 Tensile Properties ............................................................................................ 19
CHAPTER 4
RESULTS ANALYSIS ................................................................................................... 21
4.1 AGGREGATE ANALYSIS............................................................................................ 21
4.2 FRESH CONCRETE PROPERTIES ................................................................................ 22
4.3 HARDENED PROPERTIES........................................................................................... 29
4.3.1 Compressive test results................................................................................... 29
4.3.2 Tensile Properties ............................................................................................ 37
CHAPTER 5
ECONOMIC ANALYSIS AND RECOMMENDATIONS......................................... 40
5.1 ECONOMIC ANALYSIS .............................................................................................. 40
5.2 RECOMMENDATIONS ................................................................................................ 42
CHAPTER 6
CONCLUSIONS ............................................................................................................. 43
6.1 CONCLUSIONS FROM ANALYSIS ............................................................................... 43
6.2 FURTHER RESEARCH................................................................................................ 44
APPENDIX A.................................................................................................................. 45
PROJECT SPECIFICATION ................................................................................................ 45
APPENDIX B .................................................................................................................. 48
TEST RESULTS ............................................................................................................... 48
REFERENCES................................................................................................................ 60
BIBLIOGRAPHY........................................................................................................... 61
List of Figures
Figure 2.1: Effect of surface active agent on cement particle floc, Source:
Cement Admixtures Association .................................................................. 10
Figure 2.2: Repulsion of air bubble by surface Active Agent, Source: Cement
Admixtures Association................................................................................ 11
Figure 3.1 Comparison of Manufactured Sand (right) and Natural sand (left)
....................................................................................................................... 14
Figure 3.2 Slump Test................................................................................... 17
Figure 3.3: Compacting Factor Apparatus.................................................... 17
Figure 3.3: Compression cylinder capped and ready to be tested................. 18
Figure 3.4: Indirect Tensile Test................................................................... 20
Figure 4.1: Effect of Water Cement Ratio on Slump.................................... 24
Figure 4.2: Effect of Superplasticiser on Slump........................................... 25
Figure 4.3 Comparison of surface finishes ................................................... 26
Figure 4.4: Effect of Water Cement Ratio on Vebe test results.................... 27
Figure 4.5: Effect of Superplasticiser on Vebe test results........................... 28
Figure 4.6: Comparison of Strength verse Time for Varying Water Cement
Ratios ............................................................................................................ 30
Figure 4.7: Comparison of percentage strength gained verse time for varying
water cement ratios. ...................................................................................... 31
Figure 4.8: Compressive Strength verse’s Compacting Factor .................... 33
Figure 4.9: Effect of superplasticiser on compressive strength .................... 34
Figure 4.10: Comparison of Strength Verse Time for Varying Percentages of
Superplasticiser ............................................................................................. 35
Figure 4.11: Summary of Rate of Strength Gain for Mixes Containing
Superplasticiser ............................................................................................. 36
Figure 4.12: Effect of water Cement ratio on Indirect Tensile Strength ...... 38
Figure 4.13: Effect of superplasticiser on indirect tensile strength. ............. 39
Figure 5.1: Comparison of Cost for Each Trial Mix..................................... 41
List of Tables
Table 3.2: Target Grading............................................................................. 15
Table 3.3: Summary of Trial Mixes.............................................................. 16
Table 4.2: Summary of Fresh Concrete Properties....................................... 22
Table 4.3: Summary of Compression Tests.................................................. 29
Table 4.4: Summary Compacting Factor Results and Compressive Strengths
....................................................................................................................... 32
Table 4.5: Summary of Indirect Tensile Strength Tests ............................... 37
Table 5.1: Summary of Costs for Materials Used......................................... 40
Figure 5.1: Comparison of Cost for Each Trial Mix..................................... 41
Table B.1: Summary of Tested Fresh Properties .......................................... 49
Table B.2: Summary of Compression Cylinders Tested, Mix 1.................. 50
Table B.3: Summary of Compression Cylinders Tested, Mix 2................... 51
Table B.4: Summary of Compression Cylinders Tested, Mix 3................... 52
Table B.5: Summary of Compression Cylinders Tested, Mix 4................... 53
Table B.6: Summary of Compression Cylinders Tested, Mix 5................... 54
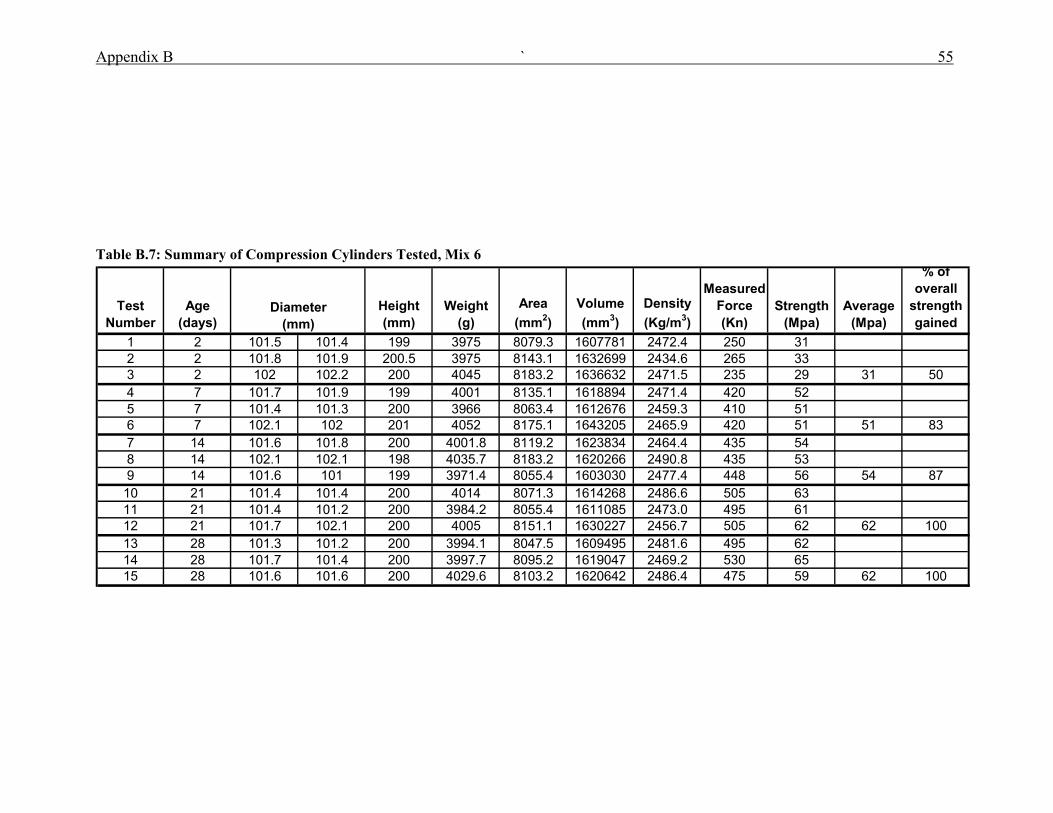
Table B.7: Summary of Compression Cylinders Tested, Mix 6................... 55
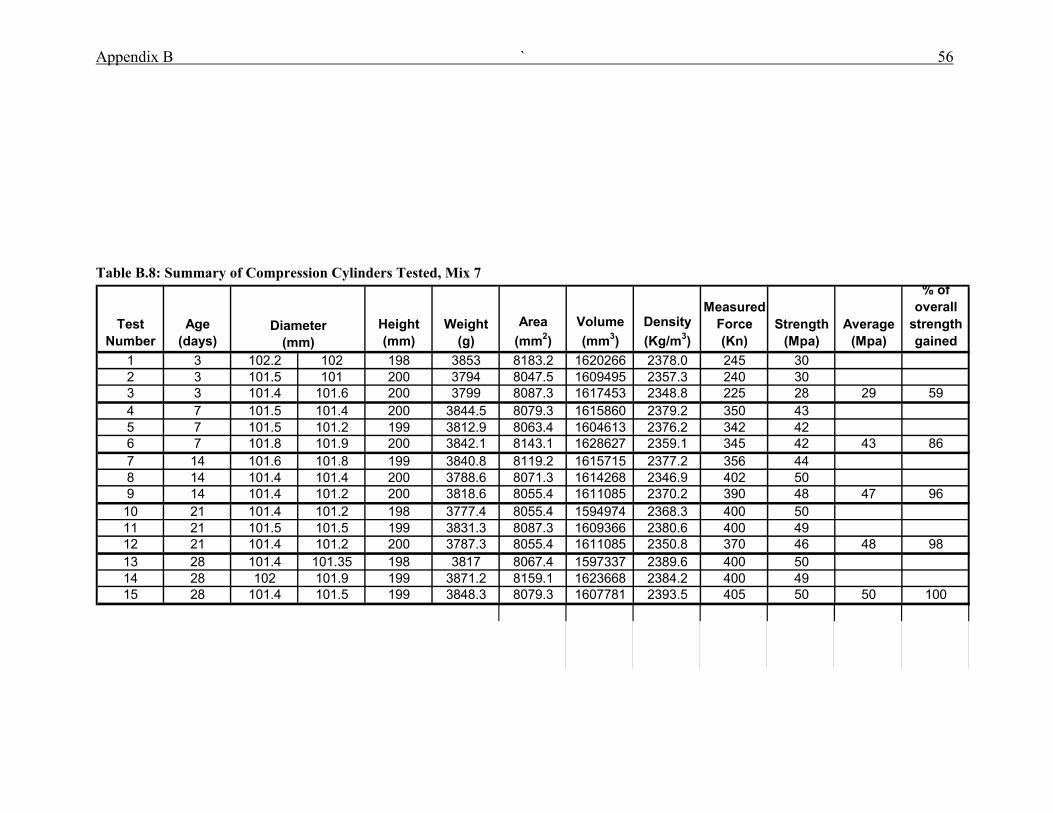
Table B.8: Summary of Compression Cylinders Tested, Mix 7................... 56
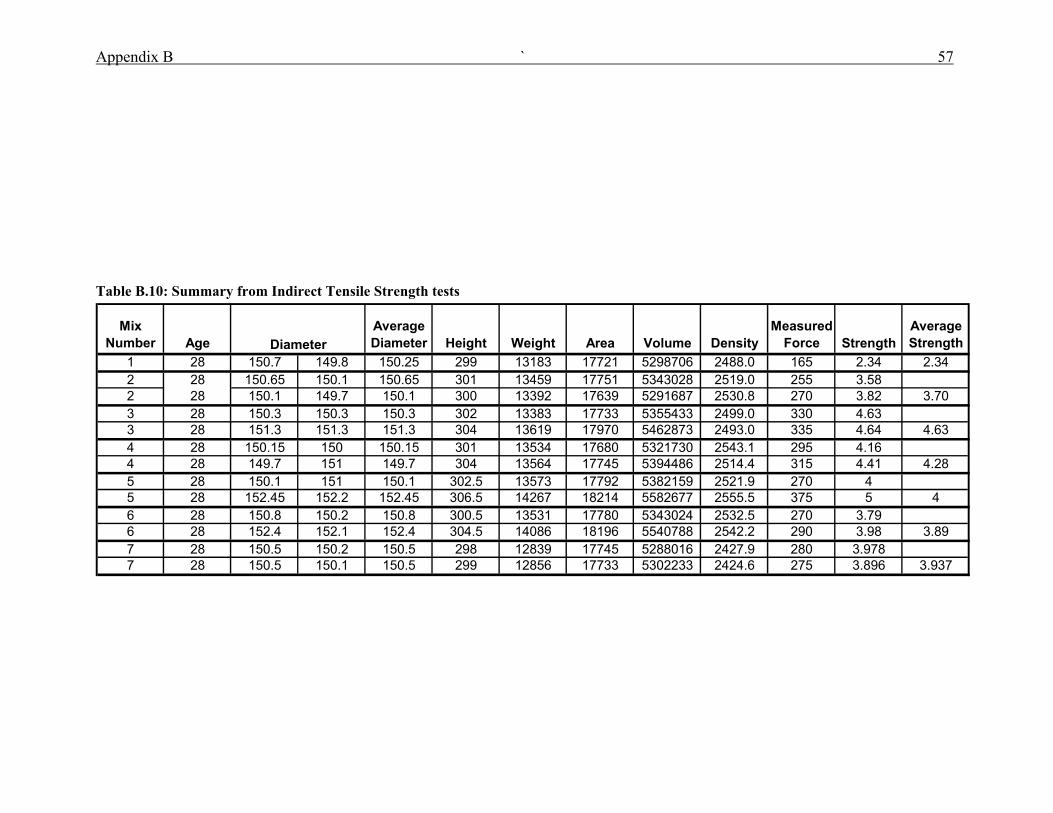
Table B.10: Summary from Indirect Tensile Strength tests ......................... 57
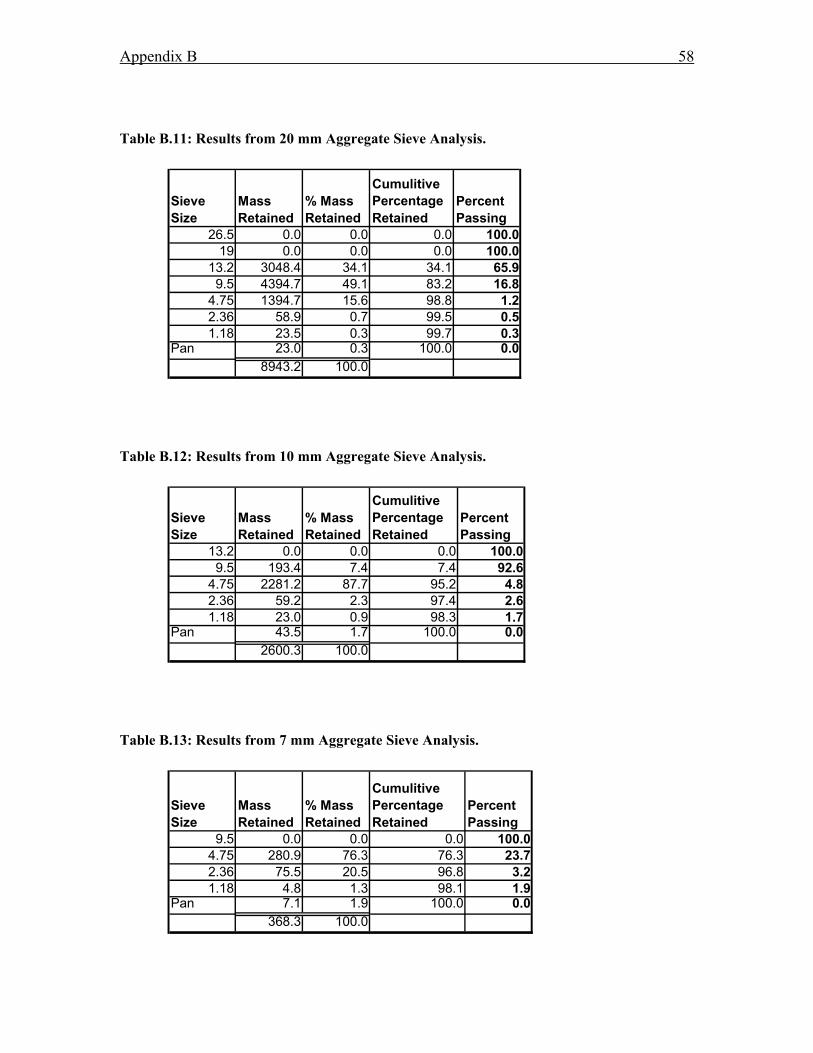
Table B.11: Results from 20 mm Aggregate Sieve Analysis. ...................... 58
Table B.12: Results from 10 mm Aggregate Sieve Analysis. ...................... 58
Table B.13: Results from 7 mm Aggregate Sieve Analysis. ........................ 58
Table B.14: Results from Manufactured Sand Aggregate Sieve Analysis. .. 59
Table B.15: Results from Natural Sand Aggregate Sieve Analysis.............. 59
Chapter 1 – Introduction 1
Chapter 1 Introduction
1.1 Background Information
1.1.1 History of Concrete Concrete has been around for many centuries, the first known use of a material
resembling concrete was by the Minoan civilization around 2000 BC. During the early
stages of the Roman Empire around 300 BC the Romans discovered that mixing a sandy
volcanic ash with lime mortar created a hard water resistance substance which we now
know as concrete. The predominant type of cement used in modern concrete is Portland
cement, other types of cement available include; Blended cement, which is similar to
Portland cement but may contain materials such as fly ash slag or silica fume; High early
strength cements, which as the name suggests gains strength a lot quicker then Portland
or blended cements; Low heat cements, used when limits are placed on the heat of
hydration of the concrete; Shrinkage limited cements; Sulphate resisting cements;
Coloured cements; Masonry cement.
Portland cement is made by mixing calcium carbonate commonly found in limestone or
chalk and silica, alumina and iron oxide found in clay or shale. The two ingredients are
ground and mixed together in either a dry or wet state depending on the characteristics of
the rocks being used. The mix is then placed in a kiln at temperatures as high as 1400
degrees Celsius, at this temperature the two rocks fuse together to form clinker. The
clinker is allowed to cool and gypsum is added at around 1 – 5 percent. The mix is then
Chapter 1 – Introduction 2
ground to the required fineness and distributed to concrete batch plants. Portland cement
derives its name from the Portland limestone because of the close resemblance of the
finished concrete to the Portland Limestone.
Concrete is one of the most popular materials for construction owing to the fact that it can
be cast into just about any shape, it has good compressive strengths, is readily available
just about anywhere and is relatively cheap in comparison to other materials available for
construction, such as steel or fibre composites. Concrete is made from a mixture of
cement powder coarse and fine aggregates, normally sand and crushed rock and water. It
can be either mixed in a hand mixer or by a large batch plant
1.1.2 Aggregates Aggregates were first considered to simply be a filler for concrete to reduce the amount
of cement required. However it is now known that the type of Aggregate used for
concrete can have considerable effects on the plastic and hardened state properties of
concrete. Aggregates can form up to 80% of the concrete mix so there properties are
crucial to the properties of the concrete. Aggregates can be broadly classified into four
different categories, they are heavy weight, normal weight, light weight and ultra-light
weight aggregates. However in most concrete practices only normal weight and light
weight aggregates are used. The other types of aggregates are for specialist uses, such as
nuclear radiation shielding for heavy weight concrete and thermal insulation for light
weight concrete.
Types of aggregates commonly used include natural sands and gravels, crushed rocks and
manufactured aggregates. Natural sands and gravels are normally sourced from stream
beds, dunes, alluvial deposits or marine deposits. Crushed rocks have an advantage over
other aggregates in that their size may be specified by using different size screens when
the rocks are crushed. Rock types used for crushed aggregates include igneous rocks such
as basalt, diorite and granite; Sedimentary rocks normally used as aggregates are lime
stone but occasionally some sandstone is used; and metamorphic rocks are rarely used
due to the highly variable nature of the mineral composition of these rocks.
Chapter 1 – Introduction 3
1.1.3 Manufactured Sands Due to the increased levels of construction expected in Australia in the forthcoming years
it is expected that fine aggregate suitable for use in concrete will become scarce or
uneconomical to produce. With the expected shortfall in natural sands manufactured
sands offer a viable alternative to natural sand, if the problems associated with the use of
manufactured sands can be resolved and its poor reputation in the industry overcome.
Manufactured sands are made by crushing aggregate to a size appropriate for use as a fine
aggregate (<2.36mm). The crushing process however generates large amounts of
materials <75microns as well as causing the manufactured sand to have an irregular
particle shape. These fine particles and irregular shape of the aggregate have detrimental
effects on the workability and finish of the concrete. These negative effects have given
manufactured sands a poor reputation in the construction industry. However recent
studies show that these fine particles may be able to be utilized to increase the
compressive and flexural strengths of concrete.
1.2 Aims of this project
Manufactured sand offers a viable solution to the decreasing availability of natural sand.
However, before manufactured sand can be widely used there are a few problems which
need to be overcome. The first problem that needs to be overcome is the poor workability
of manufactured sand. When this problem has been overcome then it will go along way to
giving manufactured sand a better reputation in the construction industry. The aim of this
project is to study the effects that varying amounts of admixtures have on concrete
containing manufactured sand instead of natural sand. Hopefully the results of the project
will show that a concrete mix containing manufactured sand and no natural sand can
achieve a high strength and a good workability through the use of a superplasticiser.
Chapter 1 – Introduction 4
The main aims of this project are:
1. Determine the workability, the overall strength, as well as the rate of strength gain
for varying water cement ratios of concrete containing manufactured sand.
Compare the results of the manufactured sand concrete to a conventional mix
containing natural sand.
2. From the data collected in the previous objective choose a water cement ratio with
poor workability and determine the required amount of superplasticiser to achieve
a good workability. Also determine the overall strength, as well as the rate of
strength gain of the concrete after the addition of a super-plasticiser
3. Conduct a cost analysis of all mixes and compare the costs of a mix containing
manufactured sand to the cost of a control mix.
If time permits
4. Determine flexural strength and young’s modulus of concrete containing
manufactured sand, and compare to the flexural strength and young’s modulus of
a control mix
5. Determine the rate of strength gain for concrete containing a combination of
manufactured sand and natural sand and the effect that the addition of a
superplasticiser has on the workability.
Chapter 1 – Introduction 5
1.3 Overview of this Dissertation Chapter1: Provides some background information on manufactured sand and the use of
admixtures in concrete, as well as the main objectives of this project.
Chapter 2: Reviews available literature on the use of manufactured sand and the different
types of admixtures and how they work.
Chapter3: Discusses the adopted experimental procedures used in order to gain the
required data.
Chapter 4: Analyses the results obtained from gathered data.
Chapter 5: Compares the cost of the different concrete mixes and any recommendations.
Chapter 6: Contains conclusions obtained from tests carried out, and any comments on
any further work which may need to be done on manufactured sand concrete mixes.
Chapter 1 – Introduction 6
Chapter 2
Literature Review
2.1 Manufactured Sands
Corrigan D’Sourza & Dumitru (n.d) reported that there are two major aspects that should
be considered in the characterisation of manufactured sands:
Manufactured sand has to be produced and engineered for the specific purpose of
producing fine aggregate for concrete or asphalt industries, utilising technologies
fit for the purpose.
Research work has indicated that there is a possibility of utilizing a large
proportion of 75-micron fines in the concrete if the fines are processed and
applied in the correct fashion. Also recent work carried out in the USA by the
International Centre for Aggregate Research show that in excess of 15% of 75
microns in the fine aggregate may be suitable in concrete, providing that the
crushed fine aggregate is produced from a well known quarry source.
The Cement and Concrete Association of Australia’s (CCAA) guide to Concrete
Construction (2002), states that the shape and texture of aggregate particles has an
important influence on the workability of freshly mixed concrete, and hence may effect
the water demand and the water cement ratio.
Chapter 2 – Literature Review 7
The use of manufactured sands in concrete causes the concrete to have very poor
workability. This is caused by the irregular particle shape of the manufactured sands. The
water required for a given degree of workability (slump) is directly related to the void
space in the aggregate. When the void space is high, the water requirement necessary for
a given workability will also be high. And the strength of the concrete will also be low
unless additional cement is added. The void content of manufactured sand is generally
higher then that of natural sand (Hudson 1999).
The higher fines content of manufactured sand has significant effects on the workability
and the strength of concrete. The CCAA’s Guide to concrete construction states that
aggregate combinations with excessive amounts of sand or excessively fine sands may
produce uneconomical concretes because of the larger surface area of the finer particles.
Hudson (1999) reported that “...Concrete manufactured with a high percentage of minus
75 micron material will yield a more cohesive mix then concrete made with typical
natural sand. Hudson also reported that although the compressive strength and the
workability may be superior to natural sand, the finish of the concrete containing
manufactured sand is still a major draw back to its use.
In order to overcome the negative impacts that manufactured sand has on the workability
plasticisers may be used to improve the workability and finish of concrete mixes.
Corrigan D’Sourza & Dumitru’s (n.d) report into the use of a New Generation Admixture
for Improvement of Concrete with manufactured sands concluded that through the use of
a medium-range water reducing admixtures, incorporating Polycarboxyate technology, a
harsh concrete mix was made more workable, cohesive and easier to place and finish.
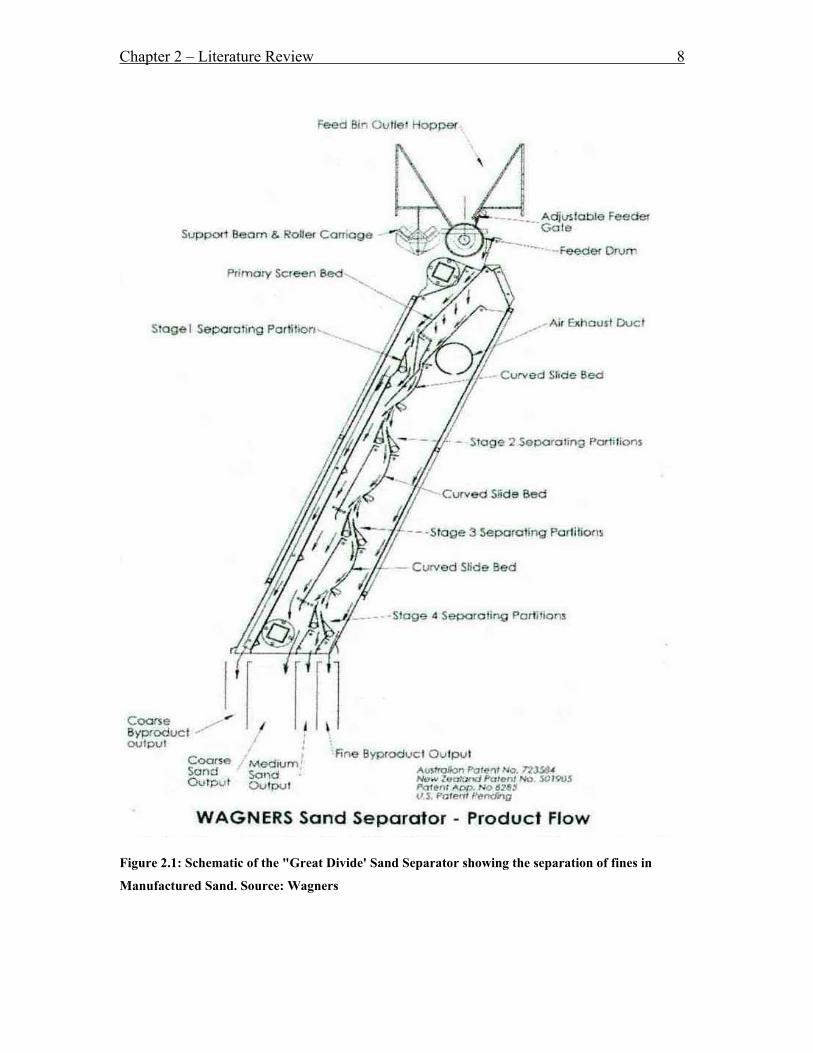
The manufactured sand to be used in this project has been sourced from Wagners and is
made using the patented ‘Great Divide' Sand Separator. This machine seen in figure 2.1 is
designed to greatly reduce the amount of fines (< 75microns) present in the manufactured
sand
Chapter 2 – Literature Review 8
Figure 2.1: Schematic of the "Great Divide' Sand Separator showing the separation of fines in
Manufactured Sand. Source: Wagners
Chapter 2 – Literature Review 9
2.2 Admixtures
Admixtures are substances which are added to the concrete mix to give it more desirable
properties. Admixtures can be classified into a number of different categories. They are
Air entraining Agents
Accelerating Agents
Retarders
Water Reducing or Plasticisers
Superplasticisers
Bonding Admixtures
Water Repelling Agents
Pigments
Porefillers
Pozzolans
Each of these different admixtures has a different effect on the properties of fresh and
hardened concrete. A superplasticiser will be used in this project because of its ability to
dramatically increase the workability of fresh concrete with minimal effect on the overall
strength of the concrete.
Water reducing plasticiser has a detergent like property which is referred to as a surface
active agent. These substances carry an unbalanced charge of electricity and when put
into water will migrate towards the surface of the water with the electrically charged end
sticking into the water whilst the tale is out of the water.
Chapter 2 – Literature Review 10
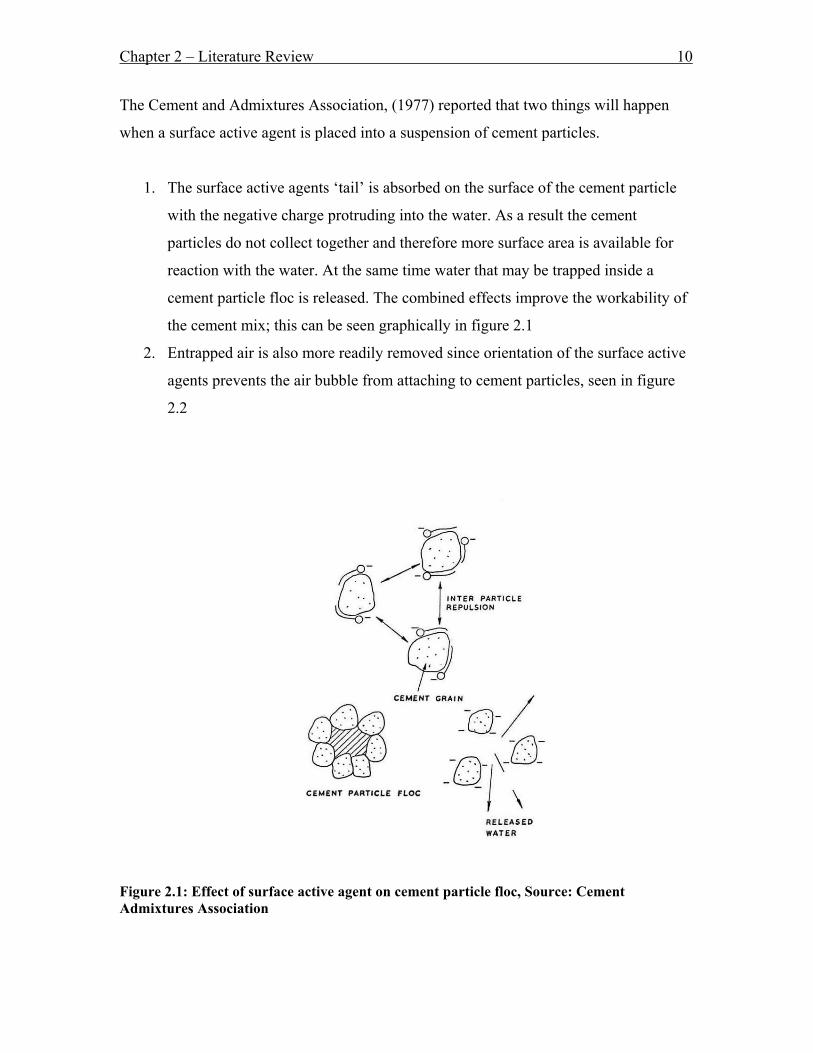
The Cement and Admixtures Association, (1977) reported that two things will happen
when a surface active agent is placed into a suspension of cement particles.
1. The surface active agents ‘tail’ is absorbed on the surface of the cement particle
with the negative charge protruding into the water. As a result the cement
particles do not collect together and therefore more surface area is available for
reaction with the water. At the same time water that may be trapped inside a
cement particle floc is released. The combined effects improve the workability of
the cement mix; this can be seen graphically in figure 2.1
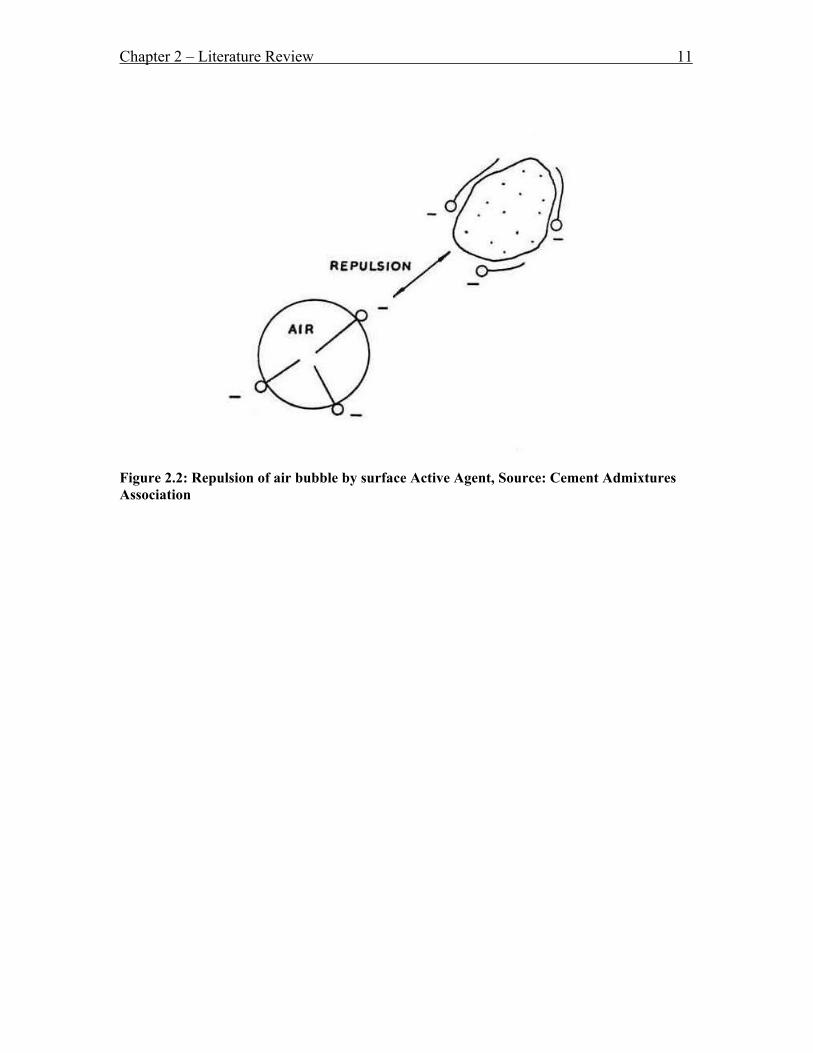
2. Entrapped air is also more readily removed since orientation of the surface active
agents prevents the air bubble from attaching to cement particles, seen in figure
2.2
Figure 2.1: Effect of surface active agent on cement particle floc, Source: Cement Admixtures Association
Chapter 2 – Literature Review 11
Figure 2.2: Repulsion of air bubble by surface Active Agent, Source: Cement Admixtures Association
Chapter 3 - Experimental Methodology 12
Chapter 3
Experimental Methodology
In order to effectively analyse the effects that the manufactured sand has on the fresh and
hardened properties of concrete, a number of different trial mixes have been made. These
trial mixes are varied in water cement ratios and the percentages of plasticiser added to
the concrete mix. The plasticiser chosen for this project was superplasticiser
manufactured by Chemical House; this plasticiser was chosen for us in this project for its
ability to dramatically increase the workability of the fresh concrete mix. The recommend
dosages for the superplasticiser was a range of 0.4 to 1.5 percent for conventional
concrete mixes, however it was expected that for this project larger dosages of plasticiser
would be required to achieve a suitable workability. The main objectives of the trial
batches were to:
Determine if a suitable workability and strength can be achieved in concrete
containing manufactured sand as a complete replacement for natural sand;
Determine what percentage of superplasticiser is required to achieve a suitable
workability for concrete containing manufactured sand;
Determine the impact that the superplasticiser has on the strength of the concrete;
Determine the rate of strength gain for the concrete containing manufactured sand
with and without superplasticiser;
Chapter 3 - Experimental Methodology 13
3.1 Aggregates
To ensure consistency of aggregates all of the aggregates have been sourced from
Wagners in Toowoomba. To ensure a consistent quality and grading so that alterations
were not required for the mix, enough manufactured sand to complete all of the mixes
was sourced at the beginning of the testing phase. The manufactured sand used came
from Wagners Malloo quarry, where the manufactured sand is produced from the by
product of blue metal crushing operations.
In order to design the concrete mix the aggregates properties had to be analysed. In order
to do this a number of tests were carried out on the concrete, they were; sieve analysis,
bulk density, dry density and moisture content. All of the aggregate tests were done in
accordance with AS 1141.
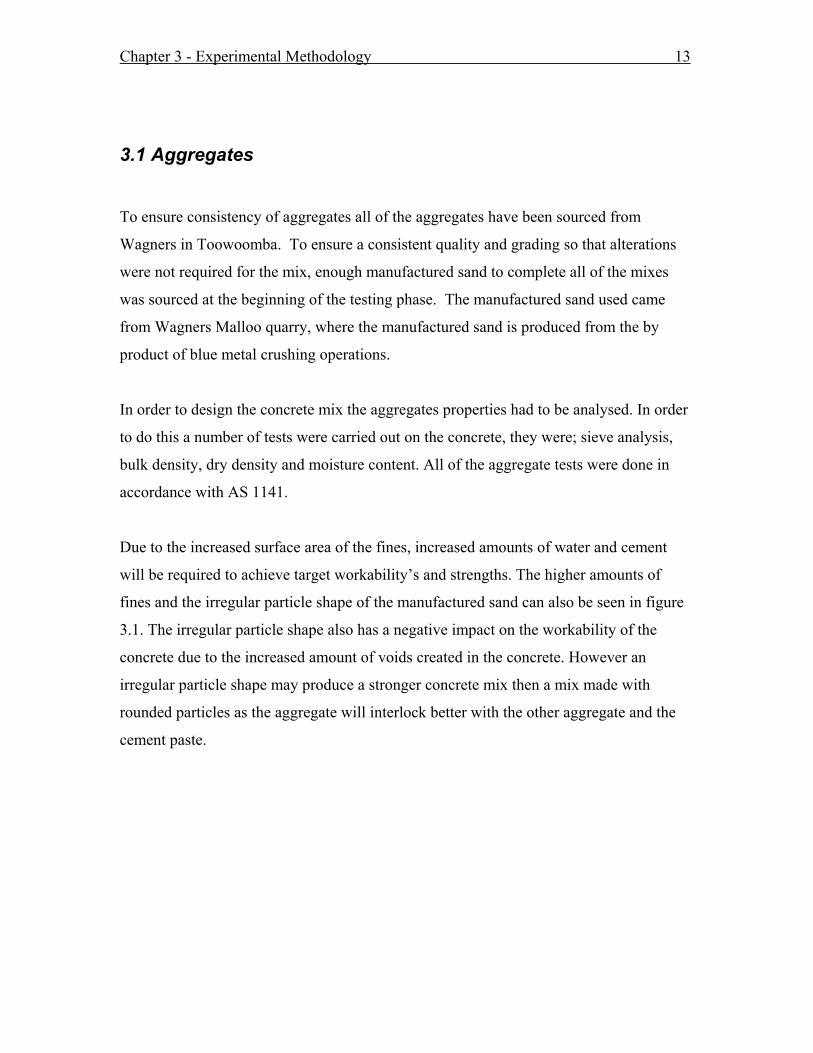
Due to the increased surface area of the fines, increased amounts of water and cement
will be required to achieve target workability’s and strengths. The higher amounts of
fines and the irregular particle shape of the manufactured sand can also be seen in figure
3.1. The irregular particle shape also has a negative impact on the workability of the
concrete due to the increased amount of voids created in the concrete. However an
irregular particle shape may produce a stronger concrete mix then a mix made with
rounded particles as the aggregate will interlock better with the other aggregate and the
cement paste.
Chapter 3 - Experimental Methodology 14
Figure 3.1 Comparison of Manufactured Sand (right) and Natural sand (left)
3.2 Concrete Mix Design
A number of different trial mixes were decided to be assessed; firstly the water cement
ratio of the trial mixes were altered to assess the properties of the concrete containing 100
percent manufactured sand and no plasticiser. Initially it was decided to try and achieve a
medium strength concrete mix around 25 Mpa. From the study guide this gave a target
strength of around 32 Mpa. This target strength corresponded to a water cement ratio of
0.65. After trialling this mix it was discovered that the mix achieved a reasonable
workability without the use of a superplasticiser. In the next mix it was decided to try and
reduce the workability by reducing the water cement ratio to 0.5. This mix had a much
reduced workability than previous but further reduction of the workability was necessary
before the superplasticiser. The next mix trialled had a water cement ratio of 0.4 and
exhibited very poor workability. This mix was adopted as the mix which would be used
for the addition of superplasticiser. This was also adopted as the water cement ratio of the
natural sand control mix.
Chapter 3 - Experimental Methodology 15
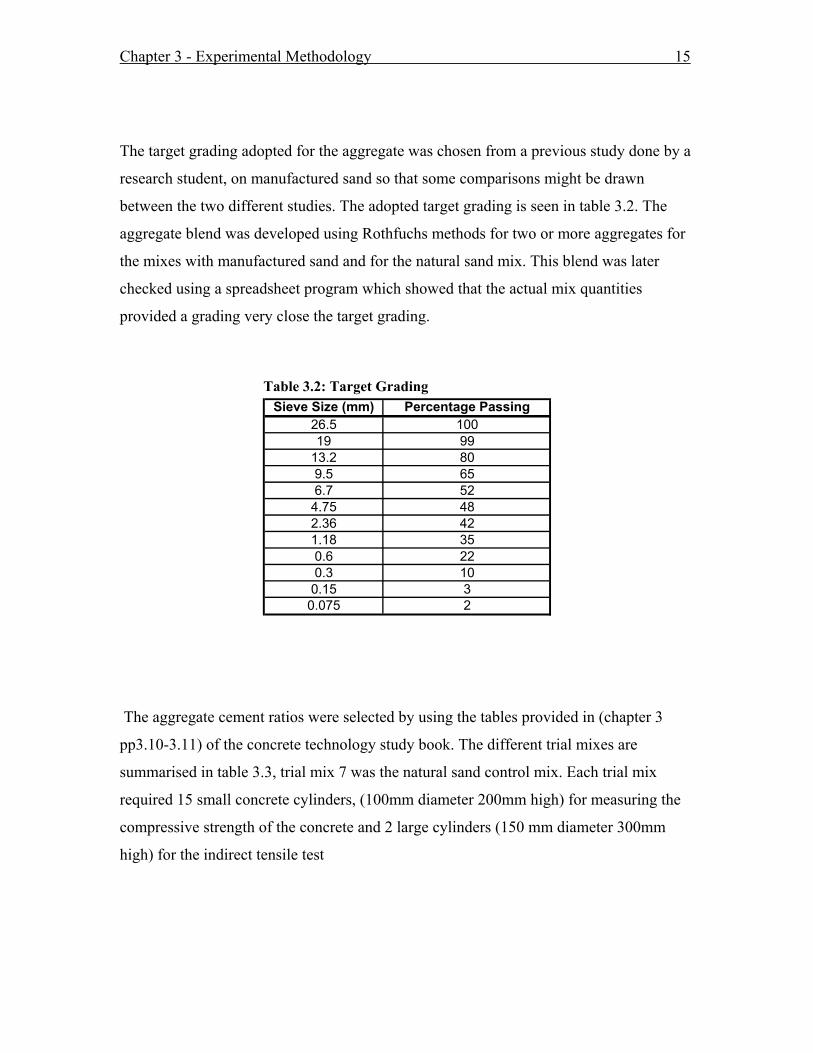
The target grading adopted for the aggregate was chosen from a previous study done by a
research student, on manufactured sand so that some comparisons might be drawn
between the two different studies. The adopted target grading is seen in table 3.2. The
aggregate blend was developed using Rothfuchs methods for two or more aggregates for
the mixes with manufactured sand and for the natural sand mix. This blend was later
checked using a spreadsheet program which showed that the actual mix quantities
provided a grading very close the target grading.
Table 3.2: Target Grading Sieve Size (mm) Percentage Passing
26.5 10019 99
13.2 809.5 656.7 524.75 482.36 421.18 350.6 220.3 100.15 30.075 2
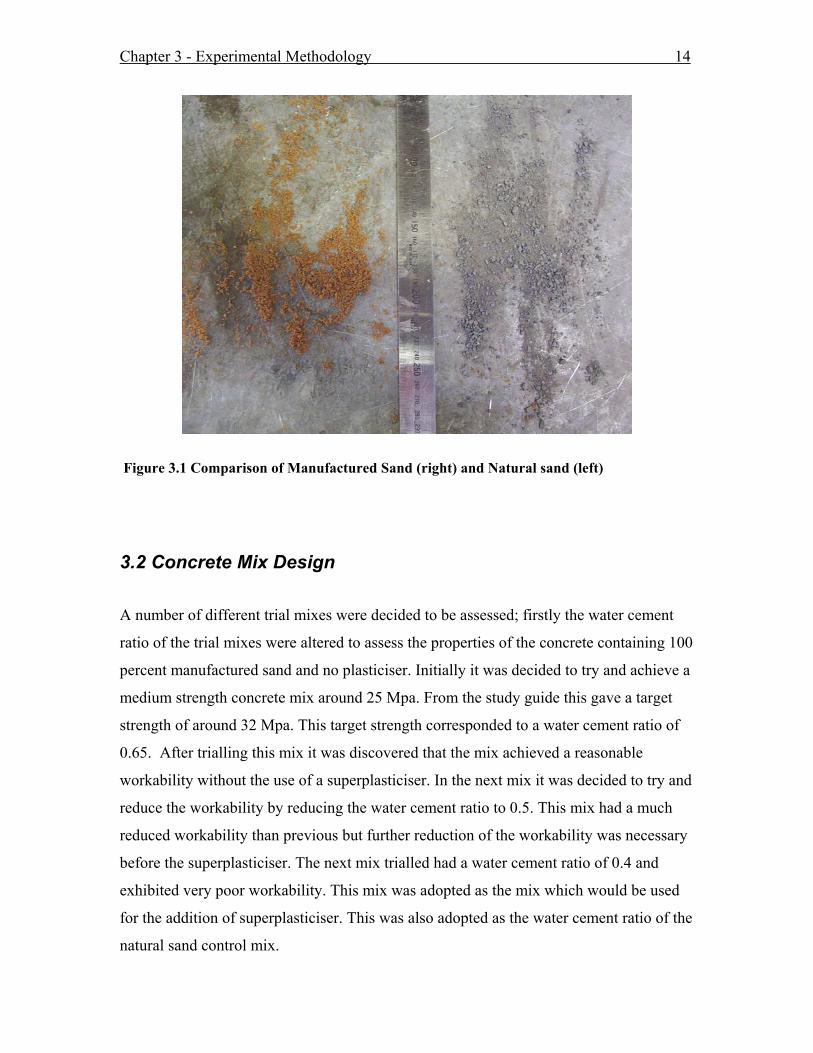
The aggregate cement ratios were selected by using the tables provided in (chapter 3
pp3.10-3.11) of the concrete technology study book. The different trial mixes are
summarised in table 3.3, trial mix 7 was the natural sand control mix. Each trial mix
required 15 small concrete cylinders, (100mm diameter 200mm high) for measuring the
compressive strength of the concrete and 2 large cylinders (150 mm diameter 300mm
high) for the indirect tensile test
Chapter 3 - Experimental Methodology 16
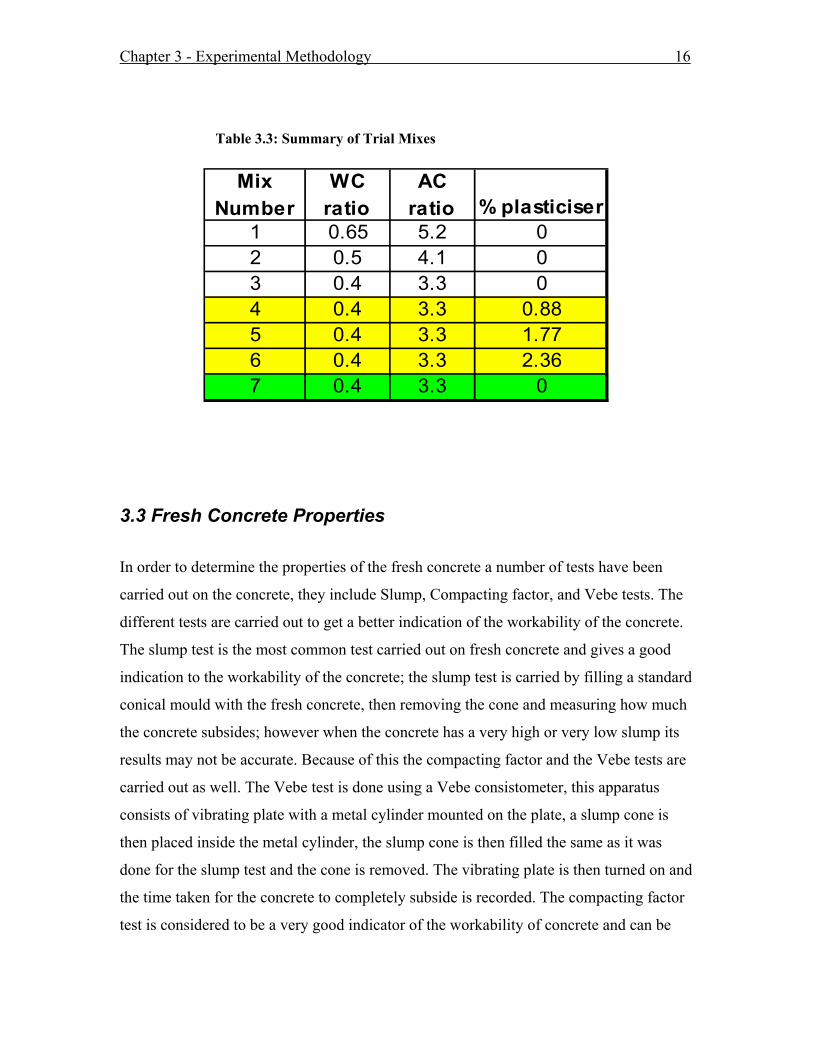
Table 3.3: Summary of Trial Mixes
3.3 Fresh Concrete Properties
In order to determine the properties of the fresh concrete a number of tests have been
carried out on the concrete, they include Slump, Compacting factor, and Vebe tests. The
different tests are carried out to get a better indication of the workability of the concrete.
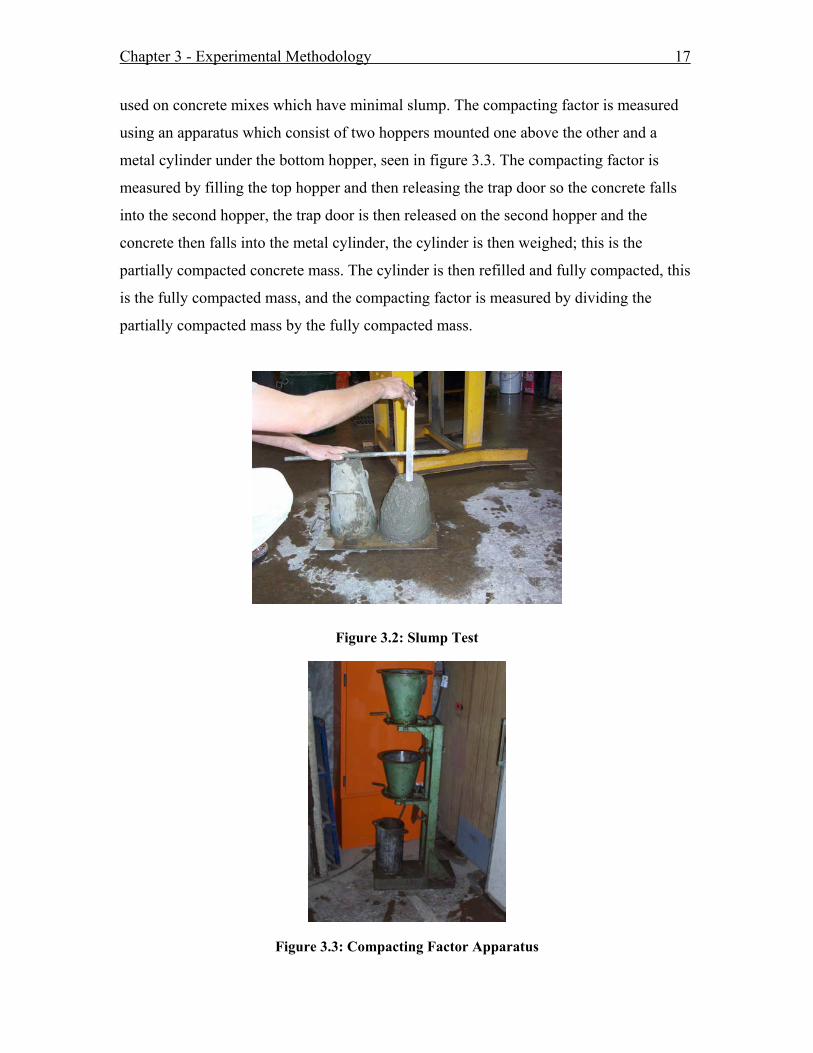
The slump test is the most common test carried out on fresh concrete and gives a good
indication to the workability of the concrete; the slump test is carried by filling a standard
conical mould with the fresh concrete, then removing the cone and measuring how much
the concrete subsides; however when the concrete has a very high or very low slump its
results may not be accurate. Because of this the compacting factor and the Vebe tests are
carried out as well. The Vebe test is done using a Vebe consistometer, this apparatus
consists of vibrating plate with a metal cylinder mounted on the plate, a slump cone is
then placed inside the metal cylinder, the slump cone is then filled the same as it was
done for the slump test and the cone is removed. The vibrating plate is then turned on and
the time taken for the concrete to completely subside is recorded. The compacting factor
test is considered to be a very good indicator of the workability of concrete and can be
1 0.65 5.2 02 0.5 4.1 03 0.4 3.3 04 0.4 3.3 0.885 0.4 3.3 1.776 0.4 3.3 2.367 0.4 3.3 0
Mix Number
WC ratio
AC ratio % plasticiser
Chapter 3 - Experimental Methodology 17
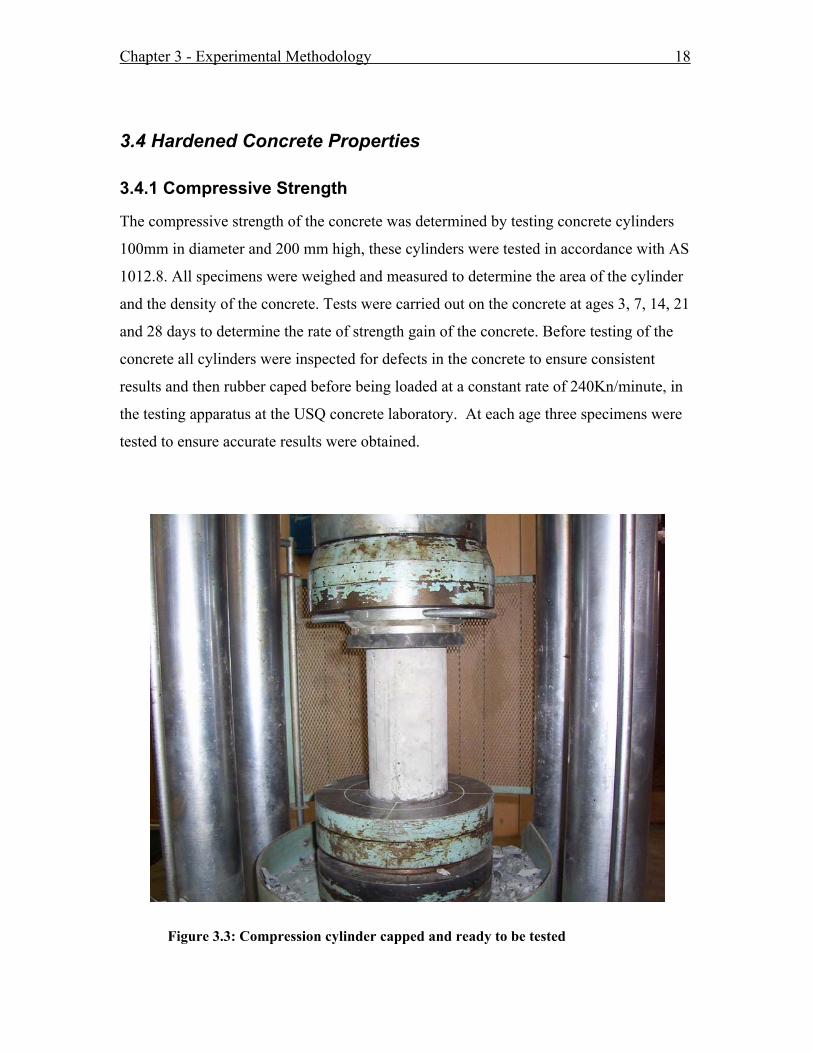
used on concrete mixes which have minimal slump. The compacting factor is measured
using an apparatus which consist of two hoppers mounted one above the other and a
metal cylinder under the bottom hopper, seen in figure 3.3. The compacting factor is
measured by filling the top hopper and then releasing the trap door so the concrete falls
into the second hopper, the trap door is then released on the second hopper and the
concrete then falls into the metal cylinder, the cylinder is then weighed; this is the
partially compacted concrete mass. The cylinder is then refilled and fully compacted, this
is the fully compacted mass, and the compacting factor is measured by dividing the
partially compacted mass by the fully compacted mass.
Figure 3.2: Slump Test
Figure 3.3: Compacting Factor Apparatus
Chapter 3 - Experimental Methodology 18
3.4 Hardened Concrete Properties
3.4.1 Compressive Strength
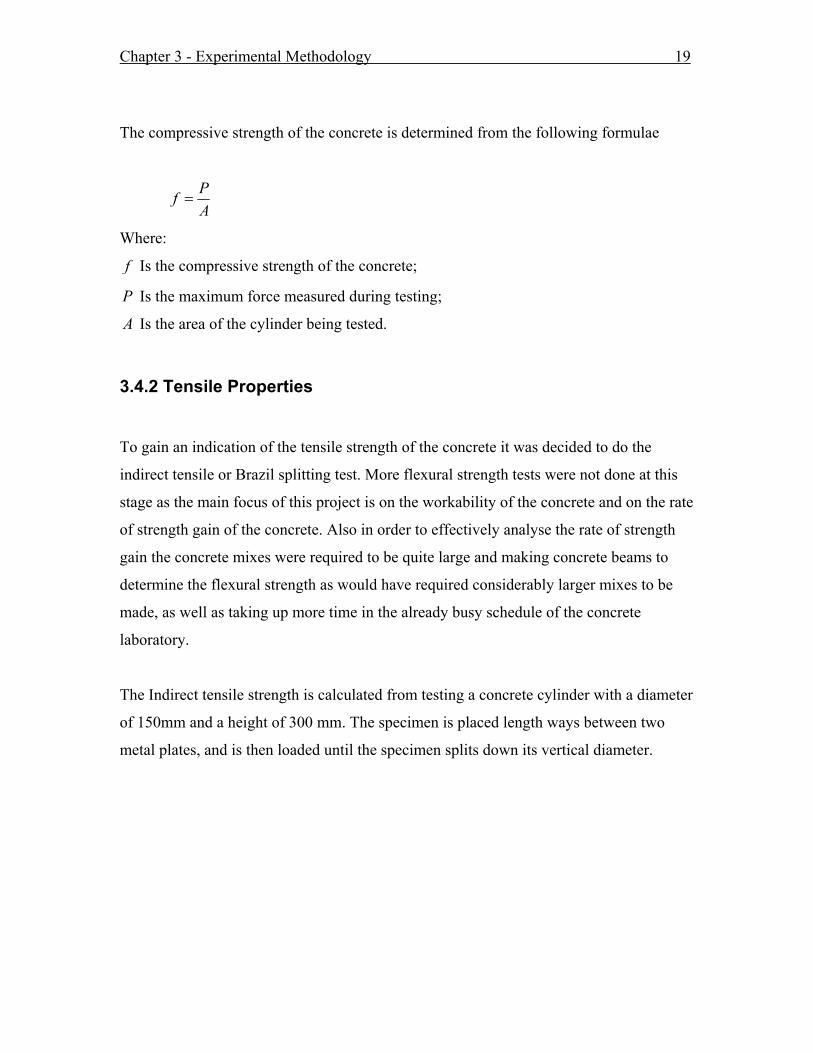
The compressive strength of the concrete was determined by testing concrete cylinders
100mm in diameter and 200 mm high, these cylinders were tested in accordance with AS
1012.8. All specimens were weighed and measured to determine the area of the cylinder
and the density of the concrete. Tests were carried out on the concrete at ages 3, 7, 14, 21
and 28 days to determine the rate of strength gain of the concrete. Before testing of the
concrete all cylinders were inspected for defects in the concrete to ensure consistent
results and then rubber caped before being loaded at a constant rate of 240Kn/minute, in
the testing apparatus at the USQ concrete laboratory. At each age three specimens were
tested to ensure accurate results were obtained.
Figure 3.3: Compression cylinder capped and ready to be tested
Chapter 3 - Experimental Methodology 19
The compressive strength of the concrete is determined from the following formulae
PfA
=
Where:
f Is the compressive strength of the concrete;
P Is the maximum force measured during testing;
A Is the area of the cylinder being tested.
3.4.2 Tensile Properties
To gain an indication of the tensile strength of the concrete it was decided to do the
indirect tensile or Brazil splitting test. More flexural strength tests were not done at this
stage as the main focus of this project is on the workability of the concrete and on the rate
of strength gain of the concrete. Also in order to effectively analyse the rate of strength
gain the concrete mixes were required to be quite large and making concrete beams to
determine the flexural strength as would have required considerably larger mixes to be
made, as well as taking up more time in the already busy schedule of the concrete
laboratory.
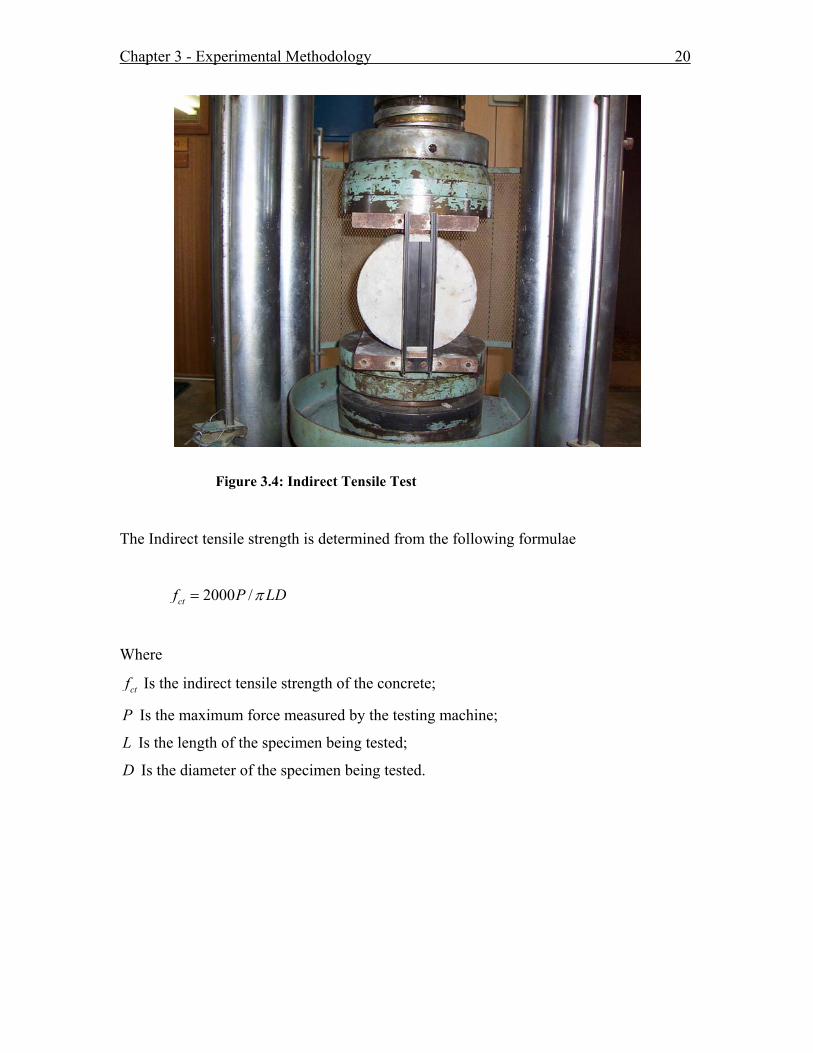
The Indirect tensile strength is calculated from testing a concrete cylinder with a diameter
of 150mm and a height of 300 mm. The specimen is placed length ways between two
metal plates, and is then loaded until the specimen splits down its vertical diameter.
Chapter 3 - Experimental Methodology 20
Figure 3.4: Indirect Tensile Test
The Indirect tensile strength is determined from the following formulae
2000 /ctf P LDπ=
Where
ctf Is the indirect tensile strength of the concrete;
P Is the maximum force measured by the testing machine;
L Is the length of the specimen being tested;
D Is the diameter of the specimen being tested.
Chapter 4 - Results Analysis 21
Chapter 4
Results Analysis As discussed earlier in chapter 3 the main objectives of this project were to
Determine if a suitable workability and strength can be achieved in concrete
containing manufactured sand as a complete replacement for natural sand;
Determine what percentage of superplasticiser is required to achieve a suitable
workability for concrete containing manufactured sand;
Determine the impact that the superplasticiser has on the strength of the concrete;
Determine the rate of strength gain for the concrete containing manufactured sand
with and without superplasticiser.
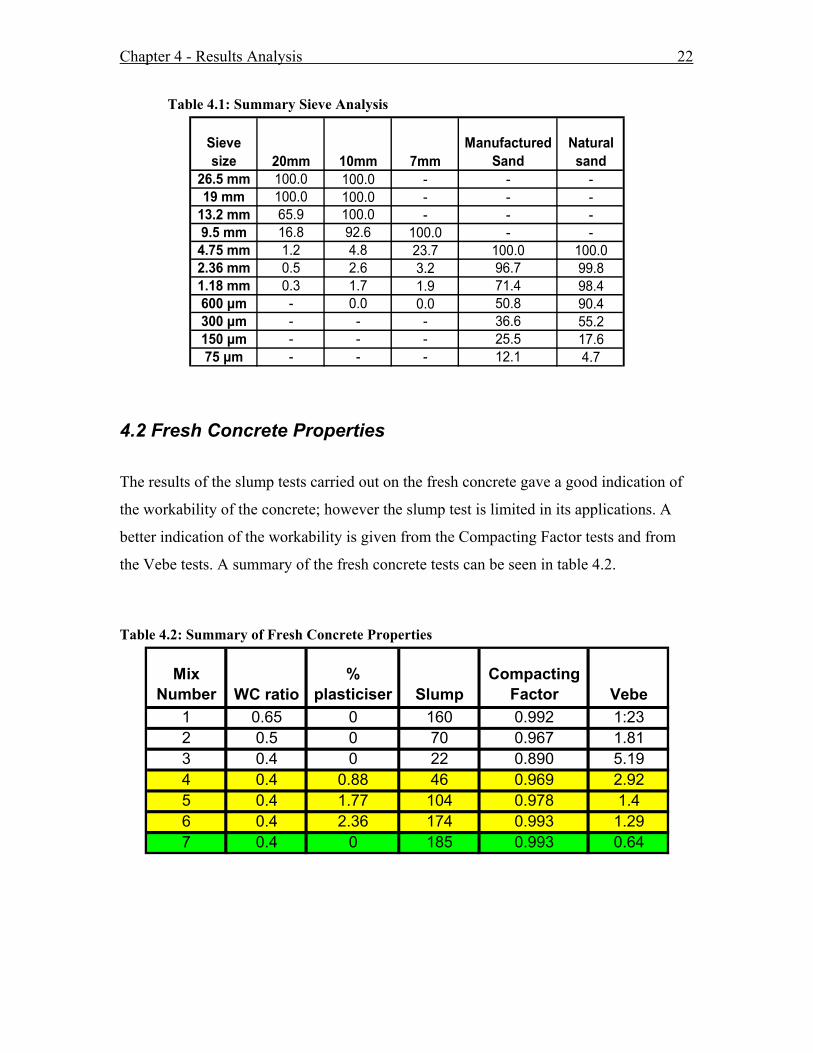
4.1 Aggregate Analysis
The results of the sieve analysis as expected showed that manufactured sand has
considerably larger amount of fine material then the natural sand. The grading of the
natural sand and the manufactured sand are extremely dissimilar and for this reason the
aggregate blend for the natural sand mix will be different to the aggregate blend for the
manufactured sand mix. The results from the sieve analysis for all of the aggregates used
in the concrete mixes for this project can be seen in table 4.1.
Chapter 4 - Results Analysis 22
Table 4.1: Summary Sieve Analysis
Sieve size 20mm 10mm 7mm
Manufactured Sand
Natural sand
26.5 mm 100.0 100.0 - - -19 mm 100.0 100.0 - - -
13.2 mm 65.9 100.0 - - -9.5 mm 16.8 92.6 100.0 - -4.75 mm 1.2 4.8 23.7 100.0 100.02.36 mm 0.5 2.6 3.2 96.7 99.81.18 mm 0.3 1.7 1.9 71.4 98.4600 µm - 0.0 0.0 50.8 90.4300 µm - - - 36.6 55.2150 µm - - - 25.5 17.675 µm - - - 12.1 4.7
4.2 Fresh Concrete Properties
The results of the slump tests carried out on the fresh concrete gave a good indication of
the workability of the concrete; however the slump test is limited in its applications. A
better indication of the workability is given from the Compacting Factor tests and from
the Vebe tests. A summary of the fresh concrete tests can be seen in table 4.2.
Table 4.2: Summary of Fresh Concrete Properties
Mix Number WC ratio
% plasticiser Slump
Compacting Factor Vebe
1 0.65 0 160 0.992 1:232 0.5 0 70 0.967 1.813 0.4 0 22 0.890 5.194 0.4 0.88 46 0.969 2.925 0.4 1.77 104 0.978 1.46 0.4 2.36 174 0.993 1.297 0.4 0 185 0.993 0.64
Chapter 4 - Results Analysis 23
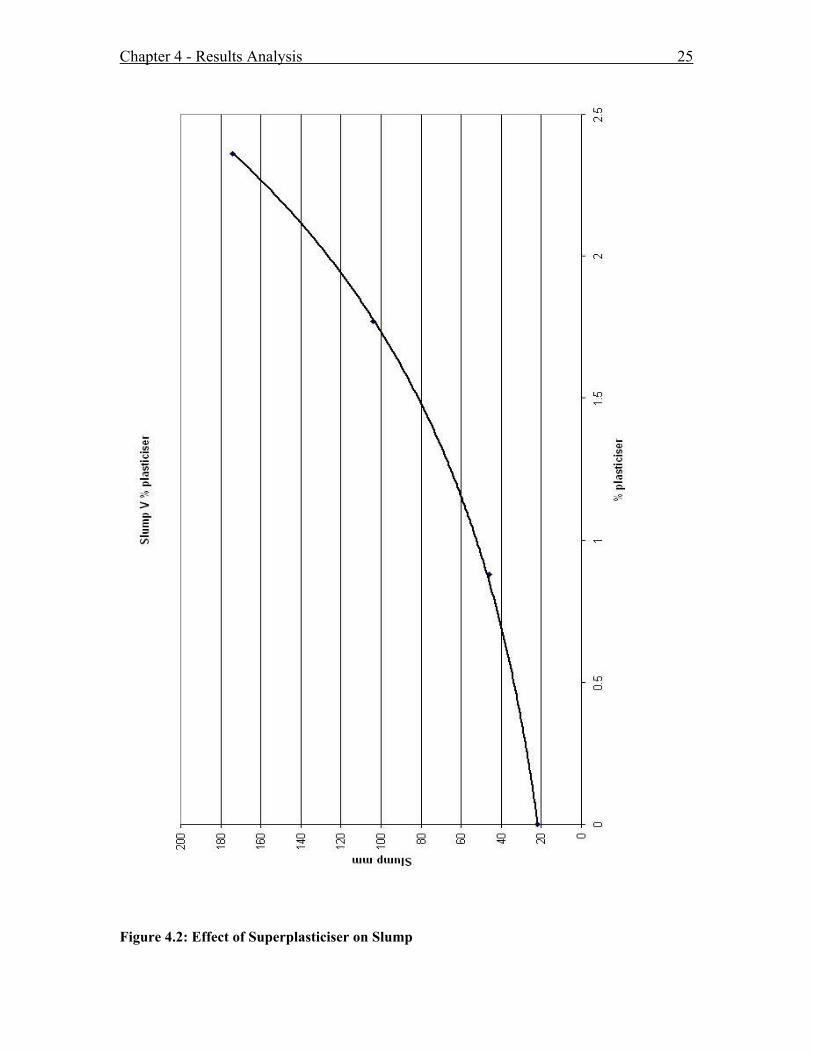
The results obtained from the slump tests shows that as the water cement ratio or the
percentage of plasticiser was increased the slump of the concrete also increased. This was
to be expected. However the slump that was obtained was considerably less then what
would have been expected from a comparable mix which contained no manufactured
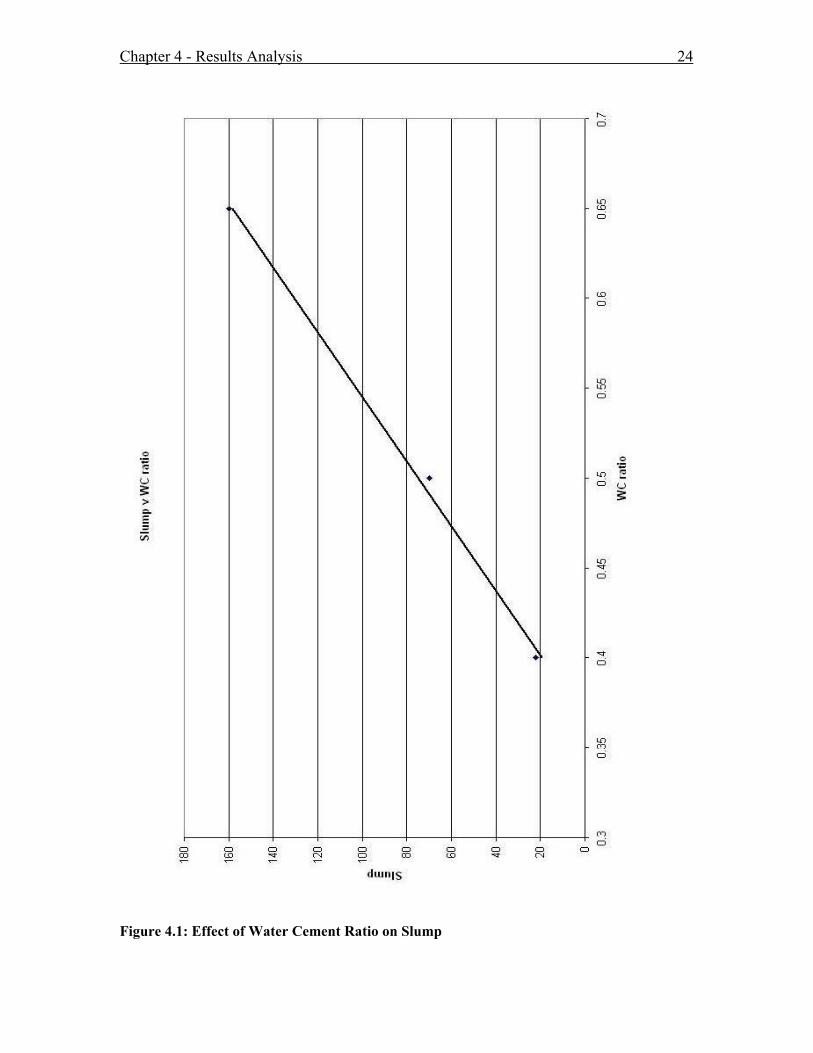
sand and only natural sand. The results from the slump tests can be seen graphically in
figure 4.1; these graphs clearly show that as the water cement ratio is increased the slump
of the concrete is also increased. The first trial mix tested had a water cement ratio of
0.65 and a target strength of 33 Mpa. This mix was able to achieve a good workability
and also achieved its target strength of 33 Mpa. In the following mix the water cement
ratio was reduced to 0.5 to decrease the workability of the mix and to achieve a higher
strength, this mix again achieved a reasonable workability. Although not a great
workability was achieved it was suitable enough that the addition of a superplasticiser did
not appear necessary. The third mix had the water cement ratio reduced even more to 0.4.
This caused a very poor workability; the concrete mix was very difficult to place and
took a long period of time to finish off. This concrete mix also exhibited some
honeycombing of the concrete cylinders; as a result of this a number of cylinders
appeared unsuitable for testing. This honeycombing was caused by a number of factors
including a lack of vibration of the concrete cylinders. This mix with a water cement ratio
of 0.4 was adopted as the mix to trial different percentages of superplasticiser.
The recommended dosage of superplasticiser given by the manufacturer is a range of 0.4
to 1.5 percent; it was clear after the first trial with manufactured sand that larger amounts
of plasticiser may be required. To achieve a high slump, additional superplasticiser was
added until the concrete reached a workability which appeared to be easy to place and
finish. The amount of plasticiser added was well outside of the maximum recommended
dosage of 1.5 percent. The effect that the different percentages of superplasticiser had on
the workability of the concrete can be seen graphically in figure 4.2.
Chapter 4 - Results Analysis 24
Figure 4.1: Effect of Water Cement Ratio on Slump
Chapter 4 - Results Analysis 25
Figure 4.2: Effect of Superplasticiser on Slump
Chapter 4 - Results Analysis 26
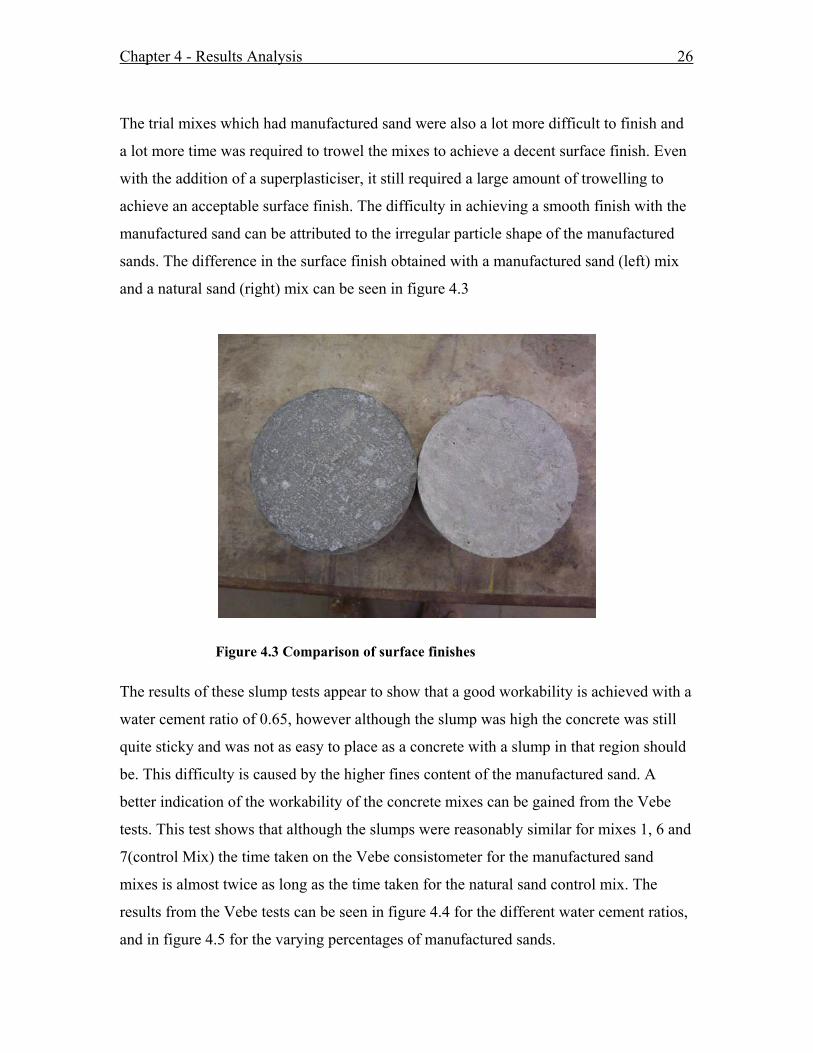
The trial mixes which had manufactured sand were also a lot more difficult to finish and
a lot more time was required to trowel the mixes to achieve a decent surface finish. Even
with the addition of a superplasticiser, it still required a large amount of trowelling to
achieve an acceptable surface finish. The difficulty in achieving a smooth finish with the
manufactured sand can be attributed to the irregular particle shape of the manufactured
sands. The difference in the surface finish obtained with a manufactured sand (left) mix
and a natural sand (right) mix can be seen in figure 4.3
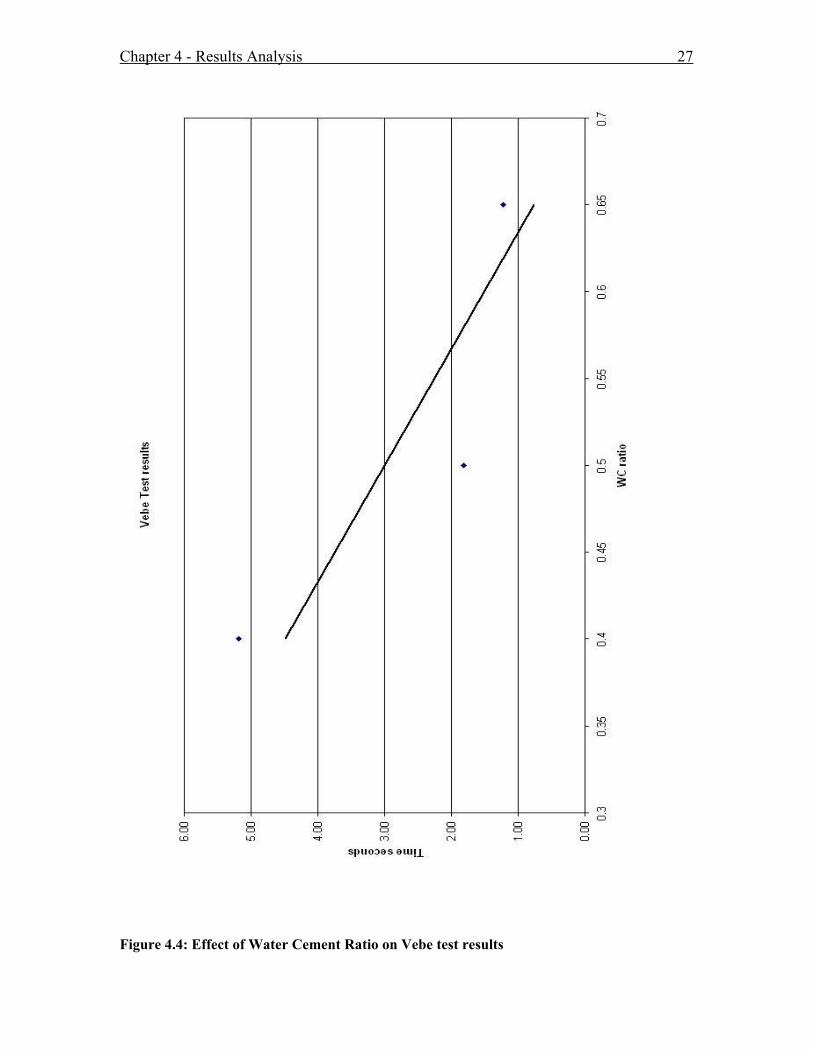
Figure 4.3 Comparison of surface finishes The results of these slump tests appear to show that a good workability is achieved with a
water cement ratio of 0.65, however although the slump was high the concrete was still
quite sticky and was not as easy to place as a concrete with a slump in that region should
be. This difficulty is caused by the higher fines content of the manufactured sand. A
better indication of the workability of the concrete mixes can be gained from the Vebe
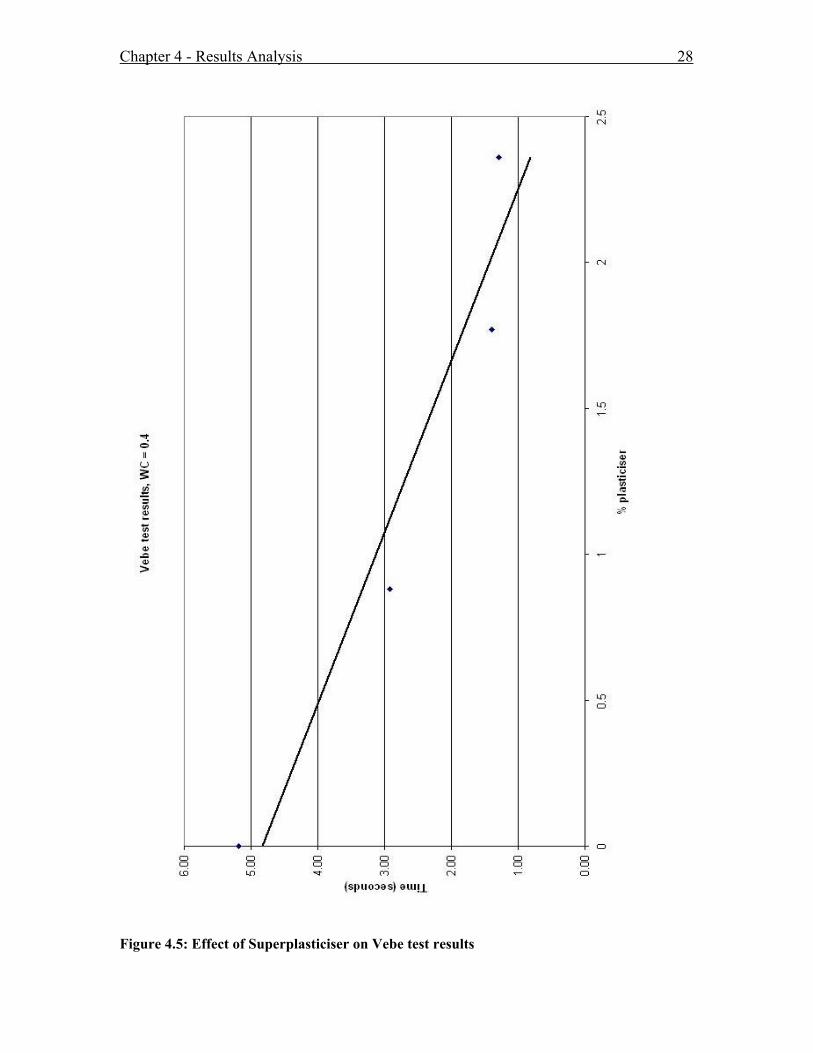
tests. This test shows that although the slumps were reasonably similar for mixes 1, 6 and
7(control Mix) the time taken on the Vebe consistometer for the manufactured sand
mixes is almost twice as long as the time taken for the natural sand control mix. The
results from the Vebe tests can be seen in figure 4.4 for the different water cement ratios,
and in figure 4.5 for the varying percentages of manufactured sands.
Chapter 4 - Results Analysis 27
Figure 4.4: Effect of Water Cement Ratio on Vebe test results
Chapter 4 - Results Analysis 28
Figure 4.5: Effect of Superplasticiser on Vebe test results
Chapter 4 - Results Analysis 29
4.3 Hardened Properties
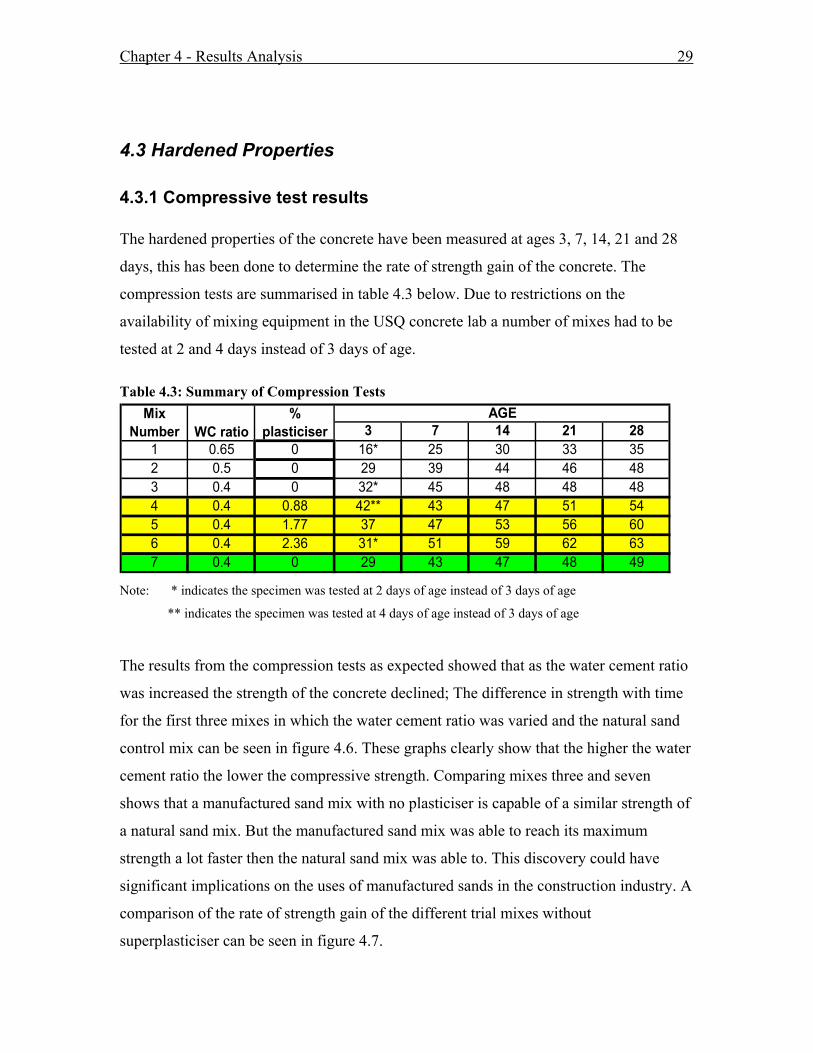
4.3.1 Compressive test results The hardened properties of the concrete have been measured at ages 3, 7, 14, 21 and 28
days, this has been done to determine the rate of strength gain of the concrete. The
compression tests are summarised in table 4.3 below. Due to restrictions on the
availability of mixing equipment in the USQ concrete lab a number of mixes had to be
tested at 2 and 4 days instead of 3 days of age.
Table 4.3: Summary of Compression Tests
3 7 14 21 281 0.65 0 16* 25 30 33 352 0.5 0 29 39 44 46 483 0.4 0 32* 45 48 48 484 0.4 0.88 42** 43 47 51 545 0.4 1.77 37 47 53 56 606 0.4 2.36 31* 51 59 62 637 0.4 0 29 43 47 48 49
Mix Number WC ratio
% plasticiser
AGE
Note: * indicates the specimen was tested at 2 days of age instead of 3 days of age
** indicates the specimen was tested at 4 days of age instead of 3 days of age
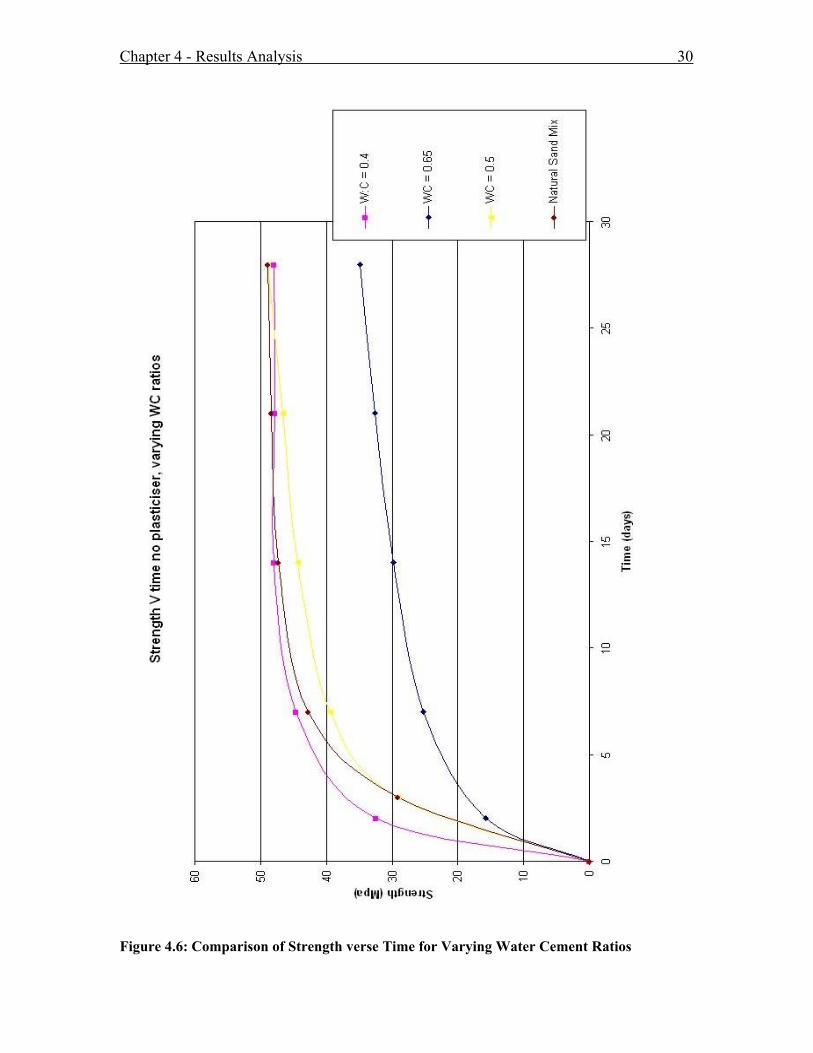
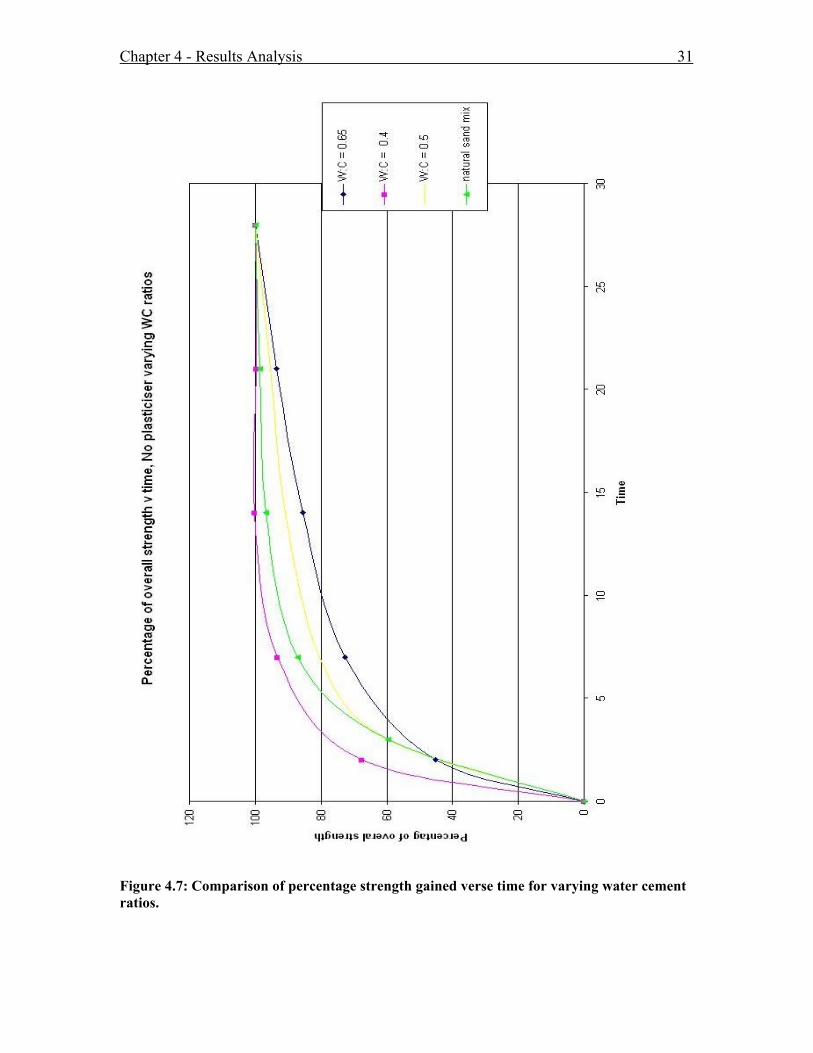
The results from the compression tests as expected showed that as the water cement ratio
was increased the strength of the concrete declined; The difference in strength with time
for the first three mixes in which the water cement ratio was varied and the natural sand
control mix can be seen in figure 4.6. These graphs clearly show that the higher the water
cement ratio the lower the compressive strength. Comparing mixes three and seven
shows that a manufactured sand mix with no plasticiser is capable of a similar strength of
a natural sand mix. But the manufactured sand mix was able to reach its maximum
strength a lot faster then the natural sand mix was able to. This discovery could have
significant implications on the uses of manufactured sands in the construction industry. A
comparison of the rate of strength gain of the different trial mixes without
superplasticiser can be seen in figure 4.7.
Chapter 4 - Results Analysis 30
Figure 4.6: Comparison of Strength verse Time for Varying Water Cement Ratios
Chapter 4 - Results Analysis 31
Figure 4.7: Comparison of percentage strength gained verse time for varying water cement ratios.
Chapter 4 - Results Analysis 32
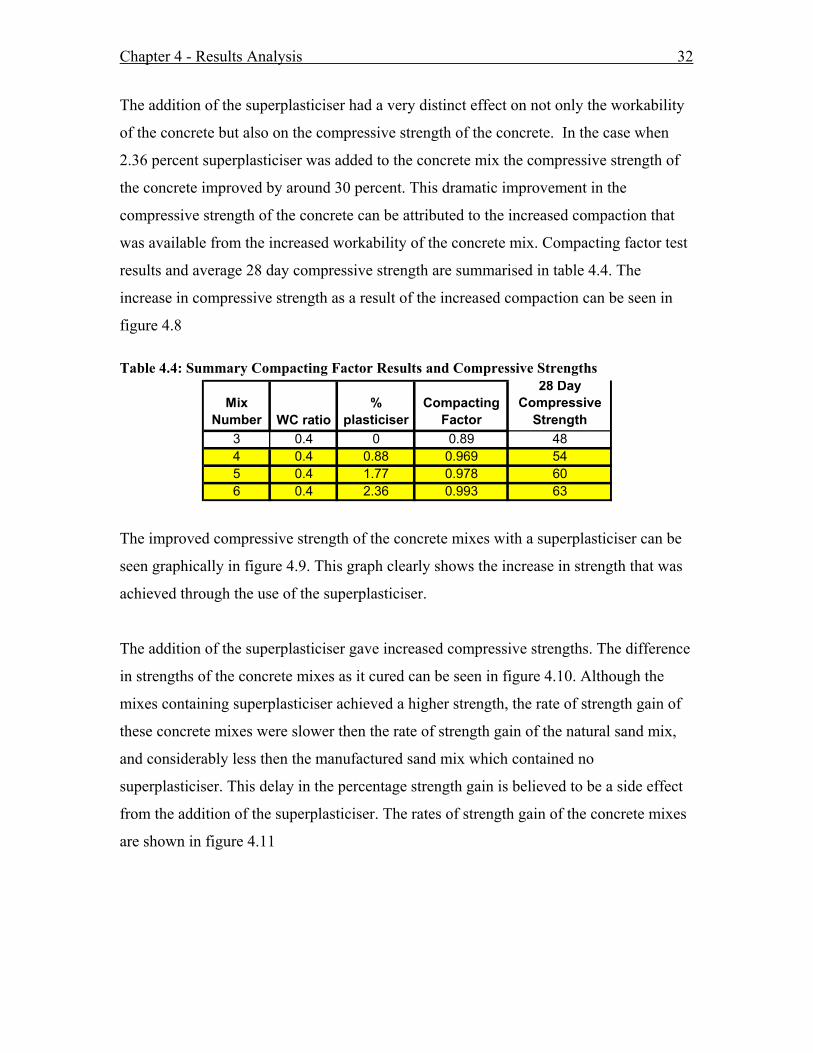
The addition of the superplasticiser had a very distinct effect on not only the workability
of the concrete but also on the compressive strength of the concrete. In the case when
2.36 percent superplasticiser was added to the concrete mix the compressive strength of
the concrete improved by around 30 percent. This dramatic improvement in the
compressive strength of the concrete can be attributed to the increased compaction that
was available from the increased workability of the concrete mix. Compacting factor test
results and average 28 day compressive strength are summarised in table 4.4. The
increase in compressive strength as a result of the increased compaction can be seen in
figure 4.8
Table 4.4: Summary Compacting Factor Results and Compressive Strengths
Mix Number WC ratio
% plasticiser
Compacting Factor
28 Day Compressive
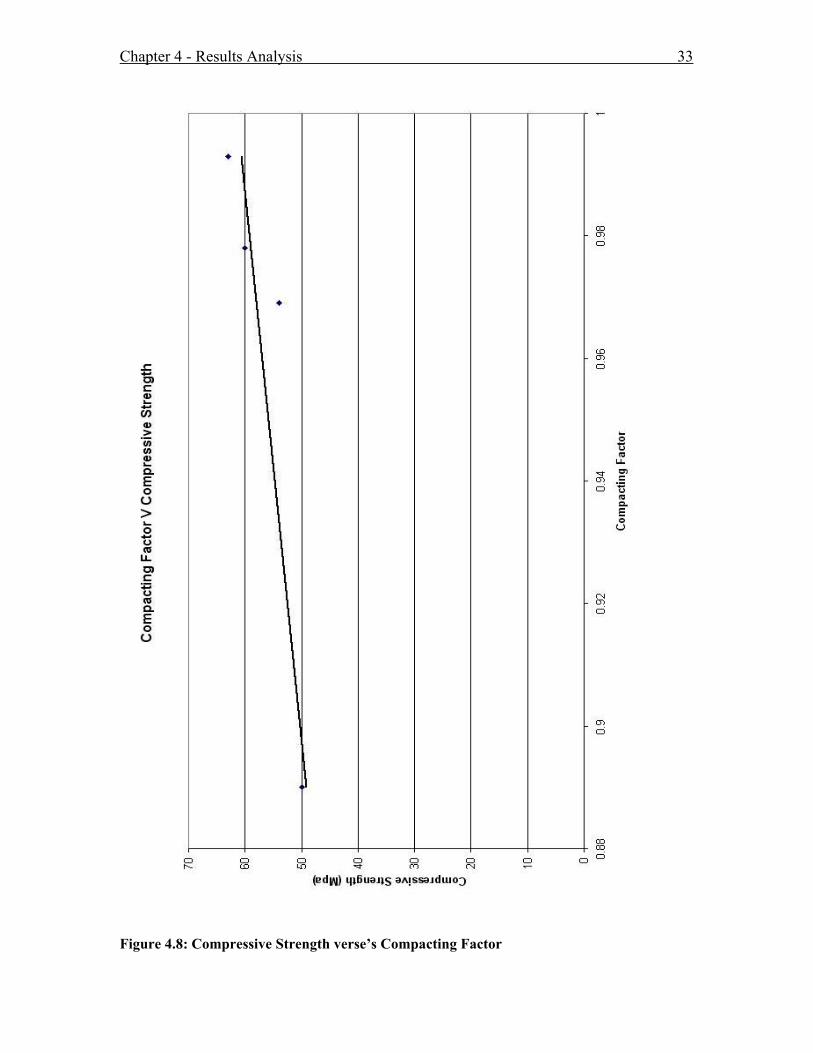
Strength3 0.4 0 0.89 484 0.4 0.88 0.969 545 0.4 1.77 0.978 606 0.4 2.36 0.993 63
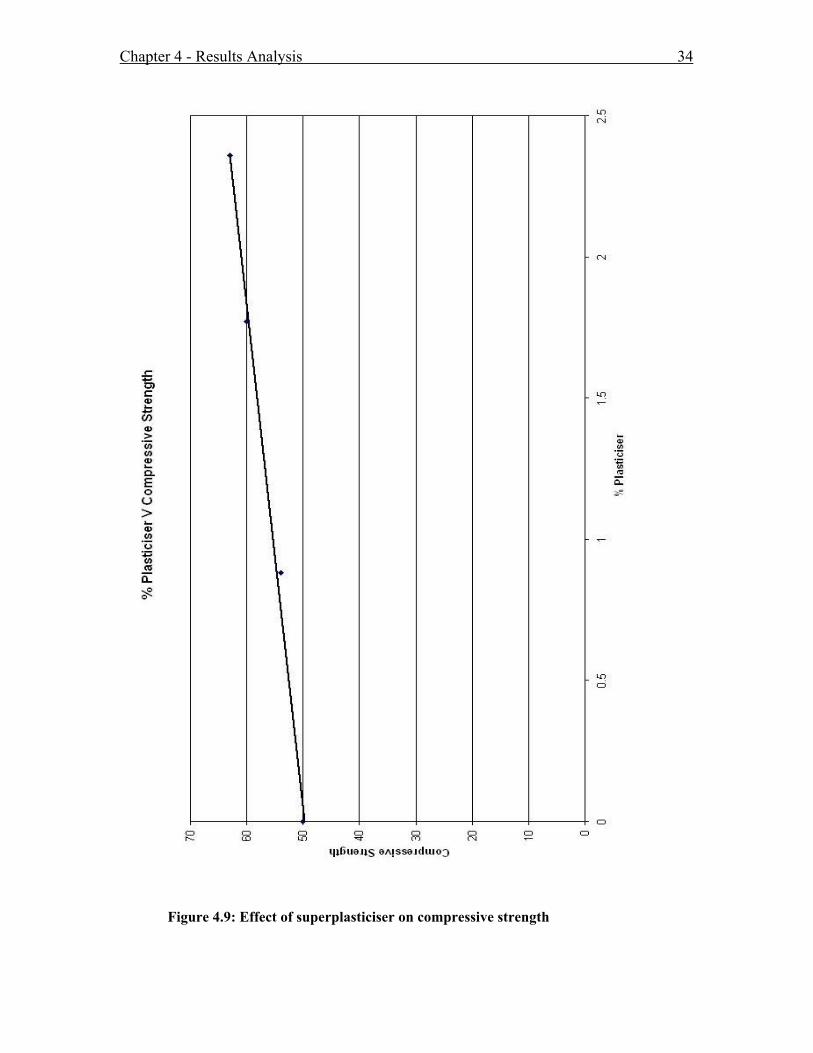
The improved compressive strength of the concrete mixes with a superplasticiser can be
seen graphically in figure 4.9. This graph clearly shows the increase in strength that was
achieved through the use of the superplasticiser.
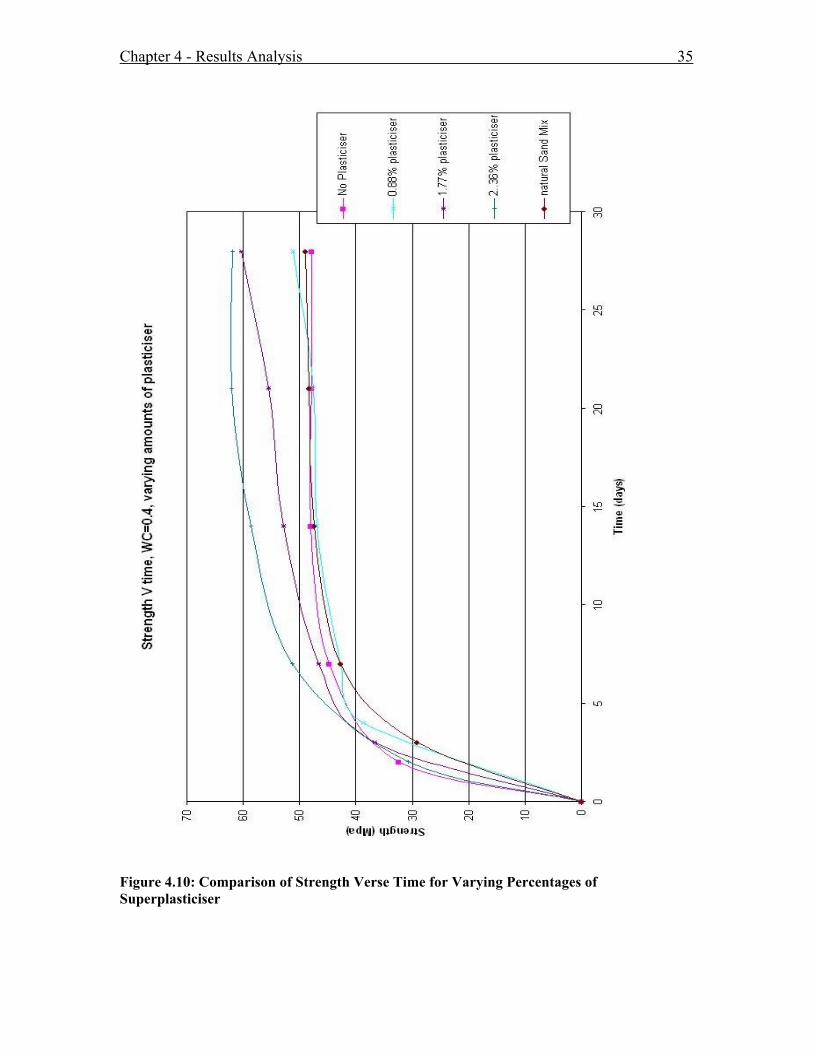
The addition of the superplasticiser gave increased compressive strengths. The difference
in strengths of the concrete mixes as it cured can be seen in figure 4.10. Although the
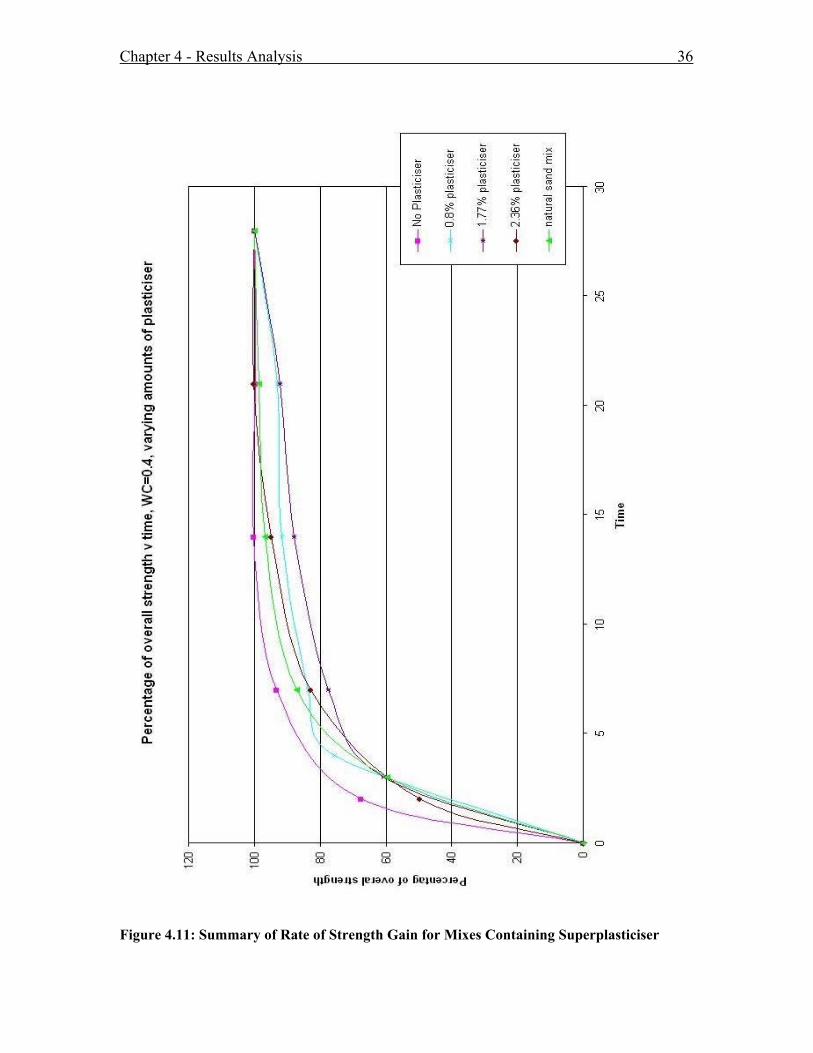
mixes containing superplasticiser achieved a higher strength, the rate of strength gain of
these concrete mixes were slower then the rate of strength gain of the natural sand mix,
and considerably less then the manufactured sand mix which contained no
superplasticiser. This delay in the percentage strength gain is believed to be a side effect
from the addition of the superplasticiser. The rates of strength gain of the concrete mixes
are shown in figure 4.11
Chapter 4 - Results Analysis 33
Figure 4.8: Compressive Strength verse’s Compacting Factor
Chapter 4 - Results Analysis 34
Figure 4.9: Effect of superplasticiser on compressive strength
Chapter 4 - Results Analysis 35
Figure 4.10: Comparison of Strength Verse Time for Varying Percentages of Superplasticiser
Chapter 4 - Results Analysis 36
Figure 4.11: Summary of Rate of Strength Gain for Mixes Containing Superplasticiser
Chapter 4 - Results Analysis 37
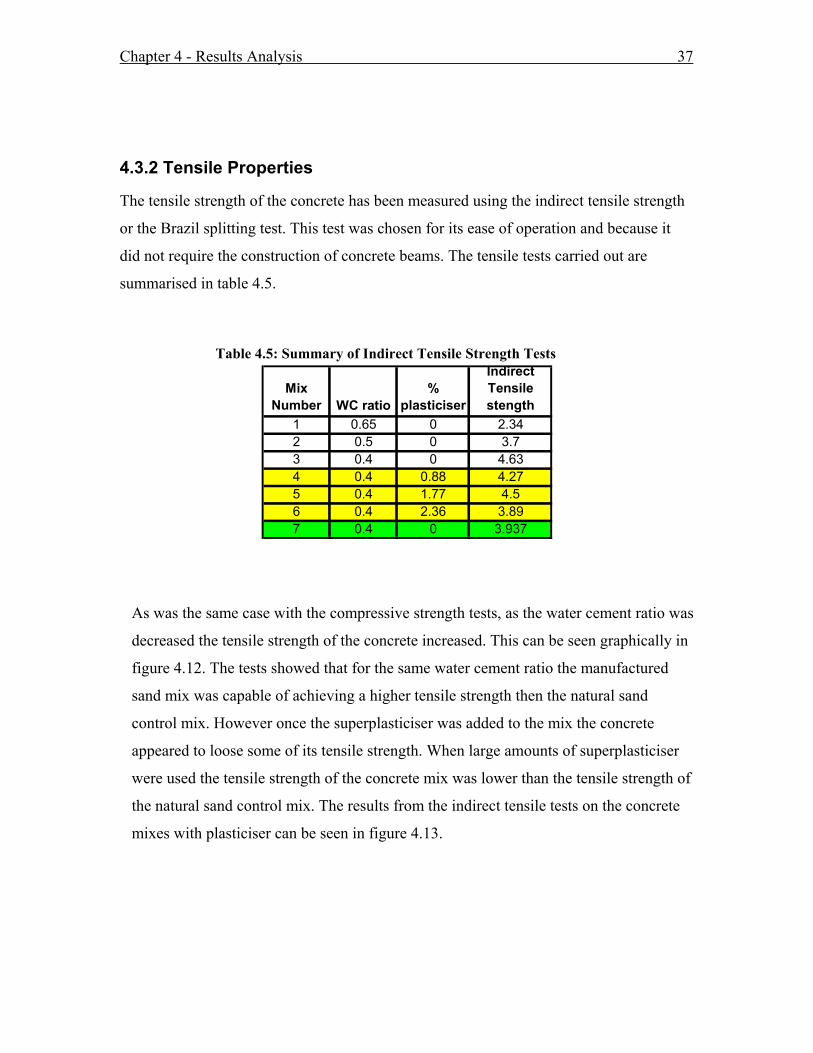
4.3.2 Tensile Properties
The tensile strength of the concrete has been measured using the indirect tensile strength
or the Brazil splitting test. This test was chosen for its ease of operation and because it
did not require the construction of concrete beams. The tensile tests carried out are
summarised in table 4.5.
Table 4.5: Summary of Indirect Tensile Strength Tests
Mix Number WC ratio
% plasticiser
Indirect Tensile stength
1 0.65 0 2.342 0.5 0 3.73 0.4 0 4.634 0.4 0.88 4.275 0.4 1.77 4.56 0.4 2.36 3.897 0.4 0 3.937
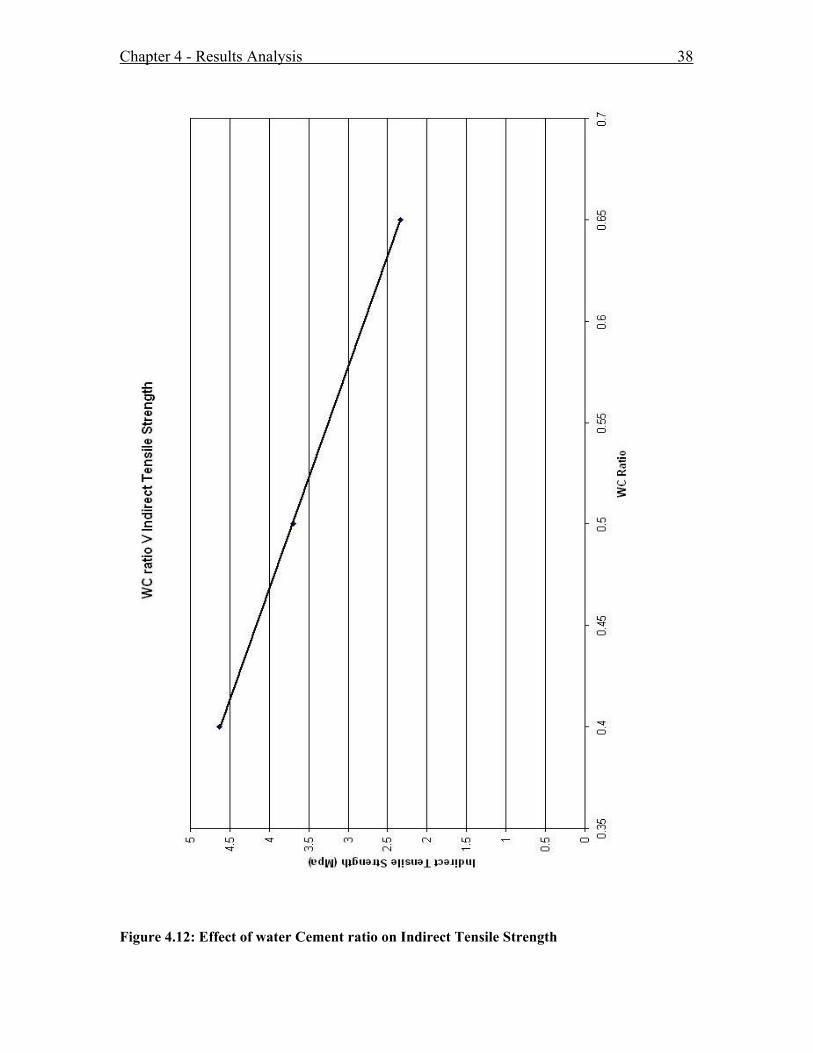
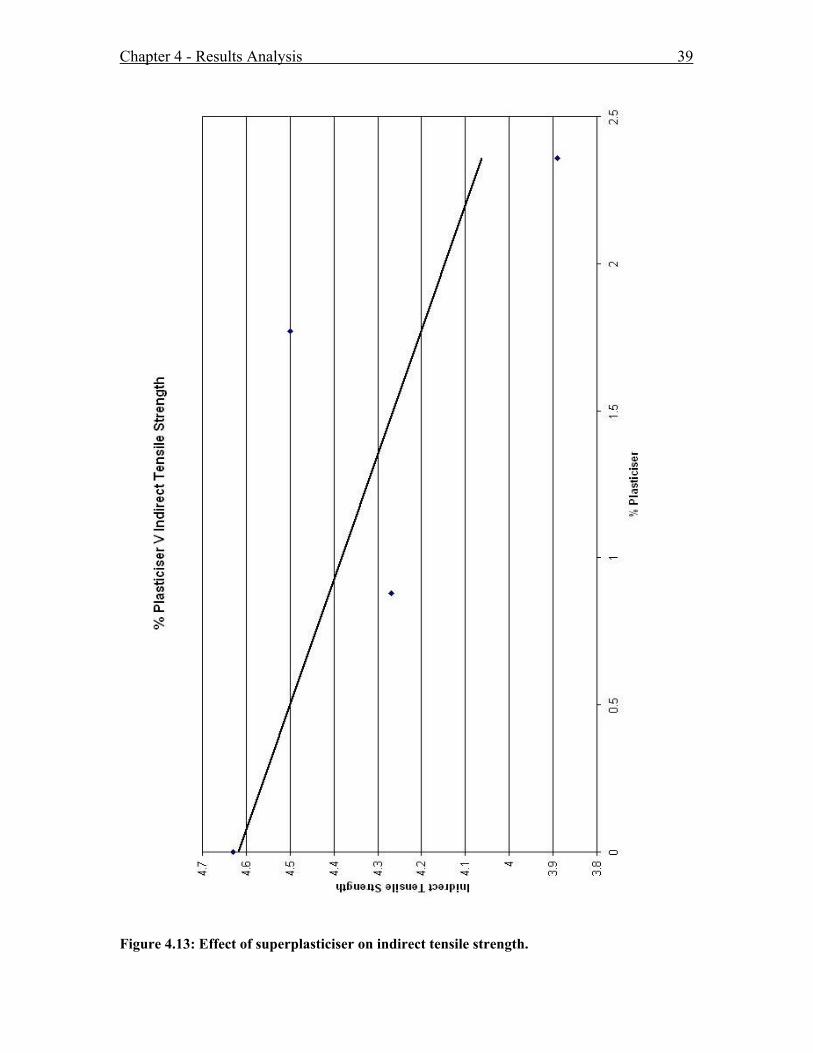
As was the same case with the compressive strength tests, as the water cement ratio was
decreased the tensile strength of the concrete increased. This can be seen graphically in
figure 4.12. The tests showed that for the same water cement ratio the manufactured
sand mix was capable of achieving a higher tensile strength then the natural sand
control mix. However once the superplasticiser was added to the mix the concrete
appeared to loose some of its tensile strength. When large amounts of superplasticiser
were used the tensile strength of the concrete mix was lower than the tensile strength of
the natural sand control mix. The results from the indirect tensile tests on the concrete
mixes with plasticiser can be seen in figure 4.13.
Chapter 4 - Results Analysis 38
Figure 4.12: Effect of water Cement ratio on Indirect Tensile Strength
Chapter 4 - Results Analysis 39
Figure 4.13: Effect of superplasticiser on indirect tensile strength.
Chapter 5 - Economic Analysis and Recommendations 40
Chapter 5 Economic Analysis and Recommendations
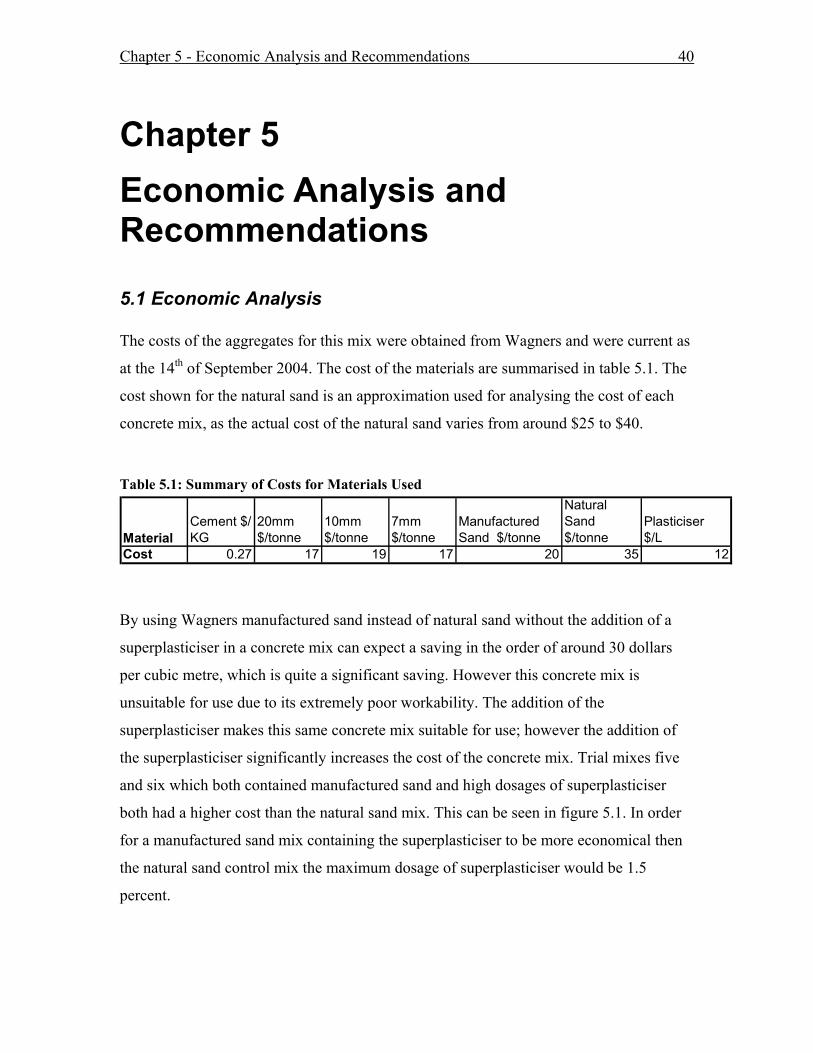
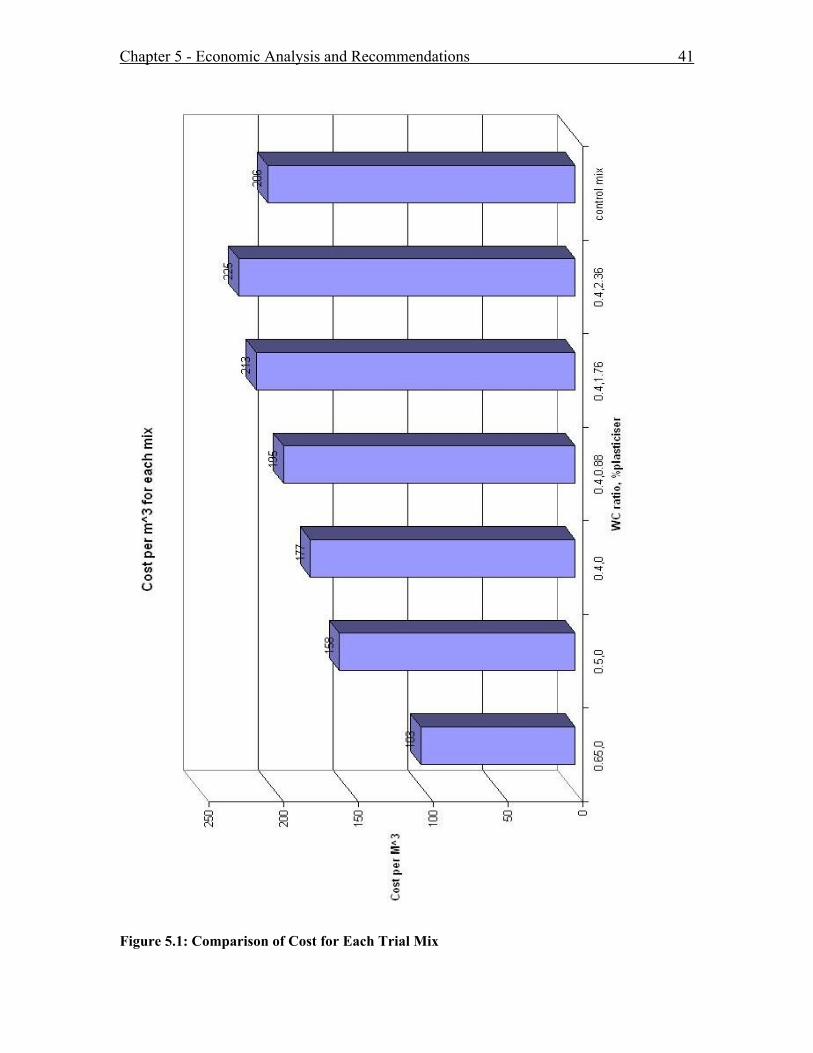
5.1 Economic Analysis The costs of the aggregates for this mix were obtained from Wagners and were current as
at the 14th of September 2004. The cost of the materials are summarised in table 5.1. The
cost shown for the natural sand is an approximation used for analysing the cost of each
concrete mix, as the actual cost of the natural sand varies from around $25 to $40.
Table 5.1: Summary of Costs for Materials Used
MaterialCement $/ KG
20mm $/tonne
10mm $/tonne
7mm $/tonne
Manufactured Sand $/tonne
Natural Sand $/tonne
Plasticiser $/L
Cost 0.27 17 19 17 20 35 12
By using Wagners manufactured sand instead of natural sand without the addition of a
superplasticiser in a concrete mix can expect a saving in the order of around 30 dollars
per cubic metre, which is quite a significant saving. However this concrete mix is
unsuitable for use due to its extremely poor workability. The addition of the
superplasticiser makes this same concrete mix suitable for use; however the addition of
the superplasticiser significantly increases the cost of the concrete mix. Trial mixes five
and six which both contained manufactured sand and high dosages of superplasticiser
both had a higher cost than the natural sand mix. This can be seen in figure 5.1. In order
for a manufactured sand mix containing the superplasticiser to be more economical then
the natural sand control mix the maximum dosage of superplasticiser would be 1.5
percent.
Chapter 5 - Economic Analysis and Recommendations 41
Figure 5.1: Comparison of Cost for Each Trial Mix
Chapter 5 - Economic Analysis and Recommendations 42
5.2 Recommendations
Using manufactured sand in concrete mixes is a viable alternative to the use of natural
sand, however a number of factors must be considered before using the manufactured
sand mixes. If you are targeting a medium strength concrete mix then using a high water
cement ratio with manufactured sand should achieve a reasonable strength and
workability, however the operator will have to take special care to ensure that the
concrete mix achieves a suitable finish. If a high strength concrete mix is required then
this can be achieved by lowering the water cement ratio of the concrete mix and using a
superplasticiser to achieve a suitable workability. The amount of superplasticiser added
will depend on the workability that is required, however it should be noted that using
large amounts of a superplasticiser may cause the concrete mix to be more expensive then
a natural sand mix. In order for the manufactured sand mix to remain cheaper then the
natural sand concrete mix, the amount of superplasticiser added should not exceed 1.5
percent. Interpolation from figure 4.9 shows that a mix which would contain 1.5 percent
superplasticiser would be expected to have a slump of around 80mm. This would be
acceptable for most concreting jobs, however it is expected that this mix would still be
quite difficult to finish and would probably require a large amount of trowelling to
achieve a suitable finish.
Chapter 6 – Conclusions 43
Chapter 6
Conclusions
6.1 Conclusions from Analysis At the beginning of this project a number of goals were set out to achieve, these goals
were to:
Determine if a suitable workability and strength can be achieved in concrete
containing manufactured sand as a complete replacement for natural sand;
Determine what percentage of superplasticiser is required to achieve a suitable
workability for concrete containing manufactured sand;
Determine the impact that the superplasticiser has on the strength of the concrete;
Determine the rate of strength gain for the concrete containing manufactured sand
with and without superplasticiser;
After the completion of testing and analysing, there are a number of conclusions which
are able to be made.
By using large amounts of water in the concrete mix manufactured sands are
capable of achieving a suitable workability and also achieving the target strength.
However the amount of time required for achieving a suitable finish on the
concrete is still a major drawback to its use in the construction industry.
Chapter 6 – Conclusions 44
With the addition of a superplasticiser a concrete mix containing manufactured
sand is capable of not only achieving a workability similar to that of natural sand,
however to achieve this workability, dosages as high as 2.36 percent were
required. The additional cost of these large amounts of superplasticiser in the
concrete mix makes the manufactured sand concrete mix less economical to
produce then a natural sand control mix. However with the declining availability
of natural sands suitable for use in concrete, the use of concrete mixes containing
100 percent manufactured sand or high percentages of manufactured sands in the
aggregate blend may become a lot more common.
The addition of superplasticiser into a concrete mix not only improves the
workability of the concrete mix but also the strength of the concrete mix. When
large amounts of plasticiser were added the strength improved by around 30
percent on the mix without plasticiser, however the rate of strength gain of the
concrete mix is lowered considerably when the plasticiser is added
6.2 Further Research Further research is needed on manufactured sand to determine;
The flexural strength of manufactured sand concrete mixes;
The young’s modulus of the concrete;
The impact that a superplasticiser will have on a concrete mix containing a blend of
manufactured sand and natural sand, which has a high percentage of manufactured
sand.

Appendix A 45
Appendix A
Project Specification
Appendix A 46
University of Southern Queensland Faculty of Engineering and Surveying
ENG 4111/4112 Research Project
PROJECT SPECIFICATION
FOR: Mark James Krinke BENG (civil)
TOPIC: THE EFFECTS OF ADMIXTURES IN CONCRETE CONTAINING
MANUFACTURED SAND
SUPERVISORS: Dr. Thiru Aravinthian
SPONSORSHIP: Faculty of Engineering and surveying
PROJECT AIM: The aim of this project is to study the effects that varying amounts
admixtures have on concrete containing manufactured sand instead
of natural sand.
PROGRAMME: Issue A march 2004
1. Research the background of manufactured sand and admixtures in concrete
2. Carry out Particle Shape, Water Absorption and Grading tests on aggregates
to be used in the concrete mixes.
3. Develop a number of different trial mixes for testing using varying water
cement ratios and varying amounts of admixtures.
4. For each trial Mix perform Slump, Vebe and Compacting Factor Apparatus
tests on the fresh concrete.
5. Perform compression tests on the hardened concrete at 3, 7, 21 and 28 days
for each trial mix.
6. Perform indirect tensile strength test at 28 days for each trial mix.
7. Evaluate results of tests comparing strengths at different ages of different trial
mixes.
as time permits
Appendix A 47
8. Develop trial mixes with different amounts of manufactured sand and natural
sand with admixtures, and perform similar tests carried out on previous trial
mixes.
AGREED:
…………… …….. (student) …………………………………………….(supervisors)
Date: …../…../…..

Appendix B ` 48
Appendix B
Test Results
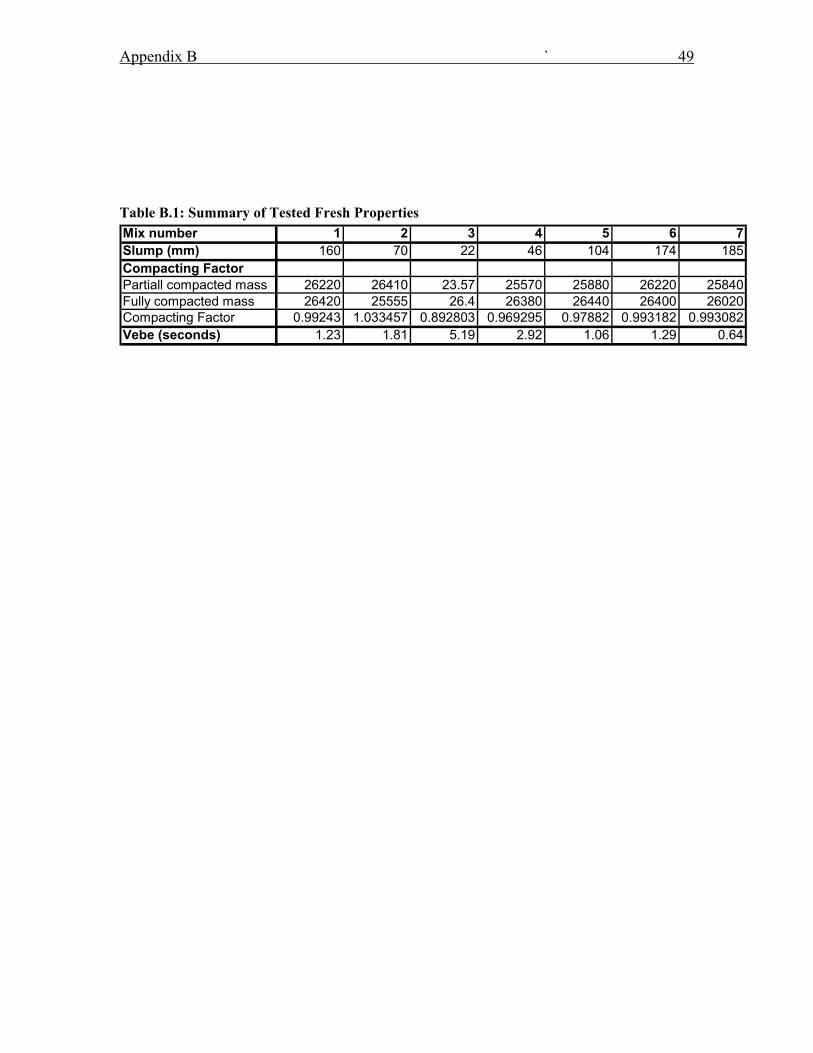
Appendix B ` 49
Table B.1: Summary of Tested Fresh Properties Mix number 1 2 3 4 5 6 7Slump (mm) 160 70 22 46 104 174 185Compacting FactorPartiall compacted mass 26220 26410 23.57 25570 25880 26220 25840Fully compacted mass 26420 25555 26.4 26380 26440 26400 26020Compacting Factor 0.99243 1.033457 0.892803 0.969295 0.97882 0.993182 0.993082Vebe (seconds) 1.23 1.81 5.19 2.92 1.06 1.29 0.64
Appendix B ` 50
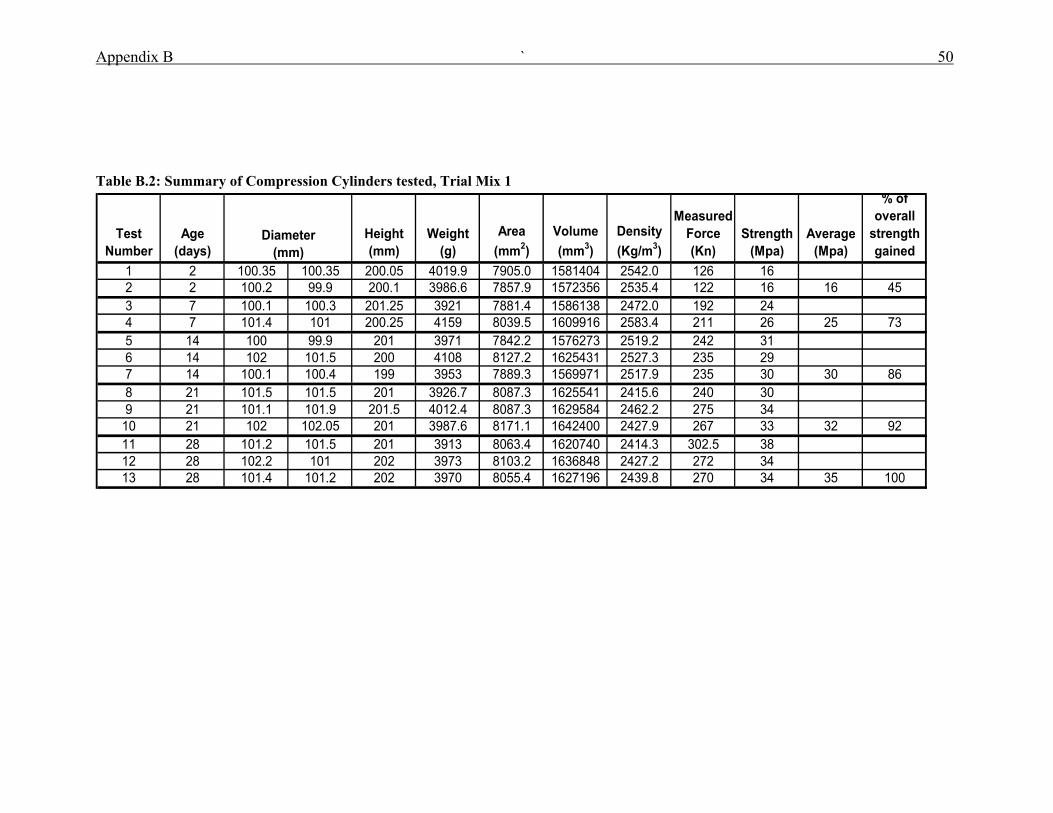
Table B.2: Summary of Compression Cylinders tested, Trial Mix 1
Test Number
Age (days)
Height (mm)
Weight (g)
Area (mm2)
Volume (mm3)
Density (Kg/m3)
Measured Force (Kn)
Strength (Mpa)
Average (Mpa)
% of overall
strength gained
1 2 100.35 100.35 200.05 4019.9 7905.0 1581404 2542.0 126 162 2 100.2 99.9 200.1 3986.6 7857.9 1572356 2535.4 122 16 16 453 7 100.1 100.3 201.25 3921 7881.4 1586138 2472.0 192 244 7 101.4 101 200.25 4159 8039.5 1609916 2583.4 211 26 25 735 14 100 99.9 201 3971 7842.2 1576273 2519.2 242 316 14 102 101.5 200 4108 8127.2 1625431 2527.3 235 297 14 100.1 100.4 199 3953 7889.3 1569971 2517.9 235 30 30 868 21 101.5 101.5 201 3926.7 8087.3 1625541 2415.6 240 309 21 101.1 101.9 201.5 4012.4 8087.3 1629584 2462.2 275 34
10 21 102 102.05 201 3987.6 8171.1 1642400 2427.9 267 33 32 9211 28 101.2 101.5 201 3913 8063.4 1620740 2414.3 302.5 3812 28 102.2 101 202 3973 8103.2 1636848 2427.2 272 3413 28 101.4 101.2 202 3970 8055.4 1627196 2439.8 270 34 35 100
Diameter (mm)
Appendix B ` 51
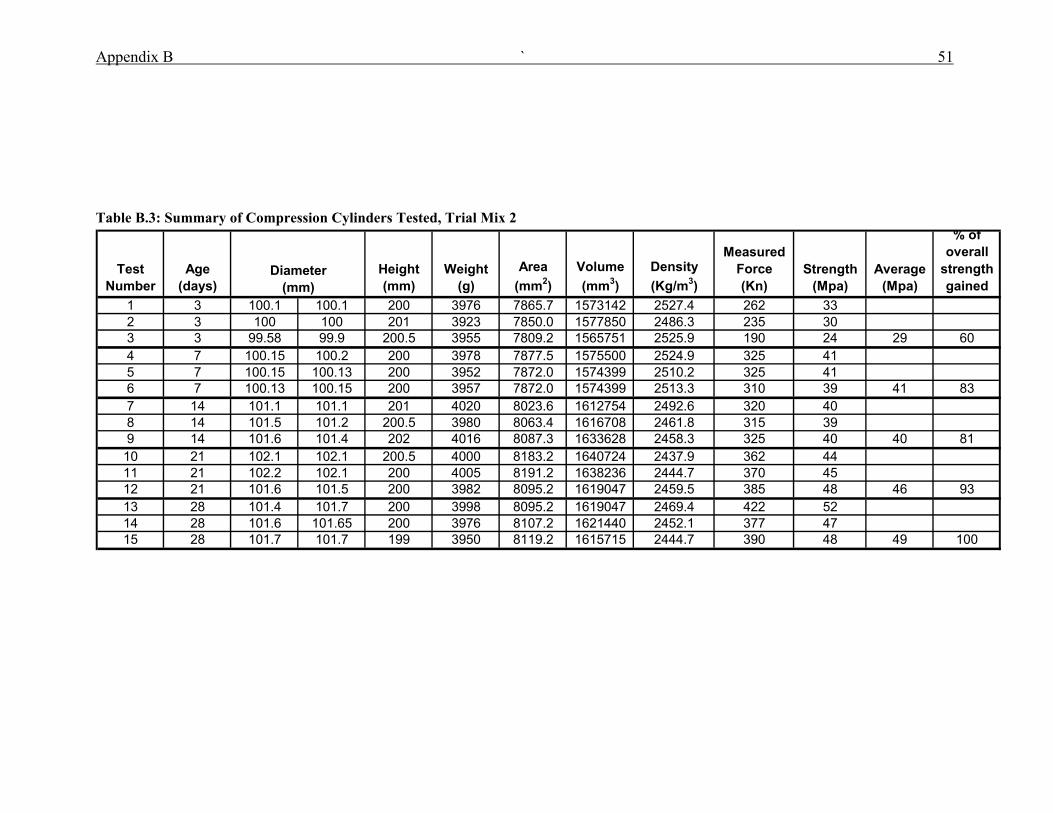
Table B.3: Summary of Compression Cylinders Tested, Trial Mix 2
Test Number
Age (days)
Height (mm)
Weight (g)
Area (mm2)
Volume (mm3)
Density (Kg/m3)
Measured Force (Kn)
Strength (Mpa)
Average (Mpa)
% of overall
strength gained
1 3 100.1 100.1 200 3976 7865.7 1573142 2527.4 262 332 3 100 100 201 3923 7850.0 1577850 2486.3 235 303 3 99.58 99.9 200.5 3955 7809.2 1565751 2525.9 190 24 29 604 7 100.15 100.2 200 3978 7877.5 1575500 2524.9 325 415 7 100.15 100.13 200 3952 7872.0 1574399 2510.2 325 416 7 100.13 100.15 200 3957 7872.0 1574399 2513.3 310 39 41 837 14 101.1 101.1 201 4020 8023.6 1612754 2492.6 320 408 14 101.5 101.2 200.5 3980 8063.4 1616708 2461.8 315 399 14 101.6 101.4 202 4016 8087.3 1633628 2458.3 325 40 40 8110 21 102.1 102.1 200.5 4000 8183.2 1640724 2437.9 362 4411 21 102.2 102.1 200 4005 8191.2 1638236 2444.7 370 4512 21 101.6 101.5 200 3982 8095.2 1619047 2459.5 385 48 46 9313 28 101.4 101.7 200 3998 8095.2 1619047 2469.4 422 5214 28 101.6 101.65 200 3976 8107.2 1621440 2452.1 377 4715 28 101.7 101.7 199 3950 8119.2 1615715 2444.7 390 48 49 100
Diameter (mm)
Appendix B ` 52
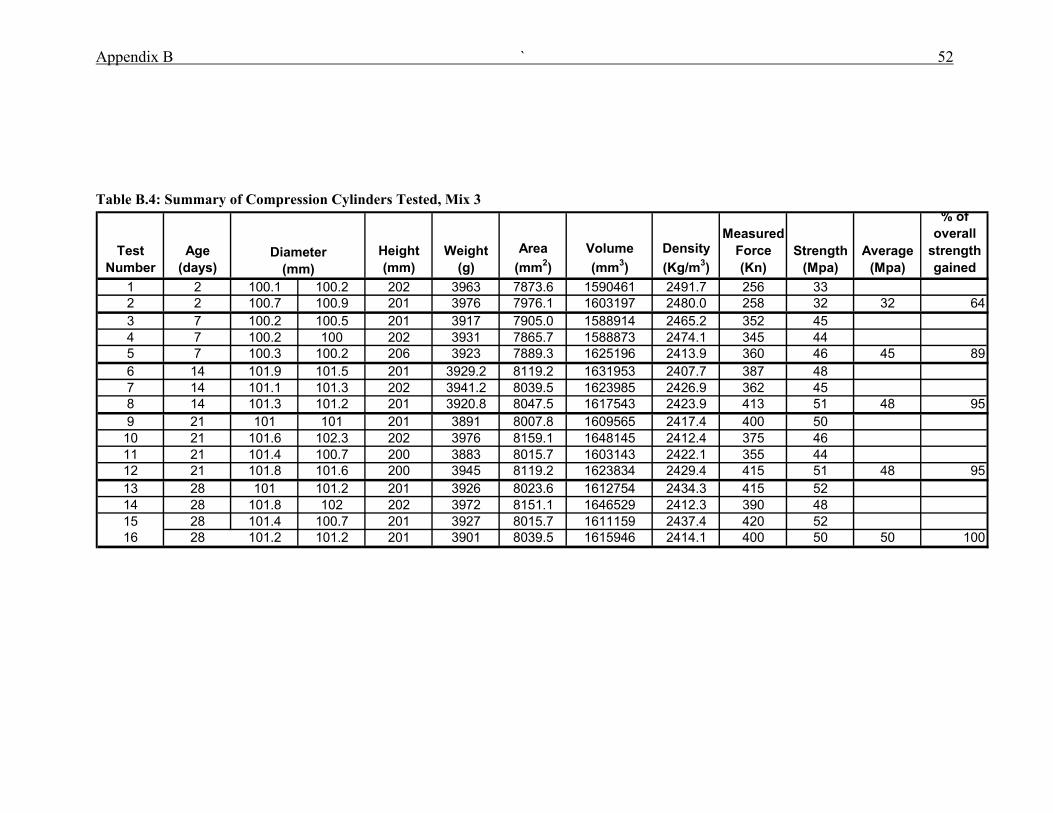
Table B.4: Summary of Compression Cylinders Tested, Mix 3
Test Number
Age (days)
Height (mm)
Weight (g)
Area (mm2)
Volume (mm3)
Density (Kg/m3)
Measured Force (Kn)
Strength (Mpa)
Average (Mpa)
% of overall
strength gained
1 2 100.1 100.2 202 3963 7873.6 1590461 2491.7 256 332 2 100.7 100.9 201 3976 7976.1 1603197 2480.0 258 32 32 643 7 100.2 100.5 201 3917 7905.0 1588914 2465.2 352 454 7 100.2 100 202 3931 7865.7 1588873 2474.1 345 445 7 100.3 100.2 206 3923 7889.3 1625196 2413.9 360 46 45 896 14 101.9 101.5 201 3929.2 8119.2 1631953 2407.7 387 487 14 101.1 101.3 202 3941.2 8039.5 1623985 2426.9 362 458 14 101.3 101.2 201 3920.8 8047.5 1617543 2423.9 413 51 48 959 21 101 101 201 3891 8007.8 1609565 2417.4 400 5010 21 101.6 102.3 202 3976 8159.1 1648145 2412.4 375 4611 21 101.4 100.7 200 3883 8015.7 1603143 2422.1 355 4412 21 101.8 101.6 200 3945 8119.2 1623834 2429.4 415 51 48 9513 28 101 101.2 201 3926 8023.6 1612754 2434.3 415 5214 28 101.8 102 202 3972 8151.1 1646529 2412.3 390 4815 28 101.4 100.7 201 3927 8015.7 1611159 2437.4 420 5216 28 101.2 101.2 201 3901 8039.5 1615946 2414.1 400 50 50 100
Diameter (mm)
Appendix B ` 53
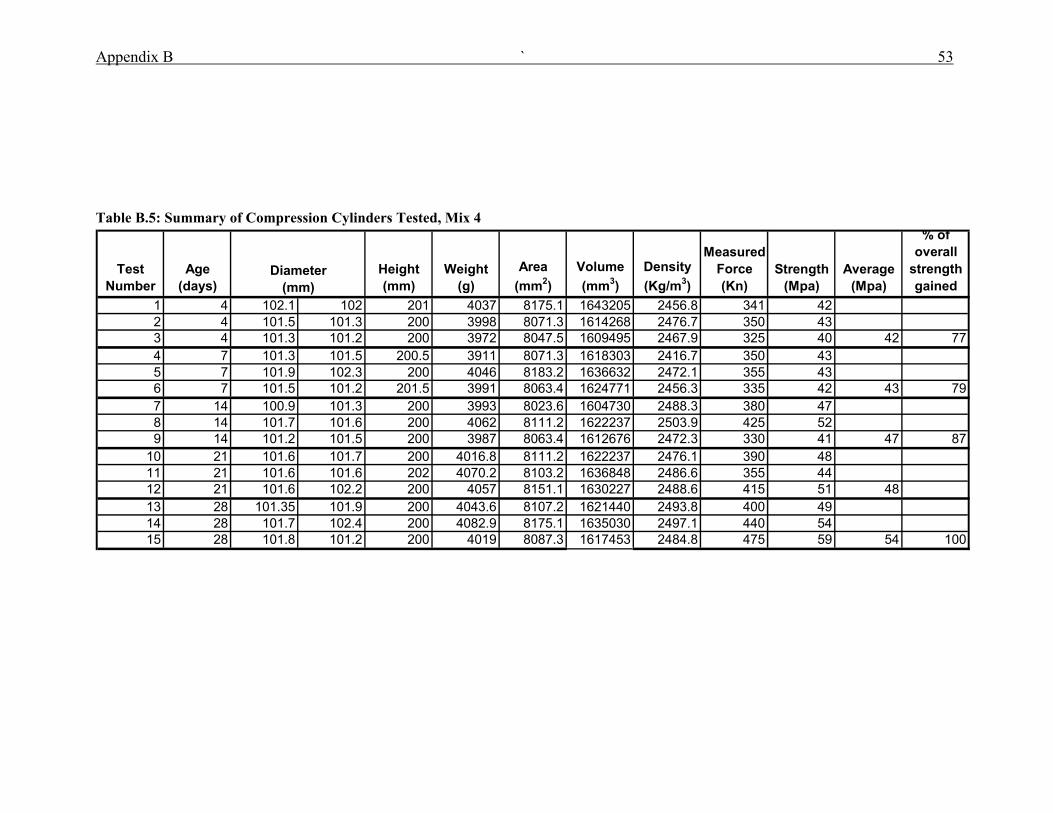
Table B.5: Summary of Compression Cylinders Tested, Mix 4
Test Number
Age (days)
Height (mm)
Weight (g)
Area (mm2)
Volume (mm3)
Density (Kg/m3)
Measured Force (Kn)
Strength (Mpa)
Average (Mpa)
% of overall
strength gained
1 4 102.1 102 201 4037 8175.1 1643205 2456.8 341 422 4 101.5 101.3 200 3998 8071.3 1614268 2476.7 350 433 4 101.3 101.2 200 3972 8047.5 1609495 2467.9 325 40 42 774 7 101.3 101.5 200.5 3911 8071.3 1618303 2416.7 350 435 7 101.9 102.3 200 4046 8183.2 1636632 2472.1 355 436 7 101.5 101.2 201.5 3991 8063.4 1624771 2456.3 335 42 43 797 14 100.9 101.3 200 3993 8023.6 1604730 2488.3 380 478 14 101.7 101.6 200 4062 8111.2 1622237 2503.9 425 529 14 101.2 101.5 200 3987 8063.4 1612676 2472.3 330 41 47 87
10 21 101.6 101.7 200 4016.8 8111.2 1622237 2476.1 390 4811 21 101.6 101.6 202 4070.2 8103.2 1636848 2486.6 355 4412 21 101.6 102.2 200 4057 8151.1 1630227 2488.6 415 51 4813 28 101.35 101.9 200 4043.6 8107.2 1621440 2493.8 400 4914 28 101.7 102.4 200 4082.9 8175.1 1635030 2497.1 440 5415 28 101.8 101.2 200 4019 8087.3 1617453 2484.8 475 59 54 100
Diameter (mm)
Appendix B ` 54
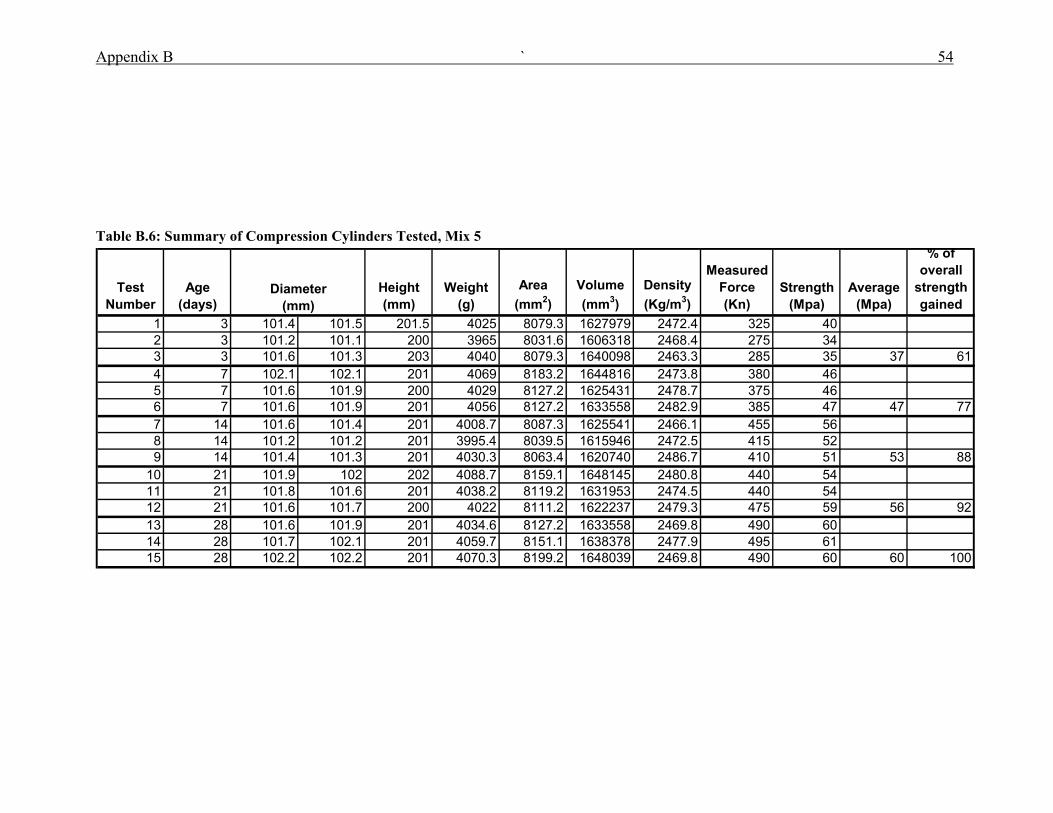
Table B.6: Summary of Compression Cylinders Tested, Mix 5
Test Number
Age (days)
Height (mm)
Weight (g)
Area (mm2)
Volume (mm3)
Density (Kg/m3)
Measured Force (Kn)
Strength (Mpa)
Average (Mpa)
% of overall
strength gained
1 3 101.4 101.5 201.5 4025 8079.3 1627979 2472.4 325 402 3 101.2 101.1 200 3965 8031.6 1606318 2468.4 275 343 3 101.6 101.3 203 4040 8079.3 1640098 2463.3 285 35 37 614 7 102.1 102.1 201 4069 8183.2 1644816 2473.8 380 465 7 101.6 101.9 200 4029 8127.2 1625431 2478.7 375 466 7 101.6 101.9 201 4056 8127.2 1633558 2482.9 385 47 47 777 14 101.6 101.4 201 4008.7 8087.3 1625541 2466.1 455 568 14 101.2 101.2 201 3995.4 8039.5 1615946 2472.5 415 529 14 101.4 101.3 201 4030.3 8063.4 1620740 2486.7 410 51 53 88
10 21 101.9 102 202 4088.7 8159.1 1648145 2480.8 440 5411 21 101.8 101.6 201 4038.2 8119.2 1631953 2474.5 440 5412 21 101.6 101.7 200 4022 8111.2 1622237 2479.3 475 59 56 9213 28 101.6 101.9 201 4034.6 8127.2 1633558 2469.8 490 6014 28 101.7 102.1 201 4059.7 8151.1 1638378 2477.9 495 6115 28 102.2 102.2 201 4070.3 8199.2 1648039 2469.8 490 60 60 100
Diameter (mm)
Appendix B ` 55
Table B.7: Summary of Compression Cylinders Tested, Mix 6
Test Number
Age (days)
Height (mm)
Weight (g)
Area (mm2)
Volume (mm3)
Density (Kg/m3)
Measured Force (Kn)
Strength (Mpa)
Average (Mpa)
% of overall
strength gained
1 2 101.5 101.4 199 3975 8079.3 1607781 2472.4 250 312 2 101.8 101.9 200.5 3975 8143.1 1632699 2434.6 265 333 2 102 102.2 200 4045 8183.2 1636632 2471.5 235 29 31 504 7 101.7 101.9 199 4001 8135.1 1618894 2471.4 420 525 7 101.4 101.3 200 3966 8063.4 1612676 2459.3 410 516 7 102.1 102 201 4052 8175.1 1643205 2465.9 420 51 51 837 14 101.6 101.8 200 4001.8 8119.2 1623834 2464.4 435 548 14 102.1 102.1 198 4035.7 8183.2 1620266 2490.8 435 539 14 101.6 101 199 3971.4 8055.4 1603030 2477.4 448 56 54 8710 21 101.4 101.4 200 4014 8071.3 1614268 2486.6 505 6311 21 101.4 101.2 200 3984.2 8055.4 1611085 2473.0 495 6112 21 101.7 102.1 200 4005 8151.1 1630227 2456.7 505 62 62 10013 28 101.3 101.2 200 3994.1 8047.5 1609495 2481.6 495 6214 28 101.7 101.4 200 3997.7 8095.2 1619047 2469.2 530 6515 28 101.6 101.6 200 4029.6 8103.2 1620642 2486.4 475 59 62 100
Diameter (mm)
Appendix B ` 56
Table B.8: Summary of Compression Cylinders Tested, Mix 7
Test Number
Age (days)
Height (mm)
Weight (g)
Area (mm2)
Volume (mm3)
Density (Kg/m3)
Measured Force (Kn)
Strength (Mpa)
Average (Mpa)
% of overall
strength gained
1 3 102.2 102 198 3853 8183.2 1620266 2378.0 245 302 3 101.5 101 200 3794 8047.5 1609495 2357.3 240 303 3 101.4 101.6 200 3799 8087.3 1617453 2348.8 225 28 29 594 7 101.5 101.4 200 3844.5 8079.3 1615860 2379.2 350 435 7 101.5 101.2 199 3812.9 8063.4 1604613 2376.2 342 426 7 101.8 101.9 200 3842.1 8143.1 1628627 2359.1 345 42 43 867 14 101.6 101.8 199 3840.8 8119.2 1615715 2377.2 356 448 14 101.4 101.4 200 3788.6 8071.3 1614268 2346.9 402 509 14 101.4 101.2 200 3818.6 8055.4 1611085 2370.2 390 48 47 9610 21 101.4 101.2 198 3777.4 8055.4 1594974 2368.3 400 5011 21 101.5 101.5 199 3831.3 8087.3 1609366 2380.6 400 4912 21 101.4 101.2 200 3787.3 8055.4 1611085 2350.8 370 46 48 9813 28 101.4 101.35 198 3817 8067.4 1597337 2389.6 400 5014 28 102 101.9 199 3871.2 8159.1 1623668 2384.2 400 4915 28 101.4 101.5 199 3848.3 8079.3 1607781 2393.5 405 50 50 100
Diameter (mm)
Appendix B ` 57
Table B.10: Summary from Indirect Tensile Strength tests
Mix Number Age
Average Diameter Height Weight Area Volume Density
Measured Force Strength
Average Strength
1 28 150.7 149.8 150.25 299 13183 17721 5298706 2488.0 165 2.34 2.342 28 150.65 150.1 150.65 301 13459 17751 5343028 2519.0 255 3.582 28 150.1 149.7 150.1 300 13392 17639 5291687 2530.8 270 3.82 3.703 28 150.3 150.3 150.3 302 13383 17733 5355433 2499.0 330 4.633 28 151.3 151.3 151.3 304 13619 17970 5462873 2493.0 335 4.64 4.634 28 150.15 150 150.15 301 13534 17680 5321730 2543.1 295 4.164 28 149.7 151 149.7 304 13564 17745 5394486 2514.4 315 4.41 4.285 28 150.1 151 150.1 302.5 13573 17792 5382159 2521.9 270 45 28 152.45 152.2 152.45 306.5 14267 18214 5582677 2555.5 375 5 46 28 150.8 150.2 150.8 300.5 13531 17780 5343024 2532.5 270 3.796 28 152.4 152.1 152.4 304.5 14086 18196 5540788 2542.2 290 3.98 3.897 28 150.5 150.2 150.5 298 12839 17745 5288016 2427.9 280 3.9787 28 150.5 150.1 150.5 299 12856 17733 5302233 2424.6 275 3.896 3.937
Diameter
Appendix B 58
Table B.11: Results from 20 mm Aggregate Sieve Analysis.
Sieve Size
Mass Retained
% Mass Retained
Cumulitive Percentage Retained
Percent Passing
26.5 0.0 0.0 0.0 100.019 0.0 0.0 0.0 100.0
13.2 3048.4 34.1 34.1 65.99.5 4394.7 49.1 83.2 16.8
4.75 1394.7 15.6 98.8 1.22.36 58.9 0.7 99.5 0.51.18 23.5 0.3 99.7 0.3
Pan 23.0 0.3 100.0 0.08943.2 100.0
Table B.12: Results from 10 mm Aggregate Sieve Analysis.
Sieve Size
Mass Retained
% Mass Retained
Cumulitive Percentage Retained
Percent Passing
13.2 0.0 0.0 0.0 100.09.5 193.4 7.4 7.4 92.6
4.75 2281.2 87.7 95.2 4.82.36 59.2 2.3 97.4 2.61.18 23.0 0.9 98.3 1.7
Pan 43.5 1.7 100.0 0.02600.3 100.0
Table B.13: Results from 7 mm Aggregate Sieve Analysis.
Sieve Size
Mass Retained
% Mass Retained
Cumulitive Percentage Retained
Percent Passing
9.5 0.0 0.0 0.0 100.04.75 280.9 76.3 76.3 23.72.36 75.5 20.5 96.8 3.21.18 4.8 1.3 98.1 1.9
Pan 7.1 1.9 100.0 0.0368.3 100.0
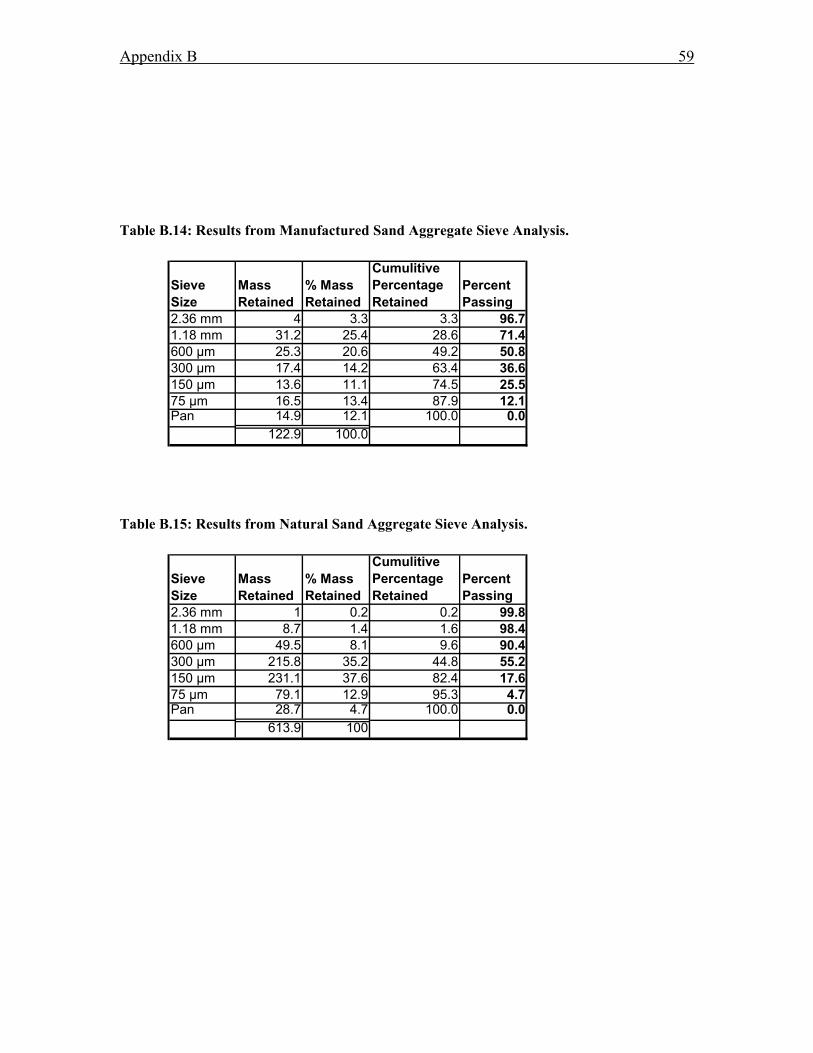
Appendix B 59
Table B.14: Results from Manufactured Sand Aggregate Sieve Analysis.
Sieve Size
Mass Retained
% Mass Retained
Cumulitive Percentage Retained
Percent Passing
2.36 mm 4 3.3 3.3 96.71.18 mm 31.2 25.4 28.6 71.4600 µm 25.3 20.6 49.2 50.8300 µm 17.4 14.2 63.4 36.6150 µm 13.6 11.1 74.5 25.575 µm 16.5 13.4 87.9 12.1Pan 14.9 12.1 100.0 0.0
122.9 100.0
Table B.15: Results from Natural Sand Aggregate Sieve Analysis.
Sieve Size
Mass Retained
% Mass Retained
Cumulitive Percentage Retained
Percent Passing
2.36 mm 1 0.2 0.2 99.81.18 mm 8.7 1.4 1.6 98.4600 µm 49.5 8.1 9.6 90.4300 µm 215.8 35.2 44.8 55.2150 µm 231.1 37.6 82.4 17.675 µm 79.1 12.9 95.3 4.7Pan 28.7 4.7 100.0 0.0
613.9 100
References 60
References
Cement and Concrete Association of Australia & Standards Australia 2002, Guide to
Concrete Construction, Cement and Concrete Association of Australis, Sydney
Cement Admixtures Association 1977, Concrete Admixtures: Use and Application,
Construction Press, New York
Hudson, B. 1999b, ‘Concrete Workability with High Fines Content Sands’, Quarry, vol.
7, February 1999, pp. 22-25
Corrigan, B., D’Sourza, B. Dumitru, I., (Year Unknown), ‘New Generation Admixture
for Improvement of Concrete with Manufactured Sands’, Publication Unknown,

Bibliography 61
Bibliography
Eglington, M.S., 1987, Concrete and its Chemical Behaviour, T.Elford, London.
Young, J.F., (et, al), 1998, The Science and technology of Civil Engineering Materials,
Prentice Hall, New Jersey.
ACI committee 212 1993, Guide for the use of High Range Water reducing Admixtures
in Concrete, American Concrete Institute, Michigan.
Lewis, M 1988, Two Hundred years of Concrete in Australia, Concrete Institute of
Australia, Sydney.
Jackson, N & Dhir R 1996 Civil Engineering Materials, 5th edition, MacMillan, London.
Dumitru, I., Smorchevsky, G., Formosa, M. 1999, ‘Further Investigation into the Effects
of Manufactured Sand in Concrete’, Quarry, vol. 7, January 1999, pp. 35-42..
Hudson, B., 1998, ‘Impact of Manufactured Sand in Concrete’, Quarry, vol. 6, December
1998, pp. 31-34.
Bibliography 62
Hudson, B. 1999a, ‘Investigating the Impact of High Fines in Concrete’, Quarry, vol. 7,
January 1999, pp. 44-46.
O’Flynn, M.L. 2000, Manufactured Sands from Hard rock Quarries: Environmental
Solution or Dilemma for South East Queensland?’. Australian Journal of Earth Science
(2000) 47, 65 – 73.