the economic impacts of aquatic invasive species: a review ......further study, pimentel et al....
TRANSCRIPT
The Economic Impacts of Aquatic Invasive Species A Review of the Literature
Sabrina J Lovell and Susan F Stone
Working Paper Series
Working Paper 05-02 January 2005
US Environmental Protection Agency National Center for Environmental Economics 1200 Pennsylvania Avenue NW (MC 1809) Washington DC 20460 httpwwwepagoveconomics
The Economic Impacts of Aquatic Invasive Species A Review of the Literature
Sabrina J Lovell and Susan F Stone
Correspondence
Susan F Stone 1200 Pennsylvania Ave
Mail Code 1809T Washington DC 20460
202-566-2351 stonesusanfepagov
NCEE Working Paper Series
Working Paper 05-02 January 2005
DISCLAIMER The views expressed in this paper are those of the author(s) and do not necessarily represent those of the US Environmental Protection Agency In addition although the research described in this paper may have been funded entirely or in part by the US Environmental Protection Agency it has not been subjected to the Agencys required peer and policy review No official Agency endorsement should be inferred
THE ECONOMIC IMPACTS OF AQUATIC INVASIVE SPECIES A REVIEW OF THE LITERATURE
Sabrina J Lovell and Susan F Stone National Center for Environmental Economics
US EPA January 2005
Abstract Invasive species are a growing threat in the United States causing losses in
biodiversity changes in ecosystems and impacts to economic enterprises such as agriculture forestry fisheries power production and international trade The costs of preventing and controlling invasive species are not well understood or documented but estimates indicate that the costs are quite high in the range of millions to billions of dollars per year EPArsquos Office of Water needs to develop a national estimate of the costs of aquatic invasive species and the benefits of control This review of the economic literature on invasive species is the first stage in the development of that estimate The review includes studies on fish mollusks crustaceans invertebrates and plants There are few theoretical and even fewer empirical studies dealing with the economic costs of aquatic invasive species Due to the high level of invasions in the Great Lakes a number of studies focus on species found there and on Zebra Mussels in particular The aquatic studies reviewed show values ranging from several hundreds of thousands of dollars a year to tens of millions of dollars a year It seems apparent that a systematic approach is needed to develop a consistent method to estimate such costs As the literature points out invasive species and their control have definite public good aspects and thus call for some level of government intervention However to what extent and what form that intervention takes place depends on myriad of issues associated with both the region and the species involved Optimal policy appears to be as unique as the individual species or ecosystem it is attempting to control and protect
Key Words Aquatic Invasive Species Costs Literature Review Subject Matter Categories MarineCoastal Zone Resources Economic Damagesbenefits Biodiversity
Contact Susan F Stone Sabrina Lovell 1200 Pennsylvania Ave NW 1200 Pennsylvania Ave NW MC 1809T MC 1809T Washington DC 20046 Washington DC 20046 202-566-2351 202-566-2272 Stonesusanfepagov ise- lovellsabrinaepagov
1
Introduction
Invasive species are a growing threat in the United States causing losses in
biodiversity changes in ecosystems and impacts to economic enterprises such as
agriculture forestry fisheries power production and international trade An lsquoinvasive
speciesrsquo is a species that is ldquo1) non-native to the ecosystem under consideration and 2)
whose introduction causes or is likely to cause economic or environmental harm or harm
to human healthrdquo (Executive Order 13112 Appendix 1 1999)1 Not all non-native or
non- indigenous species (NIS) become lsquoinvasiversquo Some fail to thrive in their new
environment and die off naturally Others survive but without destroying or replacing
native species Most introduced species do not meet the standards defined in Executive
Order 13112 as lsquoinvasiversquo (NISC 2000) However those that do meet the definition have
the ability to cause great harm on the ecosystem About 400 of the 958 species listed as
threatened or endangered under the Endangered Species Act are considered to be at risk
primarily because of competition with and predation by invasive species (Wilcove et al
1998)
The means and routes by which species are introduced into new environments are
called lsquopathwaysrsquo Some species that become invasive are intentionally imported and
escape from captivity or are carelessly released into the environment Other invasives are
unintentionally imported arriving through livestock and produce or by transport
equipment such as packing material or a shiprsquos ballast water Fish and shellfish pathogens
and parasites have been introduced unintentionally into the US in infected stock
destined for aquaculture Crates and containers can harbor snails slugs mollusks beetles
1 For a full description of the Executive Order see httpwwwinvasivespeciesgovlawsmainshtml
2
and other orga nisms Military cargo transport may also harbor unintended species
Stimulated by the expansion of the global transport of goods and people the numbers and
costs of invasive species are rising at an alarming rate (NISC 2001) The cost to
preventing and controlling invasive species is not well understood or documented but
estimates indicate that the costs are quite high in the range of millions to billions of
dollars per year (OTA 1993 Pimental et al 2000) EPArsquos Office of Water is interested in
developing a national estimate of the costs of aquatic invasive species and the benefits of
control This review of the economic literature on invasive species is the first stage in the
development of that estimate
Both theoretical and empirical studies are included in this review In general the
review was limited to studies dealing with aquatic or aquatic related species and does not
include estimates of the costs of invasive agricultural weeds and other purely terrestrial
species Studies dealing with the general economic aspect of the problem are included
even if they do not focus on aquatic species per se Many of the studies focus on aquatic
invasive species in the Great Lakes due to the large amount of ship traffic and
corresponding potential for invasion from ballast water Since the 1800rsquos over 145
nonindigenous aquatic species have become established there including 24 species of
fish 9 mollusks and 61 species of plants (Dohnahue 1999 Horan and Lupi 2004)
General Cost Studies
There are two studies which tried to estimate the total cost of invasive species in
the United States The first is ldquoHarmful Non-Indigenous Species in the United Statesrdquo by
the Office of Technology Assessment of the US Congress (1993) It details both the
3
ecological impacts and estimated economic impacts of those invasive species considered
harmful rather than all invasive species inhabiting the nation It also considers native
US species outside of their natural ranges as invasive Over the period examined in the
report (1906-1991) 59 of introduced species to the US have caused economic or
ecological harm The report estimated the total cost of damages related to 79 harmful
species to be $97 billion with a lsquoworst casersquo scenario total cost of $137 billion The $97shy
137 billion estimate is the cumulative cost of invasive species to agriculture forestry
fisheries and other water uses utilities buildings and natural areas
For aquatic invasives OTA considered 111 species of fish (88 of total known
invasives) and 88 mollusks (97) Of the 76 fish species intentionally introduced 35
have caused harm and of the 26 unintentionally introduced in the US 10 species are
considered invasive according to the report For mollusks 5 out of 10 intentionally
introduced and 27 of the 67 unintentionally introduced species have caused harm Of
those considered 4 fish species and 15 mollusk species had high negative impacts The
list of high impact aquatic species include the Sea lamprey Zebra Mussel and Asian
clam OTA estimated that the cumulative loss to the US for the period 1906-1991 for 3
harmful fish species was $467 million (1991 dollars) and $1207 million for 3 aquatic
invertebrates In terms of aquatic or riparian plants high impact species include the Salt
Cedar Purple Loosestrife Melaluca and Hydrilla OTA reports that spending on control
of aquatic plants in the US is $100 million per year
Pimentel et al (2000) produced a more recent study attempting to update and
expand these costs estimates At the time of the OTA study they estimated the total
number of harmful species in the US to be 4500 Pimentel et al (2000) estimated 5000
4
and by 2004 that estimate had increased to over 6000 (Burnham 2004) Invasive weeds
are spreading and invading approximately 700000 hayr of US wildlife habitat
(Pimentel et al 2000) Examining a series of case studies the Pimentel study estimates
the total economic damages and associated control costs for the US due to ldquoharmful
non- indigenous speciesrdquo is $138 billion annually They attribute their higher estimate
(vis a vis the OTA study) to the broader base at which they look and the increase in the
economic cost estimates available for many invasive species However they also
characterize their cost estimates as low because the study does not take into account the
extensive ecosystem damage caused by these species
The Pimentel study has a number of flaws First the methods applied to
estimating costs are anecdotal in nature No systematic empirical methods of estimating
costs which would have provided a statistical basis to judge the validity of the estimates
were applied There was also no attempt to incorporate ecosystems services Finally
there was no explicit consideration of the potential benefits provided by some of these
invasive species (such as the recreational benefits from introduced game fish) While the
effects arrived at by Pimentel are widely cited these flaws tend to undermine the
credibility of the numbers Both the OTA (1993) and the Pimentel et al (2000) studies
illustrate the difficulty in quantifying the harm done to both the economy and the
ecosystem by invasive species Both studies point to the lack of data available to
adequately estimate costs that would help put the problem in some perspective In a
further study Pimentel et al (2001) look at the impact of invasive species on 6 countries
including the United States stating that over 120000 NIS have invaded these regions at
estimated costs of over US$314 billion per year in damages For the US they report
5
estimated US$1 billion a year in environmental losses alone from introduced fish
US$213 billion from arthropods and US$13 billion from mollusks
Government spending on invasives may be a furthe r guide in estimating costs In
19992000 the federal government spent $459 million and $556 million respectively for
invasive species activities For fish and aquatic invertebrates $204 million in federal
funding was given out in 1999 (GAO 2000) The US Geological Service Aquatic
Nuisance Species Program had a $55 million budget for the National Biological
Research Divisionrsquos Invasive Species Program The US Coast Guard has a total of $45
million annually for invasive related activities mostly focused on ballast water programs
and surveys (Sturtevant and Cangelosi 2000)
Theoretical Economic Research and Models
Very few studies dealing with invasive species exist in the formal economics
literature Of those that are available they primarily concentrate on theoretical
considerations with relatively little empirical analysis A number of papers concentrate
on issues related to trade Others develop models of the risk of invasive species or
incorporate both ecological and economic models
Evans (2003) lays out the economic dimensions of invasive species and why
economics is increasingly called upon to understand the issues The causes of biological
invasions are often related to economic activities and furthermore the economic
consequences of invasives are broader than just direct control costs and damages The
economic impacts of trade barriers that attempt to prevent an invasive species from
entering the US are becoming more complicated Economic modeling expertise is
6
important for understanding the issues involved Economic models of the value of
nonmarketed environmental and health effects can also be called upon to understand
many of the impacts of invasives beyond control costs Evans notes that the impacts of
invasives can be classified into 6 types production price and market effects trade food
security and nutrition and financial costs
Perrings et al (2002) frame the issue of control of invasive species as a public
good and discuss why both the causes of invasive species and the solutions are primarily
economic in nature They point out that the full economic costs of invasive species
include the effects on native ecosystems and the human populations that depend on such
ecosystems and are not limited to just the damage or control costs The authors point out
that little investigation has been done into the economic and social causes of biological
invasions which are often the result of decisions related to land use and conversion of
habitat the use of certain species in production or consumption and global movement of
people and products Economic drivers such as property rights trade rules and prices
often influence these decisions Human behavior influences the probability of invasives
becoming established as well as their spread specifically how people respond to the
threat of invasives by either mitigation or adaptation The control of the risk of invasives
has a public good element in the sense that the benefits of control are neither rival nor
exclusive In other words control can protect one person or group without excluding
those benefits on another or reducing the benefit implying the need for government
involvement Further effective control of invasives is only as good as the weakest
provider of control If even one nation or state does not provide adequate control a
7
species can spread and cause damage to all This argues for a coordinated response
among affected parties both the sources and recipients of the invasive species
Shogren (2000) addresses the issue of incorporating economics into risk reduction
strategies for invasive species using a model of endogenous risk The model represents
the choices available to a policy maker regarding the allocation of resources to reduce the
risk of invasive species by both mitigation and adaptation Throughout the paper the
point is made that economics should be included in risk assessment to improve the
effectiveness of such assessment The study finds that a higher risk of invasive species
increases adaptation but the effect on mitigation depends on whether or not mitigation
and adaptation are substitutes or complements The paper does not provide any empirical
examples
Horan et al (2002) address the appropriate level of preinvasion control of
invasive species and show how decisions can be made both when full information is
available and when there is a high degree of uncertainty about invasions They start with
the premise that decision models based on standard economic expected utility theory
provide little guidance in the case of invasive species This occurs because of the
probabilities associated with invasions they exhibit both a low probability of occurring
but often have catastrophic consequences when they do occur Expected utility theory is
insensitive to this type of risk Risk management models are thus better suited for
analyzing strategies of preinvasion control They set up two models one under full
information and one under ignorance The first the risk-management model assumes
that firms are potential carriers of an invading species Each firm makes choices on
production and biosecurity control Based on its choices and environmental conditions
8
there is some probability that a species will be introduced and will successfully invade
the new ecosystem Invasions from one firm are independent of those from other firms
The probability of invasion increases with the number of firms and decreases with
biosecurity measures The model minimizes the expected social cost of invasions and
control using the cost of control and the expected damages of invasion At the optimal
level of control the marginal cost of taking a control action equals the marginal expected
benefits as measured by the reduction in damages The risk of invasion and damage
impact this marginal level of expected damages This model assumes however that the
risk of invasion (the probability of invasion given choices of firms) is known
In the second model described the risk is unknown and uncertainty and
ignorance of the risk is explicitly modeled The model assumes that a decision maker
will focus on those potential outcomes that will come as the least surprise The model
also assumes that costs and expected damages are minimized but some of the
conclusions differ from the previous model When uncertainty is present more resources
should be devoted to high damage events that are considered more certain even with a
low probability and less resources to those events considered less likely to happen
regardless of the amount of damages While the risk management model supports firm
specific levels of control the uncertainty model advocates that control be spread equally
across firms thus supporting most current policies that are based on uniform mandated
technologies
Thomas and Randall (2000) look at the role information and revocability play in
NIS management by focusing on intentional releases Usually the protocol is to follow
an ex ante approach to fully elucidate the issue before proceeding Ecologists argue
9
against introductions until the full spectrum of implications are understood via the
collection of more and better ex ante information However there is no guarantee (and
indeed an almost certainty) that enough information will ever be collected In addition it
is often costly and a ldquoseemingly endless effortrdquo to gain more information A second
approach is to allow only revocable releases Assuming that marginal costs of damage
avoidance are increasing in both approaches ex ante full information and revocability
the paper argues that improvement in the current procedures could be made by paying a
little less attention to ex ante information and more to revocability
By combining the concept of revocable actions and incentive compatible
behaviour Thomas and Randall present a protocol that first identifies the potentially
affected parties and implements a Coasian liability principle when the affect parties are
known and property rights clearly established This involves the establishment of an
independent oversight authority and an insurance scheme for both public and private
interests wishing to intentionally release non-native species When the affected parties
are large in number andor dispersed the protocol suggests a limited role for the
oversight authority to act on behalf of affected parties The authority would deny permits
to releasing agents that fail to post bonds sufficient to compensate in worst-case damage
scenarios The oversight authority may decide to permit a methodical step-by-step
process of controlled releases designed to make maximum feasible use of revocability
and learning-by-doing Starting with a very small tightly controlled revocable release
and thorough review of the results each subseque nt step would involve larger releases
less rigid controls and lower levels of revocability The process would terminate as soon
as the prospect of a sufficiently harmful outcomes merged with a high probability the
10
harmful outcome could be avoided The success of such an approach is less dependent
on reliable prediction of the consequences of a release based on ex ante information and
more on precommittment to avoid irrevocable actions Moral hazard is avoided by the
establishment of an independent oversight authority to make permitting decisions and the
ex ante assignment of liability to releasing agents
Eiswerth and van Kooten (2002) apply a stochastic optimal control model for
invasive plant species given the uncertainty surrounding the ability to determine efficient
management strategies for any given NIS Sources of uncertainty regarding relevant state
variables include paucity of data measurement errors and substantial variability in
intrinsic rates of spread This means that invasions possess the properties associated with
fuzzy sets and are thereby subject to analysis through fuzzy membership functions They
employ insights from expert panels to develop spread and damage estimates caused by
invasive plants Then similar to Leung et al (2002) they employ the stochastic
dynamic programming model to identify economically optimal management choices
from a portfolio of potential options with the results compared to those of a program that
seeks to eradicate the invasive
Eiswerth and van Kooten apply their model on the decision making process of
agricultural producers faced with harmful invasion of the weed yellow star thistle (YST)
Each producer wants to maximize the present value of future stream of net revenues The
expert panel focused on three potential agricultural land uses grazing on rangeland
grazing on pastureland and harvest of hay from pastureland As the productivity of the
land increases the optimal weed management strategy gravitates toward more expensive
options For rangelands offering lower productivity the optimal strategy is to apply
11
chemicals or to have no control at all At the other end of the spectrum it is optimal to
apply more expensive technologies to irrigated pasture that affords both harvested hay
and summer grazing They conclude by stating that decision making under uncertainty
where experts can provide only linguistic descriptors of the growth of the invasive
species and its potential damages can be beneficial when hard data are unavailable
Bioeconomic Models
Knowler and Barbier (2000) develop a model of an invasive species when there is
competition between the invader and a native species in a given ecosystem The two
principles of their model are that the effects of the invader depend on the exa ct nature of
the interaction and that the correct comparison for determining effects is an ex-ante and
ex-post invasion scenario Their model can accommodate diffusion competition or
predation and is applied to a case study of the effects of a comb-jelly in the Black Sea on
a traditional anchovy fishery Using the model they show a decline in profits due to the
introduction of the comb-jelly Barbier (2001) presents the same model as in his earlier
paper but without the case study
Leung et al (2002) develop a quantitative bioeconomic model that can evaluate
risks and quantify relative benefits of prevention and control strategies for invasive
species The model determines an acceptable level of risk and the impacts on optimal
investments As in earlier papers the authors point out that risk analysis of invasives is
inherently an interdisciplinary problem and requires both economics and ecological
expertise The model is a stochastic dynamic programming model that allows both
ecological and economic factors to simultaneously determine the results on social
12
welfare Both market and non-market values can be included The model was applied to
the case of Zebra Mussels inhabiting a single lake in the Midwest Under different
scenarios results show that the time frame of the analysis mattered in determining an
optimal strategy of prevention and mitigation For a given probability of reducing
invasions the model can determine societyrsquos willingness to pay for which the prevention
costs equal the benefits of prevention However the model did not include nonmarket
benefits was risk-neutral and did not model multiple invasions simultaneously all of
which would be more realistic
Settle and Shogren (2002) model the interaction between native Cutthroat Trout
and introduced Lake Trout in Yellowstone Lake Lake Trout prey on Cutthroat Trout
along with grizzly bears birds of prey and humans These interactions are incorporated
into an ecological-economic model that provides a comparison of optimal policy action
with current policies for removing Lake Trout Humans obtain benefits from the
populations of both fish species as do other non-fish species via harvesting fish catch and
release fishing and nonconsumptive uses such as wildlife viewing The model assumes
there also exists another composite good for which humans derive benefit that does not
depend on any of the species in Yellowstone The management agency the National
Park Service in this case has a fixed budget to spend on one or both of the trout species
along with other non-species related goods (such as road improvements) It seeks to
maximize the net benefits of visitors given this budget The Park Service will optimally
choose a policy that equates the marginal benefit from spending a dollar on removing
Lake Trout with the marginal benefit of improving other park resources (such as roads)
based on the dynamics of the species population interactions and the benefits derived
13
from visitors Three scenarios are considered based on the model both with and without
accounting for the feedback between the economic and ecological model components
The feedback arises from fishermenrsquos behavior as they adjust their catch based on
Cutthroat Trout population size (with less catch when population declines) In the best
case scenario Lake Trout are eliminated right away and with little cost The populations
of Cutthroat Trout stabilize at 27 million without any feedback and stabilize at 34
million with feedback Under the worst case scenario Cutthroat Trout populations
decline to almost zero with no feedback and to 1 million with feedback The current
policy is between these two cases with around 18 million to 24 million Cutthroat Trout
without and with feedback Specifying discount rates and existence values for trout an
optimal large scale Lake Trout control program can be created for $169000
Another paper that looks at invasive management policy incorporating economic
consideration is Olson and Roy (2002) The analysis examines the economics of
controlling a biological invasion whose natural growth and spread is subject to
environmental disturbances outlining conditions under which it is optimal to eradicate
versus conditions under which eradication is not optimal They show that the growth of
the invasion and the associated level of disturbance that leads to slowest expansion plays
a critical role Marginal damages at each point in the future are determined by
multiplying the compound annual growth rate by a unit of the species today The
marginal benefits of control are the expected discounted sum of marginal damages that
are incurred if the species is not controlled The results capture the stochastic nature of
the problem by incorporating both the worst environmental disturbance and the mean of
the disturbances in the analysis
14
The first result of Olson and Roy establishes that if the marginal costs of
eliminating an arbitrarily small invasion are less than the damages from such an invasion
compounded indefinitely at a rate equal to the discounted expected growth of the
invasions then complete eradication is optimal However if the damages from an
arbitrarily small invasion are less than the marginal costs of removing the entire invasion
then it is always optimal to allow some of the invasion to remain For an arbitrarily small
invasion if the damages compound indefinitely at the discounted expected intrinsic
growth rate are less than the marginal costs of eradicating the invasion then the optimal
policy is not to control the invasion at all when it is sufficiently small This then implies
that eventually eradication is not an optimal strategy for an invasion of any size
For a controlled biological invasion that is small the marginal costs of control are
balanced against the infinite geometric sum of intrinsic marginal damages In summing
damages the ratio of successive terms depends on the discounted mean intrinsic rate of
expansion of the invasion If the discounted expected intrinsic growth rate is higher than
one then eradication is optimal for small invasions even if the marginal costs of control
are large relative to marginal damages The reason is that if an invasion is controlled
then it is worth eradicating a small invasion to avoid the rapid growth in future costs that
accompany a higher expansion rate of the NIS As an invasion approaches its ecological
limit its marginal growth rate necessarily falls below one Hence for large invasions it is
the interaction of costs and damages with the discount rate and the invasion growth rate
that determines whether eradication is optimal or not The magnitude of the disturbance
that leads to the slowest expansion plays a critical role but not its probability The
15
combination of control and the inevitability of a sufficient number of bad disturbances
eventually leads to eradication
Trade-Related Studies
It is a generally accepted principle that trade provides a major conduit for the
introduction of invasive species OTA (1993) estimates that 81 percent of invasive weeds
have entered the United States via commodity transport Species lsquohitchhikersquo on
commodities packing materials and transport vessels especially ships2 The World
Wildlife Fund (WWF) estimates that as many as 4000 different species can hitch-hike in
typical shipsrsquo ballast at any one time (Plant Ark 2004)
Expanding volumes and diversity of trade are seen as having contributed to the
growth of invasives in the United States The expansion of trading partners has served to
produce an array of possible invaders Historically damage (either actual or anticipated)
from the establishment of invasive species has led to import bans or quarantine measures
on all commodities from countries known to harbor the NIS (Lynch 2002) These bans
andor quarantine measures designed to protect plants from other plants weeds insect
and pathogens are called phytosanitary regulations Because tariff levels in the world
have decreased since the first GATT agreement3 these phytosanitary regulations (also
called non tariff or technical barriers to trade) are more likely to be binding In addition
as countries attempt to protect domestic producers competing with foreign counterparts
without the benefit of tariffs governments may use these types of trade barriers as a nonshy
2 More infamous examples of hitchhiking species include the Zebra Mussel (Dreissena polymorpha) and the Asian Clam (Corbicula fluminea)3 The General Agreement on Tariffs and Trade (GATT) was succeeded by the World Trade Organization (WTO) in 1995
16
transparent means of protectionism even when little scientific basis for these regulations
exist As a result measures instituted to protect domestic ecosystems at the expense of
trade are coming under increasing scrutiny
There are two distinct concerns regarding increased globalization and the
occurrence of trade with respect to NIS The first is that increased trade will bring with it
a global homogenization that will lead to a decline in diversity Indeed Polasky Costello
and McAusland (2004) argue that trade increases specialization in production which in
turn promotes specialization in ecosystems and their associated biodiversity Trade
affects habitat loss through conversion of land for economically driven uses such as
agriculture forestry and expansion of urban areas When trade partners have similar
species trade has little effect on global biodiversity but may affect it at the local level
On the other hand with endemism specialization can cause significant declines in both
local and global biodiversity This loss in biodiversity may reduce the overall utility
gains associated with moves toward free trade
The second concern about free trade is that increases in standards of living
leading to increases in import demand will increase the probability of NIS (Jenkins
1996) Given that most NIS are brought to their new homes unintentionally in ballast
water packing material and cargo the resulting invasions represent market failure rooted
in international trade (Margolis and Shogren 2004)
Establishing a definitive link between NIS and trade is not easy stemming mostly
from data issues Estimates of introductions are usually species or region specific while
trade data tend to be reported by commodity or country of origin Also there is a
difference in time horizon between the two Trade volumes can be measured monthly
17
quarterly or annually while species introduction and eventual propagation is measured
in terms of weeks months years and even decades Finally while trade data is provided
in a relatively detailed and abundant manner data on NIS are of notoriously poor quality
(see for example Nozic et al 2000 or Pimentel et al 2000) Thus there have been few
attempts to quantify the link between trade and invasives The exceptions to this are
discussed below
Dalmazzone (2000) examines whether available data support the contention that
economic activities in general and trade in particular are correlated with NIS He tests
which activities play a role eit her as pathwaysvectors or by increasing the domestic
economyrsquos susceptibility The study measures the degree to which various economic
factors explain the share of established alien plant species of total native species across
26 countries For example of Egyptrsquos 2015 native plant species there are 86 invasives
representing a share of 0043 The first hypothesis Dalmazzone tested is that invasions
are an increasing function of the openness of the economy (in terms of movement of
goods and services as well as people) He uses trade and tourism as proxies for openness
The second hypothesis is that invasions are an increasing function of the degree to which
natural habitat are disturbed in the course of economic activity For this he uses measures
of grazing land and agricultural activity
The first hypothesis that of openness is marginally rejected Dalmazzone makes
this claim by finding that neither trade (as a percentage of GDP) nor tourism are
statistically significant in explaining the share of NIS However when total trade flows
are measured and imports inserted as a separate measure there is marginal significance
Also trade duties are significant and negative This finding that trade as a percentage of
18
GDP is not significant but imports and duties are seems to support the idea that its not so
much the volume of trade that is important in determining NIS but rather what goods are
traded and from where Duties influence the types and source of goods a country
receives Dalmazzone reports evidence supporting the second hypothesis that is that
economic activity increases the probability of NIS Population is significant and positive
as is per capita GDP Agriculture is also significant but has a negative sign This may
be explained by the fact that agriculture involves a simplification of ecosystems and alien
plants and insects along with indigenous populations are frequently eradicated to
support production
Levine and DrsquoAntonio (2003) attempt to forecast the rate of future invasion by
examining the historical relationship of international trade with the level of invasive
species in the country They apply several different species accumulation models noting
that there is no current consensus as to which performs best Past merchandise trade is
related to accumulated number of biological invasions focusing on insects plant
pathogens and mollusks All three models fit the historical data well4 Their predictions
for increases in NIS introductions as a result of international trade volumes between 2000
and 2020 range between 3 and 61 percent depending on the model and the species
Given the evidence and performance of the models they support the most likely estimate
to be between 15 and 24 percent The paper notes that these values represent less than
twice the number of observed invasions over the 20 year period between 1960 and 1980
in which imports were roughly 10 percent of the amount forecasted for the next twenty
years This would imply that while the rate of introductions may slow the total number
4 The three models were Log-log species area Log-linear species area and Michaelis -Menten
19
of NIS is likely to increase Thus if the 10 percent rule is applied the burden on society
even looking at the lower bound numbers is likely to be large5
The problem with using trade volumes in and of themselves as a predictive tool is
implied in Dalmazzonersquos work He showed that total trade is not a significant predictor
of the rate of species invasion where imports are Types of goods imported modes of
transportation and the type and state of receiving ecosystem are key factors (Colautti et
al 2003) The relationship between NIS and trade is not linear spatially or temporally
Studies on Marine Shipping
Accepting there is a link between trade and NIS what is the most likely vector for
their introduction Those studies that pay passing attention to packing materials or the
commodities themselves usually do so in the context of explaining how the relevant
species arrived in the ecosystem rather than attempting to establish a firm link between
traded items and NIS (OTA 1993 Pimentel et al 2000 Nozic et al 2004) Those studies
that do look at pathways tend to focus on transoceanic shipping as the most likely vector
for invasives especially aquatics There are a number of studies which have attempted to
measure the degree to which shipping plays a role in both the introduction and spread of
NIS
Predicting invasions in estuaries seas and lakes utilized by foreign transoceanic
ships is difficult because these ecosystems are impacted by many human activities not
just trade Also successful invasions may dramatically change the ecosystem potentially
increasing vulnerability Thus as stated above an increase in NIS may have more to do
with an increase susceptibility than trade volumes Invasives may interact and effect
5 Rule of thumb states that 10 of the species introduced will become invasive
20
distribution or colonization of existing NIS Finally in systems subject to multiple
mechanisms or introductions it is difficult to predict the timing or types of species trade
is responsible for introducing (Horan and Lupi 2004)
Fernandez (2004) examines under what conditions various invasive species
management programs are optimal given that the goal of the regulating port is to
minimize social costs of shipping including any potential environmental impacts The
shipperrsquos objective is to maximize expected profits The paper shows that using
estimated costs of various management techniques used to control for invasive species
(ballast water treatment or exchange and biofouling) ships maximize profits by
biofouling alone in the absence of existing subsidies or taxes This result is important
given that most regulation (including IMO standards) focus on ballast water The
potential for cross media multiple externalities adds an index of invasive species damage
severity to the mix Given imperfect information most shippers know they will
ultimately bear the cost of only a fraction of any damage they cause This causes their
optimal chose of ballast management and biofouling management to diverge from the
socially optimal choice
Fernandez shows that by applying an incentive mechanism consisting of two
subsidies (one based on per unit ballast water and the other a lump sum) and depending
on the shipperrsquos anticipated liability share of the damage a socially optimal mix of
ballast management and biofouling management can be achieved This is done through a
lump-sum subsidy that the port pays to ensure the shipper reports its true anticipated
damage rate As the shipper reports larger values of anticipated damage the two
subsidies vary inversely with respect to one another If the shipper reports small values
21
that is if the shipper reports that its liability share for cross media damages will likely be
small then a large per unit ballast water subsidy is chosen by the regulating port This is
because an unregulated shipper would otherwise discount cross media damages and
select an inefficiently low level of ballast water abatement and an inefficiently high level
of biofouling abatement As the shipperrsquos reported value increases the shippers
increasing liability for multiples externality damages serves as an increasingly sufficient
incentive for it to select the socially optimal combination of ballast and biofouling As a
result the per unit ballast water subsidy necessary to ensure that the firm selects the
socially optimal combination decreases If the regulator relied on the ballast water
subsidy as the sole policy instrument the shipper would have the incentive to report
small values of anticipated damages regardless of the true liability in order to manipulate
the regulating port into providing large ballast water subsidies The regulating port thus
can use the lump sum subsidy to combat the shippers incentive to report false values of
anticipated damages
Colautti et al (2003) also examine transoceanic shipping as a possible vector for
NIS focusing on the Great Lakes Given the lakes are a freshwater ecosystems closely
association with human activity they are particularly vulnerable to NIS There are two
ways Great Lakes receive NIS from ballast tanks The first is through large volumes of
water from a small number of ships that enter the region with saline ballast water
(ldquoballastrdquo ships) The second is from large numbers of ships that enter loaded with
cargo and fill their tanks in lakes as they discharge cargo (ldquono ballastrdquo vessels) The
loaded water mixes with the residual water containing both living organisms and resting
stages in the tanks As these ldquono ballastrdquo ships trade around loading cargo and
22
subsequently discharging ballast they may facilitate invasion The paper attempts to
determine the relative importance of the two types of introduction
There is evidence (MacIsaac et al 2002) that propagule pressure of individual
ships that enter the Great Lakes loaded with cargo and that declare no ballast on board is
typically one to two orders of magnitude higher than that of vessels that exchange ballast
water Because no ballast vessels dominate (about 90 percent) the inbound traffic of the
Great Lakes these vessels collectively appear to pose the greatest risk of new
introductions even though their individual risks are lower than ballast ships
According to Colautti et al (2003) the fraction of inbound ldquoballastrdquo ships has
fallen sharply throughout the 1980s and 1990s and is thought to have leveled off in recent
years Inbound traffic has been dominated by ships from Europe which account for
about 88 percent of the top 10 vessels source region Thus many of the NIS in the Great
Lakes are from habitats in Europe notable the Baltic Sea and lower Rhine River areas
The first port of call for most (52 ) of ballast ships is Lake Superior While the first no
ballast vessels ports of call are Lake Ontario (about 40 ) and Lake Erie (about 43 )
the majority of deballasting still takes place in Lake Superior (even when itrsquos the third or
fourth stop) Thus Lake Superior receives more discharges than all other lakes
combined
While Lake Superior gets more ballast water the lower lakes report more NIS
The paper suggest several reasons why this may be so
1 Lake Superior is not as supportive of an environment Smith et al (1999) show
that in the upper Chesapeake Bay relatively few ballast mediated NIS are found
due to adverse environmental conditions
23
2 There are NIS but they remain undetected due to bias and low sample effort
(most research is done on the lower lakes)
3 Lake Superior hasnrsquot been altered physically chemically or biologically to extent
of the lower lakes (although some ports are similar in terms of human use and
physical-chemical stresses)
4 Ships may not deballast and port as assumed by the model (ie en route) so lower
lakes are actually getting more than shown
5 NIS could be hull fouling (hull anchor chain etc) and not originating from
ballast although the authors heavily discount this explanation
The results of the Colautti study imply that policies should have greater emphasis
on invasions mediated by resting stages in ships sediment and less on ballast water it self
Resting stages are less likely to be purged during ballast exchange because they reside at
the bottom of tanks and are less likely to be killed by saline when tanks are refilled To
date however most policies still focus on ballast water exchange Beginning in 1993
with the implementation of the US Nonindegenous Aquatic Nuisance Prevention and
Control Act of 1990 and later by the US National Invasive Species Act of 1996 and the
Canadian Shipping Act of 1998 oceanic ballast water exchange (BWE) was mandated
and remains the predominate approach to prevention The BWE legislation implemented
in 1993 stipulated that ships must deballast in open water not less than 2K deep and at
least 320Km from nearest coast line
24
In February 2004 a new international ballast water convention was adopted This
International Convention for the Control and Management of Ships Ballast Water and
Sediment will enter into force 12 months after ratification by 30 countries representing
35 of the worldrsquos merchandise shipping tonnage Domestically the US Coast Guard
currently requires all vessels transiting to US waters with ballast water that was taken
within 200 nautical miles of any coast after operating beyond the US Exclusive
Economic Zone (EEZ) conduct one of the following
1 Mid-ocean ballast water exchange prior to entering US waters
2 Retain ballast water on board while in US waters or
3 Use a Coast Guard approved alternative environmental sound to treat the
ballast water
Horan and Lupi (2004) examine the economic efficiency of several compliance
strategies in addition to BWE The paper also argues that there are two features which
complicate the traditional process of emission-based approaches (standards or
incentives) such as outlined in the Colautti et al paper The first is that while not every
vessel will actually emit a species ex ante each vessel is a potential emitter and so
society should benefit from all vessels undertaking biosecurity actions to reduce the
probability of an invasion Second biological emissions are highly stochastic and
essentially unobservable given current monitoring technologies So there is no direct
way to observe or otherwise indirectly measure if a vessel is responsible for an
introduction This makes enforcement problema tic
25
Given this the paper examines the relative efficiency of various economic
incentives for reducing risk of NIS invasion in the Great Lakes where the type of
incentive differs according to the compliance measure used Horan and Lupi consider
various subsidies to reduce risk of an invasion and implement certain biosecurity
measurers However the most effective of these subsidies are shown to be excessively
complex to administer because they would have to be tailored to individual vessels in
accordance with each vesselrsquos marginal environmental impact
Each vessel entering the Great Lakes is a potential carrier of NIS and makes
certain biosecurity decisions based on efforts involved in ballast water exchange the
number and location of stops time at sea use of biocides filtering heat etc The
probability of an invasion is decreasing in biosecurity measures and increasing in those
measures which made introductions more likely (such as the number of stops) Since
damages are presently unknown and perhaps unknowable for many species a useful
method to defining the least cost approach uses probabilistic constraints The marginal
cost of undertaking a particular action equals the imputed marginal value of reduced risk
stemming from the action The marginal value of reduced risk depends on both vessel irsquos
actions and the actions of all other vessels Four biosecurity techniques are identified and
the authors determine which would be most efficient in lowering potential damage due to
three possible invaders (Ponto Caspain species Corophium spp Mysids and Clupeonella
caspia) The efficiency of each of the four techniques is then examined under five
different management strategies
26
The first two management strategies are performance-based approaches while the
last three represent flat subsidies Thus the first two are administratively more difficult
and resource intensive than the last three
The least cost strategy encourages full participation by all vessels with the
aggregate mix of adopted technologies depending on the levels of risk stipulated in the
experiment Ballast water exchange is optimally used more extensively for larger
allowable risk levels As the overall level of risk is reduced the effort required for an
effective ballast transfe r becomes so high that it becomes optimal for some vessels to
incur fixed costs of filtering to take advantage of its low unit cost and high degree of
effectiveness Heatingrsquos high unit costs prevent it from being a preferred option by any
vessel for any risk level The cost of the risk reduction strategy depends on the overall
level of risk assumed At relatively less stringent levels the control costs are 28 percent
larger than in the least cost allocation system At lower levels of acceptable risk the cost
differential falls to less than 10 percent The model shows that all vessels are willing to
participate in this scenario as well
Studies on policy responses
If subsidies can be used to effectively manage threats by individual shippers what
policy options are available at a more aggregate level That is is there an effective way
to manage general trade flows so as to reduce the risk of invasives entering the country
Quarantine and import bans have been the often favored methods over the years (Jenkins
1996) However one must consider the cost of these restrictions including the loss in
27
consumer surplus There are several studies which look at optimal policy responses to
trade in light of these factors
The primary conduit of unintentional introduction of NIS is through agricultural
products timbers packing materials ballast water and tourism However the
relationship between protectionism and the effort to slow invasives by slowing trade is
not simple Freer trade by way of reduced protectionism may even lead to less damage
for some countries because while a decrease in protectionism increases trade volume and
the platform for NIS it also changes the product mix of a country and thus alters
susceptibility (Costello and McAusland 2004)
In a series of papers Costello and McAusland (2003 2004 and with Polasky
2004) examine specific rules for trade and invasives given expected damage rate of
infection in imports and changing production costs of foreign suppliers Most estimates
of NIS costs are derived from crop damage Agriculture related costs make up 90-93
NIS damage of the OTA (1993) estimates and more than half of Pimentelrsquos (2000)
numbers None of these consider ecosystems damages however
The first paper (Costello and McAusland 2003) argues that there may be an upper
bound on the marginal costs associated with invasives with respect to agricultural
activity This is especially true because costs incurred in the absence of viable
populations of non native species are not deducted For example $27 billion of the
Pimentel estimate comes from damages and control costs associated with non native crop
weeds Since it is plausible native species would either become or expand their presence
as weeds in the absence of nonnative species this figure overestimates the true marginal
costs of NIS in this context The article serves as a rdquofirst passrdquorsquo at establishing a
28
theoretical relationship between invasive-related damage and patterns of trade and
protectionism The frequency and severity of damage are related to the extent to which
the host country modifies its natural environment and the frequency of exposure The
frequency of exposure is proxied by volume of imports The paper explores the
relationship between trade protection and NIS within an agricultural framework
Assume a two country two goods model where each country either exports
agricultural goods and imports manufactured goods or vise versa6 The paper defines the
relationship between tariff levels and expected damage from an invasion It relates the
change in expected damage of type k to changes in tariff rates of a series of sensitivity or
elasticity measures These include the elasticity of the arrival rate with respect to the
volume of imports and the elasticity of supply for agricultural goods with respect to its
domestic relative price (both of which are shown to be positive) This implies that the
arrival rate of NIS increases with the volume of imports and this has a positive influence
on the rate of change in damages
The authors then show that the effect of protectionism depends on how responsive
imports are to domestic prices of agriculture goods and thus how import tariff affects
relative price An increase in the tariff on imports reduces the volume of trade and so
long as trade is a conduit of introductions the expected arrival rate of a new NIS will also
fall However this policy will have a distortionary effect on domestic prices which
effects the production mix in an economy If the import tariff causes domestic
agriculture prices to rise this may stimulate domestic production affecting the extent to
which the country is susceptible to damage
6 Assuming constant returns to scale and competitive markets
29
The fact that an import tariff may raise the expected damage a rising from
invasive species comes from the fact that augmented damages depend in part on the
sensitivity of those types of damages to agricultural output It also depends on the
elasticity of the introduction rate with respect to the volume of imports The assumption
made in the paper is that the latter term equals 1 and derives from the simple fact that
while contamination rates of traded goods appear to vary with the country of origin and
by the mode of transport these characteristics are unaffected by a uniform barrier to trade
such as a tariff Moreover there is no evidence that the rate of hitchhiking is anything
but proportional to the volume of a given commodity traded for a given trade partner
However to the extent that changing tariffs change a countryrsquos mix of partners andor
commodities this assumption may not hold
Overall there is a general prediction that barriers to trade are more likely to
backfire as a means of preventing damage from exotic species when the country in
question is an importer of agricultural goods when the countryrsquos citizens are in a high
income group and so demand for agriculture goods is price insensitive and when there is
substantial potential for domestic agriculture to expand in response to high local prices
The paper focuses on agriculture using crop damage as a proxy for total damage
Estimates of invasion-related damage that are based on one type of damage may be
misleading however particularly if we believe pecuniary losses to agricultural production
are more easily observed than ecological damage from NIS Most real world estimates of
invasion related damage derive predominately from estimates of damage to crops and
livestock Only a small amount of funds in the US are spent on non-crop related
measures (GAO 2001) Also policy changes that lead to reduced crop damages (ie
30
reduced protectionism) may simultaneously increase ecological damages If we treat
damages arising in agriculture as a proxy for overall costs related to invasives we may
misjudge not only the magnitude of these costs but other qualitative effect that trade
policy has on the problem No averting behavior is considered in their model They
assume that industrial mix respond to producer prices but not net harvest rates In an
economy in which producers face undistorted (ie world) prices such behavior (eg
switching from corn to wheat) may reduce the magnitude but not change the sign of
crop damage imposed However if producers initially faced distorted prices than
biological invasions may actually generate net benefits by getting farmers out of
subsidizing behavior which may have ecological benefits (such as irrigating) The study
also does not consider eradication control or monitoring behavior
The second paper (McAusland and Costello 2004) examines substitutability and
complementarities between two different policy tools aimed at minimizing introductions
The two policies are tariffs and inspections The first best strategy would seem to support
adopting an optimal Pigouvain tariff which would internalize the externality caused by
trade However since trade itself is not the problem there is also an argument that it
should not be suppressed rather inspections should be designed to optimally weed out
some most offensive individuals The paper develops a series of optimal strategies
depending on infection rates of imports anticipated marginal damages from infected but
undetected imports and consumer surplus The importing countryrsquos incentive to
undertake port inspections is to minimize the costs associated with trade in infected
goods by balancing the costs of additional inspections and more rejections of incoming
goods with benefits of fewer infected units making it past inspectors
31
Optimal tariff and inspection mix with respect to infection rates
As a starting point if the fraction of contaminated goods is sufficiently high or
production costs are high or marginal damage is low then it is preferable to simply
accept all goods received uninspected and charge a tariff equal to anticipated damages
based on expected infection rates However as infection rates rise then a given level of
inspections is more productive (ie detected cases) As more infected units are detected
more are subsequently barred which reduces imported quantities This in turn raises the
price of imports and thus the opportunity cost of rejecting a unit As long as infection
rates are low to begin with then the rate at which prices respond to inspections is low and
more inspections increase welfare When infection rates are higher to begin with the rate
at which prices respond increase and there is a higher opportunity cost At this point an
increase in inspections decreases welfare
The homersquos optimal tariff also increases with infection rate but absolutely so that
the higher the infection rate the more inspections are redundant When initially detected
infected units is low but the actual infection rate is high inspections should increase
increasing in the cost-recovery portion of the tariff But even as more inspections lead to
increased opportunity costs the higher infection rates imply an increase in expected
damages thus higher tariff rates needed to cover the cost of the damage7
Optimal tariff and inspection mix with respect to anticipated damage
7 However increasing inspections could actually decrease the probability of undetected NIS getting in the country so the tariff needed to cover the anticipated damages may actually decline Therefore the paper states that tariffs tend to increase with infection rates
32
An increase in the marginal damage from infected imports unambiguously
requires greater inspections but because stricter monitoring reduces the proportion of
units that will be accepted to begin with the optimal trade tax may instead become
smaller That is an importer may want to treat goods harboring more dangerous
contaminants with harsher inspections but smaller trade tariffs So the importerrsquos policy
mix should be based on the level of infection rates as well as anticipated damage for
undetected infected goods If anticipated damage is high more inspections are needed
but the good should be subjected to lower tariffs If infection rates are high the more
efficient strategy is to rely on tariffs and less on inspections
The paper goes in to discuss how the policy mix is affected with a change in
production cost in a foreign country and with multiple trading partners Rising foreign
costs lowers exports and imports and raises the consumer surplus for the last good
accepted making rejecting units less attractive at the margin With many trading
partners the importer wants to set policy so as to maximize trade with the most efficient
partner (in terms of some combination of production costs infection rates and damage) it
is more effective to do so through tariff policy than inspections However this may be
difficult given international trading rules Domestic policy formation must take place
within the larger framework of regional and global trade policy
Policy in an international context
As stated above the rules for international trade that allow countries to implement
regulation to protect human and plant life (sanitary and phytosanitary rules especiallymay
also be used as disguised protectionism Indeed once rules are established it becomes
33
difficult to objectively distinguish genuine attempts to protect home country ecosystems
and attempts to protect home country producers Margolis and Shogren (2004) apply
Grossman and Helpmanrsquos model of political economy in tariff formation in the presence
of interest groups and add externalities in trade Thus the governmentrsquos objective
function now incorporates a damage term from potential NIS By incorporating the
invasive species externality of trade into the predominate model of the political economic
of tariff formation the paper shows that countries freely setting tariffs will add this the
external damage to the tariff chosen
Grossman and Helpmanrsquos model illustrates the gap between equilibrium and
optimum policy when political contributions are introduced to the government objective
function In this context the gap is a logical measure for disguised protectionism The
most important feature of the model is that the two components of the tariff - disguise
protectionism and internalization of invasive damage ndash cannot be distinguished without
knowledge of either the social damage vector or the weight the government places on
public welfare neither of which are directly observable In this context there is no way to
design trade rules that will reduce disguised protectionism without nations giving
international bodies the right to decide how much value to place on public goods
endangered by NIS As with other such issues (eg GMOs) it is likely individual
countries will be resistant to allowing domestic NIS policy be determined by international
bodies such as the WTO
Margolis and Shogren conclude by observing that public polices to control NIS
are not immune from political pressures They find that private political contributions
cause the regulators to select a tariff level that exceeds socially optimal levels Free trade
34
is also constrained with the invasive species tariff being set higher than it would be if the
government were not influenced by rent seeking contributors This gap is disguised
protectionism created by the existence of the externality NIS Good intentions aimed at
reducing risks to native ecosystems from NIS can thus be leveraged into protectionists
policies
As shown by the review thus far there have been two broad policy approaches to
control NIS one focusing on vector (usually shipping) and the other on limiting the
amount of imports entering the country either by quarantine bans or tariffs or by customs
or port inspections
The US is bound by two major trade regimes NAFTA and WTO The WTOrsquos
legal framework imposes the principle of national treatment which requires importing
countries treat foreign goods the same way they treat ldquolikerdquo domestic goods (Article III)
There are general exceptions to this which include measures ldquonecessary to protect human
animal or plant life or healthrdquo (XXb) and those ldquorelating to conversion of exhaustible
resourcesrdquo (XXg)8 Disputes arising over the meaning of these two passages led to two
agreements SPS (Sanitary Phytosanitary) dealing specifically with issues of human
animal and plant health and TBT (technical barriers to trade) dealing with coordination
of product regulations and setting criteria for imposing potentially discriminatory
technical standard on imports SPS standards are based on risk assessment Within this
context ldquozerordquo risk has been accepted as a reasonable goal for a country to pursue The
agreements encourage full disclosure of scientific information and symmetry of
information among members For TBT the idea is for standards to be made in terms of
8 See httpwwwwtoorgenglishthewto_ewhatis_ewhatis_ehtmfor a complete discussion of the trading rules and processes under the WTO framework
35
product specifications or characteristics that can be measured at the border not in
production or process standards There is no equivalent requirement for scientific
assessment in TBT issues
The risk assessment process under SPS standards is not inconsequential and the
cost of conducting such analysis can be prohibitive For example a dispute surrounding
the import of raw Siberian larch (timber) called for a risk assessment that cost in excess
of $500000 (Jenkins 1996) If international trade authorities set standards to determine
how invasive species risks should be measured or assessed then trade regulation decision
based on these standards could have the potential to overrule tougher national state or
local regulations (Jenkins 1996 and OTA 1993) The results could lead to weaker
overall standards and greater threats of biodiversity loss Exporting countries with little
or no NIS standards could resist the more onerous standards imposed by strict importing
countries Thus increasing border protection measures imposed domestically have the
potential to be challenged in the WTO framework There are provisions within the WTO
framework that allow countries to uphold tougher domestic standards as long as they are
not in conflict with agreed-to WTO rules
As compared with the WTO NAFTA allows national governments more latitude
over their technical standards and SPS measures which could impact policy surrounding
invasive species The first burden of proof is assigned to the plaintiff or party
challenging the protection measure Arbitration cases may be heard by either a NAFTA
or a WTO committee at the option of the defending party NAFTA also established the
North American Commission for Environmental Cooperation (CEC) The CEC
strengthens regulators under NAFTA in two ways First it explicitly states that an SPS
36
measure does not have to be the least trade restrictive option to be considered ldquonecessaryrdquo
to achieve its goal Second the scientific basis for setting levels of allowable risk in SPS
measures is determined by the regulating authority (the defendant) not by a dispute
settlement panel
A recent study by the CEC (Perrault et al 2003) showed the NIS impacts from
regional trade primarily exacerbates impacts of global trade It determined that trade
among NAFTA countries spreads invasive species that have been introduced as a result
of trade of NAFTA countries with non-NAFTA countries Many fewer examples exist of
regional trade facilitating introduction and establishment of an invasive species within
NAFTA countries The study also purports that since NAFTA regional and global trade
have grown significantly while the capacity to inspect for NIS has rema ined constant9
As a result the potential for introduction of NIS via trade has increased significantly
The report recommends in addition to existing effort to exchange information and
ideas that NAFTA countries
1 develop a North America strategy to address NIS concerns including building
technical and institutional capacities
2 recognize costs associated with introductions via trade of NIS and shift focus
from increasing trade while dealing with NIS to addressing NIS while allowing
trade
3 minimize dependence on inspections by for example ensuring that those
responsible for the movement of NIS are motivated to reduce risks they pose of
introduction of NIS
9 Approximately 2 percent of goods are inspected Thus if the volume over which this percentage is applied is increasing the total number of introductions may be increasing as well
37
4 institute additional measures to prevent introduction and establishment of NIS
including for example requiring documentation of country or origin of specific
materials mandating use of materials other than SWPM (solid wood packing
material) etc
5 encourage involvement of regional organizations in development of regional and
international standards and
6 ensure that existing and future bilateral and regional FTAs provide sufficient
leeway to develop sanitary phytosanitary and zoosanitary measures necessary to
prevent the introduction of NIS including through the use of a pathway approach
(Perrault et al 2003)
More research is needed to establish a definitive link between NIS and trade It is
likely that it is not the sheer volumes of trade that account for increases in NIS but rather
such things as the region or origin packing material and the effectiveness of monitoring
and preventative efforts ldquoReal worldrdquo policy for controlling damage seems to be more
reactive than proactive suggesting higher initial populations should lead to increases in
the restricted policies Economic intuition states that higher initial populations should
lead to lower marginal damage and call for less restrictive policies
Empirical Cost and Benefits Estimates by Species
This section is organized by types of species and for specific species within those
groupings The groups are fish crustaceans mollusks and aquaticriparian plants
38
Fish
Pimentel et al (2001) report that a total of 138 non-native fish species have been
introduced into the United States most taking place in states with warm climates such as
Florida and California They also state that 44 native species are endangered due to NIS
with an additional 27 being negatively affected The paper estimates that economic
losses due to alien fish is approximately US$1 billion annually This takes into account
the estimated annual US$69 billion in benefits from sport fishing
Sea Lamprey
The Sea Lamprey has caused great losses to the commercial and recreational
fisheries of the Great Lakes as a parasite on native fish Unlike many other Great Lakes
invasives it entered the Lakes naturally traveling from its natural range in the Atlantic
through the St Lawrence Seaway (Jenkins 2001) Control methods for lampreys include
lampricide for larvae control barriers traps and a sterile male release program (Great
Lakes Fishery Comm 2004) A number of estimates are available for the costs of
lamprey control and prevention The OTA report states that $10 million is spent annually
for control and research and another $10 million on fish stocking Another estimate
gives total control costs for annual control and monitoring of sea lamprey in the US and
Canada as $13 million (US Invasives Species Council Jenkins 2001) The US GAO
based on a survey of seven states estimated that 1999 expenditures on sea lamprey were
$275000 for New York and $3 million for Michigan (GAO 2000) Lupi et al (1999)
report that Granular Bayer treatment a lampricide costs approximately $5 million per
39
application in US waters of Lake Huron This same treatment in the St Maryrsquos River
costs $42 million per application (Lupi et al 2003) The costs for sterile male release are
on the order of $300000 per year in Lake Huron (Lupi et al 1999 Jenkins 2001)
Lupi et al (2003) estimate the benefits of lamprey control on the St Maryrsquos River
to Michigan anglers Three options are evaluated sterile male release and trapping
sterile male releasetrapping with larvicide applied every five years and sterile male
release with a one time application of larvicide An existing random utility model of
recreational fishing for Michigan anglers for Michigan waters of the Great Lakes was
adapted to estimate economic benefits of increases in Lake Huron lake trout populations
as a result of lamprey control (Lampreys that spawn in the St Maryrsquos River are the
source of lampreys in Lake Huron) Treatment options were linked to changes in lamprey
populations and then to changes in trout populations The authors assumed a proportional
change in catch rates to changes in trout populations These catch rates were then fed into
the economic model to determine changes in recreational fishing trips and thus the
benefits of control Benefits were measured in the year 2015 after allowing populations
to adapt and in 1994 dollars Option 1 had $26 million annual benefits option 2 $47
million and option 3 $333 million
The authors also calculated the net present value of net benefits (benefits minus
the treatment costs) for a range of interest rates They found that the estimated net
present values were similar across all three options even though annual undiscounted
benefits varied by option The difference appears to be the cost and the timing of controls
and trout population growth The option that had the highest net present value varied by
40
which discount rate was used Nevertheless across all options net present values were
positive for a wide range of interest rates and suggest that there are definite economic
benefits for control Considering that only benefits to anglers were measured there are
likely to be more economic benefits than those measured Benefits arising from other
uses and non-uses that would further increase net present benefits of control
Two other sources report on the benefits of control The Great Lakes Fishery
Commission reports benefits in the range of $2-4 billion per year (Sturtevant and
Cangelosi 2000) Lost fishing opportunities and indirect economic impacts if control
were terminated are estimated at $500 million annually (OTA 1993)
Ruffe
The Ruffe is another invasive fish native to Europe that like the lamprey has
invaded the Great Lakes It is a predator on native fish and competes for habitat Control
includes toxins trawling and ballast water management Estimated losses for the native
fishery are estimated at $05 million annually (Jenkins 2001) For Lake Erie between
1985 and 1995 Hushak (1997) estimated losses of $600 million for the sport fishery
Leigh (1988) evaluated the benefits and cost of a proposed Ruffe control program
The proposed program would control Ruffe using a pesticide also used on Sea Lampreys
and would be used at river mouths at specific times of the year when Ruffe are
concentrating in those locations Control would occur over an 11 year period at which
time the population would be no longer a significant threat Total costs for the control
program would be $12 million with about 10-20 variability depending on water level
fluctuations in the rivers The benefits of control are estimated based on the value of both
41
commercial and sport fishery impacts over a 50 year time period Without the control
program Ruffe populations are estimated to expand to all Great Lakes and to cause
declines in walleye yellow perch and whitefish Angler day values (1985) for Great
Lake sportfishing were used as the basis of benefits for sport fishing and broken out
between values for walleye and perch and all other fish except salmonoids It was
assumed that decreases in native fish populations would lead to proportional decreases in
the number of angler days per year Three scenarios were estimated a minimum
moderate and maximum for fish population reductions If fish populations occur right
away then annual benefits of the control program for both sport and commercial fishing
varied between $24 and $214 million for the three estimates Assuming that benefits
accrue over the 50 year time period and discounting benefits the net present value
varies between $105 million and $931 million An estimated net public savings of $513
million could be achieved for the moderate scenario primarily benefiting recreational
fisheries
Other Species
Other invasive fish include the Round Goby which inhabits the Great Lakes and
is a predator of benthic fauna Currently there are no established controls for the goby
but research is underway (Jenkins 2001) The mosquito fish has caused the declines of
at least 15 native species in Southwestern desert rivers and springs (OTA 1993) The
grass carp and common carp that were introduced to control aquatic weeds have become
a problem as they indiscriminately consume aquatic vegetation and destroy habitat for
young native fish (OTA 1993) There are no known specific economic studies available
for these species
42
Crustaceans
Invasive crustaceans include the European Green Crab the Mitten Crab the
opossum shrimp and some species of crayfish Estimates of costs attributed to the Green
Crab are $44 million but it is unclear what those costs include (Licking 1999)
Mollusks
Pimentel et al (2001) report that 88 species of mollusk have become established
in the US However this number is based on the OTA study which is over 10 years old
Zebra Mussels
Zebra Mussels are one of the best studied and well-known aquatic invasive
species Originating from the Caspian Sea they are assumed to have been introduced
first to the Great Lakes via ballast water discharges Now found throughout the Great
Lakes and rivers of many states and Canadian provinces Zebra Mussels colonize docks
locks ship hulls water intake pipes and other mollusks and cause great damage to power
plants and water treatment facilities Controls include biocides chlorine thermal
treatment and mechanicalmanual removal (Jenkins 2001)
There are many estimated costs for preventing controlling and studying Zebra
Mussels Unfortunately the many estimates are not always reported in the same units
which makes it somewhat hard for comparison A number of reports and publications
have reported that the costs of the mussel to be around $5 billion A US Fish and
Wildlife estimate as repoted in Sun (1994) states that for a 10 year period (1990-2000)
43
the costs in the Great Lakes will be in this range This same estimate appears at least 4
other times and is presumed to be restatements of this original estimate (Anonymous
1999 Jenkins 2001 Pimental et al 1999 IMO 2001) However another US FWS
estimate puts the cost of damages over 10 years to intake pipes water filtration
equipment and power plants at 31 billion (Cataldo 2001)
Many of the cost estimates deal with the impacts on power plants and water
treatment plants OTA reports that the New York Seas Grant Extension Service
estimated the costs of the Zebra Mussel to the power industry alone were as much as
$800 million for plant redesign and a further $60 million annually for maintenance In
addition fouling by Zebra Mussels of cooling or other critical water systems in power
plants can require shut down costing as much as $5000 per hour for a 200-megawatt
system10 (OTA 1993) Armour et al state that the net impact on the US Great Lakes
power plants (46) could be $100 million annually based on a one to two day downtime
and a 1 reduction in plant heat rate USGS estimates that annual control costs for
hydroelectric plants are $83000 per plant for fossil- fuel plants $145000 and $822000
for nuclear plants (Anonymous 1999) One major power utility reported costs for 1991 of
mussel monitoring at $100megawatt of generating capacity (Jenkins 2001) OrsquoNeil
(1997) reports on a 1995 study of 35 states and 3 Canadian provinces that found the
economic impact of Zebra Mussels to have total costs of $69 million with a mean of
$205570 per facility (339 facilities surveyed) Nuclear power plants had the highest
expenditure of $787000 per facility whereas fossil fuel electric generating stations had
10 Some invasive species (such as the Zebramuscle) have also provided benefits to the habitats they lsquoinvadersquo Most cost estimates of invasive species fail to take benefits into account thus leaving them open to criticisms of overstating costs At the same time most studies fail to account for eco-system damage
44
the lowest expenditure of $146000 per facility Annual expenditures were found to have
increased between 1989 and 1995 from $234000 to $178 million as the range of the
mussels increased (OrsquoNeill 1997)
Upgrading chlorination injection for water utilities in six locations around the
Great Lakes could cost between $250000 to $25 million per location (Armour et al
1993) Water power plants are reported to spend around $3 billion annually (Licking
1999) Research expenditures from 1992-1994 were $88 million annually (Hushak and
Deng 1997) Reutter (1997) reports that the average large water user in the Great Lakes
spends $350000-$400000 on Zebra Mussel control Sturtevant and Canelosi (2000) cite
the same figures but clarify that these amounts are per year and just for cleaning water
intake pipes
For Great Lakes water users with lake water intake structures Park and Husak
(1999) report on the results of a 1994-95 survey of 418 facilities using surface water
consisting of industries (44) municipal water plants (28) private utilities (15) and
public utilities (14)11 Average monitoring and control costs from 1989-1994 were
$043 million for 142 reporting facilities Control costs were the sum of costs for
retrofitting physical removal mechanical exclusion chemical treatment and other related
costs Monitoring costs included labor equipment investment training and contracts for
monitoring Using this figure and extrapolating to all facilities in the Great Lakes area
total monitoring and control costs were $120 million from 1989-1994 and averaged $30
million annually from 1992-1994 Control costs are further broken out by municipal
which implies an understatement of costs The net effect of these oversights is essentially an empirical question
45
water treatment plants and for utilities and industries combined Yearly average costs are
given for different size plants from 1989-1994 For municipal water treatment plants
average total costs were $154000 in 1993 for medium sized plants (11-300 mgd) and
$84000 for small plants (0-10 mgd) Most of this total cost was spent on treatment costs
rather than monitoring Retrofit costs averaged about 90 of total control costs and
chemical costs were less than 10 of total control costs Monitoring costs averaged
about $5000 per year for medium facilities and $3000 for small facilities For utilities
and industrial sources combined average monitoring and control costs were $439000 for
large $92000 for medium and $10000 for small facilities in 1993 Large facilities were
defined as 300 or more mgd medium was between 11-300 mgd and small was less than
11 mgd
A few studies related to the impact on recreational activites have been done
Vilaplana and Hushak (1994) conducted a survey of Ohio residents to determine the
effect of Zebra Mussels on recreational activities at Lake Erie The survey was
conducted in 1991 and 439 surveys were obtained Respondents were questioned about
their knowledge of the Zebra Mussel and its impact on their recreatio n decisions
Thirteen out of 285 respondents who those answering that question actually decreased
their time spent recreating at the lake due to the mussel Boat owners reported expenses
for protective paints (average cost was $94) additional maintenance ($171) and insurance
costs ($207) related to the mussel but the sample size was small (1413) At the time
this paper was written further work was expected and needed to estimate actual monetary
impacts on recreation
11 This paper is one of a number reporting on the results of this survey conducted by the Ohio Sea Grant and Ohio State University We limit our discussion here to the latest paper on the survey See the
46
Sun (1994) conducted a similar study of Zebra Mussels on Lake Erie recreation
A travel cost model was estimated for Lorain County Ohio boaters (n=140) The results
were presented at the Fourth International Zebra Mussel Conference in 1994 and appear
preliminary They are also contradictory in that both positive and negative impacts of
the mussel on recreation seem to have occurred Although the ideas and generic modeling
framework do appear applicable to estimating the impacts of Zebra Mussels on recreation
in Lake Erie this particular discussion did not provide enough details to determine actual
impacts
Other mollusks
Another invasive mollusks include the Asian Clam which by one estimate cost
$45 million in compliance in 1980 for the nuclear electric industry and $1 billion
annually in the early 1980rsquos in terms of total losses (OTA 1993)
Cost-effective control strategies for Oyster drills were investigated by Buhle et al
(2004) Oyster drills are marine snails that drill through the shells of oysters in order to
prey on them They have been accidentally introduced into many areas via aquaculture
The paper shows how biological and economic data can be combined to determine the
least cost strategy for control at various life stages of the invasive species Using
population data on different life stages can identify which life stage is least costly to
control Oyster drills can be controlled either by the destruction of eggs or the collection
of adults Simulations with different cost parameters showed that targeting of adults was
more cost effective than collecting eggs In general species that are short lived with high
reproductive rates are more effectively controlled by reducing eggs and juveniles but
references for earlier reports on this same survey
47
when adults are long- lived and there is low reproduction it is more cost effective to
target adults
Plants
Aquatic or riparian invasive plant species include Hydrilla European Loosestrife
Eurasian water milfoil melaluca and salt cedar Hydrilla blocks irrigation canals
enhances sedimentation in flood control reservoirs interferes with water supplies
impedes navigation and reduces the productivity of native fisheries Similar impacts
occur from water milfoil (Jenkins 2001) Florida spends approximately $145 million
each year on hydrilla control (OTA 1993) European loosestrife invades wetlands and
endangers native plants and wildlife by changing the resident plant community and
altering the structure and function of the wetland (Jenkins 2001) It is estimated that
European loosestrife imposes $45 million a year in control costs and forage losses
(Pimentel et al 2000)
Rockwell (2003) summarized the literature on the economic impact of aquatic
invasive weeds Invasive aquatic plants create a wide impact including those on
commercial and recreational fishing boating swimming water quality navigation and
ecological resources such as wildlife habitat There is a wide variety in both the types of
water bodies impacted the life cycles and characteristics of the plants and the means of
control Control may be mechanical biological or chemical Early estimates of the costs
and benefits of weed control in Florida were made in the late 1960rsquos Costs of $6 million
were reported annually and benefits were reported as $82 million with the largest
benefits coming from increased land use (due to drainage) and prevented flood damages
48
In 1989 Florida spent $14 million on aquatic weed control Relatively few estimates of
the harm done by aquatic weeds or the benefits of control are available from the
literature What is available is concentrated on the state of Florida A 1991 study found
annual benefits of $73 million for residential damage control for 11 Florida counties
Benefits of control to improve drainage for citrus production were found to be $5000 per
acre or $8000 per acre wit slightly more increases in control by a 1992 study For
vegetable production benefits were on the order of $300000 (1993 study)
Recreational benefits are the primary form of benefits estimated for weed control
Three types of benefits have been reported by 5 separate recreational studies Locations
studied were Illinois Florida Alabama and British Columbia Annual willingness to pay
results ranged from $176000 (1989 study) to $13 million (1984 study) (und iscounted
figures) Economic impacts and expenditures on recreation were also measured Impacts
were reported by one study on the order of $10 million and expenditures ranged from
$900000 (1986) to $100 million (1995) Rockwell uses benefit cost ratios from the
literature together with the estimated cost of $14 million for Florida weed control on
85000 acres to generate national estimates of the total impact of aquatic weeds (based on
assumptions about Florida as a percent of the national problem) He finds that the range
of national impacts are between $1 and $10 billion dollars A second estimate uses data
on the costs of chemicals used to treat weeds A 1983 study estimated benefits of one
chemical (silvex) to be $40 million on 60000 acres at a cost of $48 million or $80 per
acre Rockwell uses data from two other studies to estimate a cost of $17 million for the
entire US for applications of the weed control chemical 24-D on 223000 acres
49
Conclusion
This paper reviews the economic literature on invasive species focusing on
estimates of the costs of aquatic invasives The most obvious point of the paper is that
the literature is still in its infancy There are few theoretical and even fewer empirical
studies dealing with the economic costs of invasive species The aquatic studies
obtaining cost estimates reviewed above show values ranging from several hundreds of
thousands of dollars a year to tens of millions of dollars a year It seems apparent that a
systematic approach is needed to develop a consistent method to estimate such costs
The second point the paper illustrates is the difficulty involved in obtaining such
an estimate Determining economic costs of environmental concerns is no easy task
under the best of circumstances Human health values use values existence values
valuations of ecosystem services are all issues environmental economists struggle with
every day The unique circumstances surrounding invasive species add a level of
complexity to the task that increases difficulties involved in such valuations at a
geometric rate
Besides the common measurement problems and lack of observable data
measuring the economic costs of invasive species involve determining rates of biological
propagation which donrsquot always conform neatly with economic metrics (such as years or
states) There are also the difficulties associated with assessing the risks of invasives
While few NIS actually become invasives and even fewer of those invasives cause
significant harm the harm caused by these few can be quite substantial How to estimate
the benefits associated with controlling such a process is a difficult task
50
These issues combine to make policy options difficult to both formulate and
evaluate especially a priori As the literature points out invasive species and their
control have definite public good aspects and thus call for some level of government
intervention However to what extent and what form that intervention takes place
depends on myriad of issues associated with both the region and the species involved
Optimal policy appears to be as unique as the individual species or ecosystem it is
attempting to control and protect
51
Table 1 Summary of studies providing empirical cost estimates
Authors Time period
covered
Species Geographic area
Dollar Value Outcomes
General Estimates
Pimentel 1993shy Weeds US UK $314 billion Review of et al 2001 vertebrate
insectsamp mites plant pathogens mammals bids amphibians reptiles fish mollusks arthropods human diseases
India Australia South Africa amp Brazil
annually for six nations $136 billion for the US
selected literature citing studies which estimate economic losses across six nations including the US
OTA 1906shy1991
79 harmful invasives Including Sea lamprey zebra mussel Asian clam Salt Cedar Purple Loosestrife Melalluca and Hydrilla
US Total cumulative damage (1991$) between $97 ndash 137billion 3 harmful fish $467million for 3 aquatic invert$12 billion and $100 millionannually for control of aquatic plants
Attempts to capture both economic and ecological damages caused estimating 59 of no indigenous species have caused harm
Perrault et Saltcedar or US Irrigation value Looks at the al tamarisk of water loss
$39 to $121millionyr
effect of invasives on agriculture and trade within the context of the NAFTA agreement The focus of the study is on recommending strategies including minimizing dependence on inspections by putting more of the burden on potential carriers
52
Authors Time period
covered
Species Geographic area
Dollar Value Outcomes
Fernandez Ballast Water Optimal abatement strategies are adopted applying subsides of 05 to 30 cents per cubic meter and a lump sum fee of 010 to 018 cents
Examines different incentive mechanisms that can be applied to ships to help ports about unintended consequences of NIS
Species Estimates
Jenkins Sea lamprey US and Canada
$13 million
GAO 1999 Sea lamprey New York and Michigan
$275000 (NY) $3 million (Michigan)
Lupi et al (1999)
Sea lamprey Lake Huron $5 million per treatment
Granular Bayer treatment a lampricide
Lupi (2003)
Sea lamprey St Maryrsquos River
$42 million per treatment
Granular Bayer treatment a lampricide
Lupi et al (1999) and Jenkins
Sea lamprey Lake Huron $300000 per year
Both report this number as the cost of sterile male release
Lupi (2003)
Projected 2015 population and 1994$
Sea lamprey St Maryrsquos River
$26-$47 million Estimates of the benefits of control to Michigan anglers based on catch rates under 3 different control options Using present values all options provided positive net present values
Sturtevant and Cangelosi
Sea lamprey Great Lakes $2-4 billionyear Benefits of control programs
OTA Sea lamprey $500 million annually
Lost fishing opportunities and indirect economic impacts of terminating control
Jenkins Ruffe Great Lakes $05 million annually
Losses for native fisheries
53
Authors Time period
covered
Species Geographic area
Dollar Value Outcomes
Hushak 1985shy1995
Ruffe Lake Erie $600 million Estimated losses to sport fishery
Leigh Ruffe $12 million Estimated total cost of control program that would run over 11 years
Leigh Ruffe $513 million The same study estimated the benefits of these control programs both sport and commercial fishing Estimates of the net present value of the control programs ranged from $105 to $931 million
Licking Green Crab $44 million Not clear what these costs included
Various Zebra mussel $5 billion There are many studies which have attempted to estimate the costs of the zebra mussel This is a commonly quoted figure
Sun 1990shy Zebra mussel Great Lakes $5 billion Sun reports the 2000 results of a US
Fish and Wildlife estimate
Cataldo 10 year Zebra mussel Great Lakes $31 billion Armour et al
Zebra mussel Great Lakes $100 million annually
Costs to approximately 46 power plants
USGS Zebra mussel Great Lakes $83000per plantyr (hydroelectric plants) $145000per plantyr (fossilshyfuel plants) $822000per plantyr (nuclear plants)
54
Authors Time period
covered
Species Geographic area
Dollar Value Outcomes
OrsquoNeill 1995 Zebra mussel 35 US States and 3 Canadian provinces
$69 million and a mean of $205570 per facility
Looked at 339 facilities and measured the economic impact
OrsquoNeill 1989shy1995
Zebra mussel $176 million annually
Estimated that the annual costs increased from $234000 to $178 million
Licking Zebra mussel Great Lakes $3 billion annually
Estimated expenditures by water power plants
Hushak and Deng
1992shy1994
Zebra mussel $88 million annually
Research expenditures
Ruetter Zebra mussel Great Lakes $350000shy$400000 annually
Estimated control costs of average large water user Another study stated same figures but for cleaning water intake pipes only
Park and 1989shy Zebra mussel Great Lakes $120 million total This was based Husak 1994 for period or $30
million annually between 1992 and 1994
on $043 million average costs per a survey of 142 facilities
Vilaplana Zebra mussel Lake Erie $94 average Survey of and costs for recreational users Hushak protective paint
$171 maintenance and $207 insurance
increased expenses Low response rate
OTA Early 1980rsquos
Asian Clam $45 million in 1980 and $1 billion in annual losses
$45 million figure is compliance costs for nuclear electric industry
55
Authors Time period
covered
Species Geographic area
Dollar Value Outcomes
Plant Estimates OTA Hydrilla Florida $145 million
annually Estimated control costs
Pimnetel et al
European loosestrife
$45 million annually
Estimated control costs and forage losses
Rockwell 1984 Aquatic weeds
Florida $14 million Aquatic weed control expenditures
Rockwell 1991 Aquatic weeds
Florida $73 million annually
Estimated benefits for residential damage control in 11 Florida counties
Rockwell 1992 Aquatic weeds
Florida $5000-$8000 per acre
Benefits of control programs to citrus production
Rockwell 1993 Aquatic weeds
Florida $300000 Benefits of control programs to vegetable production
Rockwell Aquatic weeds
Illinois Florida Alabama and British Columbia
$176000-$13 million
Annual willingness to pay for recreational benefits of weed control
Rockwell 1986 and 1995
Aquatic weeds
Illinois Florida Alabama and British Columbia
$10 million in total economic impacts $900000 in 1986 expenditures and $100 million in 1995 expenditures
Annual willingness to pay for recreational benefits of weed control
Rockwell Aquatic weeds
National $1 - $10 billion Impacts estimated extrapolating from the Florida estimates
Rockwell Aquatic weeds
National $17 million Costs to treat (chemicals) weeds estimated extrapolating from the Florida estimates
56
INVASIVE SPECIES BIBLIOGRAPHY
Anonymous 1999 ldquoMusseling inrdquo Electric Perspectives Vol 24(6) 14
Armour AF Tsou JL and Wiancko PM 1993 ldquoZebra Mussels The Industrial Impactrdquo Third International Zebra Mussel Conference Toronto February
Barbier EB 2001 ldquoA Note on the economics of biological invasionsrdquo Ecol Econ Vol 39 197-202
Buhle E M Margolis and JL Ruesink 2004 ldquoBang for the Buck Cost-Effective Control of Invasive Species with Different Life Historiesrdquo Resources for the Future Discussion Paper 04-06
Burnham M 2004 ldquoFront Lines of Battle Against Invaders Increasingly Localrdquo LandLetters httpwwweenewsnetLandletterBackissues02120404htm accessed 13 February 2004
Cataldo R 2001 Musseling in on the Ninth District Economyrdquo Fedgazette Vol 13(1) 15-17
Cohen A and Carlton J 1995 Nonindigenous Aquatic Species in a United States Estuary A Case Study of the Biological Invasions of the San Francisco Bay and Delta US Fish and Wildlife Service and National Sea Grant (Connecticut Sea Grant) NOAA Grant NA36RG0467)
Colautti Robert I AJ Niimi CDA van Overdijk EL Mills K Holeck and HJ MacIsaac 2003 ldquoSpatial and temporal analysis of transoceanic shipping vectors in Great Lackrdquo in Invasive Species Vectors and Management Strategies G Ruiz and JJ Carlton (eds) 227-246
Costello C and McAusland C 2003 ldquoProtectionism Trade and Measures of Damage from Exotic Species Introductionrdquo Amer J of Agric Econ Vol 85 No 4 964- 975
Courtenay WR Jr 1993 ldquoBio logical Pollution Through Fish Introductionsrdquo In Biological Pollution The Control and Impact of Invasive Exotic Species BN McKnight (ed) Indiana Academy of Science Indianapolis 35-60
Dalmazzone S 2000 ldquoEconomic Factors affecting vulnerability to biological invasionsrdquo in Economics of Biological Invasions Perrings Williamson and Dalmazzone (eds) 17shy30
57
Eiswerth ME and G C van Kooten 2002 ldquoUncertainty Economic and the Spread of an Invasive Plant Speciesrdquo American Journal of Agricultural Economics Vol 84 November 1317-1322
Evans EA 2003 ldquoEconomic Dimensions of Invasive Speciesrdquo Choices Second Quarter 5-9
Fernandez L 2004 ldquoNAFTA and Member Country Strategies for Maritime Trade and Marine Invasive Speciesrdquo NAREA Workshop on Trade and the Environment Halifax Nova Scotia June
Governments of the United States of America and Canada1997 State of the Great Lakes 1997 Prepared by Environment Canada and the US EPA Availability httpwwwonecgccaglimrdatastate-of-the- lakes97introhtml
Governments of the United States of America and Canada 1999 State of the Great Lakes 1999 Prepared by Environment Canada and the US EPA Availability httpwwwonecgccaglimrdatastate-of-the- lakes99
Horan RD and F Lupi 2004 ldquoEconomic incentives for controlling trade-related biological invasions in the Great Lakesrdquo NAREA Workshop on Trade and the Environment Halifax Nova Scotia June
Horan RD C Perrings F Lupi and EH Bulte 2002 ldquoBiological Pollution Prevention Strategies Under Ignorance The Case of Invasive Speciesrdquo Amer J Agr Econ Vol 84 No 5 1303-1310
Hushak LJ Y Deng and M Bielen 1995 ldquoThe Cost of Zebra Mussel Monitoring and Controlrdquo Aquatic Nuisance Species Digest Vol 1 No 1 5
Hushak LJ Y Deng and M Bielen 1995 ldquoWater User Expenditures on Zebra Mussel Monitoring and Controlrdquo Progress Report Ohio Sea Grant College Program Columbus OH April
Hushak L 1996 ldquoPresent and expected economic costs of Zebra Mussel damages to water users with Great Lakes water intakesrdquo Ohio Sea Grant College Program Project RZM-12 Availability httpwwwsgohio-stateeduprojectRZM-12htm
Hushak LJ and Y Deng 1997 ldquoCosts of Alternative Zebra Mussel Control Strategies The Case of Great Lakes Surface Water Usersrdquo Seventh International Zebra Mussel and Other Aquatic Nuisance Species Conference New Orleans Louisiana January
Jenkins P 1996 ldquoFree Trade and Exotic Species Introductionrdquo Conservation Biology V10 No1 pp 300-302
58
Jenkins P 2001 Economic Impacts of Aquatic Nuisance Species in the Great Lakes A report prepared by Philip Jenkins and Associates Ltd for Environment Canada Burlington Ontario
Knowler D and EB Barbier 2000 ldquoThe Economics of an Invading Species a Theoretical Model and Case Study Applicationrdquo In The Economics of Biolo gical Invasions Perrings C M Williamson and S Dalmazzone (eds) 2000 Edward Elgar Cheltenham 70-93
Krcmar-Nozic E GC Van Kooten and B Wilson 2000 ldquoTreat to Biodiversity The Invasion of Exotic Speciesrdquo Conserving Naturersquos Diversity GC Van Kooten EH Bulte and ARE Sinclair (eds) Ashgate Burlington VT pp 68-87
Leigh P 1998 ldquoBenefits and costs of the ruffe control program for the Great Lakes Fisheryrdquo J of Great Lakes Res Vol 24 No 2 351-360
Leung B DM Lodge D Finnoff JF Shogren MA Lewis and G Lamberti 2002 ldquoAN ounce of prevention or a pound of cure bioeconomic risk analysis of invasive speciesrdquo Proceedings of the Royal Society of London Biological Sciences Vol 269 No 1508 2407-2413
Levine J and C DrsquoAntonio 2003 ldquoForecasting Biological Invasions with Increasing International Traderdquo Conservation Biology V17 No1 pp 322-326 February
Licking E 1999 ldquoForeign species are invading the US - and costing plentyrdquo Business Week Vol 3630 68
Lupi F Hoehn J and Christie G 1999 ldquoValuing Non Indigenous Species Control and Native Species Restoration in Lake Huronrdquo Benefits and Costs in Natural Resource Planning (W Douglas Shaw ed) Western Regional Research Publication
Lupi F J Hoehn and G Christie 2003 ldquoUsing and Economic Model of Recreational Fishing to Evaluate the Benefits of Sea Lamprey Control on the St Maryrsquos Riverrdquo J Great Lakes Res Vol 29 (Supplement 1) 742-754
Lynch L 2002 ldquoMigration of Exotic Pests Phytosantary Regulations and Cooperative Policies to Protect US Ecosystems and Agricultural Interestrdquo In Both Sides of the Border L Fernandez and RT Carson (eds) Kluwer Academic Publishers The Netherlands 455-484
MacIsaac H J T C Robbins and MA Lewis 2002 ldquoModeling shipsrsquo ballast water as invasion threats to the Great Lakesrdquo Canad J of Fisheries and Aquatic Sciences Vol 59 1245-1256
Margolis M and JF Shogren 2004 ldquoHow Trade Politics Affect Invasive Species Controlrdquo Resources for the Future Discussion Paper 04-01 January
59
McAusland C and C Costello 2004 ldquoAvoiding Invasives Trade related policies for controlling unintentional exotic species introductionsrdquo J of Environ Econ and Manage Vol 48 954-977
Nadol V 1999 ldquoAquatic Invasive Species in the Coastal West An Analysis of State Regulation within a Federal Frameworkrdquo Environmental Law Vol 29 No 2 339-376
Naylor RL 2000 ldquoThe economics of alien species invasionsrdquo In Mooney HA and Hobbs RJ (eds) Invasive Species in a Changing World Washington DC Island Press 241-259
Office of Technology Assessment US Congress (OTA) 1993 Harmful Non-Indigenous Species in the United States OTA Publication OTA-F-565 US Government Printing Office Washington DC Availability httpwwwwwsprincetonedu80~otadisk119939325_nhtml
ONeill C 1997 ldquoEconomic impact of Zebra Mussels Results of the 1995 Zebra Mussel Information Clearinghouse Studyrdquo Great Lakes Res Review Vol 3 No 1 35-42
Olson L J and S Roy 2002 ldquoThe economics of controlling a stochastic biological invasionrdquo Amer J of Agric Econ November 1311-1316
Park J and Hushak LJ 1999 ldquoZebra Mussel Control Costs in Surface Water Using Facilitiesrdquo Technical Summary OHSU-TS-028 Ohio Sea Grant College Program Columbus OH
Perrault Anne Morgan Bennett Sta Burgiel Aimee Delach and Carroll Muffett 2003 Invasive Species Agriculture and Trade Case Studies form the NAFTA Context prepared by Center for International Environmental Law and Defenders of Wildlife for the North American Commission for Environmental Cooperation February
Perrings C M Williamson and S Dalmazzone (eds) 2000 The Economics of Biological Invasions Cheltenham Edward Elgar
Perrings C 2000 ldquoThe Economics of Biological Invasionsrdquo Workshop on Best Management Practices for Preventing and Controlling Invasive Alien Species February
Perrings C M Williamson EB Barbier D Delfino S Dalmazzone J Shogren P Simmons and A Watkinson 2002 ldquoBiological Invasion Risks and the Public Good An Economic Perspectiverdquo Cons Ecol Vol 6 No 1 httpwwwconsecolorgvol6iss1art1
Pimentel D L Lach R Zuniga and D Morrison 2000 ldquoEnvironmental and Economic Costs of Nonindigenous Species in the United Statesrdquo Bioscience 50(1) 53-56
60
Pimentel David S McNair S Janecka J Wightman C Simmonds C OConnell E Wong L Russel J Zern T Aquino and T Tsomondo 2001 Economic and environmental threats of alien plant animal and microbe invasions Agriculture Ecosystems and Environment 84 p 1-20
Planet Ark 2004 ldquoUN Agrees on Laws Against lsquoAlienrsquo Marine Invadersrdquo 16 February wwwplanetarkcomdailynewsstorycfmnewsid23827storyhtm Accessed on February 7 2004
Polasky S C Costello and C McAusland 2004 ldquoOn trade land-use and biodiversityrdquo J of Environ Econ and Manage Vol 48 911-925
Reutter JM 1997 ldquoImportance of the nonindigenous speciesaquatic nuisance species issuerdquo in Zebra Mussels and Aquatic Nuisance Species DItri FM (ed) Ann Arbor Press Inc Chelsea MI 65-68
Rockwell HW Jr 2003 ldquoSummary of a Survey of the Literature on the Economic Impact of Aquatic Weedsrdquo Report for the Aquatic Ecosystem Restoration Foundation August httpwwwaquaticsorgpubseconomicshtm
Settle C and JF Shogren 2002 ldquoModeling Native-Exotic Species Within Yellowstone Lakerdquo Amer J Agr Econ Vol 84 No 5 1323-1328
Sharov AA and Liebhold AM 1998 ldquoBioeconomics of managing the spread of exotic pest species with barrier zonesrdquo Ecol Applic Vol 8 No 3 833-845
Shogren JF 2000 ldquoRisk Reduction Strategies against the lsquoexplosive invaderrsquordquo in The Economics of Biological Invasions Perrings C M Williamson and S Dalmazzone (eds) Edward Elgar Cheltenham 56-69
Smith LD MJ Wonham LD McCann GM Ruiz AH Hines and JT Carlton 1999 ldquoInvasion Pressure to a Ballast-Flooded Estuary and an Assessment of Inoculant Survivalrdquo Biological Invasions 1 67-87
Sturtevant R and Cangelosi A 2000 The Great Lakes at the Millennium Priorities for Fiscal 2001 Prepared for the Northeast Midwest Institute Washington DC
Sun J F 1994 ldquoThe Evaluation of Impacts of Colonization of Zebra Mussels on the Recreational Demand in Lake Erierdquo Fourth International Zebra Mussel Conference Madison Wisconsin March Availability httpwwwsgnisorgpublicat108htm
Thomas M H and A Randall 2000 ldquoIntentional introductions of nonindigenous species a principal-agent model and protocol for revocable decisionsrdquo Ecol Econ Vol 34 333-345
61
Vilaplana JV and LJ Hushak 1994 ldquoRecreation and the Zebra Mussel in Lake Erie Ohiordquo Technical Summary OHSU-TS-023 Ohio Sea Grant College Program Columbus OH
United States General Accounting Office (GAO) 2000 Invasive species Federal and Selected State Funding to Address Harmful Nonnative Species report to congressional committees United States General Accounting Office Washington DC Availability httppurlaccessgpogovGPOLPS8271
United States General Accounting Office (GAO) 2001 ldquoObstacles Hindering Federal Rapid Response to Growing Threatrdquo United States General Accounting Office GAO-01shy724 August
United States National Invasive Species Council (NISC) 2000 National Invasive Species Management Plan (2000 Draft) US Department of the Interior Washington DC
United States National Invasive Species Council (NISC) 2001 Meeting the Invasive Species Challenge National Invasive Species Management Plan October
Wilcove DS D Rothstein J Dubow A Phillips and E Losos 1998 ldquoQuantifying Threats to Imperiled Species in the United Statesrdquo BioScience 48 607-615
62
Web Sites on Invasive Species
Aquatic Ecosystem Restoration Foundation httpwwwaquaticsorgindexhtml
California Department of Fish and Game Chinese Mitten Crab Site httpwwwdeltadfgcagovmittencrab
Chesapeake Bay Program Invasive Species in the Chesapeake Bay Watershed Workshop httpwwwmdsgumdeduexoticsworkshopindexhtml
Exotic Aquatics on the Move httpagancspurdueeduEXOTICSrelated_linkshtm
Invasivespeciesgov The Nations Invasive Species Information System httpwwwinvasivespeciesgov
Great Lakes Commission Aquatic Nuisance Species httpwwwglcorgans
Great Lakes Fishery Commission httpwwwglfcorg
Great Lakes Fishery Commission 2004 Sea Lamprey Control httpwwwglfcorgsealamphowasp
Great Lakes Information Network (GLIN) Invasive Species in the Great Lakes Region httpwwwgreat- lakesnetenvtflora-faunainvasiveinvasivehtml
Global Ballast Management Programme httpgloballastimoorg
Integrated Systems for Invasive Species Ecological Forecasting and Risk Analysis for Nonindigenous Species httpwwwmathualbertaca~mathbioISISindexhtml
Massachusetts Aquatic Invasive Species Management Plan httpwwwmassgovczminvasivemanagementplanhtm
National Aquatic Nuisance Species (ANS) Task Force httpwwwanstaskforcegovindexhtm
63
National Aquatic Nuisance Species Clearinghouse New York Sea Grant httpwwwaquaticinvadersorgnan_ldcfm
National Sea Grant httpwwwnsgoseagrantorg
National Sea Grant Library University of Rhode Island httpnsgdgsouriedu
National Sea Grant Nonindigenous Species Site (SGNIS) httpwwwsgnisorg
National Sea Grant Non-indigenous Species Research and Outreach httpwwwnsgoseagrantorgresearchnonindigenousindexhtml
Northeast-Midwest Institute Biological Pollution - Aquatic Invasive Species httpwwwnemworgbiopollutehtm
RIDNIS Project University of California Davis httpwwwridnisucdaviseduindexhtml
San Francisco Bay Invasive Species RIDNIS Project University of California Davis httpwwwridnisucdaviseduNISofConcern1html
Smithsonian Environmental Research Center Marine Invasions Research Lab httpwwwsercsiedulabsmarine_invasions
US Geological Service Nonindigenous Aquatic Species Information Resource httpnaserusgsgov
Western Regional Panel on Aquatic Nuisance Species httpanswestfwsgov
Washington Department of Fish and Wildlife httpwwwwdfwwagovfishansgreencrabhtm
64
- The Economic Impacts of Aquatic Invasive SpeciesA Review of the Literature
- The Economic Impacts of Aquatic Invasive SpeciesA Review of the Literature
- Sabrina J Lovell and Susan F Stone
- Abstract
- Introduction
- General Cost Studies
- Theoretical Economic Research and Models
- Bioeconomic Models
- Trade-Related Studies
- Empirical Cost and Benefits Estimates by Species
- Fish
- Plants
- 13Crustaceans
- Mollusks
- Plants
- Conclusion
- Table 1
- INVASIVE SPECIES BIBLIOGRAPHY
- Web Sites on Invasive Species
-
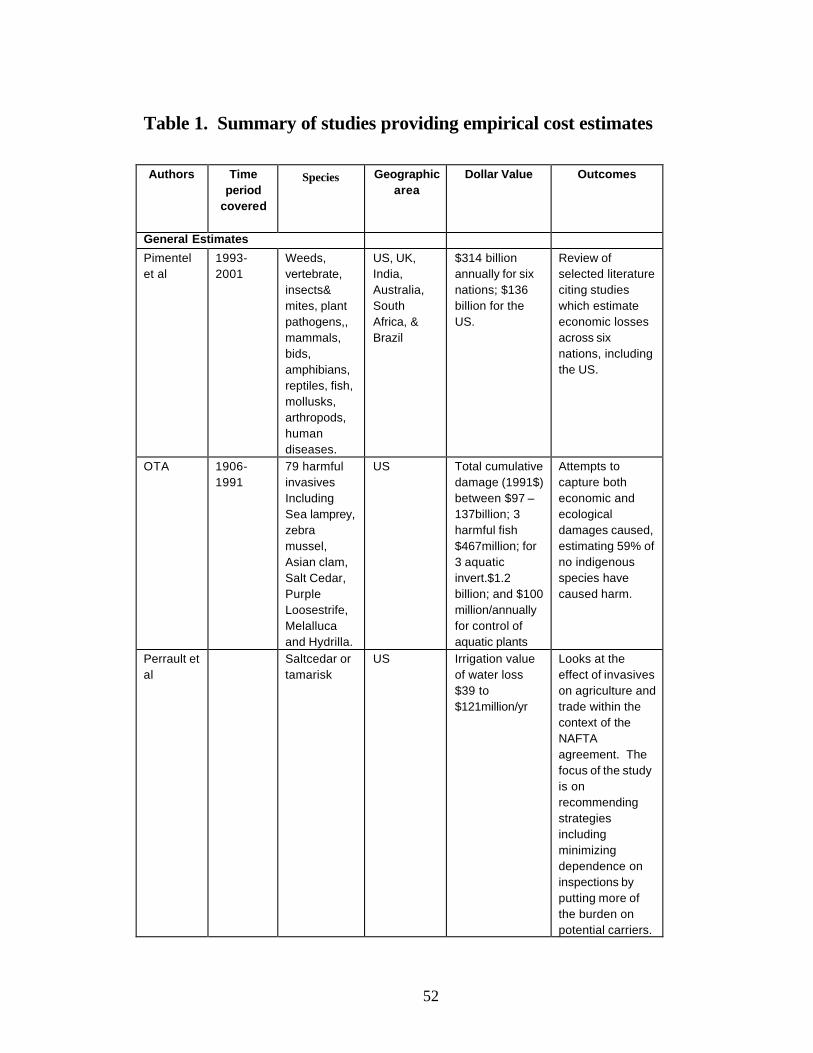
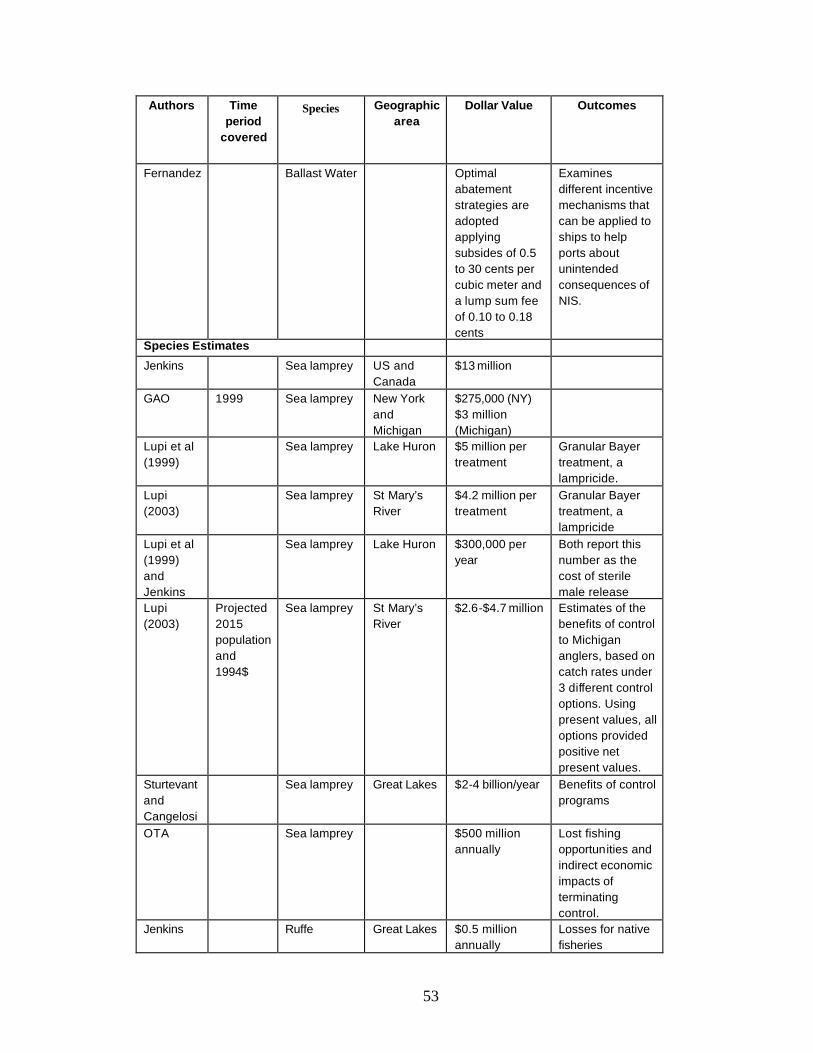
Authors Time period
covered
Species Geographic area
Dollar Value Outcomes
Fernandez Ballast Water Optimal abatement strategies are adopted applying subsides of 05 to 30 cents per cubic meter and a lump sum fee of 010 to 018 cents
Examines different incentive mechanisms that can be applied to ships to help ports about unintended consequences of NIS
Species Estimates
Jenkins Sea lamprey US and Canada
$13 million
GAO 1999 Sea lamprey New York and Michigan
$275000 (NY) $3 million (Michigan)
Lupi et al (1999)
Sea lamprey Lake Huron $5 million per treatment
Granular Bayer treatment a lampricide
Lupi (2003)
Sea lamprey St Maryrsquos River
$42 million per treatment
Granular Bayer treatment a lampricide
Lupi et al (1999) and Jenkins
Sea lamprey Lake Huron $300000 per year
Both report this number as the cost of sterile male release
Lupi (2003)
Projected 2015 population and 1994$
Sea lamprey St Maryrsquos River
$26-$47 million Estimates of the benefits of control to Michigan anglers based on catch rates under 3 different control options Using present values all options provided positive net present values
Sturtevant and Cangelosi
Sea lamprey Great Lakes $2-4 billionyear Benefits of control programs
OTA Sea lamprey $500 million annually
Lost fishing opportunities and indirect economic impacts of terminating control
Jenkins Ruffe Great Lakes $05 million annually
Losses for native fisheries
53
Authors Time period
covered
Species Geographic area
Dollar Value Outcomes
Hushak 1985shy1995
Ruffe Lake Erie $600 million Estimated losses to sport fishery
Leigh Ruffe $12 million Estimated total cost of control program that would run over 11 years
Leigh Ruffe $513 million The same study estimated the benefits of these control programs both sport and commercial fishing Estimates of the net present value of the control programs ranged from $105 to $931 million
Licking Green Crab $44 million Not clear what these costs included
Various Zebra mussel $5 billion There are many studies which have attempted to estimate the costs of the zebra mussel This is a commonly quoted figure
Sun 1990shy Zebra mussel Great Lakes $5 billion Sun reports the 2000 results of a US
Fish and Wildlife estimate
Cataldo 10 year Zebra mussel Great Lakes $31 billion Armour et al
Zebra mussel Great Lakes $100 million annually
Costs to approximately 46 power plants
USGS Zebra mussel Great Lakes $83000per plantyr (hydroelectric plants) $145000per plantyr (fossilshyfuel plants) $822000per plantyr (nuclear plants)
54
Authors Time period
covered
Species Geographic area
Dollar Value Outcomes
OrsquoNeill 1995 Zebra mussel 35 US States and 3 Canadian provinces
$69 million and a mean of $205570 per facility
Looked at 339 facilities and measured the economic impact
OrsquoNeill 1989shy1995
Zebra mussel $176 million annually
Estimated that the annual costs increased from $234000 to $178 million
Licking Zebra mussel Great Lakes $3 billion annually
Estimated expenditures by water power plants
Hushak and Deng
1992shy1994
Zebra mussel $88 million annually
Research expenditures
Ruetter Zebra mussel Great Lakes $350000shy$400000 annually
Estimated control costs of average large water user Another study stated same figures but for cleaning water intake pipes only
Park and 1989shy Zebra mussel Great Lakes $120 million total This was based Husak 1994 for period or $30
million annually between 1992 and 1994
on $043 million average costs per a survey of 142 facilities
Vilaplana Zebra mussel Lake Erie $94 average Survey of and costs for recreational users Hushak protective paint
$171 maintenance and $207 insurance
increased expenses Low response rate
OTA Early 1980rsquos
Asian Clam $45 million in 1980 and $1 billion in annual losses
$45 million figure is compliance costs for nuclear electric industry
55
Authors Time period
covered
Species Geographic area
Dollar Value Outcomes
Plant Estimates OTA Hydrilla Florida $145 million
annually Estimated control costs
Pimnetel et al
European loosestrife
$45 million annually
Estimated control costs and forage losses
Rockwell 1984 Aquatic weeds
Florida $14 million Aquatic weed control expenditures
Rockwell 1991 Aquatic weeds
Florida $73 million annually
Estimated benefits for residential damage control in 11 Florida counties
Rockwell 1992 Aquatic weeds
Florida $5000-$8000 per acre
Benefits of control programs to citrus production
Rockwell 1993 Aquatic weeds
Florida $300000 Benefits of control programs to vegetable production
Rockwell Aquatic weeds
Illinois Florida Alabama and British Columbia
$176000-$13 million
Annual willingness to pay for recreational benefits of weed control
Rockwell 1986 and 1995
Aquatic weeds
Illinois Florida Alabama and British Columbia
$10 million in total economic impacts $900000 in 1986 expenditures and $100 million in 1995 expenditures
Annual willingness to pay for recreational benefits of weed control
Rockwell Aquatic weeds
National $1 - $10 billion Impacts estimated extrapolating from the Florida estimates
Rockwell Aquatic weeds
National $17 million Costs to treat (chemicals) weeds estimated extrapolating from the Florida estimates
56
INVASIVE SPECIES BIBLIOGRAPHY
Anonymous 1999 ldquoMusseling inrdquo Electric Perspectives Vol 24(6) 14
Armour AF Tsou JL and Wiancko PM 1993 ldquoZebra Mussels The Industrial Impactrdquo Third International Zebra Mussel Conference Toronto February
Barbier EB 2001 ldquoA Note on the economics of biological invasionsrdquo Ecol Econ Vol 39 197-202
Buhle E M Margolis and JL Ruesink 2004 ldquoBang for the Buck Cost-Effective Control of Invasive Species with Different Life Historiesrdquo Resources for the Future Discussion Paper 04-06
Burnham M 2004 ldquoFront Lines of Battle Against Invaders Increasingly Localrdquo LandLetters httpwwweenewsnetLandletterBackissues02120404htm accessed 13 February 2004
Cataldo R 2001 Musseling in on the Ninth District Economyrdquo Fedgazette Vol 13(1) 15-17
Cohen A and Carlton J 1995 Nonindigenous Aquatic Species in a United States Estuary A Case Study of the Biological Invasions of the San Francisco Bay and Delta US Fish and Wildlife Service and National Sea Grant (Connecticut Sea Grant) NOAA Grant NA36RG0467)
Colautti Robert I AJ Niimi CDA van Overdijk EL Mills K Holeck and HJ MacIsaac 2003 ldquoSpatial and temporal analysis of transoceanic shipping vectors in Great Lackrdquo in Invasive Species Vectors and Management Strategies G Ruiz and JJ Carlton (eds) 227-246
Costello C and McAusland C 2003 ldquoProtectionism Trade and Measures of Damage from Exotic Species Introductionrdquo Amer J of Agric Econ Vol 85 No 4 964- 975
Courtenay WR Jr 1993 ldquoBio logical Pollution Through Fish Introductionsrdquo In Biological Pollution The Control and Impact of Invasive Exotic Species BN McKnight (ed) Indiana Academy of Science Indianapolis 35-60
Dalmazzone S 2000 ldquoEconomic Factors affecting vulnerability to biological invasionsrdquo in Economics of Biological Invasions Perrings Williamson and Dalmazzone (eds) 17shy30
57
Eiswerth ME and G C van Kooten 2002 ldquoUncertainty Economic and the Spread of an Invasive Plant Speciesrdquo American Journal of Agricultural Economics Vol 84 November 1317-1322
Evans EA 2003 ldquoEconomic Dimensions of Invasive Speciesrdquo Choices Second Quarter 5-9
Fernandez L 2004 ldquoNAFTA and Member Country Strategies for Maritime Trade and Marine Invasive Speciesrdquo NAREA Workshop on Trade and the Environment Halifax Nova Scotia June
Governments of the United States of America and Canada1997 State of the Great Lakes 1997 Prepared by Environment Canada and the US EPA Availability httpwwwonecgccaglimrdatastate-of-the- lakes97introhtml
Governments of the United States of America and Canada 1999 State of the Great Lakes 1999 Prepared by Environment Canada and the US EPA Availability httpwwwonecgccaglimrdatastate-of-the- lakes99
Horan RD and F Lupi 2004 ldquoEconomic incentives for controlling trade-related biological invasions in the Great Lakesrdquo NAREA Workshop on Trade and the Environment Halifax Nova Scotia June
Horan RD C Perrings F Lupi and EH Bulte 2002 ldquoBiological Pollution Prevention Strategies Under Ignorance The Case of Invasive Speciesrdquo Amer J Agr Econ Vol 84 No 5 1303-1310
Hushak LJ Y Deng and M Bielen 1995 ldquoThe Cost of Zebra Mussel Monitoring and Controlrdquo Aquatic Nuisance Species Digest Vol 1 No 1 5
Hushak LJ Y Deng and M Bielen 1995 ldquoWater User Expenditures on Zebra Mussel Monitoring and Controlrdquo Progress Report Ohio Sea Grant College Program Columbus OH April
Hushak L 1996 ldquoPresent and expected economic costs of Zebra Mussel damages to water users with Great Lakes water intakesrdquo Ohio Sea Grant College Program Project RZM-12 Availability httpwwwsgohio-stateeduprojectRZM-12htm
Hushak LJ and Y Deng 1997 ldquoCosts of Alternative Zebra Mussel Control Strategies The Case of Great Lakes Surface Water Usersrdquo Seventh International Zebra Mussel and Other Aquatic Nuisance Species Conference New Orleans Louisiana January
Jenkins P 1996 ldquoFree Trade and Exotic Species Introductionrdquo Conservation Biology V10 No1 pp 300-302
58
Jenkins P 2001 Economic Impacts of Aquatic Nuisance Species in the Great Lakes A report prepared by Philip Jenkins and Associates Ltd for Environment Canada Burlington Ontario
Knowler D and EB Barbier 2000 ldquoThe Economics of an Invading Species a Theoretical Model and Case Study Applicationrdquo In The Economics of Biolo gical Invasions Perrings C M Williamson and S Dalmazzone (eds) 2000 Edward Elgar Cheltenham 70-93
Krcmar-Nozic E GC Van Kooten and B Wilson 2000 ldquoTreat to Biodiversity The Invasion of Exotic Speciesrdquo Conserving Naturersquos Diversity GC Van Kooten EH Bulte and ARE Sinclair (eds) Ashgate Burlington VT pp 68-87
Leigh P 1998 ldquoBenefits and costs of the ruffe control program for the Great Lakes Fisheryrdquo J of Great Lakes Res Vol 24 No 2 351-360
Leung B DM Lodge D Finnoff JF Shogren MA Lewis and G Lamberti 2002 ldquoAN ounce of prevention or a pound of cure bioeconomic risk analysis of invasive speciesrdquo Proceedings of the Royal Society of London Biological Sciences Vol 269 No 1508 2407-2413
Levine J and C DrsquoAntonio 2003 ldquoForecasting Biological Invasions with Increasing International Traderdquo Conservation Biology V17 No1 pp 322-326 February
Licking E 1999 ldquoForeign species are invading the US - and costing plentyrdquo Business Week Vol 3630 68
Lupi F Hoehn J and Christie G 1999 ldquoValuing Non Indigenous Species Control and Native Species Restoration in Lake Huronrdquo Benefits and Costs in Natural Resource Planning (W Douglas Shaw ed) Western Regional Research Publication
Lupi F J Hoehn and G Christie 2003 ldquoUsing and Economic Model of Recreational Fishing to Evaluate the Benefits of Sea Lamprey Control on the St Maryrsquos Riverrdquo J Great Lakes Res Vol 29 (Supplement 1) 742-754
Lynch L 2002 ldquoMigration of Exotic Pests Phytosantary Regulations and Cooperative Policies to Protect US Ecosystems and Agricultural Interestrdquo In Both Sides of the Border L Fernandez and RT Carson (eds) Kluwer Academic Publishers The Netherlands 455-484
MacIsaac H J T C Robbins and MA Lewis 2002 ldquoModeling shipsrsquo ballast water as invasion threats to the Great Lakesrdquo Canad J of Fisheries and Aquatic Sciences Vol 59 1245-1256
Margolis M and JF Shogren 2004 ldquoHow Trade Politics Affect Invasive Species Controlrdquo Resources for the Future Discussion Paper 04-01 January
59
McAusland C and C Costello 2004 ldquoAvoiding Invasives Trade related policies for controlling unintentional exotic species introductionsrdquo J of Environ Econ and Manage Vol 48 954-977
Nadol V 1999 ldquoAquatic Invasive Species in the Coastal West An Analysis of State Regulation within a Federal Frameworkrdquo Environmental Law Vol 29 No 2 339-376
Naylor RL 2000 ldquoThe economics of alien species invasionsrdquo In Mooney HA and Hobbs RJ (eds) Invasive Species in a Changing World Washington DC Island Press 241-259
Office of Technology Assessment US Congress (OTA) 1993 Harmful Non-Indigenous Species in the United States OTA Publication OTA-F-565 US Government Printing Office Washington DC Availability httpwwwwwsprincetonedu80~otadisk119939325_nhtml
ONeill C 1997 ldquoEconomic impact of Zebra Mussels Results of the 1995 Zebra Mussel Information Clearinghouse Studyrdquo Great Lakes Res Review Vol 3 No 1 35-42
Olson L J and S Roy 2002 ldquoThe economics of controlling a stochastic biological invasionrdquo Amer J of Agric Econ November 1311-1316
Park J and Hushak LJ 1999 ldquoZebra Mussel Control Costs in Surface Water Using Facilitiesrdquo Technical Summary OHSU-TS-028 Ohio Sea Grant College Program Columbus OH
Perrault Anne Morgan Bennett Sta Burgiel Aimee Delach and Carroll Muffett 2003 Invasive Species Agriculture and Trade Case Studies form the NAFTA Context prepared by Center for International Environmental Law and Defenders of Wildlife for the North American Commission for Environmental Cooperation February
Perrings C M Williamson and S Dalmazzone (eds) 2000 The Economics of Biological Invasions Cheltenham Edward Elgar
Perrings C 2000 ldquoThe Economics of Biological Invasionsrdquo Workshop on Best Management Practices for Preventing and Controlling Invasive Alien Species February
Perrings C M Williamson EB Barbier D Delfino S Dalmazzone J Shogren P Simmons and A Watkinson 2002 ldquoBiological Invasion Risks and the Public Good An Economic Perspectiverdquo Cons Ecol Vol 6 No 1 httpwwwconsecolorgvol6iss1art1
Pimentel D L Lach R Zuniga and D Morrison 2000 ldquoEnvironmental and Economic Costs of Nonindigenous Species in the United Statesrdquo Bioscience 50(1) 53-56
60
Pimentel David S McNair S Janecka J Wightman C Simmonds C OConnell E Wong L Russel J Zern T Aquino and T Tsomondo 2001 Economic and environmental threats of alien plant animal and microbe invasions Agriculture Ecosystems and Environment 84 p 1-20
Planet Ark 2004 ldquoUN Agrees on Laws Against lsquoAlienrsquo Marine Invadersrdquo 16 February wwwplanetarkcomdailynewsstorycfmnewsid23827storyhtm Accessed on February 7 2004
Polasky S C Costello and C McAusland 2004 ldquoOn trade land-use and biodiversityrdquo J of Environ Econ and Manage Vol 48 911-925
Reutter JM 1997 ldquoImportance of the nonindigenous speciesaquatic nuisance species issuerdquo in Zebra Mussels and Aquatic Nuisance Species DItri FM (ed) Ann Arbor Press Inc Chelsea MI 65-68
Rockwell HW Jr 2003 ldquoSummary of a Survey of the Literature on the Economic Impact of Aquatic Weedsrdquo Report for the Aquatic Ecosystem Restoration Foundation August httpwwwaquaticsorgpubseconomicshtm
Settle C and JF Shogren 2002 ldquoModeling Native-Exotic Species Within Yellowstone Lakerdquo Amer J Agr Econ Vol 84 No 5 1323-1328
Sharov AA and Liebhold AM 1998 ldquoBioeconomics of managing the spread of exotic pest species with barrier zonesrdquo Ecol Applic Vol 8 No 3 833-845
Shogren JF 2000 ldquoRisk Reduction Strategies against the lsquoexplosive invaderrsquordquo in The Economics of Biological Invasions Perrings C M Williamson and S Dalmazzone (eds) Edward Elgar Cheltenham 56-69
Smith LD MJ Wonham LD McCann GM Ruiz AH Hines and JT Carlton 1999 ldquoInvasion Pressure to a Ballast-Flooded Estuary and an Assessment of Inoculant Survivalrdquo Biological Invasions 1 67-87
Sturtevant R and Cangelosi A 2000 The Great Lakes at the Millennium Priorities for Fiscal 2001 Prepared for the Northeast Midwest Institute Washington DC
Sun J F 1994 ldquoThe Evaluation of Impacts of Colonization of Zebra Mussels on the Recreational Demand in Lake Erierdquo Fourth International Zebra Mussel Conference Madison Wisconsin March Availability httpwwwsgnisorgpublicat108htm
Thomas M H and A Randall 2000 ldquoIntentional introductions of nonindigenous species a principal-agent model and protocol for revocable decisionsrdquo Ecol Econ Vol 34 333-345
61
Vilaplana JV and LJ Hushak 1994 ldquoRecreation and the Zebra Mussel in Lake Erie Ohiordquo Technical Summary OHSU-TS-023 Ohio Sea Grant College Program Columbus OH
United States General Accounting Office (GAO) 2000 Invasive species Federal and Selected State Funding to Address Harmful Nonnative Species report to congressional committees United States General Accounting Office Washington DC Availability httppurlaccessgpogovGPOLPS8271
United States General Accounting Office (GAO) 2001 ldquoObstacles Hindering Federal Rapid Response to Growing Threatrdquo United States General Accounting Office GAO-01shy724 August
United States National Invasive Species Council (NISC) 2000 National Invasive Species Management Plan (2000 Draft) US Department of the Interior Washington DC
United States National Invasive Species Council (NISC) 2001 Meeting the Invasive Species Challenge National Invasive Species Management Plan October
Wilcove DS D Rothstein J Dubow A Phillips and E Losos 1998 ldquoQuantifying Threats to Imperiled Species in the United Statesrdquo BioScience 48 607-615
62
Web Sites on Invasive Species
Aquatic Ecosystem Restoration Foundation httpwwwaquaticsorgindexhtml
California Department of Fish and Game Chinese Mitten Crab Site httpwwwdeltadfgcagovmittencrab
Chesapeake Bay Program Invasive Species in the Chesapeake Bay Watershed Workshop httpwwwmdsgumdeduexoticsworkshopindexhtml
Exotic Aquatics on the Move httpagancspurdueeduEXOTICSrelated_linkshtm
Invasivespeciesgov The Nations Invasive Species Information System httpwwwinvasivespeciesgov
Great Lakes Commission Aquatic Nuisance Species httpwwwglcorgans
Great Lakes Fishery Commission httpwwwglfcorg
Great Lakes Fishery Commission 2004 Sea Lamprey Control httpwwwglfcorgsealamphowasp
Great Lakes Information Network (GLIN) Invasive Species in the Great Lakes Region httpwwwgreat- lakesnetenvtflora-faunainvasiveinvasivehtml
Global Ballast Management Programme httpgloballastimoorg
Integrated Systems for Invasive Species Ecological Forecasting and Risk Analysis for Nonindigenous Species httpwwwmathualbertaca~mathbioISISindexhtml
Massachusetts Aquatic Invasive Species Management Plan httpwwwmassgovczminvasivemanagementplanhtm
National Aquatic Nuisance Species (ANS) Task Force httpwwwanstaskforcegovindexhtm
63
National Aquatic Nuisance Species Clearinghouse New York Sea Grant httpwwwaquaticinvadersorgnan_ldcfm
National Sea Grant httpwwwnsgoseagrantorg
National Sea Grant Library University of Rhode Island httpnsgdgsouriedu
National Sea Grant Nonindigenous Species Site (SGNIS) httpwwwsgnisorg
National Sea Grant Non-indigenous Species Research and Outreach httpwwwnsgoseagrantorgresearchnonindigenousindexhtml
Northeast-Midwest Institute Biological Pollution - Aquatic Invasive Species httpwwwnemworgbiopollutehtm
RIDNIS Project University of California Davis httpwwwridnisucdaviseduindexhtml
San Francisco Bay Invasive Species RIDNIS Project University of California Davis httpwwwridnisucdaviseduNISofConcern1html
Smithsonian Environmental Research Center Marine Invasions Research Lab httpwwwsercsiedulabsmarine_invasions
US Geological Service Nonindigenous Aquatic Species Information Resource httpnaserusgsgov
Western Regional Panel on Aquatic Nuisance Species httpanswestfwsgov
Washington Department of Fish and Wildlife httpwwwwdfwwagovfishansgreencrabhtm
64
- The Economic Impacts of Aquatic Invasive SpeciesA Review of the Literature
- The Economic Impacts of Aquatic Invasive SpeciesA Review of the Literature
- Sabrina J Lovell and Susan F Stone
- Abstract
- Introduction
- General Cost Studies
- Theoretical Economic Research and Models
- Bioeconomic Models
- Trade-Related Studies
- Empirical Cost and Benefits Estimates by Species
- Fish
- Plants
- 13Crustaceans
- Mollusks
- Plants
- Conclusion
- Table 1
- INVASIVE SPECIES BIBLIOGRAPHY
- Web Sites on Invasive Species
-
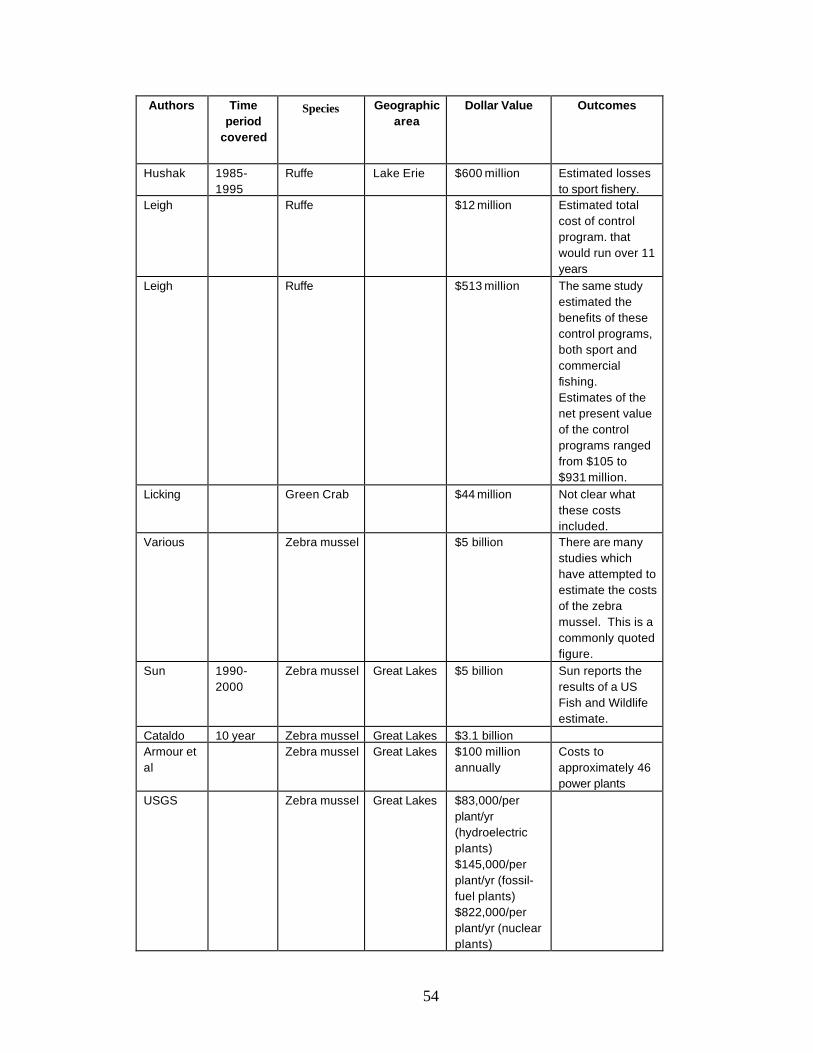
Authors Time period
covered
Species Geographic area
Dollar Value Outcomes
Hushak 1985shy1995
Ruffe Lake Erie $600 million Estimated losses to sport fishery
Leigh Ruffe $12 million Estimated total cost of control program that would run over 11 years
Leigh Ruffe $513 million The same study estimated the benefits of these control programs both sport and commercial fishing Estimates of the net present value of the control programs ranged from $105 to $931 million
Licking Green Crab $44 million Not clear what these costs included
Various Zebra mussel $5 billion There are many studies which have attempted to estimate the costs of the zebra mussel This is a commonly quoted figure
Sun 1990shy Zebra mussel Great Lakes $5 billion Sun reports the 2000 results of a US
Fish and Wildlife estimate
Cataldo 10 year Zebra mussel Great Lakes $31 billion Armour et al
Zebra mussel Great Lakes $100 million annually
Costs to approximately 46 power plants
USGS Zebra mussel Great Lakes $83000per plantyr (hydroelectric plants) $145000per plantyr (fossilshyfuel plants) $822000per plantyr (nuclear plants)
54
Authors Time period
covered
Species Geographic area
Dollar Value Outcomes
OrsquoNeill 1995 Zebra mussel 35 US States and 3 Canadian provinces
$69 million and a mean of $205570 per facility
Looked at 339 facilities and measured the economic impact
OrsquoNeill 1989shy1995
Zebra mussel $176 million annually
Estimated that the annual costs increased from $234000 to $178 million
Licking Zebra mussel Great Lakes $3 billion annually
Estimated expenditures by water power plants
Hushak and Deng
1992shy1994
Zebra mussel $88 million annually
Research expenditures
Ruetter Zebra mussel Great Lakes $350000shy$400000 annually
Estimated control costs of average large water user Another study stated same figures but for cleaning water intake pipes only
Park and 1989shy Zebra mussel Great Lakes $120 million total This was based Husak 1994 for period or $30
million annually between 1992 and 1994
on $043 million average costs per a survey of 142 facilities
Vilaplana Zebra mussel Lake Erie $94 average Survey of and costs for recreational users Hushak protective paint
$171 maintenance and $207 insurance
increased expenses Low response rate
OTA Early 1980rsquos
Asian Clam $45 million in 1980 and $1 billion in annual losses
$45 million figure is compliance costs for nuclear electric industry
55
Authors Time period
covered
Species Geographic area
Dollar Value Outcomes
Plant Estimates OTA Hydrilla Florida $145 million
annually Estimated control costs
Pimnetel et al
European loosestrife
$45 million annually
Estimated control costs and forage losses
Rockwell 1984 Aquatic weeds
Florida $14 million Aquatic weed control expenditures
Rockwell 1991 Aquatic weeds
Florida $73 million annually
Estimated benefits for residential damage control in 11 Florida counties
Rockwell 1992 Aquatic weeds
Florida $5000-$8000 per acre
Benefits of control programs to citrus production
Rockwell 1993 Aquatic weeds
Florida $300000 Benefits of control programs to vegetable production
Rockwell Aquatic weeds
Illinois Florida Alabama and British Columbia
$176000-$13 million
Annual willingness to pay for recreational benefits of weed control
Rockwell 1986 and 1995
Aquatic weeds
Illinois Florida Alabama and British Columbia
$10 million in total economic impacts $900000 in 1986 expenditures and $100 million in 1995 expenditures
Annual willingness to pay for recreational benefits of weed control
Rockwell Aquatic weeds
National $1 - $10 billion Impacts estimated extrapolating from the Florida estimates
Rockwell Aquatic weeds
National $17 million Costs to treat (chemicals) weeds estimated extrapolating from the Florida estimates
56
INVASIVE SPECIES BIBLIOGRAPHY
Anonymous 1999 ldquoMusseling inrdquo Electric Perspectives Vol 24(6) 14
Armour AF Tsou JL and Wiancko PM 1993 ldquoZebra Mussels The Industrial Impactrdquo Third International Zebra Mussel Conference Toronto February
Barbier EB 2001 ldquoA Note on the economics of biological invasionsrdquo Ecol Econ Vol 39 197-202
Buhle E M Margolis and JL Ruesink 2004 ldquoBang for the Buck Cost-Effective Control of Invasive Species with Different Life Historiesrdquo Resources for the Future Discussion Paper 04-06
Burnham M 2004 ldquoFront Lines of Battle Against Invaders Increasingly Localrdquo LandLetters httpwwweenewsnetLandletterBackissues02120404htm accessed 13 February 2004
Cataldo R 2001 Musseling in on the Ninth District Economyrdquo Fedgazette Vol 13(1) 15-17
Cohen A and Carlton J 1995 Nonindigenous Aquatic Species in a United States Estuary A Case Study of the Biological Invasions of the San Francisco Bay and Delta US Fish and Wildlife Service and National Sea Grant (Connecticut Sea Grant) NOAA Grant NA36RG0467)
Colautti Robert I AJ Niimi CDA van Overdijk EL Mills K Holeck and HJ MacIsaac 2003 ldquoSpatial and temporal analysis of transoceanic shipping vectors in Great Lackrdquo in Invasive Species Vectors and Management Strategies G Ruiz and JJ Carlton (eds) 227-246
Costello C and McAusland C 2003 ldquoProtectionism Trade and Measures of Damage from Exotic Species Introductionrdquo Amer J of Agric Econ Vol 85 No 4 964- 975
Courtenay WR Jr 1993 ldquoBio logical Pollution Through Fish Introductionsrdquo In Biological Pollution The Control and Impact of Invasive Exotic Species BN McKnight (ed) Indiana Academy of Science Indianapolis 35-60
Dalmazzone S 2000 ldquoEconomic Factors affecting vulnerability to biological invasionsrdquo in Economics of Biological Invasions Perrings Williamson and Dalmazzone (eds) 17shy30
57
Eiswerth ME and G C van Kooten 2002 ldquoUncertainty Economic and the Spread of an Invasive Plant Speciesrdquo American Journal of Agricultural Economics Vol 84 November 1317-1322
Evans EA 2003 ldquoEconomic Dimensions of Invasive Speciesrdquo Choices Second Quarter 5-9
Fernandez L 2004 ldquoNAFTA and Member Country Strategies for Maritime Trade and Marine Invasive Speciesrdquo NAREA Workshop on Trade and the Environment Halifax Nova Scotia June
Governments of the United States of America and Canada1997 State of the Great Lakes 1997 Prepared by Environment Canada and the US EPA Availability httpwwwonecgccaglimrdatastate-of-the- lakes97introhtml
Governments of the United States of America and Canada 1999 State of the Great Lakes 1999 Prepared by Environment Canada and the US EPA Availability httpwwwonecgccaglimrdatastate-of-the- lakes99
Horan RD and F Lupi 2004 ldquoEconomic incentives for controlling trade-related biological invasions in the Great Lakesrdquo NAREA Workshop on Trade and the Environment Halifax Nova Scotia June
Horan RD C Perrings F Lupi and EH Bulte 2002 ldquoBiological Pollution Prevention Strategies Under Ignorance The Case of Invasive Speciesrdquo Amer J Agr Econ Vol 84 No 5 1303-1310
Hushak LJ Y Deng and M Bielen 1995 ldquoThe Cost of Zebra Mussel Monitoring and Controlrdquo Aquatic Nuisance Species Digest Vol 1 No 1 5
Hushak LJ Y Deng and M Bielen 1995 ldquoWater User Expenditures on Zebra Mussel Monitoring and Controlrdquo Progress Report Ohio Sea Grant College Program Columbus OH April
Hushak L 1996 ldquoPresent and expected economic costs of Zebra Mussel damages to water users with Great Lakes water intakesrdquo Ohio Sea Grant College Program Project RZM-12 Availability httpwwwsgohio-stateeduprojectRZM-12htm
Hushak LJ and Y Deng 1997 ldquoCosts of Alternative Zebra Mussel Control Strategies The Case of Great Lakes Surface Water Usersrdquo Seventh International Zebra Mussel and Other Aquatic Nuisance Species Conference New Orleans Louisiana January
Jenkins P 1996 ldquoFree Trade and Exotic Species Introductionrdquo Conservation Biology V10 No1 pp 300-302
58
Jenkins P 2001 Economic Impacts of Aquatic Nuisance Species in the Great Lakes A report prepared by Philip Jenkins and Associates Ltd for Environment Canada Burlington Ontario
Knowler D and EB Barbier 2000 ldquoThe Economics of an Invading Species a Theoretical Model and Case Study Applicationrdquo In The Economics of Biolo gical Invasions Perrings C M Williamson and S Dalmazzone (eds) 2000 Edward Elgar Cheltenham 70-93
Krcmar-Nozic E GC Van Kooten and B Wilson 2000 ldquoTreat to Biodiversity The Invasion of Exotic Speciesrdquo Conserving Naturersquos Diversity GC Van Kooten EH Bulte and ARE Sinclair (eds) Ashgate Burlington VT pp 68-87
Leigh P 1998 ldquoBenefits and costs of the ruffe control program for the Great Lakes Fisheryrdquo J of Great Lakes Res Vol 24 No 2 351-360
Leung B DM Lodge D Finnoff JF Shogren MA Lewis and G Lamberti 2002 ldquoAN ounce of prevention or a pound of cure bioeconomic risk analysis of invasive speciesrdquo Proceedings of the Royal Society of London Biological Sciences Vol 269 No 1508 2407-2413
Levine J and C DrsquoAntonio 2003 ldquoForecasting Biological Invasions with Increasing International Traderdquo Conservation Biology V17 No1 pp 322-326 February
Licking E 1999 ldquoForeign species are invading the US - and costing plentyrdquo Business Week Vol 3630 68
Lupi F Hoehn J and Christie G 1999 ldquoValuing Non Indigenous Species Control and Native Species Restoration in Lake Huronrdquo Benefits and Costs in Natural Resource Planning (W Douglas Shaw ed) Western Regional Research Publication
Lupi F J Hoehn and G Christie 2003 ldquoUsing and Economic Model of Recreational Fishing to Evaluate the Benefits of Sea Lamprey Control on the St Maryrsquos Riverrdquo J Great Lakes Res Vol 29 (Supplement 1) 742-754
Lynch L 2002 ldquoMigration of Exotic Pests Phytosantary Regulations and Cooperative Policies to Protect US Ecosystems and Agricultural Interestrdquo In Both Sides of the Border L Fernandez and RT Carson (eds) Kluwer Academic Publishers The Netherlands 455-484
MacIsaac H J T C Robbins and MA Lewis 2002 ldquoModeling shipsrsquo ballast water as invasion threats to the Great Lakesrdquo Canad J of Fisheries and Aquatic Sciences Vol 59 1245-1256
Margolis M and JF Shogren 2004 ldquoHow Trade Politics Affect Invasive Species Controlrdquo Resources for the Future Discussion Paper 04-01 January
59
McAusland C and C Costello 2004 ldquoAvoiding Invasives Trade related policies for controlling unintentional exotic species introductionsrdquo J of Environ Econ and Manage Vol 48 954-977
Nadol V 1999 ldquoAquatic Invasive Species in the Coastal West An Analysis of State Regulation within a Federal Frameworkrdquo Environmental Law Vol 29 No 2 339-376
Naylor RL 2000 ldquoThe economics of alien species invasionsrdquo In Mooney HA and Hobbs RJ (eds) Invasive Species in a Changing World Washington DC Island Press 241-259
Office of Technology Assessment US Congress (OTA) 1993 Harmful Non-Indigenous Species in the United States OTA Publication OTA-F-565 US Government Printing Office Washington DC Availability httpwwwwwsprincetonedu80~otadisk119939325_nhtml
ONeill C 1997 ldquoEconomic impact of Zebra Mussels Results of the 1995 Zebra Mussel Information Clearinghouse Studyrdquo Great Lakes Res Review Vol 3 No 1 35-42
Olson L J and S Roy 2002 ldquoThe economics of controlling a stochastic biological invasionrdquo Amer J of Agric Econ November 1311-1316
Park J and Hushak LJ 1999 ldquoZebra Mussel Control Costs in Surface Water Using Facilitiesrdquo Technical Summary OHSU-TS-028 Ohio Sea Grant College Program Columbus OH
Perrault Anne Morgan Bennett Sta Burgiel Aimee Delach and Carroll Muffett 2003 Invasive Species Agriculture and Trade Case Studies form the NAFTA Context prepared by Center for International Environmental Law and Defenders of Wildlife for the North American Commission for Environmental Cooperation February
Perrings C M Williamson and S Dalmazzone (eds) 2000 The Economics of Biological Invasions Cheltenham Edward Elgar
Perrings C 2000 ldquoThe Economics of Biological Invasionsrdquo Workshop on Best Management Practices for Preventing and Controlling Invasive Alien Species February
Perrings C M Williamson EB Barbier D Delfino S Dalmazzone J Shogren P Simmons and A Watkinson 2002 ldquoBiological Invasion Risks and the Public Good An Economic Perspectiverdquo Cons Ecol Vol 6 No 1 httpwwwconsecolorgvol6iss1art1
Pimentel D L Lach R Zuniga and D Morrison 2000 ldquoEnvironmental and Economic Costs of Nonindigenous Species in the United Statesrdquo Bioscience 50(1) 53-56
60
Pimentel David S McNair S Janecka J Wightman C Simmonds C OConnell E Wong L Russel J Zern T Aquino and T Tsomondo 2001 Economic and environmental threats of alien plant animal and microbe invasions Agriculture Ecosystems and Environment 84 p 1-20
Planet Ark 2004 ldquoUN Agrees on Laws Against lsquoAlienrsquo Marine Invadersrdquo 16 February wwwplanetarkcomdailynewsstorycfmnewsid23827storyhtm Accessed on February 7 2004
Polasky S C Costello and C McAusland 2004 ldquoOn trade land-use and biodiversityrdquo J of Environ Econ and Manage Vol 48 911-925
Reutter JM 1997 ldquoImportance of the nonindigenous speciesaquatic nuisance species issuerdquo in Zebra Mussels and Aquatic Nuisance Species DItri FM (ed) Ann Arbor Press Inc Chelsea MI 65-68
Rockwell HW Jr 2003 ldquoSummary of a Survey of the Literature on the Economic Impact of Aquatic Weedsrdquo Report for the Aquatic Ecosystem Restoration Foundation August httpwwwaquaticsorgpubseconomicshtm
Settle C and JF Shogren 2002 ldquoModeling Native-Exotic Species Within Yellowstone Lakerdquo Amer J Agr Econ Vol 84 No 5 1323-1328
Sharov AA and Liebhold AM 1998 ldquoBioeconomics of managing the spread of exotic pest species with barrier zonesrdquo Ecol Applic Vol 8 No 3 833-845
Shogren JF 2000 ldquoRisk Reduction Strategies against the lsquoexplosive invaderrsquordquo in The Economics of Biological Invasions Perrings C M Williamson and S Dalmazzone (eds) Edward Elgar Cheltenham 56-69
Smith LD MJ Wonham LD McCann GM Ruiz AH Hines and JT Carlton 1999 ldquoInvasion Pressure to a Ballast-Flooded Estuary and an Assessment of Inoculant Survivalrdquo Biological Invasions 1 67-87
Sturtevant R and Cangelosi A 2000 The Great Lakes at the Millennium Priorities for Fiscal 2001 Prepared for the Northeast Midwest Institute Washington DC
Sun J F 1994 ldquoThe Evaluation of Impacts of Colonization of Zebra Mussels on the Recreational Demand in Lake Erierdquo Fourth International Zebra Mussel Conference Madison Wisconsin March Availability httpwwwsgnisorgpublicat108htm
Thomas M H and A Randall 2000 ldquoIntentional introductions of nonindigenous species a principal-agent model and protocol for revocable decisionsrdquo Ecol Econ Vol 34 333-345
61
Vilaplana JV and LJ Hushak 1994 ldquoRecreation and the Zebra Mussel in Lake Erie Ohiordquo Technical Summary OHSU-TS-023 Ohio Sea Grant College Program Columbus OH
United States General Accounting Office (GAO) 2000 Invasive species Federal and Selected State Funding to Address Harmful Nonnative Species report to congressional committees United States General Accounting Office Washington DC Availability httppurlaccessgpogovGPOLPS8271
United States General Accounting Office (GAO) 2001 ldquoObstacles Hindering Federal Rapid Response to Growing Threatrdquo United States General Accounting Office GAO-01shy724 August
United States National Invasive Species Council (NISC) 2000 National Invasive Species Management Plan (2000 Draft) US Department of the Interior Washington DC
United States National Invasive Species Council (NISC) 2001 Meeting the Invasive Species Challenge National Invasive Species Management Plan October
Wilcove DS D Rothstein J Dubow A Phillips and E Losos 1998 ldquoQuantifying Threats to Imperiled Species in the United Statesrdquo BioScience 48 607-615
62
Web Sites on Invasive Species
Aquatic Ecosystem Restoration Foundation httpwwwaquaticsorgindexhtml
California Department of Fish and Game Chinese Mitten Crab Site httpwwwdeltadfgcagovmittencrab
Chesapeake Bay Program Invasive Species in the Chesapeake Bay Watershed Workshop httpwwwmdsgumdeduexoticsworkshopindexhtml
Exotic Aquatics on the Move httpagancspurdueeduEXOTICSrelated_linkshtm
Invasivespeciesgov The Nations Invasive Species Information System httpwwwinvasivespeciesgov
Great Lakes Commission Aquatic Nuisance Species httpwwwglcorgans
Great Lakes Fishery Commission httpwwwglfcorg
Great Lakes Fishery Commission 2004 Sea Lamprey Control httpwwwglfcorgsealamphowasp
Great Lakes Information Network (GLIN) Invasive Species in the Great Lakes Region httpwwwgreat- lakesnetenvtflora-faunainvasiveinvasivehtml
Global Ballast Management Programme httpgloballastimoorg
Integrated Systems for Invasive Species Ecological Forecasting and Risk Analysis for Nonindigenous Species httpwwwmathualbertaca~mathbioISISindexhtml
Massachusetts Aquatic Invasive Species Management Plan httpwwwmassgovczminvasivemanagementplanhtm
National Aquatic Nuisance Species (ANS) Task Force httpwwwanstaskforcegovindexhtm
63
National Aquatic Nuisance Species Clearinghouse New York Sea Grant httpwwwaquaticinvadersorgnan_ldcfm
National Sea Grant httpwwwnsgoseagrantorg
National Sea Grant Library University of Rhode Island httpnsgdgsouriedu
National Sea Grant Nonindigenous Species Site (SGNIS) httpwwwsgnisorg
National Sea Grant Non-indigenous Species Research and Outreach httpwwwnsgoseagrantorgresearchnonindigenousindexhtml
Northeast-Midwest Institute Biological Pollution - Aquatic Invasive Species httpwwwnemworgbiopollutehtm
RIDNIS Project University of California Davis httpwwwridnisucdaviseduindexhtml
San Francisco Bay Invasive Species RIDNIS Project University of California Davis httpwwwridnisucdaviseduNISofConcern1html
Smithsonian Environmental Research Center Marine Invasions Research Lab httpwwwsercsiedulabsmarine_invasions
US Geological Service Nonindigenous Aquatic Species Information Resource httpnaserusgsgov
Western Regional Panel on Aquatic Nuisance Species httpanswestfwsgov
Washington Department of Fish and Wildlife httpwwwwdfwwagovfishansgreencrabhtm
64
- The Economic Impacts of Aquatic Invasive SpeciesA Review of the Literature
- The Economic Impacts of Aquatic Invasive SpeciesA Review of the Literature
- Sabrina J Lovell and Susan F Stone
- Abstract
- Introduction
- General Cost Studies
- Theoretical Economic Research and Models
- Bioeconomic Models
- Trade-Related Studies
- Empirical Cost and Benefits Estimates by Species
- Fish
- Plants
- 13Crustaceans
- Mollusks
- Plants
- Conclusion
- Table 1
- INVASIVE SPECIES BIBLIOGRAPHY
- Web Sites on Invasive Species
-
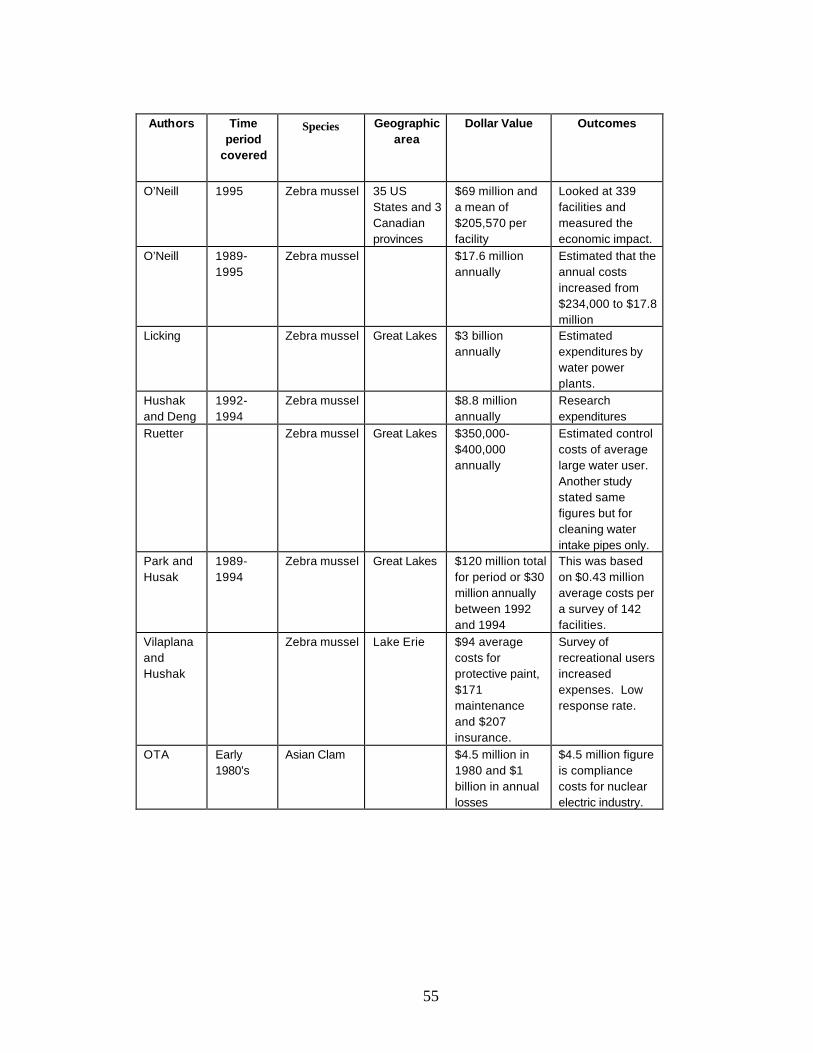
Authors Time period
covered
Species Geographic area
Dollar Value Outcomes
OrsquoNeill 1995 Zebra mussel 35 US States and 3 Canadian provinces
$69 million and a mean of $205570 per facility
Looked at 339 facilities and measured the economic impact
OrsquoNeill 1989shy1995
Zebra mussel $176 million annually
Estimated that the annual costs increased from $234000 to $178 million
Licking Zebra mussel Great Lakes $3 billion annually
Estimated expenditures by water power plants
Hushak and Deng
1992shy1994
Zebra mussel $88 million annually
Research expenditures
Ruetter Zebra mussel Great Lakes $350000shy$400000 annually
Estimated control costs of average large water user Another study stated same figures but for cleaning water intake pipes only
Park and 1989shy Zebra mussel Great Lakes $120 million total This was based Husak 1994 for period or $30
million annually between 1992 and 1994
on $043 million average costs per a survey of 142 facilities
Vilaplana Zebra mussel Lake Erie $94 average Survey of and costs for recreational users Hushak protective paint
$171 maintenance and $207 insurance
increased expenses Low response rate
OTA Early 1980rsquos
Asian Clam $45 million in 1980 and $1 billion in annual losses
$45 million figure is compliance costs for nuclear electric industry
55
Authors Time period
covered
Species Geographic area
Dollar Value Outcomes
Plant Estimates OTA Hydrilla Florida $145 million
annually Estimated control costs
Pimnetel et al
European loosestrife
$45 million annually
Estimated control costs and forage losses
Rockwell 1984 Aquatic weeds
Florida $14 million Aquatic weed control expenditures
Rockwell 1991 Aquatic weeds
Florida $73 million annually
Estimated benefits for residential damage control in 11 Florida counties
Rockwell 1992 Aquatic weeds
Florida $5000-$8000 per acre
Benefits of control programs to citrus production
Rockwell 1993 Aquatic weeds
Florida $300000 Benefits of control programs to vegetable production
Rockwell Aquatic weeds
Illinois Florida Alabama and British Columbia
$176000-$13 million
Annual willingness to pay for recreational benefits of weed control
Rockwell 1986 and 1995
Aquatic weeds
Illinois Florida Alabama and British Columbia
$10 million in total economic impacts $900000 in 1986 expenditures and $100 million in 1995 expenditures
Annual willingness to pay for recreational benefits of weed control
Rockwell Aquatic weeds
National $1 - $10 billion Impacts estimated extrapolating from the Florida estimates
Rockwell Aquatic weeds
National $17 million Costs to treat (chemicals) weeds estimated extrapolating from the Florida estimates
56
INVASIVE SPECIES BIBLIOGRAPHY
Anonymous 1999 ldquoMusseling inrdquo Electric Perspectives Vol 24(6) 14
Armour AF Tsou JL and Wiancko PM 1993 ldquoZebra Mussels The Industrial Impactrdquo Third International Zebra Mussel Conference Toronto February
Barbier EB 2001 ldquoA Note on the economics of biological invasionsrdquo Ecol Econ Vol 39 197-202
Buhle E M Margolis and JL Ruesink 2004 ldquoBang for the Buck Cost-Effective Control of Invasive Species with Different Life Historiesrdquo Resources for the Future Discussion Paper 04-06
Burnham M 2004 ldquoFront Lines of Battle Against Invaders Increasingly Localrdquo LandLetters httpwwweenewsnetLandletterBackissues02120404htm accessed 13 February 2004
Cataldo R 2001 Musseling in on the Ninth District Economyrdquo Fedgazette Vol 13(1) 15-17
Cohen A and Carlton J 1995 Nonindigenous Aquatic Species in a United States Estuary A Case Study of the Biological Invasions of the San Francisco Bay and Delta US Fish and Wildlife Service and National Sea Grant (Connecticut Sea Grant) NOAA Grant NA36RG0467)
Colautti Robert I AJ Niimi CDA van Overdijk EL Mills K Holeck and HJ MacIsaac 2003 ldquoSpatial and temporal analysis of transoceanic shipping vectors in Great Lackrdquo in Invasive Species Vectors and Management Strategies G Ruiz and JJ Carlton (eds) 227-246
Costello C and McAusland C 2003 ldquoProtectionism Trade and Measures of Damage from Exotic Species Introductionrdquo Amer J of Agric Econ Vol 85 No 4 964- 975
Courtenay WR Jr 1993 ldquoBio logical Pollution Through Fish Introductionsrdquo In Biological Pollution The Control and Impact of Invasive Exotic Species BN McKnight (ed) Indiana Academy of Science Indianapolis 35-60
Dalmazzone S 2000 ldquoEconomic Factors affecting vulnerability to biological invasionsrdquo in Economics of Biological Invasions Perrings Williamson and Dalmazzone (eds) 17shy30
57
Eiswerth ME and G C van Kooten 2002 ldquoUncertainty Economic and the Spread of an Invasive Plant Speciesrdquo American Journal of Agricultural Economics Vol 84 November 1317-1322
Evans EA 2003 ldquoEconomic Dimensions of Invasive Speciesrdquo Choices Second Quarter 5-9
Fernandez L 2004 ldquoNAFTA and Member Country Strategies for Maritime Trade and Marine Invasive Speciesrdquo NAREA Workshop on Trade and the Environment Halifax Nova Scotia June
Governments of the United States of America and Canada1997 State of the Great Lakes 1997 Prepared by Environment Canada and the US EPA Availability httpwwwonecgccaglimrdatastate-of-the- lakes97introhtml
Governments of the United States of America and Canada 1999 State of the Great Lakes 1999 Prepared by Environment Canada and the US EPA Availability httpwwwonecgccaglimrdatastate-of-the- lakes99
Horan RD and F Lupi 2004 ldquoEconomic incentives for controlling trade-related biological invasions in the Great Lakesrdquo NAREA Workshop on Trade and the Environment Halifax Nova Scotia June
Horan RD C Perrings F Lupi and EH Bulte 2002 ldquoBiological Pollution Prevention Strategies Under Ignorance The Case of Invasive Speciesrdquo Amer J Agr Econ Vol 84 No 5 1303-1310
Hushak LJ Y Deng and M Bielen 1995 ldquoThe Cost of Zebra Mussel Monitoring and Controlrdquo Aquatic Nuisance Species Digest Vol 1 No 1 5
Hushak LJ Y Deng and M Bielen 1995 ldquoWater User Expenditures on Zebra Mussel Monitoring and Controlrdquo Progress Report Ohio Sea Grant College Program Columbus OH April
Hushak L 1996 ldquoPresent and expected economic costs of Zebra Mussel damages to water users with Great Lakes water intakesrdquo Ohio Sea Grant College Program Project RZM-12 Availability httpwwwsgohio-stateeduprojectRZM-12htm
Hushak LJ and Y Deng 1997 ldquoCosts of Alternative Zebra Mussel Control Strategies The Case of Great Lakes Surface Water Usersrdquo Seventh International Zebra Mussel and Other Aquatic Nuisance Species Conference New Orleans Louisiana January
Jenkins P 1996 ldquoFree Trade and Exotic Species Introductionrdquo Conservation Biology V10 No1 pp 300-302
58
Jenkins P 2001 Economic Impacts of Aquatic Nuisance Species in the Great Lakes A report prepared by Philip Jenkins and Associates Ltd for Environment Canada Burlington Ontario
Knowler D and EB Barbier 2000 ldquoThe Economics of an Invading Species a Theoretical Model and Case Study Applicationrdquo In The Economics of Biolo gical Invasions Perrings C M Williamson and S Dalmazzone (eds) 2000 Edward Elgar Cheltenham 70-93
Krcmar-Nozic E GC Van Kooten and B Wilson 2000 ldquoTreat to Biodiversity The Invasion of Exotic Speciesrdquo Conserving Naturersquos Diversity GC Van Kooten EH Bulte and ARE Sinclair (eds) Ashgate Burlington VT pp 68-87
Leigh P 1998 ldquoBenefits and costs of the ruffe control program for the Great Lakes Fisheryrdquo J of Great Lakes Res Vol 24 No 2 351-360
Leung B DM Lodge D Finnoff JF Shogren MA Lewis and G Lamberti 2002 ldquoAN ounce of prevention or a pound of cure bioeconomic risk analysis of invasive speciesrdquo Proceedings of the Royal Society of London Biological Sciences Vol 269 No 1508 2407-2413
Levine J and C DrsquoAntonio 2003 ldquoForecasting Biological Invasions with Increasing International Traderdquo Conservation Biology V17 No1 pp 322-326 February
Licking E 1999 ldquoForeign species are invading the US - and costing plentyrdquo Business Week Vol 3630 68
Lupi F Hoehn J and Christie G 1999 ldquoValuing Non Indigenous Species Control and Native Species Restoration in Lake Huronrdquo Benefits and Costs in Natural Resource Planning (W Douglas Shaw ed) Western Regional Research Publication
Lupi F J Hoehn and G Christie 2003 ldquoUsing and Economic Model of Recreational Fishing to Evaluate the Benefits of Sea Lamprey Control on the St Maryrsquos Riverrdquo J Great Lakes Res Vol 29 (Supplement 1) 742-754
Lynch L 2002 ldquoMigration of Exotic Pests Phytosantary Regulations and Cooperative Policies to Protect US Ecosystems and Agricultural Interestrdquo In Both Sides of the Border L Fernandez and RT Carson (eds) Kluwer Academic Publishers The Netherlands 455-484
MacIsaac H J T C Robbins and MA Lewis 2002 ldquoModeling shipsrsquo ballast water as invasion threats to the Great Lakesrdquo Canad J of Fisheries and Aquatic Sciences Vol 59 1245-1256
Margolis M and JF Shogren 2004 ldquoHow Trade Politics Affect Invasive Species Controlrdquo Resources for the Future Discussion Paper 04-01 January
59
McAusland C and C Costello 2004 ldquoAvoiding Invasives Trade related policies for controlling unintentional exotic species introductionsrdquo J of Environ Econ and Manage Vol 48 954-977
Nadol V 1999 ldquoAquatic Invasive Species in the Coastal West An Analysis of State Regulation within a Federal Frameworkrdquo Environmental Law Vol 29 No 2 339-376
Naylor RL 2000 ldquoThe economics of alien species invasionsrdquo In Mooney HA and Hobbs RJ (eds) Invasive Species in a Changing World Washington DC Island Press 241-259
Office of Technology Assessment US Congress (OTA) 1993 Harmful Non-Indigenous Species in the United States OTA Publication OTA-F-565 US Government Printing Office Washington DC Availability httpwwwwwsprincetonedu80~otadisk119939325_nhtml
ONeill C 1997 ldquoEconomic impact of Zebra Mussels Results of the 1995 Zebra Mussel Information Clearinghouse Studyrdquo Great Lakes Res Review Vol 3 No 1 35-42
Olson L J and S Roy 2002 ldquoThe economics of controlling a stochastic biological invasionrdquo Amer J of Agric Econ November 1311-1316
Park J and Hushak LJ 1999 ldquoZebra Mussel Control Costs in Surface Water Using Facilitiesrdquo Technical Summary OHSU-TS-028 Ohio Sea Grant College Program Columbus OH
Perrault Anne Morgan Bennett Sta Burgiel Aimee Delach and Carroll Muffett 2003 Invasive Species Agriculture and Trade Case Studies form the NAFTA Context prepared by Center for International Environmental Law and Defenders of Wildlife for the North American Commission for Environmental Cooperation February
Perrings C M Williamson and S Dalmazzone (eds) 2000 The Economics of Biological Invasions Cheltenham Edward Elgar
Perrings C 2000 ldquoThe Economics of Biological Invasionsrdquo Workshop on Best Management Practices for Preventing and Controlling Invasive Alien Species February
Perrings C M Williamson EB Barbier D Delfino S Dalmazzone J Shogren P Simmons and A Watkinson 2002 ldquoBiological Invasion Risks and the Public Good An Economic Perspectiverdquo Cons Ecol Vol 6 No 1 httpwwwconsecolorgvol6iss1art1
Pimentel D L Lach R Zuniga and D Morrison 2000 ldquoEnvironmental and Economic Costs of Nonindigenous Species in the United Statesrdquo Bioscience 50(1) 53-56
60
Pimentel David S McNair S Janecka J Wightman C Simmonds C OConnell E Wong L Russel J Zern T Aquino and T Tsomondo 2001 Economic and environmental threats of alien plant animal and microbe invasions Agriculture Ecosystems and Environment 84 p 1-20
Planet Ark 2004 ldquoUN Agrees on Laws Against lsquoAlienrsquo Marine Invadersrdquo 16 February wwwplanetarkcomdailynewsstorycfmnewsid23827storyhtm Accessed on February 7 2004
Polasky S C Costello and C McAusland 2004 ldquoOn trade land-use and biodiversityrdquo J of Environ Econ and Manage Vol 48 911-925
Reutter JM 1997 ldquoImportance of the nonindigenous speciesaquatic nuisance species issuerdquo in Zebra Mussels and Aquatic Nuisance Species DItri FM (ed) Ann Arbor Press Inc Chelsea MI 65-68
Rockwell HW Jr 2003 ldquoSummary of a Survey of the Literature on the Economic Impact of Aquatic Weedsrdquo Report for the Aquatic Ecosystem Restoration Foundation August httpwwwaquaticsorgpubseconomicshtm
Settle C and JF Shogren 2002 ldquoModeling Native-Exotic Species Within Yellowstone Lakerdquo Amer J Agr Econ Vol 84 No 5 1323-1328
Sharov AA and Liebhold AM 1998 ldquoBioeconomics of managing the spread of exotic pest species with barrier zonesrdquo Ecol Applic Vol 8 No 3 833-845
Shogren JF 2000 ldquoRisk Reduction Strategies against the lsquoexplosive invaderrsquordquo in The Economics of Biological Invasions Perrings C M Williamson and S Dalmazzone (eds) Edward Elgar Cheltenham 56-69
Smith LD MJ Wonham LD McCann GM Ruiz AH Hines and JT Carlton 1999 ldquoInvasion Pressure to a Ballast-Flooded Estuary and an Assessment of Inoculant Survivalrdquo Biological Invasions 1 67-87
Sturtevant R and Cangelosi A 2000 The Great Lakes at the Millennium Priorities for Fiscal 2001 Prepared for the Northeast Midwest Institute Washington DC
Sun J F 1994 ldquoThe Evaluation of Impacts of Colonization of Zebra Mussels on the Recreational Demand in Lake Erierdquo Fourth International Zebra Mussel Conference Madison Wisconsin March Availability httpwwwsgnisorgpublicat108htm
Thomas M H and A Randall 2000 ldquoIntentional introductions of nonindigenous species a principal-agent model and protocol for revocable decisionsrdquo Ecol Econ Vol 34 333-345
61
Vilaplana JV and LJ Hushak 1994 ldquoRecreation and the Zebra Mussel in Lake Erie Ohiordquo Technical Summary OHSU-TS-023 Ohio Sea Grant College Program Columbus OH
United States General Accounting Office (GAO) 2000 Invasive species Federal and Selected State Funding to Address Harmful Nonnative Species report to congressional committees United States General Accounting Office Washington DC Availability httppurlaccessgpogovGPOLPS8271
United States General Accounting Office (GAO) 2001 ldquoObstacles Hindering Federal Rapid Response to Growing Threatrdquo United States General Accounting Office GAO-01shy724 August
United States National Invasive Species Council (NISC) 2000 National Invasive Species Management Plan (2000 Draft) US Department of the Interior Washington DC
United States National Invasive Species Council (NISC) 2001 Meeting the Invasive Species Challenge National Invasive Species Management Plan October
Wilcove DS D Rothstein J Dubow A Phillips and E Losos 1998 ldquoQuantifying Threats to Imperiled Species in the United Statesrdquo BioScience 48 607-615
62
Web Sites on Invasive Species
Aquatic Ecosystem Restoration Foundation httpwwwaquaticsorgindexhtml
California Department of Fish and Game Chinese Mitten Crab Site httpwwwdeltadfgcagovmittencrab
Chesapeake Bay Program Invasive Species in the Chesapeake Bay Watershed Workshop httpwwwmdsgumdeduexoticsworkshopindexhtml
Exotic Aquatics on the Move httpagancspurdueeduEXOTICSrelated_linkshtm
Invasivespeciesgov The Nations Invasive Species Information System httpwwwinvasivespeciesgov
Great Lakes Commission Aquatic Nuisance Species httpwwwglcorgans
Great Lakes Fishery Commission httpwwwglfcorg
Great Lakes Fishery Commission 2004 Sea Lamprey Control httpwwwglfcorgsealamphowasp
Great Lakes Information Network (GLIN) Invasive Species in the Great Lakes Region httpwwwgreat- lakesnetenvtflora-faunainvasiveinvasivehtml
Global Ballast Management Programme httpgloballastimoorg
Integrated Systems for Invasive Species Ecological Forecasting and Risk Analysis for Nonindigenous Species httpwwwmathualbertaca~mathbioISISindexhtml
Massachusetts Aquatic Invasive Species Management Plan httpwwwmassgovczminvasivemanagementplanhtm
National Aquatic Nuisance Species (ANS) Task Force httpwwwanstaskforcegovindexhtm
63
National Aquatic Nuisance Species Clearinghouse New York Sea Grant httpwwwaquaticinvadersorgnan_ldcfm
National Sea Grant httpwwwnsgoseagrantorg
National Sea Grant Library University of Rhode Island httpnsgdgsouriedu
National Sea Grant Nonindigenous Species Site (SGNIS) httpwwwsgnisorg
National Sea Grant Non-indigenous Species Research and Outreach httpwwwnsgoseagrantorgresearchnonindigenousindexhtml
Northeast-Midwest Institute Biological Pollution - Aquatic Invasive Species httpwwwnemworgbiopollutehtm
RIDNIS Project University of California Davis httpwwwridnisucdaviseduindexhtml
San Francisco Bay Invasive Species RIDNIS Project University of California Davis httpwwwridnisucdaviseduNISofConcern1html
Smithsonian Environmental Research Center Marine Invasions Research Lab httpwwwsercsiedulabsmarine_invasions
US Geological Service Nonindigenous Aquatic Species Information Resource httpnaserusgsgov
Western Regional Panel on Aquatic Nuisance Species httpanswestfwsgov
Washington Department of Fish and Wildlife httpwwwwdfwwagovfishansgreencrabhtm
64
- The Economic Impacts of Aquatic Invasive SpeciesA Review of the Literature
- The Economic Impacts of Aquatic Invasive SpeciesA Review of the Literature
- Sabrina J Lovell and Susan F Stone
- Abstract
- Introduction
- General Cost Studies
- Theoretical Economic Research and Models
- Bioeconomic Models
- Trade-Related Studies
- Empirical Cost and Benefits Estimates by Species
- Fish
- Plants
- 13Crustaceans
- Mollusks
- Plants
- Conclusion
- Table 1
- INVASIVE SPECIES BIBLIOGRAPHY
- Web Sites on Invasive Species
-
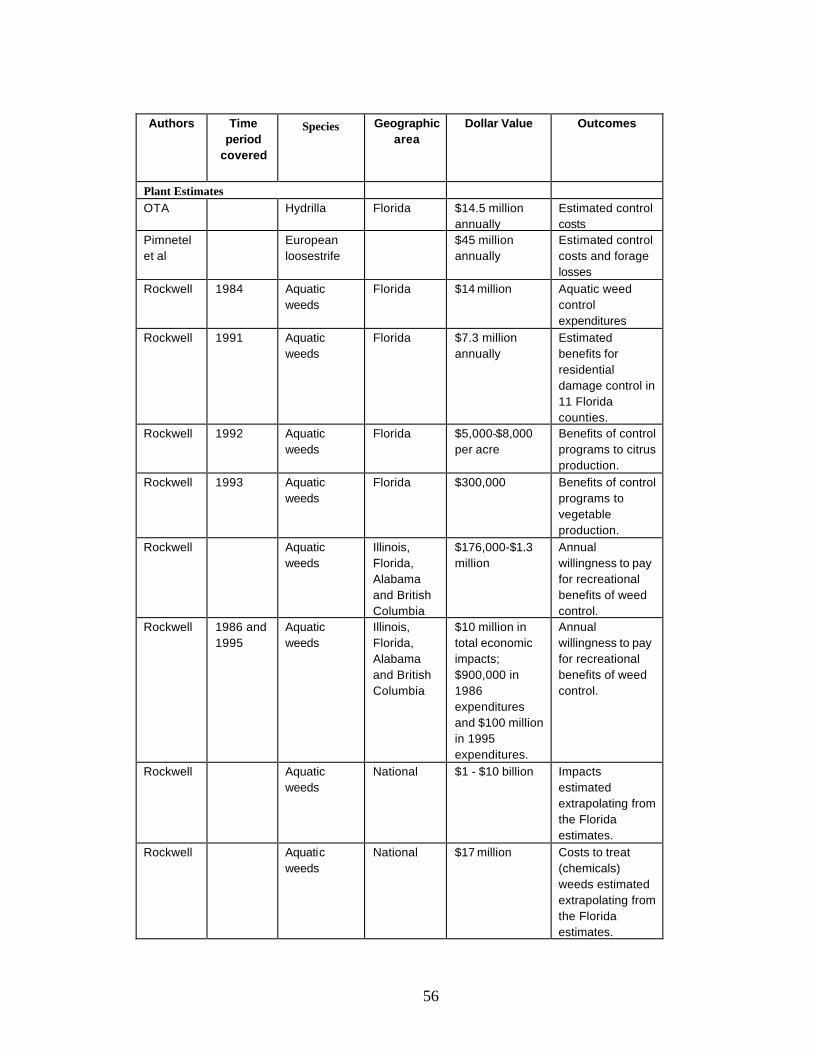
Authors Time period
covered
Species Geographic area
Dollar Value Outcomes
Plant Estimates OTA Hydrilla Florida $145 million
annually Estimated control costs
Pimnetel et al
European loosestrife
$45 million annually
Estimated control costs and forage losses
Rockwell 1984 Aquatic weeds
Florida $14 million Aquatic weed control expenditures
Rockwell 1991 Aquatic weeds
Florida $73 million annually
Estimated benefits for residential damage control in 11 Florida counties
Rockwell 1992 Aquatic weeds
Florida $5000-$8000 per acre
Benefits of control programs to citrus production
Rockwell 1993 Aquatic weeds
Florida $300000 Benefits of control programs to vegetable production
Rockwell Aquatic weeds
Illinois Florida Alabama and British Columbia
$176000-$13 million
Annual willingness to pay for recreational benefits of weed control
Rockwell 1986 and 1995
Aquatic weeds
Illinois Florida Alabama and British Columbia
$10 million in total economic impacts $900000 in 1986 expenditures and $100 million in 1995 expenditures
Annual willingness to pay for recreational benefits of weed control
Rockwell Aquatic weeds
National $1 - $10 billion Impacts estimated extrapolating from the Florida estimates
Rockwell Aquatic weeds
National $17 million Costs to treat (chemicals) weeds estimated extrapolating from the Florida estimates
56
INVASIVE SPECIES BIBLIOGRAPHY
Anonymous 1999 ldquoMusseling inrdquo Electric Perspectives Vol 24(6) 14
Armour AF Tsou JL and Wiancko PM 1993 ldquoZebra Mussels The Industrial Impactrdquo Third International Zebra Mussel Conference Toronto February
Barbier EB 2001 ldquoA Note on the economics of biological invasionsrdquo Ecol Econ Vol 39 197-202
Buhle E M Margolis and JL Ruesink 2004 ldquoBang for the Buck Cost-Effective Control of Invasive Species with Different Life Historiesrdquo Resources for the Future Discussion Paper 04-06
Burnham M 2004 ldquoFront Lines of Battle Against Invaders Increasingly Localrdquo LandLetters httpwwweenewsnetLandletterBackissues02120404htm accessed 13 February 2004
Cataldo R 2001 Musseling in on the Ninth District Economyrdquo Fedgazette Vol 13(1) 15-17
Cohen A and Carlton J 1995 Nonindigenous Aquatic Species in a United States Estuary A Case Study of the Biological Invasions of the San Francisco Bay and Delta US Fish and Wildlife Service and National Sea Grant (Connecticut Sea Grant) NOAA Grant NA36RG0467)
Colautti Robert I AJ Niimi CDA van Overdijk EL Mills K Holeck and HJ MacIsaac 2003 ldquoSpatial and temporal analysis of transoceanic shipping vectors in Great Lackrdquo in Invasive Species Vectors and Management Strategies G Ruiz and JJ Carlton (eds) 227-246
Costello C and McAusland C 2003 ldquoProtectionism Trade and Measures of Damage from Exotic Species Introductionrdquo Amer J of Agric Econ Vol 85 No 4 964- 975
Courtenay WR Jr 1993 ldquoBio logical Pollution Through Fish Introductionsrdquo In Biological Pollution The Control and Impact of Invasive Exotic Species BN McKnight (ed) Indiana Academy of Science Indianapolis 35-60
Dalmazzone S 2000 ldquoEconomic Factors affecting vulnerability to biological invasionsrdquo in Economics of Biological Invasions Perrings Williamson and Dalmazzone (eds) 17shy30
57
Eiswerth ME and G C van Kooten 2002 ldquoUncertainty Economic and the Spread of an Invasive Plant Speciesrdquo American Journal of Agricultural Economics Vol 84 November 1317-1322
Evans EA 2003 ldquoEconomic Dimensions of Invasive Speciesrdquo Choices Second Quarter 5-9
Fernandez L 2004 ldquoNAFTA and Member Country Strategies for Maritime Trade and Marine Invasive Speciesrdquo NAREA Workshop on Trade and the Environment Halifax Nova Scotia June
Governments of the United States of America and Canada1997 State of the Great Lakes 1997 Prepared by Environment Canada and the US EPA Availability httpwwwonecgccaglimrdatastate-of-the- lakes97introhtml
Governments of the United States of America and Canada 1999 State of the Great Lakes 1999 Prepared by Environment Canada and the US EPA Availability httpwwwonecgccaglimrdatastate-of-the- lakes99
Horan RD and F Lupi 2004 ldquoEconomic incentives for controlling trade-related biological invasions in the Great Lakesrdquo NAREA Workshop on Trade and the Environment Halifax Nova Scotia June
Horan RD C Perrings F Lupi and EH Bulte 2002 ldquoBiological Pollution Prevention Strategies Under Ignorance The Case of Invasive Speciesrdquo Amer J Agr Econ Vol 84 No 5 1303-1310
Hushak LJ Y Deng and M Bielen 1995 ldquoThe Cost of Zebra Mussel Monitoring and Controlrdquo Aquatic Nuisance Species Digest Vol 1 No 1 5
Hushak LJ Y Deng and M Bielen 1995 ldquoWater User Expenditures on Zebra Mussel Monitoring and Controlrdquo Progress Report Ohio Sea Grant College Program Columbus OH April
Hushak L 1996 ldquoPresent and expected economic costs of Zebra Mussel damages to water users with Great Lakes water intakesrdquo Ohio Sea Grant College Program Project RZM-12 Availability httpwwwsgohio-stateeduprojectRZM-12htm
Hushak LJ and Y Deng 1997 ldquoCosts of Alternative Zebra Mussel Control Strategies The Case of Great Lakes Surface Water Usersrdquo Seventh International Zebra Mussel and Other Aquatic Nuisance Species Conference New Orleans Louisiana January
Jenkins P 1996 ldquoFree Trade and Exotic Species Introductionrdquo Conservation Biology V10 No1 pp 300-302
58
Jenkins P 2001 Economic Impacts of Aquatic Nuisance Species in the Great Lakes A report prepared by Philip Jenkins and Associates Ltd for Environment Canada Burlington Ontario
Knowler D and EB Barbier 2000 ldquoThe Economics of an Invading Species a Theoretical Model and Case Study Applicationrdquo In The Economics of Biolo gical Invasions Perrings C M Williamson and S Dalmazzone (eds) 2000 Edward Elgar Cheltenham 70-93
Krcmar-Nozic E GC Van Kooten and B Wilson 2000 ldquoTreat to Biodiversity The Invasion of Exotic Speciesrdquo Conserving Naturersquos Diversity GC Van Kooten EH Bulte and ARE Sinclair (eds) Ashgate Burlington VT pp 68-87
Leigh P 1998 ldquoBenefits and costs of the ruffe control program for the Great Lakes Fisheryrdquo J of Great Lakes Res Vol 24 No 2 351-360
Leung B DM Lodge D Finnoff JF Shogren MA Lewis and G Lamberti 2002 ldquoAN ounce of prevention or a pound of cure bioeconomic risk analysis of invasive speciesrdquo Proceedings of the Royal Society of London Biological Sciences Vol 269 No 1508 2407-2413
Levine J and C DrsquoAntonio 2003 ldquoForecasting Biological Invasions with Increasing International Traderdquo Conservation Biology V17 No1 pp 322-326 February
Licking E 1999 ldquoForeign species are invading the US - and costing plentyrdquo Business Week Vol 3630 68
Lupi F Hoehn J and Christie G 1999 ldquoValuing Non Indigenous Species Control and Native Species Restoration in Lake Huronrdquo Benefits and Costs in Natural Resource Planning (W Douglas Shaw ed) Western Regional Research Publication
Lupi F J Hoehn and G Christie 2003 ldquoUsing and Economic Model of Recreational Fishing to Evaluate the Benefits of Sea Lamprey Control on the St Maryrsquos Riverrdquo J Great Lakes Res Vol 29 (Supplement 1) 742-754
Lynch L 2002 ldquoMigration of Exotic Pests Phytosantary Regulations and Cooperative Policies to Protect US Ecosystems and Agricultural Interestrdquo In Both Sides of the Border L Fernandez and RT Carson (eds) Kluwer Academic Publishers The Netherlands 455-484
MacIsaac H J T C Robbins and MA Lewis 2002 ldquoModeling shipsrsquo ballast water as invasion threats to the Great Lakesrdquo Canad J of Fisheries and Aquatic Sciences Vol 59 1245-1256
Margolis M and JF Shogren 2004 ldquoHow Trade Politics Affect Invasive Species Controlrdquo Resources for the Future Discussion Paper 04-01 January
59
McAusland C and C Costello 2004 ldquoAvoiding Invasives Trade related policies for controlling unintentional exotic species introductionsrdquo J of Environ Econ and Manage Vol 48 954-977
Nadol V 1999 ldquoAquatic Invasive Species in the Coastal West An Analysis of State Regulation within a Federal Frameworkrdquo Environmental Law Vol 29 No 2 339-376
Naylor RL 2000 ldquoThe economics of alien species invasionsrdquo In Mooney HA and Hobbs RJ (eds) Invasive Species in a Changing World Washington DC Island Press 241-259
Office of Technology Assessment US Congress (OTA) 1993 Harmful Non-Indigenous Species in the United States OTA Publication OTA-F-565 US Government Printing Office Washington DC Availability httpwwwwwsprincetonedu80~otadisk119939325_nhtml
ONeill C 1997 ldquoEconomic impact of Zebra Mussels Results of the 1995 Zebra Mussel Information Clearinghouse Studyrdquo Great Lakes Res Review Vol 3 No 1 35-42
Olson L J and S Roy 2002 ldquoThe economics of controlling a stochastic biological invasionrdquo Amer J of Agric Econ November 1311-1316
Park J and Hushak LJ 1999 ldquoZebra Mussel Control Costs in Surface Water Using Facilitiesrdquo Technical Summary OHSU-TS-028 Ohio Sea Grant College Program Columbus OH
Perrault Anne Morgan Bennett Sta Burgiel Aimee Delach and Carroll Muffett 2003 Invasive Species Agriculture and Trade Case Studies form the NAFTA Context prepared by Center for International Environmental Law and Defenders of Wildlife for the North American Commission for Environmental Cooperation February
Perrings C M Williamson and S Dalmazzone (eds) 2000 The Economics of Biological Invasions Cheltenham Edward Elgar
Perrings C 2000 ldquoThe Economics of Biological Invasionsrdquo Workshop on Best Management Practices for Preventing and Controlling Invasive Alien Species February
Perrings C M Williamson EB Barbier D Delfino S Dalmazzone J Shogren P Simmons and A Watkinson 2002 ldquoBiological Invasion Risks and the Public Good An Economic Perspectiverdquo Cons Ecol Vol 6 No 1 httpwwwconsecolorgvol6iss1art1
Pimentel D L Lach R Zuniga and D Morrison 2000 ldquoEnvironmental and Economic Costs of Nonindigenous Species in the United Statesrdquo Bioscience 50(1) 53-56
60
Pimentel David S McNair S Janecka J Wightman C Simmonds C OConnell E Wong L Russel J Zern T Aquino and T Tsomondo 2001 Economic and environmental threats of alien plant animal and microbe invasions Agriculture Ecosystems and Environment 84 p 1-20
Planet Ark 2004 ldquoUN Agrees on Laws Against lsquoAlienrsquo Marine Invadersrdquo 16 February wwwplanetarkcomdailynewsstorycfmnewsid23827storyhtm Accessed on February 7 2004
Polasky S C Costello and C McAusland 2004 ldquoOn trade land-use and biodiversityrdquo J of Environ Econ and Manage Vol 48 911-925
Reutter JM 1997 ldquoImportance of the nonindigenous speciesaquatic nuisance species issuerdquo in Zebra Mussels and Aquatic Nuisance Species DItri FM (ed) Ann Arbor Press Inc Chelsea MI 65-68
Rockwell HW Jr 2003 ldquoSummary of a Survey of the Literature on the Economic Impact of Aquatic Weedsrdquo Report for the Aquatic Ecosystem Restoration Foundation August httpwwwaquaticsorgpubseconomicshtm
Settle C and JF Shogren 2002 ldquoModeling Native-Exotic Species Within Yellowstone Lakerdquo Amer J Agr Econ Vol 84 No 5 1323-1328
Sharov AA and Liebhold AM 1998 ldquoBioeconomics of managing the spread of exotic pest species with barrier zonesrdquo Ecol Applic Vol 8 No 3 833-845
Shogren JF 2000 ldquoRisk Reduction Strategies against the lsquoexplosive invaderrsquordquo in The Economics of Biological Invasions Perrings C M Williamson and S Dalmazzone (eds) Edward Elgar Cheltenham 56-69
Smith LD MJ Wonham LD McCann GM Ruiz AH Hines and JT Carlton 1999 ldquoInvasion Pressure to a Ballast-Flooded Estuary and an Assessment of Inoculant Survivalrdquo Biological Invasions 1 67-87
Sturtevant R and Cangelosi A 2000 The Great Lakes at the Millennium Priorities for Fiscal 2001 Prepared for the Northeast Midwest Institute Washington DC
Sun J F 1994 ldquoThe Evaluation of Impacts of Colonization of Zebra Mussels on the Recreational Demand in Lake Erierdquo Fourth International Zebra Mussel Conference Madison Wisconsin March Availability httpwwwsgnisorgpublicat108htm
Thomas M H and A Randall 2000 ldquoIntentional introductions of nonindigenous species a principal-agent model and protocol for revocable decisionsrdquo Ecol Econ Vol 34 333-345
61
Vilaplana JV and LJ Hushak 1994 ldquoRecreation and the Zebra Mussel in Lake Erie Ohiordquo Technical Summary OHSU-TS-023 Ohio Sea Grant College Program Columbus OH
United States General Accounting Office (GAO) 2000 Invasive species Federal and Selected State Funding to Address Harmful Nonnative Species report to congressional committees United States General Accounting Office Washington DC Availability httppurlaccessgpogovGPOLPS8271
United States General Accounting Office (GAO) 2001 ldquoObstacles Hindering Federal Rapid Response to Growing Threatrdquo United States General Accounting Office GAO-01shy724 August
United States National Invasive Species Council (NISC) 2000 National Invasive Species Management Plan (2000 Draft) US Department of the Interior Washington DC
United States National Invasive Species Council (NISC) 2001 Meeting the Invasive Species Challenge National Invasive Species Management Plan October
Wilcove DS D Rothstein J Dubow A Phillips and E Losos 1998 ldquoQuantifying Threats to Imperiled Species in the United Statesrdquo BioScience 48 607-615
62
Web Sites on Invasive Species
Aquatic Ecosystem Restoration Foundation httpwwwaquaticsorgindexhtml
California Department of Fish and Game Chinese Mitten Crab Site httpwwwdeltadfgcagovmittencrab
Chesapeake Bay Program Invasive Species in the Chesapeake Bay Watershed Workshop httpwwwmdsgumdeduexoticsworkshopindexhtml
Exotic Aquatics on the Move httpagancspurdueeduEXOTICSrelated_linkshtm
Invasivespeciesgov The Nations Invasive Species Information System httpwwwinvasivespeciesgov
Great Lakes Commission Aquatic Nuisance Species httpwwwglcorgans
Great Lakes Fishery Commission httpwwwglfcorg
Great Lakes Fishery Commission 2004 Sea Lamprey Control httpwwwglfcorgsealamphowasp
Great Lakes Information Network (GLIN) Invasive Species in the Great Lakes Region httpwwwgreat- lakesnetenvtflora-faunainvasiveinvasivehtml
Global Ballast Management Programme httpgloballastimoorg
Integrated Systems for Invasive Species Ecological Forecasting and Risk Analysis for Nonindigenous Species httpwwwmathualbertaca~mathbioISISindexhtml
Massachusetts Aquatic Invasive Species Management Plan httpwwwmassgovczminvasivemanagementplanhtm
National Aquatic Nuisance Species (ANS) Task Force httpwwwanstaskforcegovindexhtm
63
National Aquatic Nuisance Species Clearinghouse New York Sea Grant httpwwwaquaticinvadersorgnan_ldcfm
National Sea Grant httpwwwnsgoseagrantorg
National Sea Grant Library University of Rhode Island httpnsgdgsouriedu
National Sea Grant Nonindigenous Species Site (SGNIS) httpwwwsgnisorg
National Sea Grant Non-indigenous Species Research and Outreach httpwwwnsgoseagrantorgresearchnonindigenousindexhtml
Northeast-Midwest Institute Biological Pollution - Aquatic Invasive Species httpwwwnemworgbiopollutehtm
RIDNIS Project University of California Davis httpwwwridnisucdaviseduindexhtml
San Francisco Bay Invasive Species RIDNIS Project University of California Davis httpwwwridnisucdaviseduNISofConcern1html
Smithsonian Environmental Research Center Marine Invasions Research Lab httpwwwsercsiedulabsmarine_invasions
US Geological Service Nonindigenous Aquatic Species Information Resource httpnaserusgsgov
Western Regional Panel on Aquatic Nuisance Species httpanswestfwsgov
Washington Department of Fish and Wildlife httpwwwwdfwwagovfishansgreencrabhtm
64
- The Economic Impacts of Aquatic Invasive SpeciesA Review of the Literature
- The Economic Impacts of Aquatic Invasive SpeciesA Review of the Literature
- Sabrina J Lovell and Susan F Stone
- Abstract
- Introduction
- General Cost Studies
- Theoretical Economic Research and Models
- Bioeconomic Models
- Trade-Related Studies
- Empirical Cost and Benefits Estimates by Species
- Fish
- Plants
- 13Crustaceans
- Mollusks
- Plants
- Conclusion
- Table 1
- INVASIVE SPECIES BIBLIOGRAPHY
- Web Sites on Invasive Species
-