the economic impact of traffic crashes - · pdf filethe economic impact of traffic crashes...
TRANSCRIPT
THE ECONOMIC IMPACT OF TRAFFIC CRASHES
A Thesis Presented to
The Academic Faculty
by
Matthew James Kittelson
In Partial Fulfillment of the Requirements for the Degree
Masters of Science in the School of Civil and Environmental Engineering
Georgia Institute of Technology
August 2010
THE ECONOMIC IMPACT OF TRAFFIC CRASHES
Approved by:
Dr. Michael D. Meyer, Advisor School of Civil and Environmental Engineering Georgia Institute of Technology
Dr. Michael P. Hunter School of Civil and Environmental Engineering Georgia Institute of Technology
Dr. Laurie A. Garrow School of Civil and Environmental Engineering Georgia Institute of Technology
Date Approved: July 1, 2010
iii
ACKNOWLEDGEMENTS
The completion of this thesis represents the culmination of years of love and
support from countless people as I have traveled down the educational path. First, I
would like to thank my parents for their constant support and instilling in me a strong
desire to learn. Whatever path I chose to take, I always knew that I had their support.
Next, I would like to thank all of the teachers, professors, and classmates that I have had
throughout the years. I have been lucky to always find myself in environments where
high achievement, collaboration, and, most importantly, friendship, have been common
place. Dr. Karen Dixon and Dr. Katharine Hunter-Zaworski deserve specific recognition
for fostering my love for transportation engineering early during my time with them at
Oregon State. Also, I owe a debt of gratitude to those who have given me a wide breadth
of professional experience and knowledge at such an early point in my career. In
particular, the two years I spent working at Fehr & Peers Transportation Consultants were
invaluable to me in terms of personal and professional growth. Thank you to everyone
there for that experience. Lastly, I would like to thank my wife, Lauren, for her constant
support and personal sacrifice during the course our journey so far. Throughout
everything, she has been my number one fan and, for that, I am eternally grateful.
In closing, I would like to thank all the faculty and staff at Georgia Tech for the
opportunity to be part of such a wonderful and dynamic graduate program. The decision
to further my education at such an outstanding institution is one of the best I have ever
made. In particular, I would like to thank Dr. Michael Meyer for his guidance and
insights throughout my research efforts. Also, I would like to thank all the professors I
have had the pleasure of interacting with during my tenure here.
iv
TABLE OF CONTENTS
ACKNOWLEDGEMENTS ............................................................................................ iii
LIST OF TABLES ........................................................................................................... vi
LIST OF FIGURES ........................................................................................................ vii
LIST OF SYMBOLS AND ABBREVIATIONS ......................................................... viii
SUMMARY ...................................................................................................................... ix
CHAPTER 1 INTRODUCTION ................................................................................ 1
1.1 Study Overview ....................................................................................................................... 1
CHAPTER 2 LITERATURE REVIEW .................................................................... 3
2.1 Economic Cost of Traffic Congestion ..................................................................................... 3 2.2 Economic Cost of Traffic Crashes ........................................................................................... 4 2.3 Traffic Safety and the Built Environment................................................................................ 6
2.3.1 Compact Built Environment .......................................................................................... 6
2.4 Trends in Crash Occurrences ................................................................................................... 7
2.4.1 Causes of Declines in Crash Occurrences ...................................................................... 8 2.4.2 VMT’s Role in Fatality Reductions ............................................................................. 10 2.4.3 International Traffic Crash Trends ............................................................................... 11
CHAPTER 3 DATA COLLECTION....................................................................... 13
3.1 Scope of Data Collection Effort ............................................................................................ 13 3.2 Metropolitan Area Boundaries .............................................................................................. 15 3.3 Fatality Data .......................................................................................................................... 15 3.4 Injury Data ............................................................................................................................. 16
3.4.1 Crash Data Reports ...................................................................................................... 20 3.4.2 Phone or Email Efforts ................................................................................................. 20
3.5 Property Damage Only Data .................................................................................................. 21 3.6 Confidence in Data ................................................................................................................ 21
CHAPTER 4 METHODOLOGY ............................................................................. 24
4.1 Gross Calculation Method ..................................................................................................... 24 4.2 Value of a Statistical Life ...................................................................................................... 25
4.2.1 History of VSL ............................................................................................................. 25 4.2.2 Updated VSL Estimate................................................................................................. 26
4.3 Estimating the Value of Preventing an Injury ....................................................................... 27
4.3.1 Abbreviated Injury Scale ............................................................................................. 27 4.3.2 Cost of Injury Estimating Procedure ............................................................................ 29
4.4 Comparing the Cost of Crashes to the Cost of Congestion ................................................... 32
4.4.1 Inconsistent Boundary Issue ........................................................................................ 32 4.4.2 Normalizing Economic Estimates ................................................................................ 33
v
CHAPTER 5 ANALYSIS AND RESULTS ............................................................. 34
5.1 Cost of Crashes by Metropolitan Area Size........................................................................... 34 5.2 High and Low Cost of Crash Locations ................................................................................ 41 5.3 Cost of Crashes vs Cost of Congestion .................................................................................. 43
5.3.1 Trends in the Cost of Crashes ...................................................................................... 45
5.4 Cost of Fatalities vs Cost of Injuries...................................................................................... 46 5.5 Updated Cost of Crash Estimates vs Previous Cost of Crash Estimates................................ 54 5.6 2005 Data vs 2008 Data......................................................................................................... 58
CHAPTER 6 SAFETY IN PLANNING .................................................................. 64
6.1 Literature on Safety in Transportation Planning .................................................................... 64
6.1.1 NCHRP Report on Transportation Planning and Safety .............................................. 64 6.1.2 Current Practices of Incorporating Safety into Long-range Planning .......................... 67 6.1.3 Transportation Safety Public Campaigns ..................................................................... 69 6.1.4 General Findings .......................................................................................................... 71
6.2 Long-Range Transportation Plan Evaluations ....................................................................... 72
6.2.1 Limitations of Evaluating LRTP .................................................................................. 76
CHAPTER 7 CONCLUSIONS AND RECOMMENDATIONS ........................... 78
7.1 Summary ............................................................................................................................... 78 7.2 Recommendations ................................................................................................................. 79 7.3 Future Research ..................................................................................................................... 81
APPENDIX A MSA AREA DEFINITIONS ........................................................... 82
APPENDIX B LONG-RANGE TRANSPORTATION PLAN
EVALUATIONS ............................................................................... 95
APPENDIX C DATA SOURCES ........................................................................... 111
REFERENCES .............................................................................................................. 113
vi
LIST OF TABLES
Table 1: Metropolitan Areas Analyzed ..................................................................................14 Table 2: Crash Statistics by Metropolitan Area, 2008 ...........................................................17 Table 3: VSL Estimate Over Time ........................................................................................25 Table 4: VSL Estimates .........................................................................................................26 Table 5: Relative Disutility Factors by Injury Severity Level ...............................................28 Table 6: Injury Severity Analysis ..........................................................................................29 Table 7: Relative Disutility Factors by Injury Severity Level ...............................................30 Table 8: Relative Disutility Factors by Injury Severity Level ...............................................31 Table 9: Small Metropolitan Areas Cost of Crashes Estimates .............................................35 Table 10: Medium Metropolitan Areas Cost of Crashes Estimates .......................................36 Table 11: Large Metropolitan Areas Cost of Crashes Estimates ...........................................38 Table 12: Very Large Metropolitan Areas Cost of Crashes Estimates ..................................40 Table 13: High and Low Cost of Crash Locations ................................................................41 Table 14: High and Low Cost of Congestion Locations ........................................................42 Table 15: High and Low Crash to Congestion Locations ......................................................43 Table 16: Small Metropolitan Areas Cost of Crashes Estimates ...........................................48 Table 17: Medium Metropolitan Areas Cost of Crashes Estimates .......................................49 Table 18: Large Metropolitan Areas Cost of Crashes Estimates ...........................................51 Table 19: Very Large Metropolitan Areas Cost of Crashes Estimates ..................................53 Table 20: Change in Crash Data from 2005 to 2008 .............................................................60 Table 21: Large Metropolitan Areas Cost of Crashes Estimates ...........................................73 Table 22: Evaluation of Long-Range Transportation Plan Summary ...................................75
vii
LIST OF FIGURES
Figure 1: Trend of the Occurrence of Fatalities and the Fatality Rate in the U.S. ..............8 Figure 2: Trend of Annual VMT in the U.S. .......................................................................11 Figure 3: MSA vs UA for Tucson, AZ ................................................................................33 Figure 4: Cost of Crash per person vs Cost of Crashes per person .....................................44 Figure 5: Ratio of Cost of Crashes per person to Cost of Congestion per person ...............45 Figure 6: Ratio of Cost of Injuries to Cost of Fatalities ......................................................47 Figure 7: Cost of Crashes per person vs Cost of Congestion per person (2005 cost
estimates) .............................................................................................................55 Figure 8: Cost of Crashes per person vs Cost of Congestion per person (2008 cost
estimates) .............................................................................................................55 Figure 9: Ratio of Cost of Crashes per person to Cost of Congestion per person (2005
cost estimates) ......................................................................................................57 Figure 10: Ratio of Cost of Crashes per person to Cost of Congestion per person (2008
cost estimates) ......................................................................................................57 Figure 11: Change of Cost of Crashes per person (2005-2008) and Cost of Congestion per
person (2005-2007) ..............................................................................................59
viii
LIST OF SYMBOLS AND ABBREVIATIONS
AIS Abbreviated Injury Scale
AAA American Automobile Association
DOT Department of Transportation
FARS Fatality Analysis Reporting System
FHWA Federal Highway Administration
GDP Gross Domestic Product
HPMS Highway Performance Monitoring System
ITF International Transportation Forum
LRTP Long-range Transportation Plan
MPO Metropolitan Planning Organization
MSA Metropolitan Statistical Area
MPG Miles per Gallon
NCHRP National Cooperative Highway Research Program
NHTSA National Highway Traffic Safety Administration
PDO Property Damage Only
SCP Safety conscious planning
TTI Texas Transportation Institute
UA Urbanized Area
VSL Value of a Statistical Life
VMT Vehicle Miles Traveled
ix
SUMMARY
Roughly 40,000 people have died each year in traffic accidents in the United
States over the past several decades. Although that number has declined in recent years,
society as a whole has tolerated that staggeringly high number without much public
outcry. By contrast, the rising level of traffic congestion is routinely a topic of public
conversation. Because of the high visibility of traffic congestion, decision-makers and
politicians tend to focus on congestion relief projects when allocating transportation
improvement funds. The Texas Transportation Institute’s biennial Urban Mobility
Report, which attempts to quantify the economic costs of congestion in different
metropolitan areas, further highlights the importance of congestion to public decision
makers. No comparable report is produced for the economic costs of traffic crashes.
To compare the relative magnitude of the economic costs of congestion versus
that of crashes, this research quantifies the economic cost of traffic crashes. In particular,
the 2008 cost of crashes was calculated, based on the occurrence of crash-related
fatalities and injuries and the economic estimates for the societal burden associated with
those events, for 85 of the metropolitan areas studied in the 2009 Urban Mobility Report.
The results show that, on average, the cost of crashes exceeds the cost of congestion at a
rate of over 3 to 1.
This research is based on a previous report commissioned by the American
Automobile Association (AAA) Foundation that completed a similar comparison for
2005 data. The findings of that report, although based on more conservative estimates for
the societal costs associated with a crash fatality or injury, show similar results.
1
CHAPTER 1
INTRODUCTION
1.1 Study Overview
Since 1982, the Texas Transportation Institute (TTI) has been producing the
Urban Mobility Report, a document that focuses on quantifying the economic costs
associated with traffic congestion in different metropolitan areas across the United States.
This report is typically met with a significant amount of fanfare and attention [1].
Officials who represent the areas with the “most expensive” congestion problem are put
in the precarious situation of the explaining to the general public why the congestion
problem is so “out of control” in their city. As such, the Urban Mobility Report is an
important impetus to push congestion as a main topic of interest for transportation
officials.
By contrast, transportation safety, or, more specifically, traffic crashes, rarely
receives a similar level of public attention even though the result of a traffic crash can be
much more extreme than that for congestion. In addition, traffic crashes are an important
contributor to congestion and thus the two cannot always be considered individually
isolated events [2]. A 2008 report commissioned by the American Automobile
Association (AAA) Foundation used 2005 crash data to estimate the economic cost of
traffic crashes relative to traffic congestion for 85 of the metropolitan areas considered
for the TTI report. The findings for that report indicated that the cost of traffic crashes far
exceeded the cost of congestion at a average of over 2 to 1 [3]. In general, this report
showed that the economic cost of traffic congestion is lower than the economic cost of
traffic crashes in every metropolitan area considered.
The purpose of this research is to revisit the issue of the economic cost of traffic
crashes compared to the economic cost of congestion for the most recent year where data
is currently available for each (2008 for traffic crashes and 2007 for congestion). The
intent is to determine not only if the relationship between crash and congestion costs
2
remain the same as in the 2008 report, but also if the absolute values have changed in any
significant way (accounting for changes in traffic volume, occurrence of crashes, etc.).
This thesis is organized in the following way. Chapter 2 provides a summary of
the literature on a variety of safety topics, Chapter 3 outlines the data collection efforts
for this research, Chapter 4 presents the methodology used for this research, Chapter 5
presents the analysis and results of this research, Chapter 6 discusses the relationship
between transportation safety and transportation planning, and Chapter 7 provides
conclusions and recommendations.
3
CHAPTER 2
LITERATURE REVIEW
This chapter summarizes the literature for several areas related to transportation
safety.
2.1 Economic Cost of Traffic Congestion
Every two years, the Texas Transportation Institute (TTI) produces a report
entitled the Urban Mobility Report. The purpose of this report is to quantify the economic
costs incurred by different urban areas due to traffic congestion. It has been produced
biennially since 1982, resulting in a regular snapshot of how congestion is affecting the
nation’s economy. The basis for this congestion estimate is state-reported data on travel
time, speeds, and crashes as report in the Highway Performance Monitoring System
(HPMS). From these data items, TTI estimates primarily change in delay and fuel, and
applies value of time and value of fuel to arrive at an overall estimate of economic cost.
General findings of the report have found that the annual delay per peak traveler,
defined as “the extra time spent traveling at congested speeds rather than free-flow
speeds divided by the number of persons making a trip during the peak period” [4], has
steadily increased from 1982 to present day, going from 14 hours to 36 hours during that
period [4]. Similarly, wasted fuel per peak traveler has risen over the same period from 9
gallons 24 gallons [4]. This rise can be attributed to congestion levels rising not just in a
few metropolitan areas, but in practically all areas surveyed. This is shown by there
currently being 23 urban areas with 40 or more hours of delay per peak traveler in 2007
compared to just one in 1982 [4].
All of these factors have led to the economic cost of congestion rising from $16.7
billion in 1982 (in 2007 dollars) to $87.2 billion in 2007 [4].
4
Although the historic trends of traffic congestion have been on the rise since
1982, trends over the last two years show that the rate at which congestion is increasing is
slowing or, in some cases, declining. The reasons for this occurrence have been widely
speculated, with many attributing the decline to the recent economic downturn. While
exact reasons for the reduction in congestion are difficult to prove, later sections of this
thesis will discuss different hypotheses that possibly explain this phenomenon.
Overall, it is difficult to overstate the negative effect that congestion has on the
nation’s economy. In 2007 estimates, congestion result in 2.8 billion gallons of wasted
fuel and 4.2 billion hours of wasted time for commuters [4]. Because of the massive costs
associated with congestion, congestion relief projects have long been an emphasis for
transportation agencies around the country.
2.2 Economic Cost of Traffic Crashes
While many agencies are tasked with addressing transportation safety, each
approaches the challenge of traffic crashes from a different perspective. For example,
transportation officials are often tasked with identifying ways to improve the safety of the
overall transportation system. In addition, they are responsible for restoring the system to
adequate operation following an incident. By comparison, a police department focuses on
enforcing laws and regulations to ensure that users of the transportation system are not
put in harm’s way by reckless actions or reckless individuals. Lastly, public health
officials focus on how to prevent injuries or how to treat injuries when they occur.
Although different, each of these perspectives is critical to understanding the breadth of
perspectives that can be brought to a discussion of traffic safety’s impact on society.
5
Quantifying the economic cost that traffic crashes have on society has been
addressed by a variety of fields over the past several decades. Transportation agencies
and professionals have worked independently, and also with other concerned parties,
such as public health officials or police departments, to put a dollar amount on traffic
crashes. In 2000, the United States Department of Transportation produced a report that
identified the societal cost of traffic crashes to communities in the United States. This
report determined that, in 2000, the cost came to $230.6 billion [5], or an average of $820
per person. The report utilized a cost estimate for a fatality of $977,000, which is
relatively low based on current estimates by the Federal Highway Administration
(FHWA) [6]. Another report, produced by the American Automobile Association (AAA)
in 2008, produced similar cost estimates, although this report focused on metropolitan
areas addressed in the biennial Urban Mobility Report produced by the Texas
Transportation Institute (TTI) [4]. The AAA report found that the cost of crashes the 85
metropolitan areas studied was, on average, $1,051 per person as compared to $430 per
person for congestion [3].
The reports that have focused on the economic cost of crashes, particularly the
AAA report that compared the cost of crashes directly to the cost of congestion, raise
important issues relating to traffic safety. By providing the general public, as well as
decision-makers, with information that frames the issue of traffic safety in monetary
terms, safety-related improvements can be better placed in the context of other
investment strategies that often relate to such things as economic development,
congestion, environmental quality , etc.
6
2.3 Traffic Safety and the Built Environment
Much of the emphasis on improving traffic safety is placed on spot improvements
to a particular intersection or stretch of road. New research, however, is focusing on how
the built environment may affect the occurrence of traffic crashes. The basic thought is
that the physical layout and characteristics of a roadway may have a strong relationship to
driver behavior, vehicle speed, and the interaction between vehicles and pedestrians, all
of which are factors that can influence the occurrence and severity of crashes. The
following section discusses how a compact built environment may have a positive impact
on the safety of the transportation system.
2.3.1 Compact Built Environment
Recent trends in transportation planning have focused on a more compact built
environment. Much of this emphasis has focused on the environmental benefits that this
design provides by reducing the amount of vehicle miles traveled (VMT) and the
emissions that result from personal vehicle use. Areas that are considered compact
generally emphasize mixed-use land-use plans, multiple transportation options for
residents, including pedestrian, bicycle, and transit options, and roadway cross sections
that cater to all users, not just vehicles.
Some recent studies have examined whether the built environment [7] or vehicle
technology [8] can have a greater impact on long-range benefits in combating climate
change. However, a recent study found that a compact built environment can also have a
positive impact on the safety of the transportation system, not just reducing the emissions
from the transportation system [9]. In particular, the relationship between VMT and how
it relates to safety has been an important one in safety planning. Intuitively, if drivers
7
spend less time on the road, judged by either miles driven or hours driven, the less likely
they are to be in a traffic crash. This is the simple factor of exposure, meaning that the
less a person is exposed to something, the less likely it is to affect them.
While the potential for a reduction in VMT is a motivating factor for compact
land use advocates, other benefits of a compact built environment are being realized. For
one, compact built environments have been observed to reduce the overall speed of traffic
flows because of a reduced width of travel lanes and the overall design of the roadway
cross-section. In 2008, over 50 percent of fatal accidents in the United States occurred on
roadways with a posted speed limit of 55 mph or greater while 11 percent occurred on
roadways with a posted speed limit of 30 mph or less [10]. By contrast, roughly 22
percent of all crashes were estimated to have occurred on roadways with a posted speed
limit of 55 mph or higher while 25 percent of all crashes occurred on roadways with a
posted speed limit of 30 mph or lower [10]. These figures show that crashes that occur on
high speed roadways are more likely to be fatal, suggesting that these facilities put users
at a greater risk. As such, creating a built environment that encourages vehicles to travel
at a slower speed can have a positive impact on the safety of a facility [7].
2.4 Trends in Crash Occurrences
For the last several decades, traffic fatalities have held relatively constant at
around 40,000 per year in the United States [11]. However, in recent years, that number
has begun to decline. The most recent reporting year available, 2008, showed a decline to
nearly 36,000 fatalities [10]. Furthermore, early estimates for 2009 fatalities are even
lower, with an estimate of 33,963 fatalities [12].
8
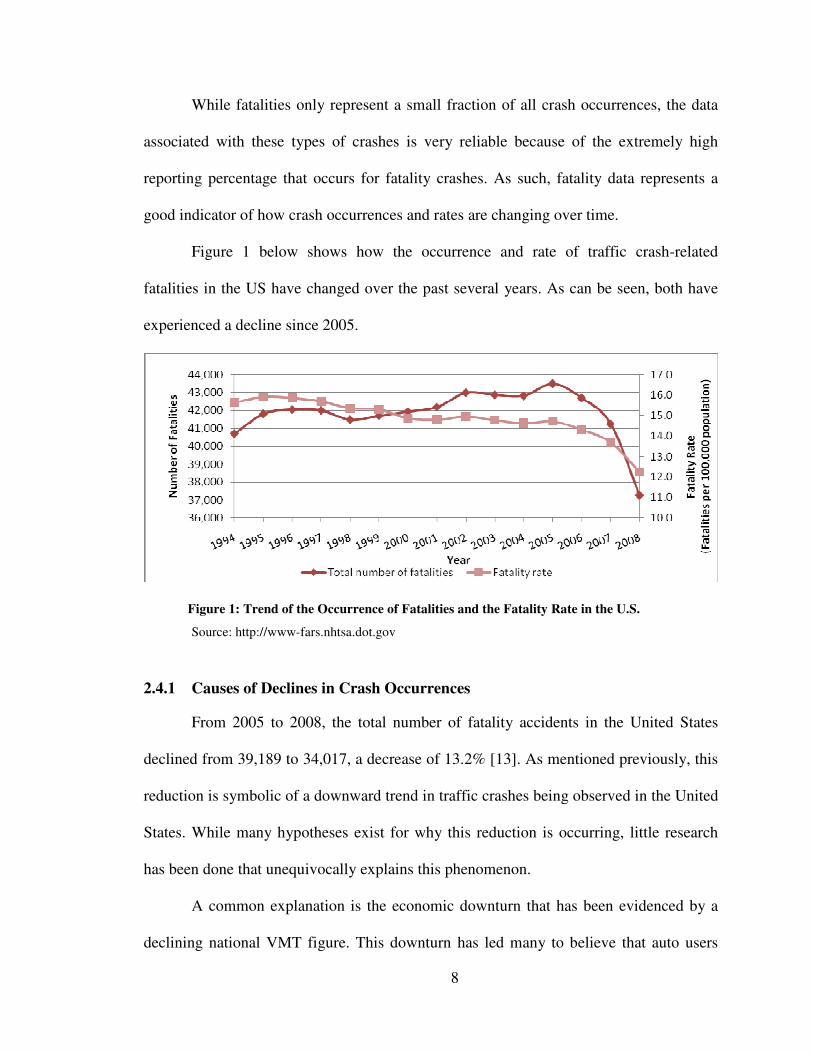
While fatalities only represent a small fraction of all crash occurrences, the data
associated with these types of crashes is very reliable because of the extremely high
reporting percentage that occurs for fatality crashes. As such, fatality data represents a
good indicator of how crash occurrences and rates are changing over time.
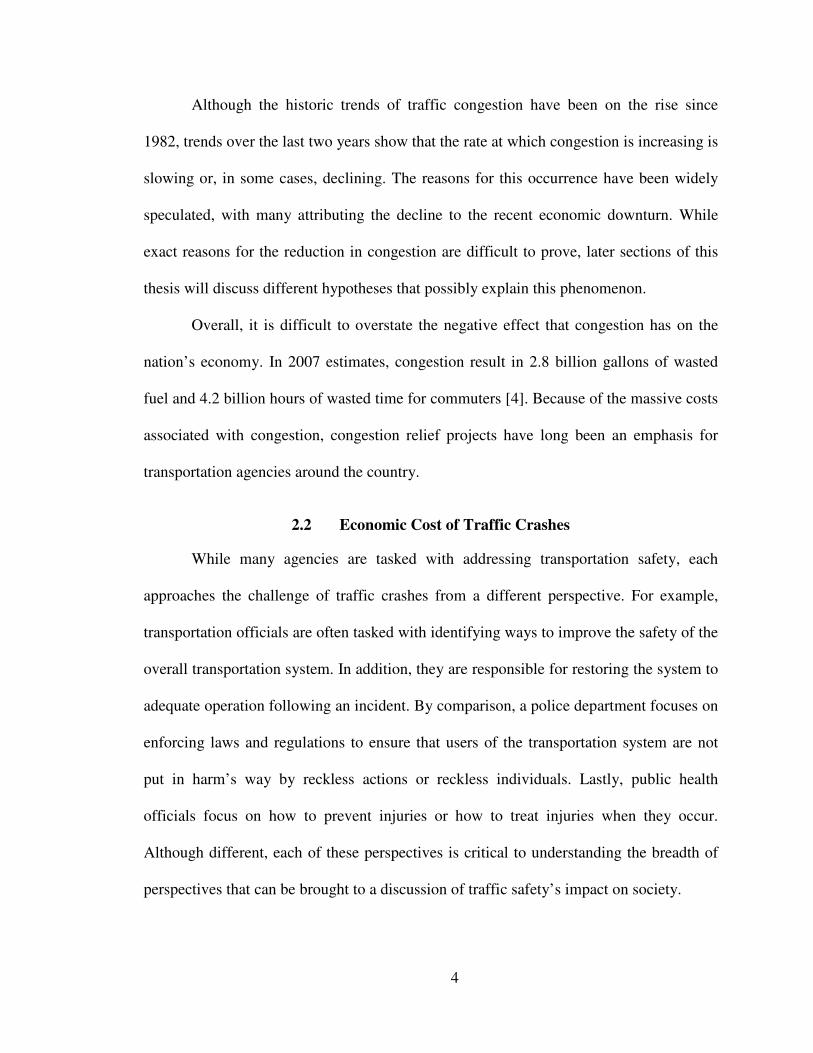
Figure 1 below shows how the occurrence and rate of traffic crash-related
fatalities in the US have changed over the past several years. As can be seen, both have
experienced a decline since 2005.
Figure 1: Trend of the Occurrence of Fatalities and the Fatality Rate in the U.S.
Source: http://www-fars.nhtsa.dot.gov
2.4.1 Causes of Declines in Crash Occurrences
From 2005 to 2008, the total number of fatality accidents in the United States
declined from 39,189 to 34,017, a decrease of 13.2% [13]. As mentioned previously, this
reduction is symbolic of a downward trend in traffic crashes being observed in the United
States. While many hypotheses exist for why this reduction is occurring, little research
has been done that unequivocally explains this phenomenon.
A common explanation is the economic downturn that has been evidenced by a
declining national VMT figure. This downturn has led many to believe that auto users
9
have altered their driving habits to reduce the overall cost of owning and operating a
vehicle. This includes driving slower to improve fuel economy, buying vehicles with a
higher average mile per gallon (MPG) rating, and reducing the overall number of miles
driven.
In addition to a significant drop in the total number of traffic fatalities in the
United States, other interesting trends have emerged that could help explain the
phenomenon. First, fatalities on rural principle arterials have dropped by 22.4 percent
between 2005 and 2008, from 2,674 to 2,075 [13]. Interestingly, this could be explained
by the economy because vacationers could be choosing to stay closer to home, reducing
the amount of long-distance travel that would likely utilize these types of facilities.
Second, the number of fatal accidents that occurred in construction zones declined by
30.2 percent, from 949 in 2005 to 662 in 2008 [13]. This phenomenon could be explained
by a reduction in the number of roadway construction projects that occurred due to the
economic climate. Interestingly, however, the number of fatalities involving motorcycles
increased from 4,492 to 5,129, an increase of 14.2 percent, over the same period [13].
This could be explained by individuals looking to reduce the amount of money spent on
fuel by buying a motorcycle that has a high MPG rating. However, the level of
motorcycle use had been increasing in the United States over the past 10 years, especially
for middle aged men. Some believe it is this new, relatively inexperienced, motorcycle
driver that has resulted in higher motorcycle-related fatalities, they tend not to survive
such crashes as compared to similar aged drivers in automobiles [13].
While many explanations exists for why the number of fatal accidents are
declining, in reality it is hard to find just one reason that accounts for all the variables
10
involved. Likely, the reduction in crashes is a product of many different factors,
including, but not limited to, the recent economic downturn, improved vehicle
technology, and driver behavior adjustments.
2.4.2 VMT’s Role in Fatality Reductions
The rate at which fatalities occur has been declining steadily for a significant
period of time [10], steadily dropping from 25.89 fatalities per 100,000 population in
1966 to 12.25 fatalities per 100,000 population in 2008. Similarly, the fatality rate per
100 million vehicle miles traveled drop from 5.50 to 1.25 over the same time period.
Most believe that this long term decline in fatalities with increasing VMT is due to the
improved survivability of crash victims given new vehicle technology and safety
equipment such as air bags and seat belts. However the recent severe drop in the number
of fatalities is most likely the result of limited exposure, meaning people are beginning to
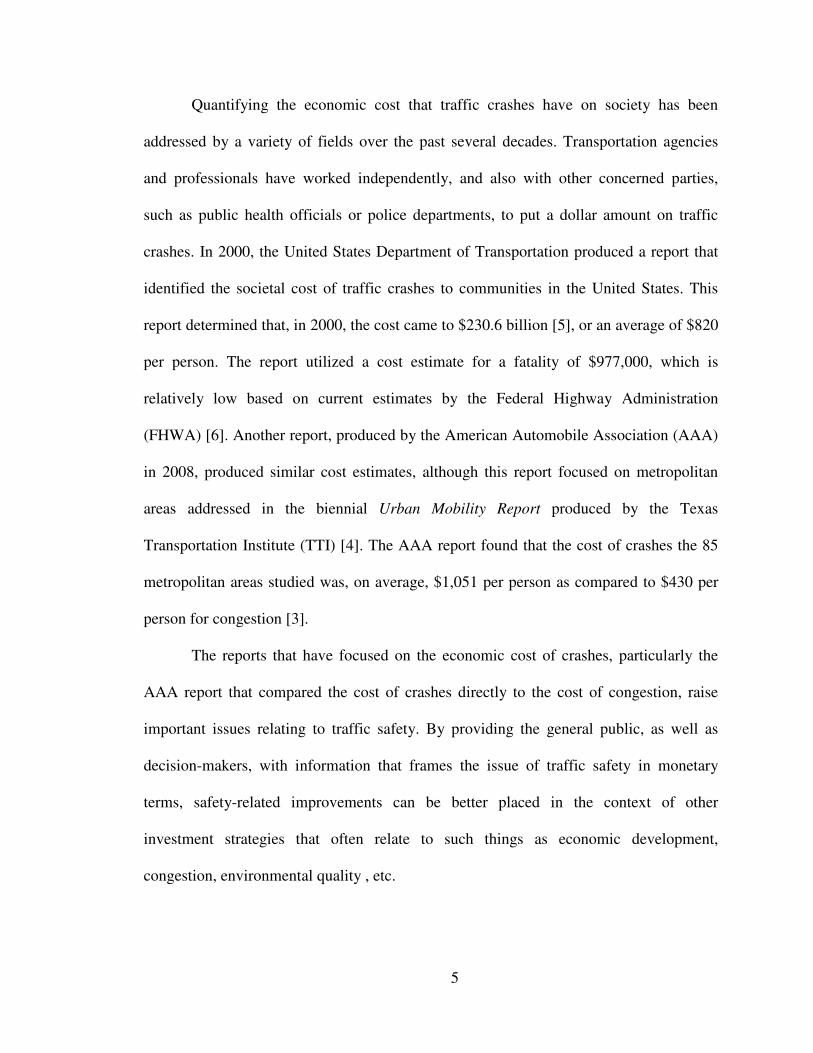
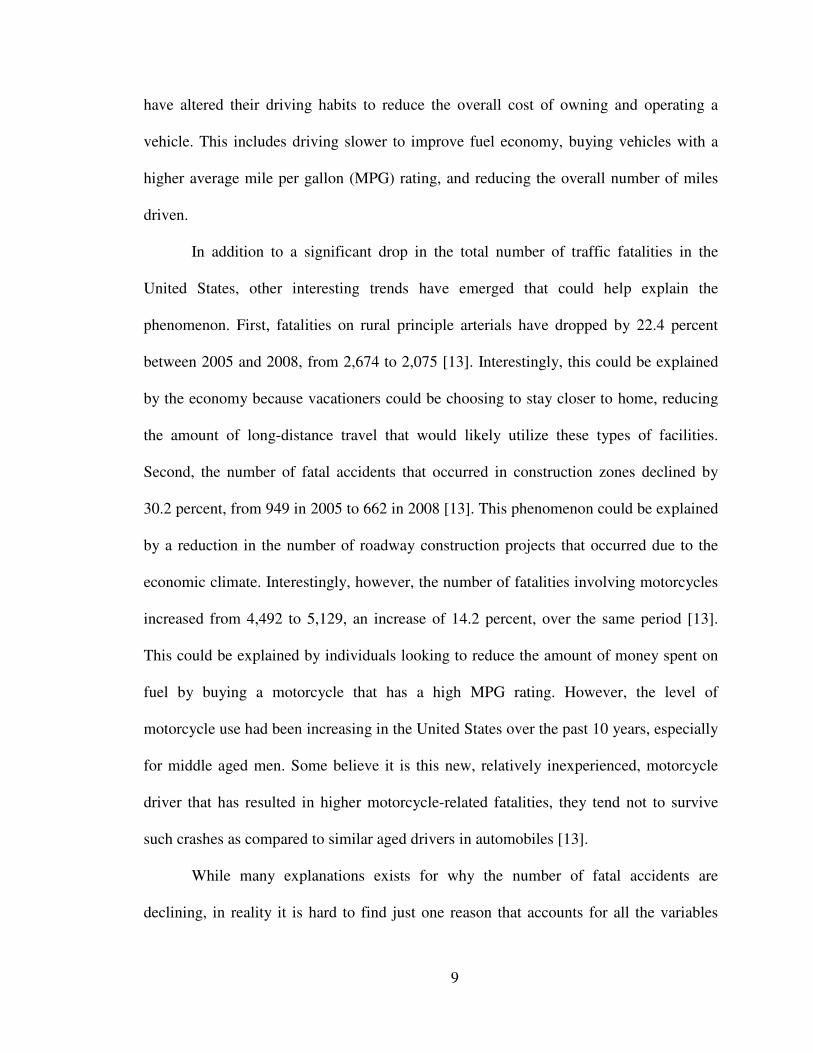
drive less than in previous periods. Figure 2 below shows how the total estimated VMT
for the United States has changed over time.
11
Figure 2: Trend of Annual VMT in the U.S.
Source: http://www.fhwa.dot.gov/policyinformation/travel/tvt/history/
As is shown, 2008 reported the first significant decline in VMT ever recorded in
the United States outside of war years. This occurrence, when paired with the consistent
decline in the fatality rate described early, may be a main reason underlying the large
reduction in the gross number of fatalities being observed recently. However, the early
estimate for the occurrence of fatalities in 2009 shows another significant decline in the
gross number of fatalities while the VMT estimate slightly increases [12].
In general, VMT reduction is likely a significant factor involved in the reduction
of traffic fatalities, however it would be difficult to prove that as a fact because of all the
variables involved.
2.4.3 International Traffic Crash Trends
Outside of the United States, the occurrence of traffic-related fatalities is also
trending downward. The 52 member countries of the International Transportation Forum
12
(ITF), excluding India, reported a combined total of less than 150,000 traffic related
deaths occurring in 2008 for the first time ever [14]. This represents a decline of 8.9
percent from 2007 data. In addition, preliminary data for 2009 is showing another
significant drop in fatalities of near 10 percent.
While the economic downturn being experienced in the United States has also
affected countries around the world, identifying a cause for this trend would be extremely
challenging. Each individual country likely has unique factors that affect the occurrence
of fatalities within its borders.
13
CHAPTER 3
DATA COLLECTION
This chapter outlines the data collection efforts for this study. The goal of this
effort was to acquire the data necessary to compare the economic cost of crashes to the
economic cost of congestion. The data related to the congestion costs was based on
information provided by the 2009 Urban Mobility Report, which uses 2007 congestion
data. However, the data needed to calculate the cost of crashes had to be collected. The
required data to calculate this cost was the occurrence of fatalities and injuries related to
traffic crashes for the areas analyzed. In general, acquiring the traffic fatality data was
relatively easy, but acquiring the traffic injury data was more challenging. This is
primarily due to the manner in which the different kind of data is stored--fatality data is
stored in a national database and injury data is often stored at the state level. As such,
different levels of confidence are associated with the consistency of reporting methods
for the different types of data.
Data was collected for the 2008 reporting year in most cases. However, when that
information was not available, the most recent reporting year available was collected
instead. Data other than 2008 was noted in the database when used.
3.1 Scope of Data Collection Effort
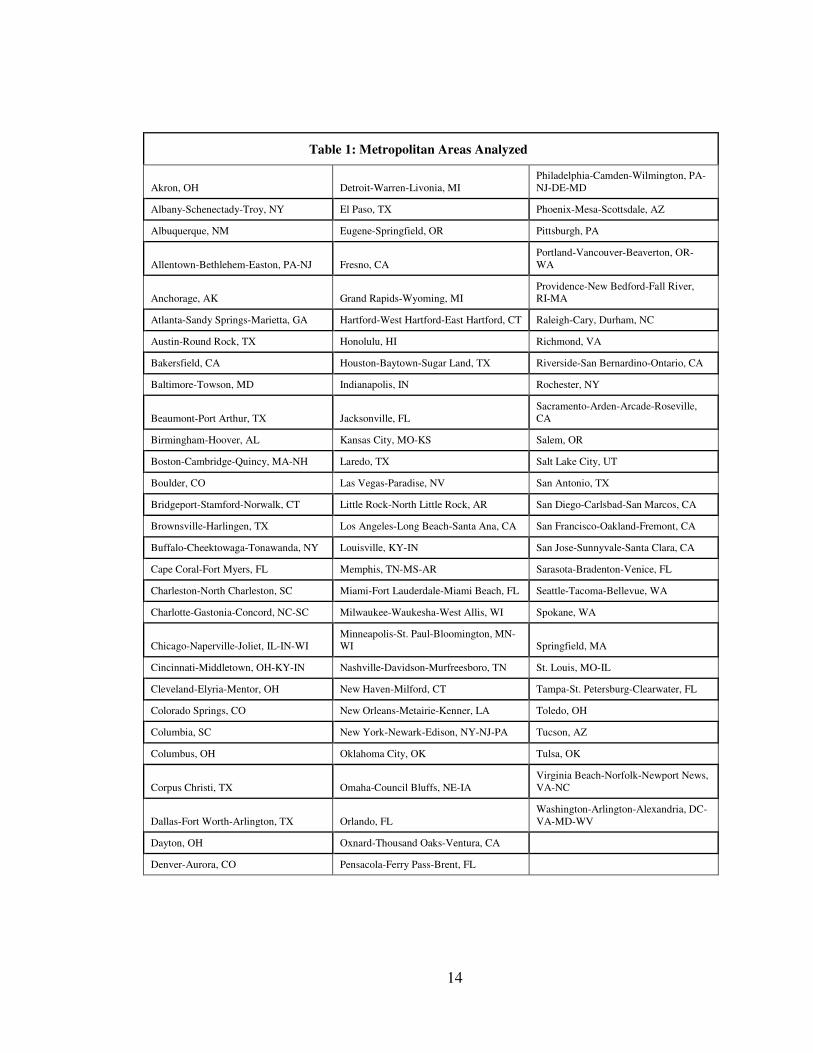
This study analyzed 85 metropolitan areas included in the Urban Mobility Report.
Table 1 shows the areas analyzed.
14
Table 1: Metropolitan Areas Analyzed
Akron, OH Detroit-Warren-Livonia, MI Philadelphia-Camden-Wilmington, PA-NJ-DE-MD
Albany-Schenectady-Troy, NY El Paso, TX Phoenix-Mesa-Scottsdale, AZ
Albuquerque, NM Eugene-Springfield, OR Pittsburgh, PA
Allentown-Bethlehem-Easton, PA-NJ Fresno, CA Portland-Vancouver-Beaverton, OR-WA
Anchorage, AK Grand Rapids-Wyoming, MI Providence-New Bedford-Fall River, RI-MA
Atlanta-Sandy Springs-Marietta, GA Hartford-West Hartford-East Hartford, CT Raleigh-Cary, Durham, NC
Austin-Round Rock, TX Honolulu, HI Richmond, VA
Bakersfield, CA Houston-Baytown-Sugar Land, TX Riverside-San Bernardino-Ontario, CA
Baltimore-Towson, MD Indianapolis, IN Rochester, NY
Beaumont-Port Arthur, TX Jacksonville, FL Sacramento-Arden-Arcade-Roseville, CA
Birmingham-Hoover, AL Kansas City, MO-KS Salem, OR
Boston-Cambridge-Quincy, MA-NH Laredo, TX Salt Lake City, UT
Boulder, CO Las Vegas-Paradise, NV San Antonio, TX
Bridgeport-Stamford-Norwalk, CT Little Rock-North Little Rock, AR San Diego-Carlsbad-San Marcos, CA
Brownsville-Harlingen, TX Los Angeles-Long Beach-Santa Ana, CA San Francisco-Oakland-Fremont, CA
Buffalo-Cheektowaga-Tonawanda, NY Louisville, KY-IN San Jose-Sunnyvale-Santa Clara, CA
Cape Coral-Fort Myers, FL Memphis, TN-MS-AR Sarasota-Bradenton-Venice, FL
Charleston-North Charleston, SC Miami-Fort Lauderdale-Miami Beach, FL Seattle-Tacoma-Bellevue, WA
Charlotte-Gastonia-Concord, NC-SC Milwaukee-Waukesha-West Allis, WI Spokane, WA
Chicago-Naperville-Joliet, IL-IN-WI Minneapolis-St. Paul-Bloomington, MN-WI Springfield, MA
Cincinnati-Middletown, OH-KY-IN Nashville-Davidson-Murfreesboro, TN St. Louis, MO-IL
Cleveland-Elyria-Mentor, OH New Haven-Milford, CT Tampa-St. Petersburg-Clearwater, FL
Colorado Springs, CO New Orleans-Metairie-Kenner, LA Toledo, OH
Columbia, SC New York-Newark-Edison, NY-NJ-PA Tucson, AZ
Columbus, OH Oklahoma City, OK Tulsa, OK
Corpus Christi, TX Omaha-Council Bluffs, NE-IA Virginia Beach-Norfolk-Newport News, VA-NC
Dallas-Fort Worth-Arlington, TX Orlando, FL Washington-Arlington-Alexandria, DC-VA-MD-WV
Dayton, OH Oxnard-Thousand Oaks-Ventura, CA
Denver-Aurora, CO Pensacola-Ferry Pass-Brent, FL
15
3.2 Metropolitan Area Boundaries
The congestion data for the Urban Mobility Report is based on Urbanized Area
(UA) boundaries. These boundaries are defined by the U.S. Census Bureau and based on
population density [15]. These boundaries are irregular and do not necessarily follow
other established political boundaries, such as county lines. By contrast, aggregated
traffic crash data is usually kept, at best, at the county level. This disparity causes a
problem when trying to compare the economic costs developed for congestion and
crashes. The method used to account for this discrepancy will be addressed in Chapter 4.
This research used the Metropolitan Statistical Area (MSA), which is defined by
county boundaries, as the basis for linking crash statistics to metropolitan areas. This
definition fits well with the how traffic crash data is kept which is, as noted previously, at
the county level. In addition, the MSA boundary was used by the AAA report to calculate
the cost of crashes, allowing for comparisons between the results of that report and this
research effort.
3.3 Fatality Data
The National Highway Traffic Safety Administration (NHTSA) maintains a
database of every reported road-related fatality in the U.S. This database, called the
Fatality Analysis Reporting System (FARS), can be queried based on a variety of
variables related to the crash, including year, travel mode, and, most importantly for this
research, location. Because of this feature, collecting fatality data for the 85 metropolitan
areas was as simple as setting up a query search for the relevant information.
Fatality data from each state was queried at the county level. These queries
resulted in a raw data set for each state. These data sets were then imported into
16
Microsoft Excel and aggregated based on the defined MSAs for each metropolitan area.
In many cases, the MSAs crossed state lines, requiring information from two or more
queries of the FARS database. MSA definitions for each metropolitan area can be found
in Appendix A.
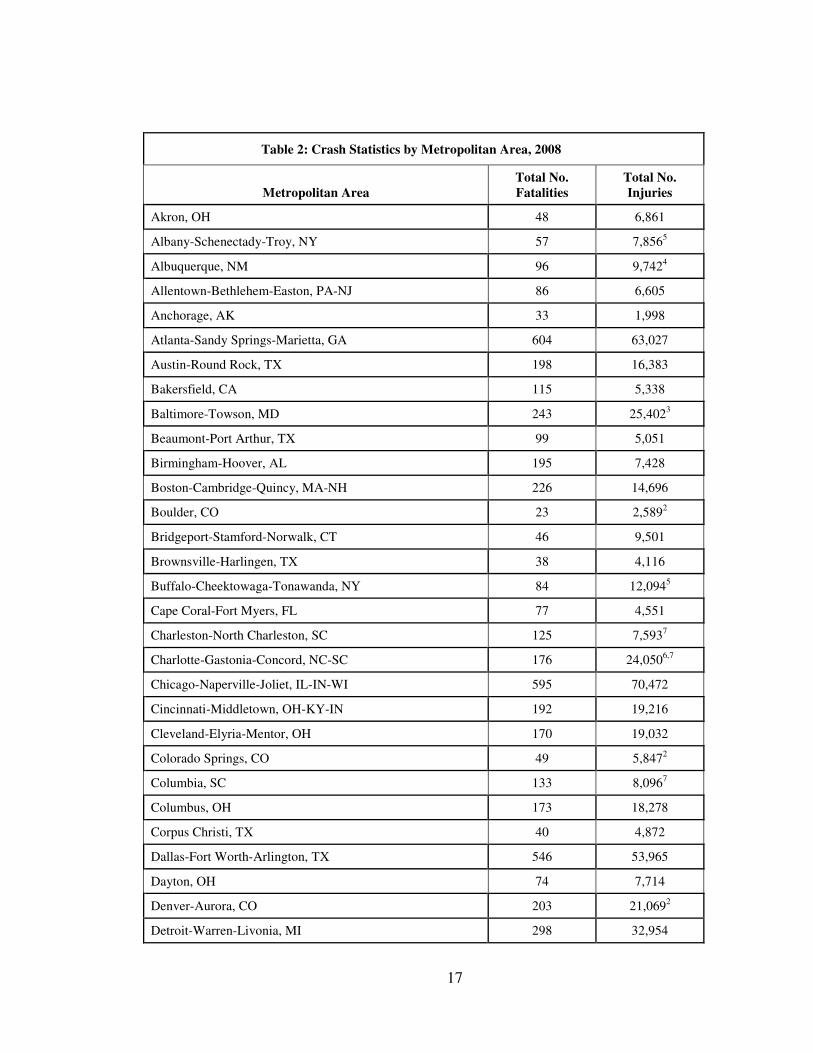
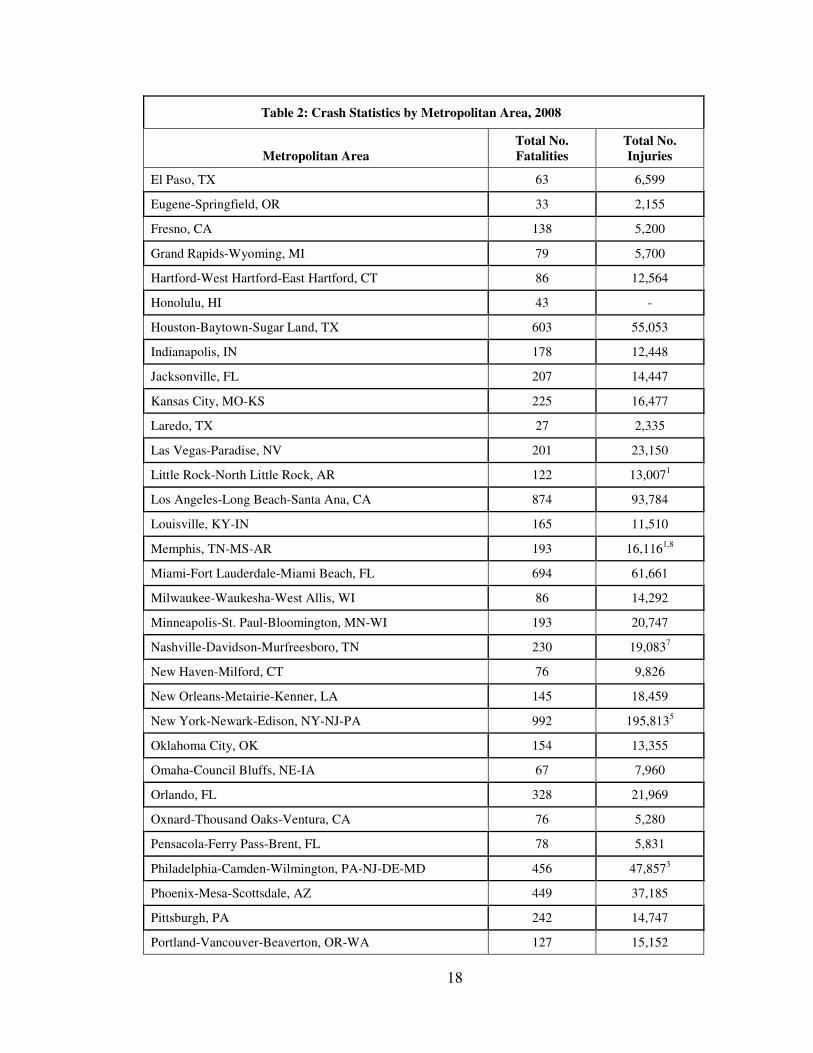
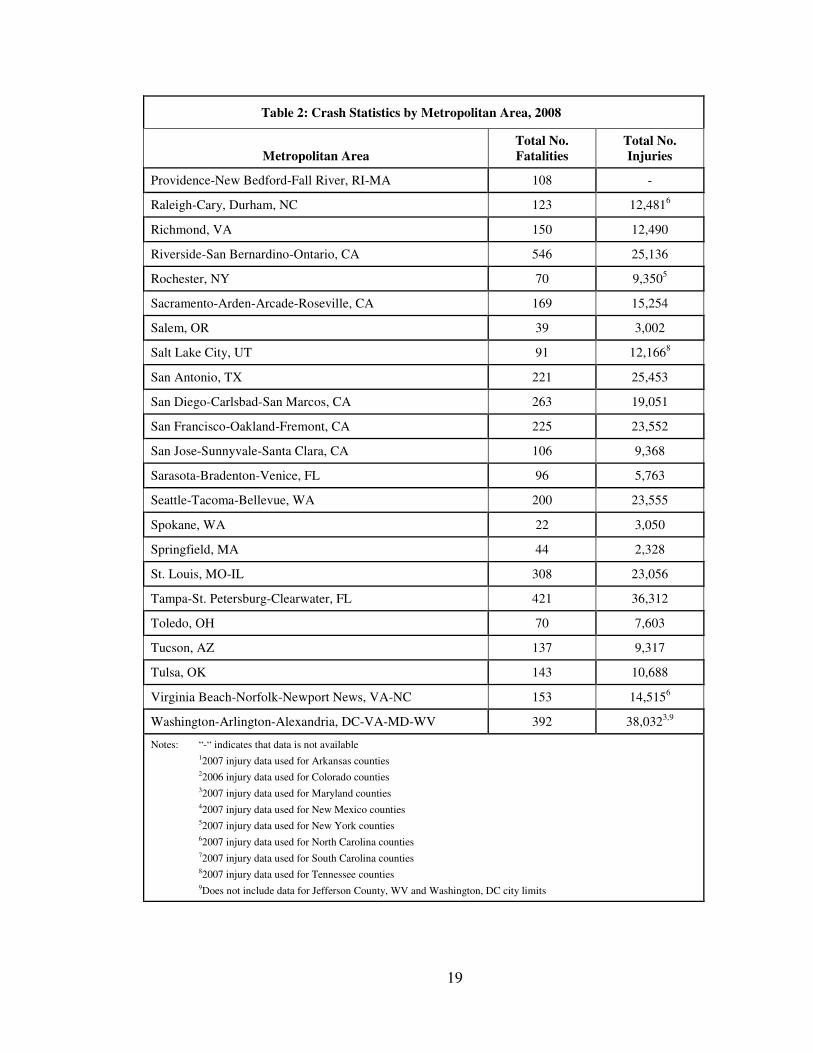
From this collection effort, fatality data for all 85 metropolitan areas for the 2008
reporting year was compiled. The raw data can be seen in Table 2.
3.4 Injury Data
Unlike fatality data, no national database exists for injury data. As such, the data
collection effort was more difficult for road-related injuries. In all cases, an effort was
made to obtain crash data for the 2008 reporting year, however, that was not always
possible. For the following states, 2007 data was the most recent available:
• Arkansas
• Maryland
• New Mexico
• New York
• North Carolina
• South Carolina
• Tennessee
• Utah
In the case of Colorado, 2005 was the most recent reporting year available. Also,
injury crash data was not available for Hawaii, Rhode Island, and Washington, DC. A
detailed account of the data collection efforts is outlined in a following section. Injury
data for the metropolitan dataset is shown in Table 2.
17
Table 2: Crash Statistics by Metropolitan Area, 2008
Metropolitan Area
Total No.
Fatalities
Total No.
Injuries
Akron, OH 48 6,861
Albany-Schenectady-Troy, NY 57 7,8565
Albuquerque, NM 96 9,7424
Allentown-Bethlehem-Easton, PA-NJ 86 6,605
Anchorage, AK 33 1,998
Atlanta-Sandy Springs-Marietta, GA 604 63,027
Austin-Round Rock, TX 198 16,383
Bakersfield, CA 115 5,338
Baltimore-Towson, MD 243 25,4023
Beaumont-Port Arthur, TX 99 5,051
Birmingham-Hoover, AL 195 7,428
Boston-Cambridge-Quincy, MA-NH 226 14,696
Boulder, CO 23 2,5892
Bridgeport-Stamford-Norwalk, CT 46 9,501
Brownsville-Harlingen, TX 38 4,116
Buffalo-Cheektowaga-Tonawanda, NY 84 12,0945
Cape Coral-Fort Myers, FL 77 4,551
Charleston-North Charleston, SC 125 7,5937
Charlotte-Gastonia-Concord, NC-SC 176 24,0506,7
Chicago-Naperville-Joliet, IL-IN-WI 595 70,472
Cincinnati-Middletown, OH-KY-IN 192 19,216
Cleveland-Elyria-Mentor, OH 170 19,032
Colorado Springs, CO 49 5,8472
Columbia, SC 133 8,0967
Columbus, OH 173 18,278
Corpus Christi, TX 40 4,872
Dallas-Fort Worth-Arlington, TX 546 53,965
Dayton, OH 74 7,714
Denver-Aurora, CO 203 21,0692
Detroit-Warren-Livonia, MI 298 32,954
18
Table 2: Crash Statistics by Metropolitan Area, 2008
Metropolitan Area
Total No.
Fatalities
Total No.
Injuries
El Paso, TX 63 6,599
Eugene-Springfield, OR 33 2,155
Fresno, CA 138 5,200
Grand Rapids-Wyoming, MI 79 5,700
Hartford-West Hartford-East Hartford, CT 86 12,564
Honolulu, HI 43 -
Houston-Baytown-Sugar Land, TX 603 55,053
Indianapolis, IN 178 12,448
Jacksonville, FL 207 14,447
Kansas City, MO-KS 225 16,477
Laredo, TX 27 2,335
Las Vegas-Paradise, NV 201 23,150
Little Rock-North Little Rock, AR 122 13,0071
Los Angeles-Long Beach-Santa Ana, CA 874 93,784
Louisville, KY-IN 165 11,510
Memphis, TN-MS-AR 193 16,1161,8
Miami-Fort Lauderdale-Miami Beach, FL 694 61,661
Milwaukee-Waukesha-West Allis, WI 86 14,292
Minneapolis-St. Paul-Bloomington, MN-WI 193 20,747
Nashville-Davidson-Murfreesboro, TN 230 19,0837
New Haven-Milford, CT 76 9,826
New Orleans-Metairie-Kenner, LA 145 18,459
New York-Newark-Edison, NY-NJ-PA 992 195,8135
Oklahoma City, OK 154 13,355
Omaha-Council Bluffs, NE-IA 67 7,960
Orlando, FL 328 21,969
Oxnard-Thousand Oaks-Ventura, CA 76 5,280
Pensacola-Ferry Pass-Brent, FL 78 5,831
Philadelphia-Camden-Wilmington, PA-NJ-DE-MD 456 47,8573
Phoenix-Mesa-Scottsdale, AZ 449 37,185
Pittsburgh, PA 242 14,747
Portland-Vancouver-Beaverton, OR-WA 127 15,152
19
Table 2: Crash Statistics by Metropolitan Area, 2008
Metropolitan Area
Total No.
Fatalities
Total No.
Injuries
Providence-New Bedford-Fall River, RI-MA 108 -
Raleigh-Cary, Durham, NC 123 12,4816
Richmond, VA 150 12,490
Riverside-San Bernardino-Ontario, CA 546 25,136
Rochester, NY 70 9,3505
Sacramento-Arden-Arcade-Roseville, CA 169 15,254
Salem, OR 39 3,002
Salt Lake City, UT 91 12,1668
San Antonio, TX 221 25,453
San Diego-Carlsbad-San Marcos, CA 263 19,051
San Francisco-Oakland-Fremont, CA 225 23,552
San Jose-Sunnyvale-Santa Clara, CA 106 9,368
Sarasota-Bradenton-Venice, FL 96 5,763
Seattle-Tacoma-Bellevue, WA 200 23,555
Spokane, WA 22 3,050
Springfield, MA 44 2,328
St. Louis, MO-IL 308 23,056
Tampa-St. Petersburg-Clearwater, FL 421 36,312
Toledo, OH 70 7,603
Tucson, AZ 137 9,317
Tulsa, OK 143 10,688
Virginia Beach-Norfolk-Newport News, VA-NC 153 14,5156
Washington-Arlington-Alexandria, DC-VA-MD-WV 392 38,0323,9
Notes: “-“ indicates that data is not available
12007 injury data used for Arkansas counties 22006 injury data used for Colorado counties
32007 injury data used for Maryland counties
42007 injury data used for New Mexico counties
52007 injury data used for New York counties
62007 injury data used for North Carolina counties
72007 injury data used for South Carolina counties
82007 injury data used for Tennessee counties
9Does not include data for Jefferson County, WV and Washington, DC city limits
20
3.4.1 Crash Data Reports
In most cases, crash injury data is stored at the state level, usually with the state
Department of Transportation. In addition, most states produce an annual report on the
occurrence of traffic crashes within the state. The scope, format, and availability of these
reports vary widely between states. In many cases, these reports were available online.
However, not all crash data reports contained complete injury data at the county level.
For example, some crash reports included the number of injury crashes that occurred at
the county level, but did not contain the number of persons injured. For the purposes of
this research, the number of persons injured is required. As such, further inquiries about
crash data were needed for several states.
3.4.2 Phone or Email Efforts
When crash data reports were either not available, not current (i.e., for a year prior
to 2008), or did not contain the required information, an effort was made to contact a
technical resource in the respective state. In some cases, this contact person was able to
provide an updated crash data report or provide the requested information directly. In
other cases, crash data for a year prior to 2008 was provided because later years had not
yet been summarized.
The injury crash data used for this research came from a variety of sources, not
just state DOTs. For example, in some states this data was found by speaking with the
Governor’s Office of Transportation Safety, the State Police, or a local university, to
name a few. In general, it was found that while the majority of states store crash data with
the state DOT, this is far from a uniform practice. Because of this, obtaining injury crash
data for all 85 metropolitan areas became a daunting task that took several months and
21
countless phone calls and emails. The sources of the crash data used for each state can be
found in Appendix C.
In the end, injury crash data was found for 83 of the 85 metropolitan areas
considered. Crash data was not successfully obtained for Providence, RI and Honolulu,
HI. In the case of Providence, RI, the Rhode Island DOT was unable to release the crash
data without extensive review by their legal department. In the case of Honolulu, HI,
successful contact with the appropriate agency officials was not accomplished in time for
this thesis. Also, an incomplete injury data set for the Washington DC MSA was
compiled with data missing from Jackson County, WV and Washington DC. However,
injury data for the other 20 counties in the Washington DC MSA was found. As such,
Washington DC was included in the study. However, all relevant analysis will note this
incomplete data set.
3.5 Property Damage Only Data
Like injury crash data, no national database exists that summarizes property
damage only (PDO) data. As such, the data collection effort to obtain PDO crash
information for the 85 metropolitan areas would be substantial. Due to assumed
limitations in the PDO data and the relatively low economic costs associated with these
types of crashes, PDO crash data was not collected or included in this research.
3.6 Confidence in Data
No standard methods exist for collecting and reporting traffic crash data. As a
result, the consistency that exists in data collection methods between different states or
jurisdictions is unknown. The potential differences or discrepancies are outlined below.
22
First, crash data is only as good as the agencies or individuals charged with
producing that data. This means that individual police officers that respond to a traffic
crash and produce a crash report is solely responsible for the quality of data related to that
crash. Any omissions, errors, or oversight by the reporting officer amounts to an
incomplete data set.
Second, traffic crash reporting is an inexact science as best. For example, an
officer will likely report a crash as an injury crash if obvious signs of injury are present at
the scene. However, if a person involved in the crash develops signs of an injury related
to the crash in the days or weeks following the crash, the crash record might not be
updated to reflect that. Furthermore, the severity of an injury is somewhat of a judgment
call, particularly for officers who are not trained extensively in that area. These examples
and others highlight some of the areas where crash statistics can be flawed.
Third, the accuracy of crash statistics faces the problem of crashes going
unreported. It is estimated that roughly 50 percent of PDO crashes and 21 percent of
injury crashes go unreported. [5]. These estimates represent a significant gap in the data
set. Based on 2008 national crash data, that means that roughly 400,000 injury crashes
and 4 million PDO crashes went unreported [10]. However, a high level of confidence
can be had in the accuracy of reporting related to fatality crash occurrence. This is due to
the significance of the event when a fatality occurs. These crashes generally result in an
in-depth investigation and review. As such, it can be assumed that few fatality crashes go
unreported.
Lastly, state reporting methods for what constitutes an injury crash is another area
where discrepancies can arise. In general, states classify injuries as incapacitating, non-
23
incapacitating, or possible injury. When reporting aggregated injury numbers, however,
some states may include possible injuries in the total number of injuries whereas others
do not. By leaving these out, a state could artificially reduce the number of injuries that
appear to occur within its borders. Further investigation into the reporting methods of
each state would need to be conducted to verify the consistency related to this issue.
In general, crash data is widely known to have significant limitations and flaws.
For that reason, this research attempts to outline those limitations when applicable and
take a conservative approach on reporting the occurrence of crashes for different
jurisdictions.
24
CHAPTER 4
METHODOLOGY
This chapter outlines the methodology used for this research. Specifically, the
methods used to calculate the economic cost of traffic crashes will be discussed. In
addition, the methods used to compare the economic cost of traffic crashes to the
economic cost of traffic congestion will be outlined.
4.1 Gross Calculation Method
To calculate the economic cost of traffic crashes, two factors will be considered,
the number of fatalities and the number of injuries that occur as a result of traffic crashes
in a given MSA. As noted previously, the occurrence of PDO crashes has been excluded
from this study because of the low confidence in the completeness of the data set and the
relatively low economic costs associated with these crashes. In addition, by excluding
crashes of this type, the overall cost estimate can be assumed to be more conservative,
meaning the actual cost of crashes is higher than the value being reported.
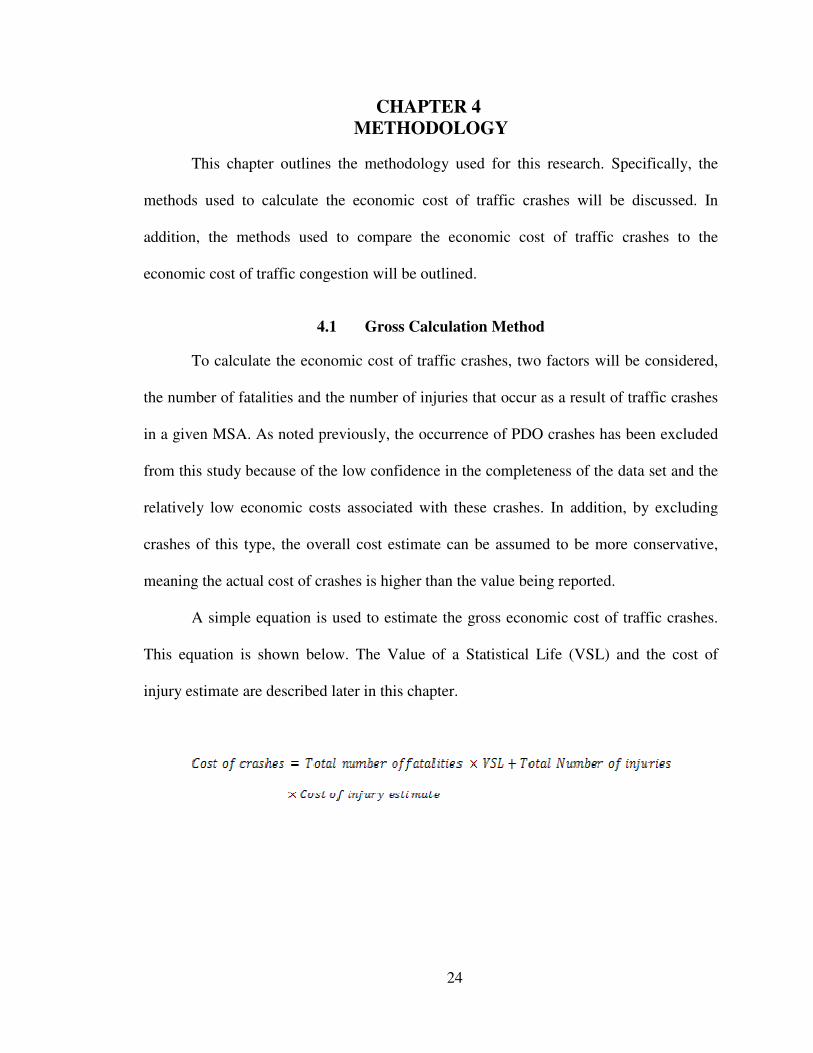
A simple equation is used to estimate the gross economic cost of traffic crashes.
This equation is shown below. The Value of a Statistical Life (VSL) and the cost of
injury estimate are described later in this chapter.
25
4.2 Value of a Statistical Life
Periodically, the FHWA develops guidance for an appropriate estimate for the
VSL. The VSL is a figure used to estimate the economic costs to society when a person is
killed as a result of a traffic crash. This estimate is a generalized number that attempts to
take into account a variety of factors including medical costs, repair costs, nonrecurring
congestion, and lost productivity, to name a few. A guidance memorandum from the
FHWA describes the VSL as, “the value of improvements in safety that result in a
reduction by one in the expected number of fatalities.” [6]
4.2.1 History of VSL
In January 1993, the FHWA adopted the guidance memorandum, “Treatment of
Value of Life and Injuries in Preparing Economic Evaluations” [16]. This document
outlined the procedures that should be used to estimate the economic cost of traffic
crashes. At the time, the VSL was estimated to be $2.5 million. This meant that any time
a person was killed as a result of a traffic crash, the economic cost to society of that event
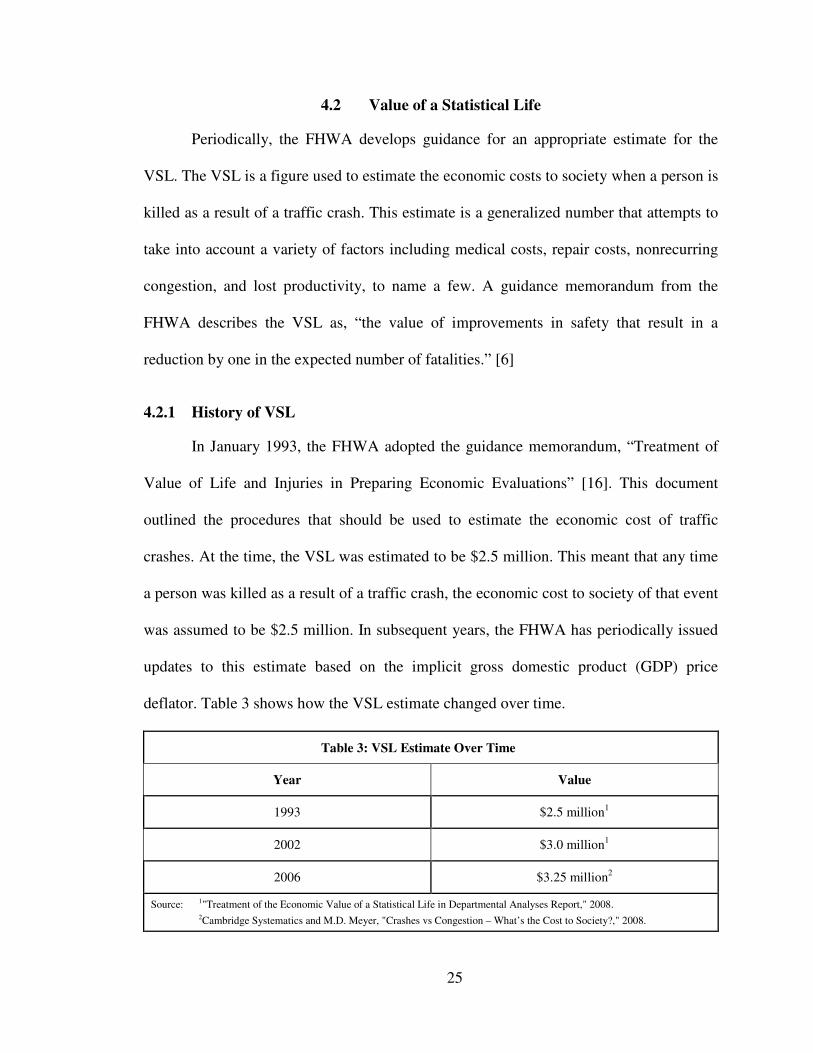
was assumed to be $2.5 million. In subsequent years, the FHWA has periodically issued
updates to this estimate based on the implicit gross domestic product (GDP) price
deflator. Table 3 shows how the VSL estimate changed over time.
Table 3: VSL Estimate Over Time
Year Value
1993 $2.5 million1
2002 $3.0 million1
2006 $3.25 million2
Source: 1"Treatment of the Economic Value of a Statistical Life in Departmental Analyses Report," 2008.
2Cambridge Systematics and M.D. Meyer, "Crashes vs Congestion – What’s the Cost to Society?," 2008.
26
However, the updating method used by the FHWA to adjust the 1993 value was
found to be underestimating the VSL for two major reasons. First, the implicit GDP price
deflator was found not to be an accurate way to adjust for the change in cost over time
[6], resulting in a downward bias trend. Second, the previous estimate did not account for
the rising income of US households and that as people grow richer, they become more
willing to pay for safety. As such, the change in the VSL estimate could very well differ
between income classes more or less than it does for the country as a whole [6], making
simplified adjustments less meaningful.
4.2.2 Updated VSL Estimate
In 2008, rather than simply increasing the 1993 estimate incrementally, the
FHWA revisited the issue of the VSL. Upon review, it was determined that a new
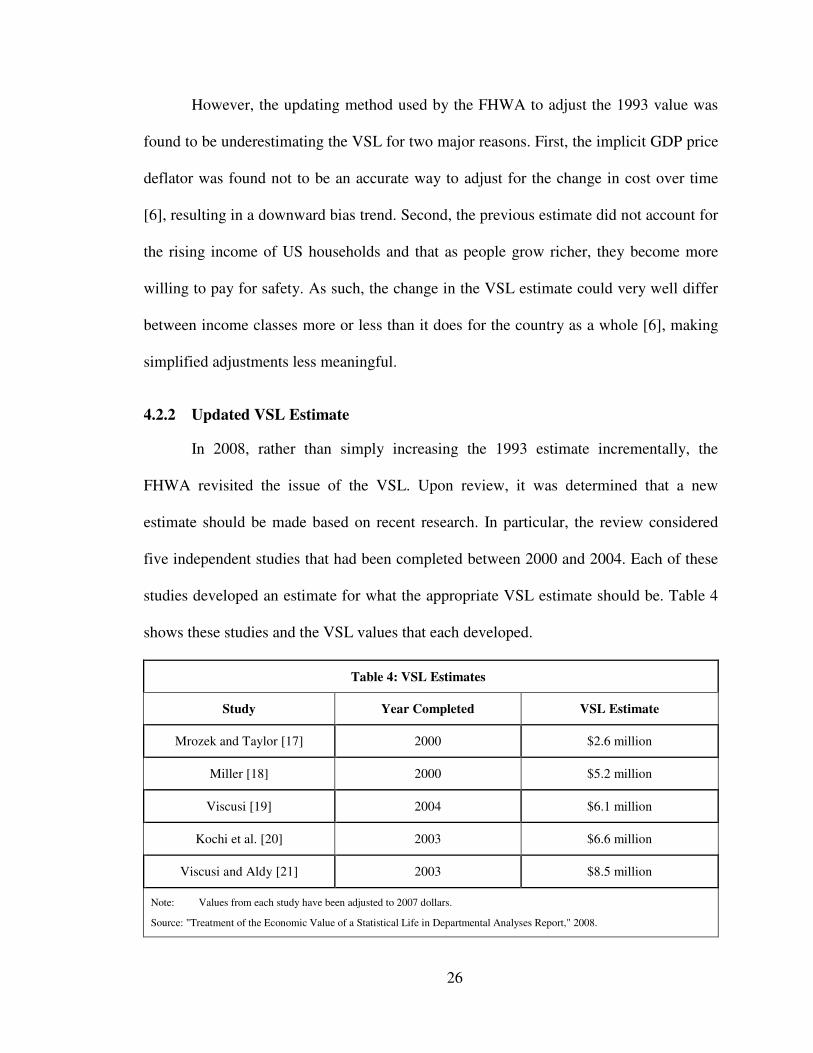
estimate should be made based on recent research. In particular, the review considered
five independent studies that had been completed between 2000 and 2004. Each of these
studies developed an estimate for what the appropriate VSL estimate should be. Table 4
shows these studies and the VSL values that each developed.
Table 4: VSL Estimates
Study Year Completed VSL Estimate
Mrozek and Taylor [17] 2000 $2.6 million
Miller [18] 2000 $5.2 million
Viscusi [19] 2004 $6.1 million
Kochi et al. [20] 2003 $6.6 million
Viscusi and Aldy [21] 2003 $8.5 million
Note: Values from each study have been adjusted to 2007 dollars.
Source: "Treatment of the Economic Value of a Statistical Life in Departmental Analyses Report," 2008.
27
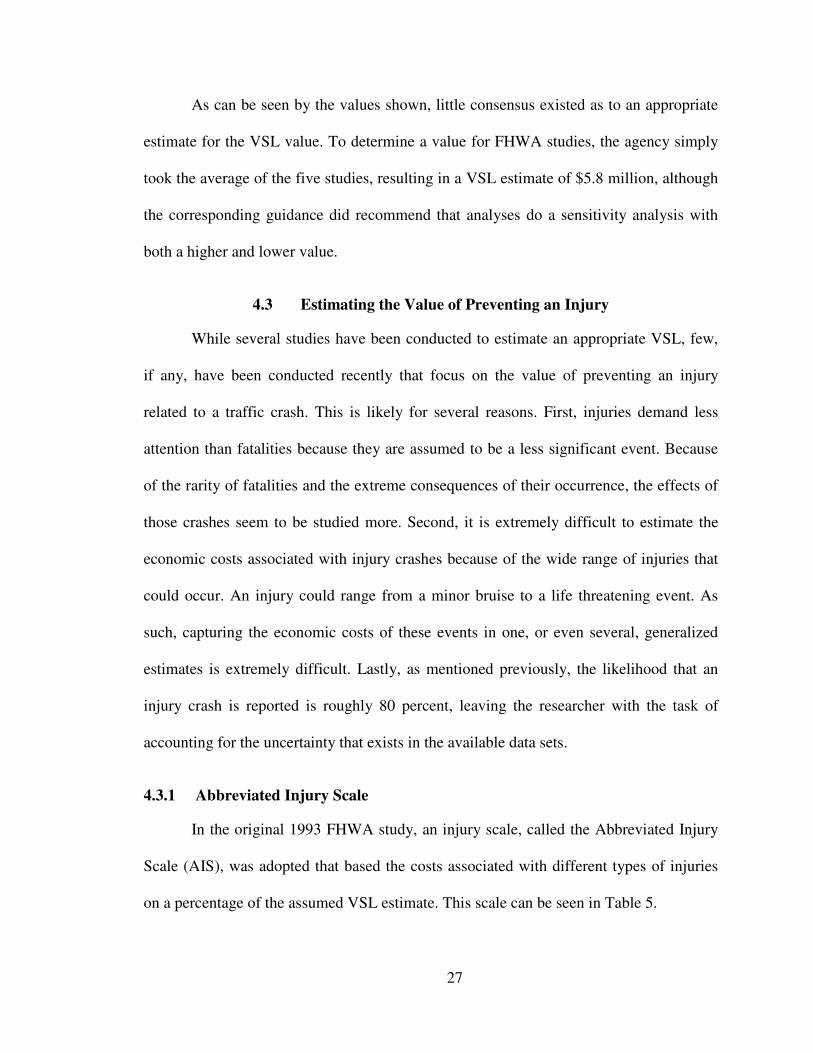
As can be seen by the values shown, little consensus existed as to an appropriate
estimate for the VSL value. To determine a value for FHWA studies, the agency simply
took the average of the five studies, resulting in a VSL estimate of $5.8 million, although
the corresponding guidance did recommend that analyses do a sensitivity analysis with
both a higher and lower value.
4.3 Estimating the Value of Preventing an Injury
While several studies have been conducted to estimate an appropriate VSL, few,
if any, have been conducted recently that focus on the value of preventing an injury
related to a traffic crash. This is likely for several reasons. First, injuries demand less
attention than fatalities because they are assumed to be a less significant event. Because
of the rarity of fatalities and the extreme consequences of their occurrence, the effects of
those crashes seem to be studied more. Second, it is extremely difficult to estimate the
economic costs associated with injury crashes because of the wide range of injuries that
could occur. An injury could range from a minor bruise to a life threatening event. As
such, capturing the economic costs of these events in one, or even several, generalized
estimates is extremely difficult. Lastly, as mentioned previously, the likelihood that an
injury crash is reported is roughly 80 percent, leaving the researcher with the task of
accounting for the uncertainty that exists in the available data sets.
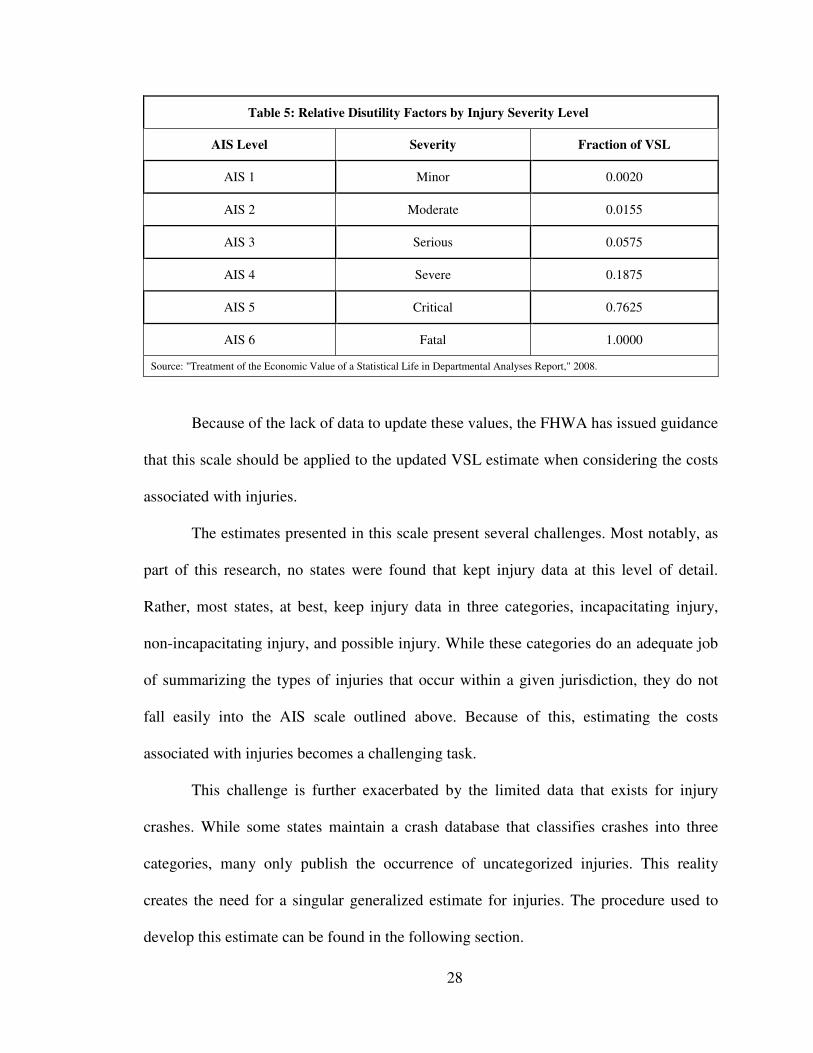
4.3.1 Abbreviated Injury Scale
In the original 1993 FHWA study, an injury scale, called the Abbreviated Injury
Scale (AIS), was adopted that based the costs associated with different types of injuries
on a percentage of the assumed VSL estimate. This scale can be seen in Table 5.
28
Table 5: Relative Disutility Factors by Injury Severity Level
AIS Level Severity Fraction of VSL
AIS 1 Minor 0.0020
AIS 2 Moderate 0.0155
AIS 3 Serious 0.0575
AIS 4 Severe 0.1875
AIS 5 Critical 0.7625
AIS 6 Fatal 1.0000
Source: "Treatment of the Economic Value of a Statistical Life in Departmental Analyses Report," 2008.
Because of the lack of data to update these values, the FHWA has issued guidance
that this scale should be applied to the updated VSL estimate when considering the costs
associated with injuries.
The estimates presented in this scale present several challenges. Most notably, as
part of this research, no states were found that kept injury data at this level of detail.
Rather, most states, at best, keep injury data in three categories, incapacitating injury,
non-incapacitating injury, and possible injury. While these categories do an adequate job
of summarizing the types of injuries that occur within a given jurisdiction, they do not
fall easily into the AIS scale outlined above. Because of this, estimating the costs
associated with injuries becomes a challenging task.
This challenge is further exacerbated by the limited data that exists for injury
crashes. While some states maintain a crash database that classifies crashes into three
categories, many only publish the occurrence of uncategorized injuries. This reality
creates the need for a singular generalized estimate for injuries. The procedure used to
develop this estimate can be found in the following section.
29
4.3.2 Cost of Injury Estimating Procedure
Due to the lack of detailed crash data, a procedure was developed to create a
generalized estimate for the costs associated with the occurrence of injuries related to
traffic crashes.
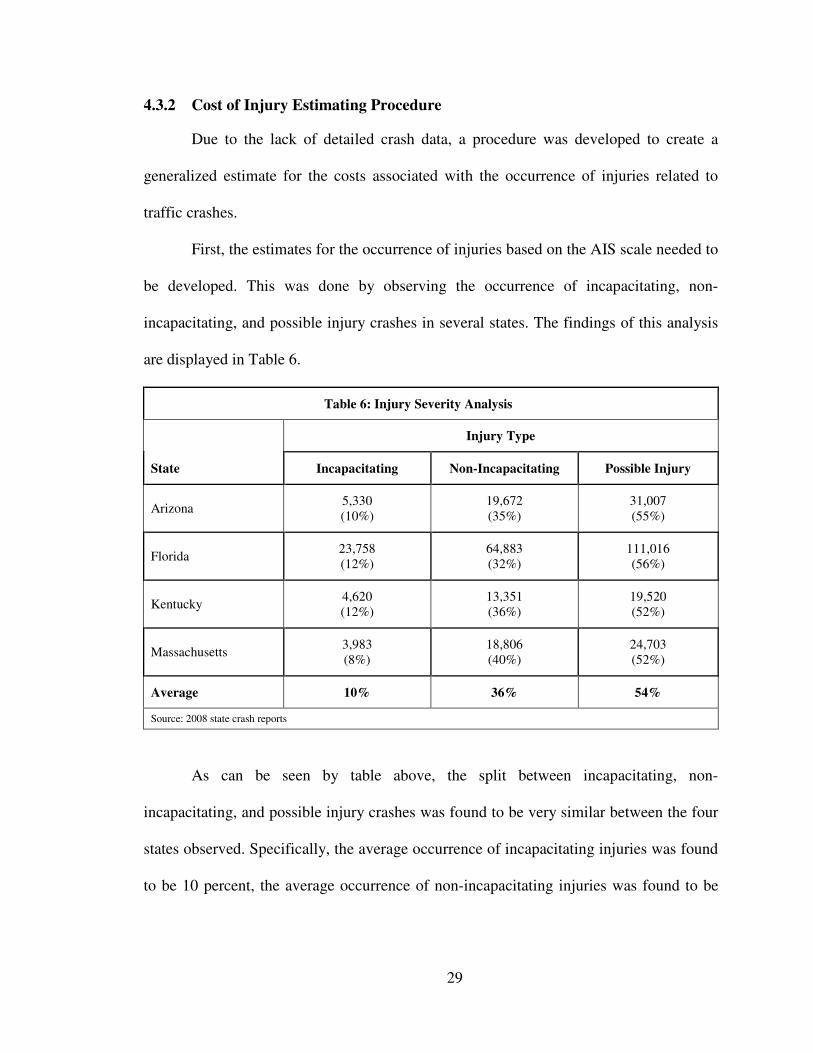
First, the estimates for the occurrence of injuries based on the AIS scale needed to
be developed. This was done by observing the occurrence of incapacitating, non-
incapacitating, and possible injury crashes in several states. The findings of this analysis
are displayed in Table 6.
Table 6: Injury Severity Analysis
State
Injury Type
Incapacitating Non-Incapacitating Possible Injury
Arizona 5,330 (10%)
19,672 (35%)
31,007 (55%)
Florida 23,758 (12%)
64,883 (32%)
111,016 (56%)
Kentucky 4,620 (12%)
13,351 (36%)
19,520 (52%)
Massachusetts 3,983 (8%)
18,806 (40%)
24,703 (52%)
Average 10% 36% 54%
Source: 2008 state crash reports
As can be seen by table above, the split between incapacitating, non-
incapacitating, and possible injury crashes was found to be very similar between the four
states observed. Specifically, the average occurrence of incapacitating injuries was found
to be 10 percent, the average occurrence of non-incapacitating injuries was found to be
30
36 percent, and the average occurrence of possible injuries was found to be 54 percent.
These estimates are using 2008 statewide crash data.
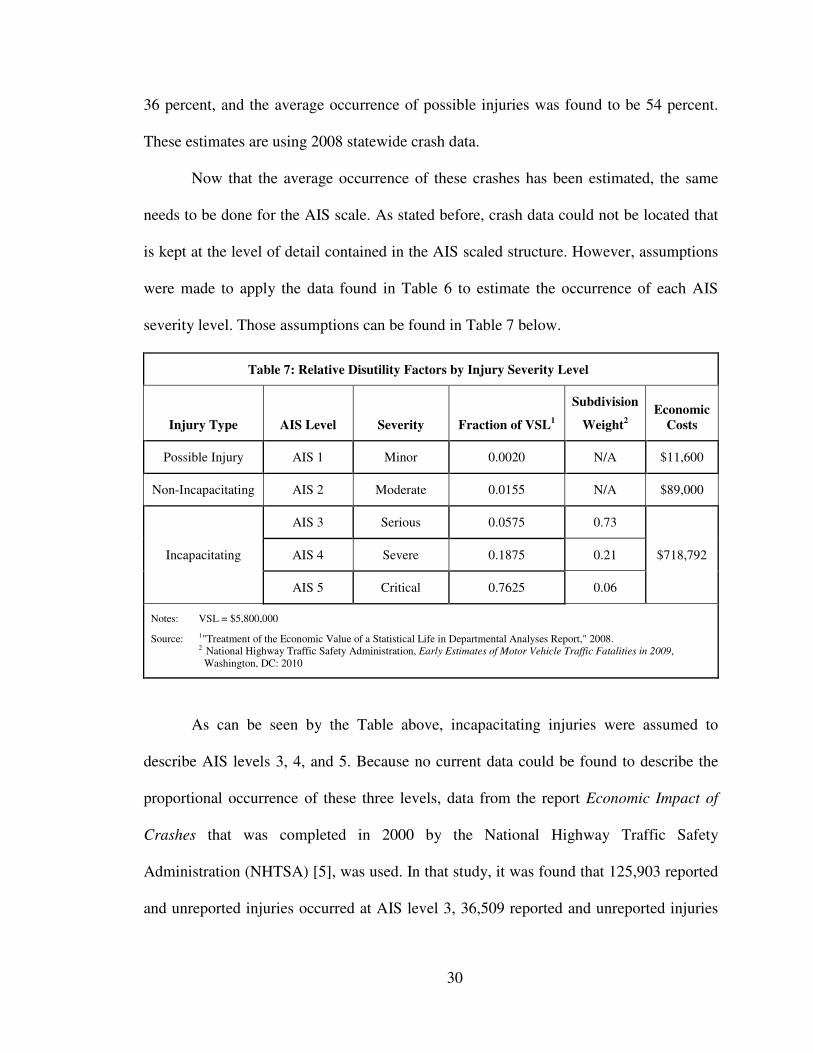
Now that the average occurrence of these crashes has been estimated, the same
needs to be done for the AIS scale. As stated before, crash data could not be located that
is kept at the level of detail contained in the AIS scaled structure. However, assumptions
were made to apply the data found in Table 6 to estimate the occurrence of each AIS
severity level. Those assumptions can be found in Table 7 below.
Table 7: Relative Disutility Factors by Injury Severity Level
Injury Type AIS Level Severity Fraction of VSL1
Subdivision
Weight2
Economic
Costs
Possible Injury AIS 1 Minor 0.0020 N/A $11,600
Non-Incapacitating AIS 2 Moderate 0.0155 N/A $89,000
Incapacitating
AIS 3 Serious 0.0575 0.73
$718,792 AIS 4 Severe 0.1875 0.21
AIS 5 Critical 0.7625 0.06
Notes: VSL = $5,800,000
Source: 1"Treatment of the Economic Value of a Statistical Life in Departmental Analyses Report," 2008. 2 National Highway Traffic Safety Administration, Early Estimates of Motor Vehicle Traffic Fatalities in 2009, Washington, DC: 2010
As can be seen by the Table above, incapacitating injuries were assumed to
describe AIS levels 3, 4, and 5. Because no current data could be found to describe the
proportional occurrence of these three levels, data from the report Economic Impact of
Crashes that was completed in 2000 by the National Highway Traffic Safety
Administration (NHTSA) [5], was used. In that study, it was found that 125,903 reported
and unreported injuries occurred at AIS level 3, 36,509 reported and unreported injuries
31
occurred at AIS level 4, and 9,463 reported and unreported injuries occurred at AIS level
5. This data is based on occurrences in the U.S. during 2000.
The economic cost shown in Table 7 for each injury type is calculated by
multiplying the assumed VSL by the Fraction of VSL value for each (the Fraction of
VSL value comes from the original AIS scale). In the case of incapacitating injury, the
resultant economic costs of the three AIS levels contained in that category are weighted
by the occurrence of crashes found in the Economic Impact of Crashes discussed earlier.
The economic costs assumed from this process is $11,600 for possible injury crashes,
$89,000 for non-incapacitating crashes, and $718,792 for incapacitating crashes.
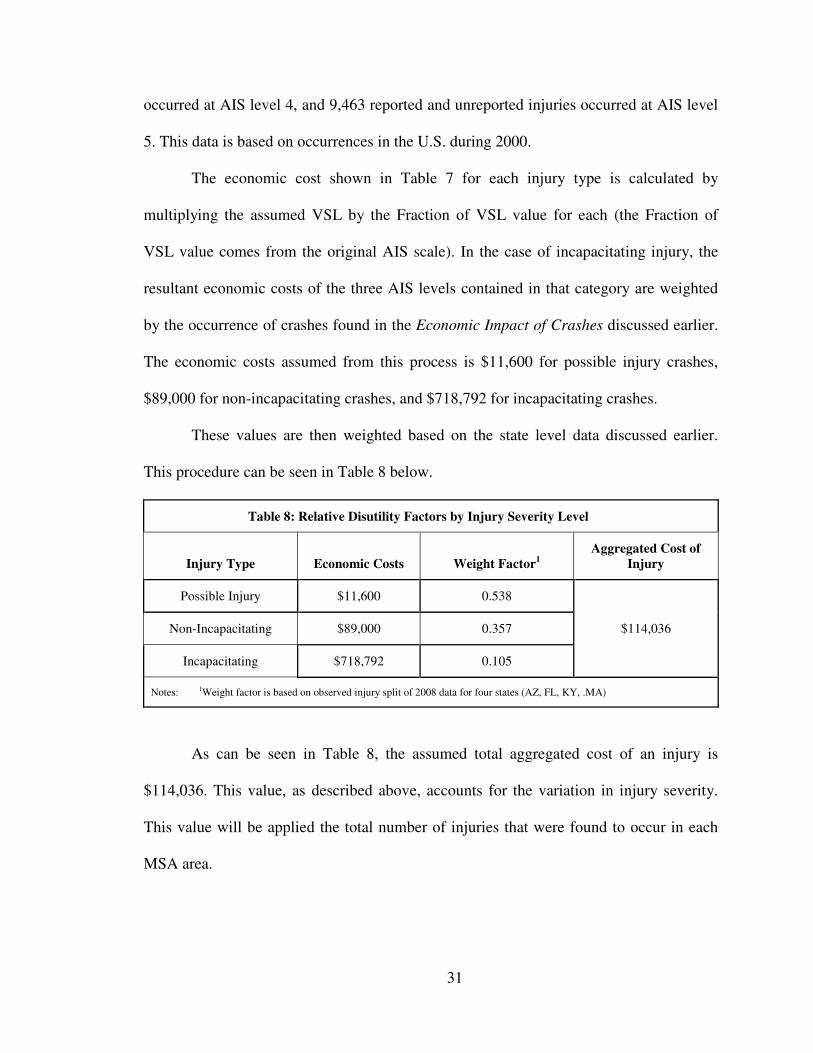
These values are then weighted based on the state level data discussed earlier.
This procedure can be seen in Table 8 below.
Table 8: Relative Disutility Factors by Injury Severity Level
Injury Type Economic Costs Weight Factor1
Aggregated Cost of
Injury
Possible Injury $11,600 0.538
$114,036 Non-Incapacitating $89,000 0.357
Incapacitating $718,792 0.105
Notes: 1Weight factor is based on observed injury split of 2008 data for four states (AZ, FL, KY, .MA)
As can be seen in Table 8, the assumed total aggregated cost of an injury is
$114,036. This value, as described above, accounts for the variation in injury severity.
This value will be applied the total number of injuries that were found to occur in each
MSA area.
32
4.4 Comparing the Cost of Crashes to the Cost of Congestion
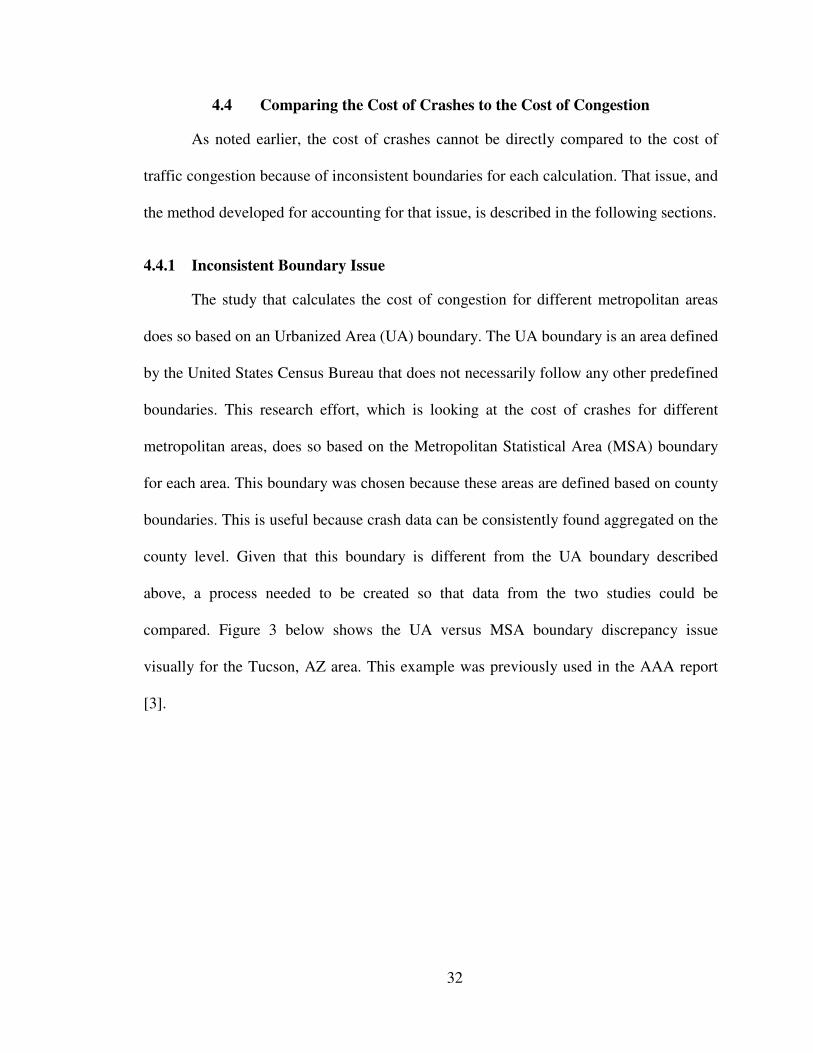
As noted earlier, the cost of crashes cannot be directly compared to the cost of
traffic congestion because of inconsistent boundaries for each calculation. That issue, and
the method developed for accounting for that issue, is described in the following sections.
4.4.1 Inconsistent Boundary Issue
The study that calculates the cost of congestion for different metropolitan areas
does so based on an Urbanized Area (UA) boundary. The UA boundary is an area defined
by the United States Census Bureau that does not necessarily follow any other predefined
boundaries. This research effort, which is looking at the cost of crashes for different
metropolitan areas, does so based on the Metropolitan Statistical Area (MSA) boundary
for each area. This boundary was chosen because these areas are defined based on county
boundaries. This is useful because crash data can be consistently found aggregated on the
county level. Given that this boundary is different from the UA boundary described
above, a process needed to be created so that data from the two studies could be
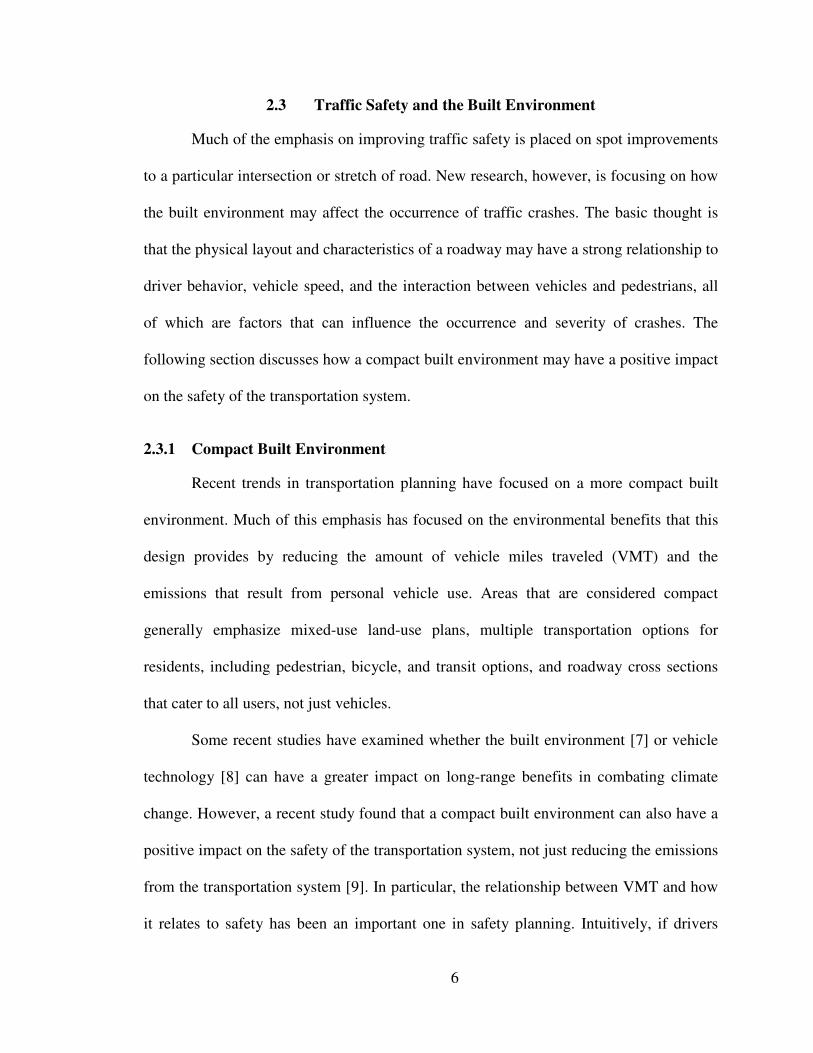
compared. Figure 3 below shows the UA versus MSA boundary discrepancy issue
visually for the Tucson, AZ area. This example was previously used in the AAA report
[3].
33
Figure 3: MSA vs UA for Tucson, AZ
In the figure above, the black circle highlights the shaded area that represents the
UA boundary for the Tucson area. However, the MSA area for Tucson is defined by
Pima County, whose boundary is shown to be much broader [3]
4.4.2 Normalizing Economic Estimates
To account for the boundary discrepancies that were described above, a
normalization procedure was developed to make the results of the two studies
comparable. This is done by dividing the total estimated economic cost for congestion
and crashes by the appropriate population estimate for each boundary area. This will
produce a cost per person estimate for each that can be compared against the other for
relative magnitude.
34
CHAPTER 5
ANALYSIS AND RESULTS
This chapter describes the analysis and subsequent results of this research.
Specifically, the cost of crashes for the different metropolitan areas analyzed for this
study will be presented as well as generalized cost estimates based on population size
categories and other metrics. In addition, the cost of congestion for each of the analyzed
areas will be presented for comparison purposes.
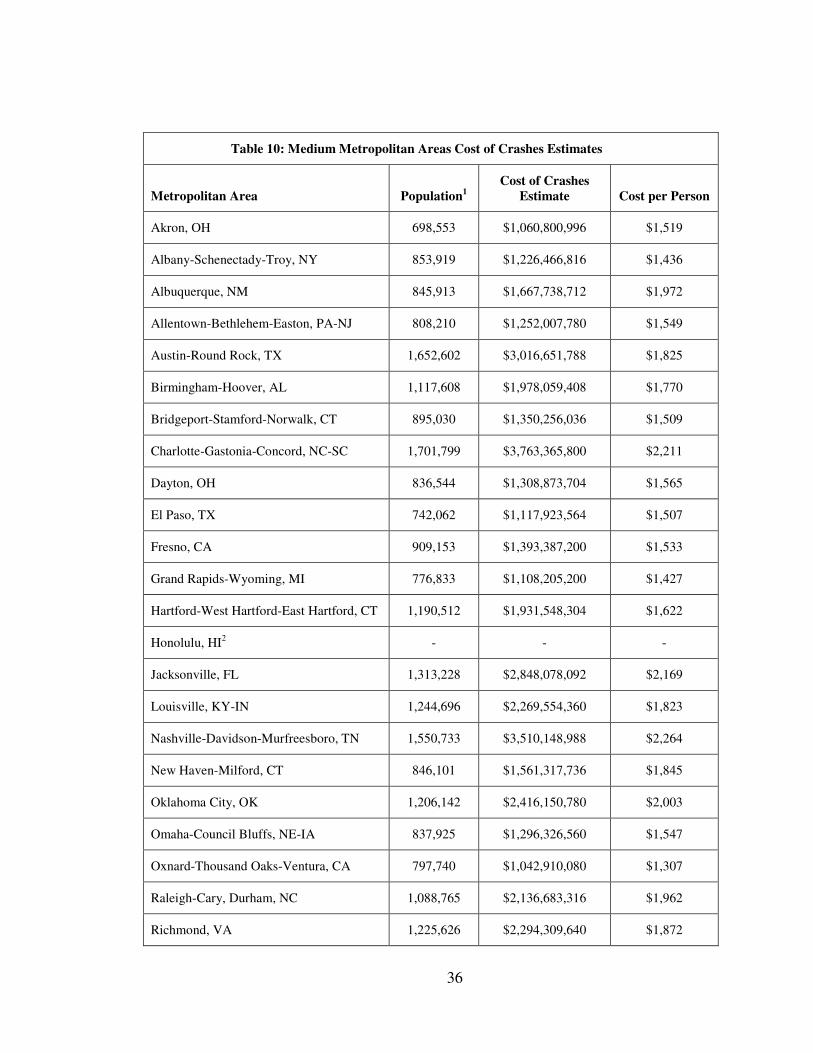
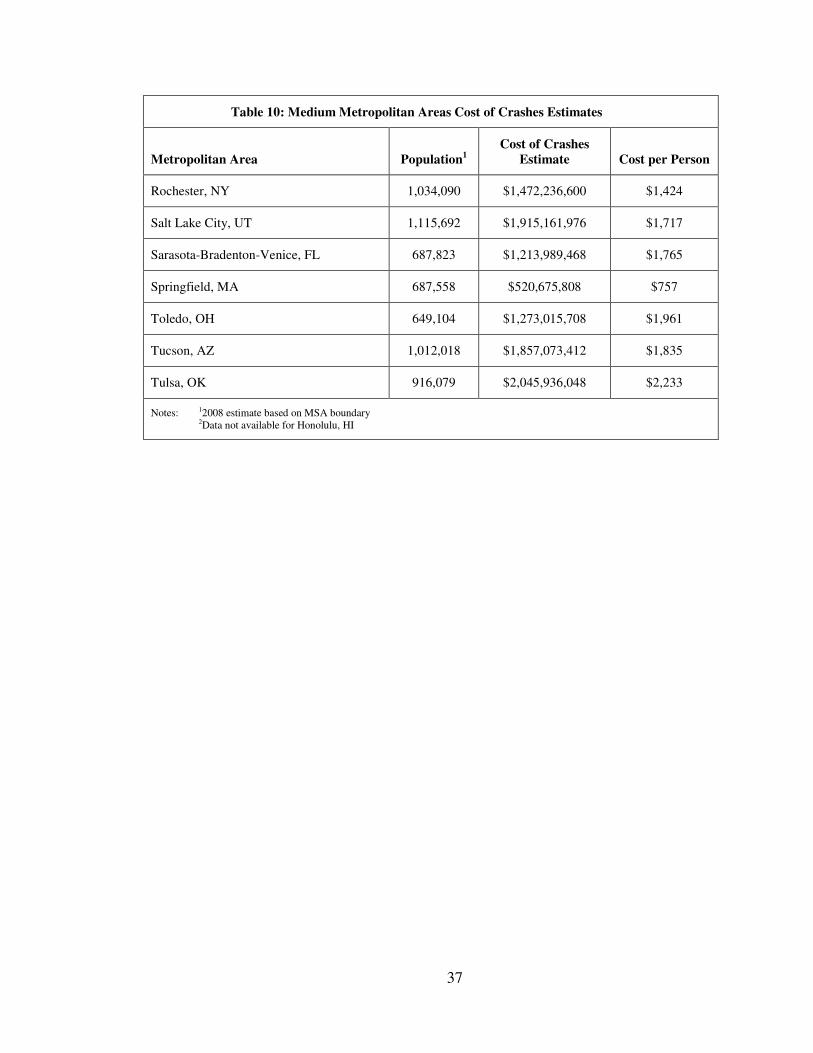
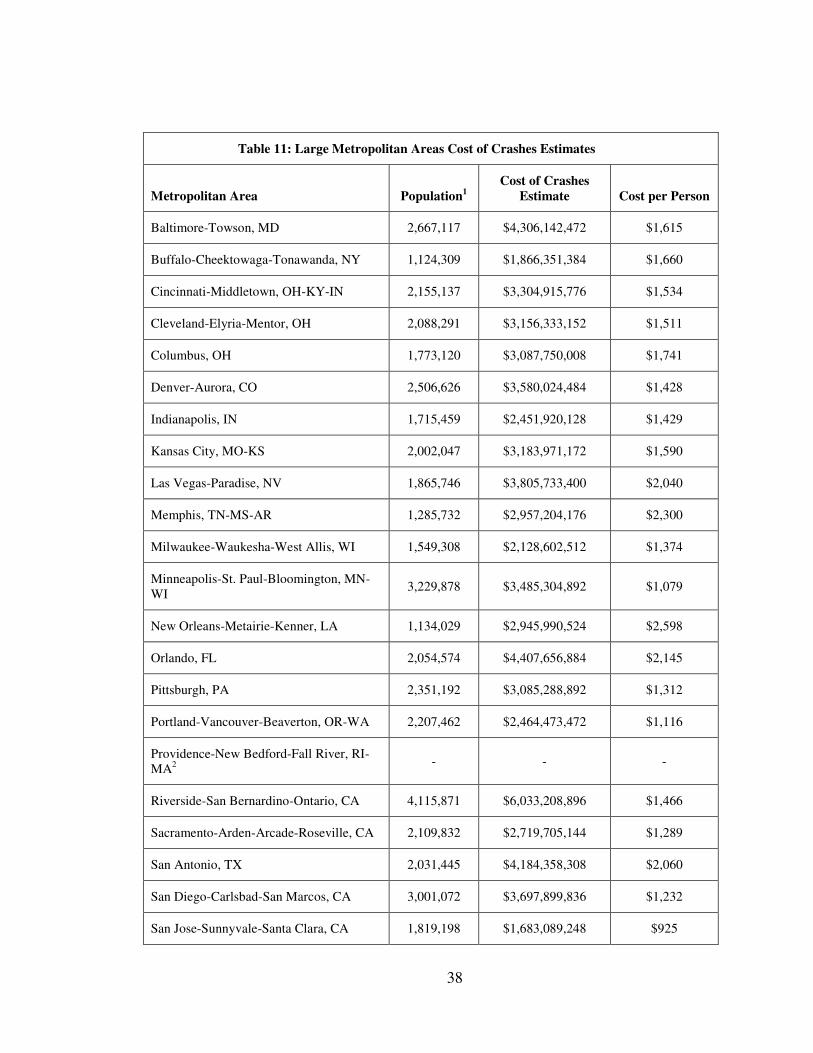
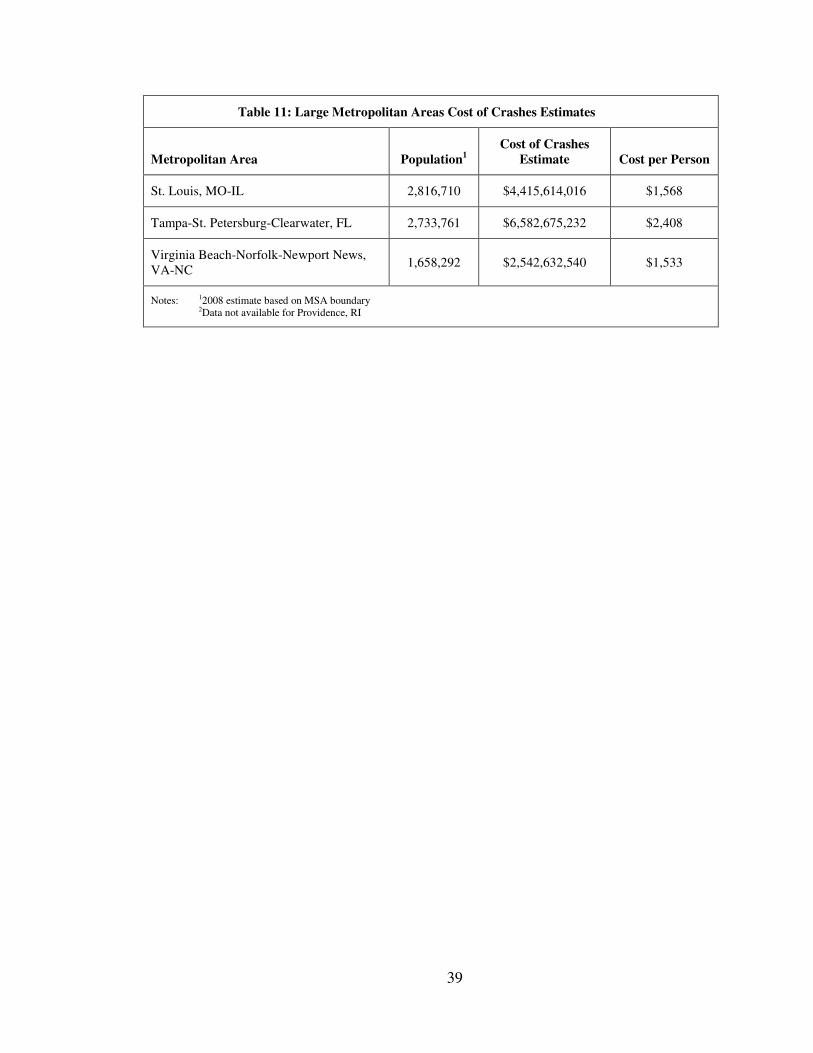
5.1 Cost of Crashes by Metropolitan Area Size
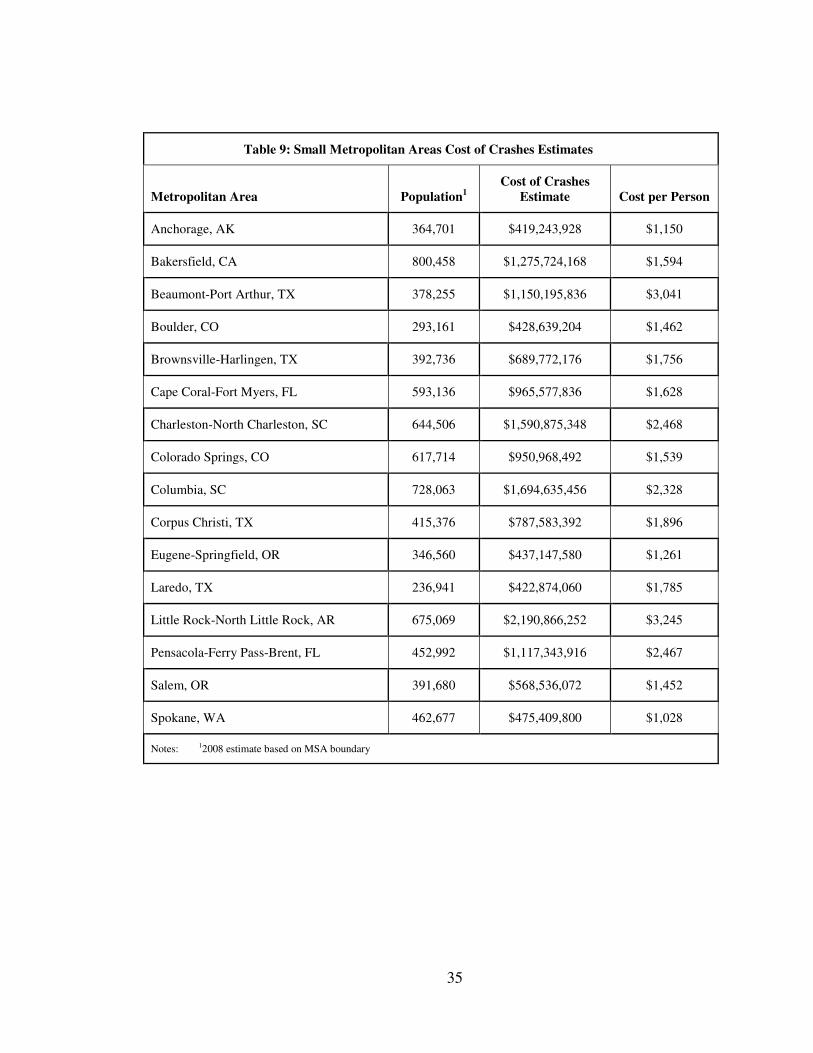
Tables 9 to 12 show the total cost of crashes for each metropolitan area organized
by metropolitan area size. The population size categories are as follows:
• Small – Less than 500,000
• Medium – 500,000 to 1,000,000
• Large – 1,000,000 to 3,000,000
• Very Large – Greater than 3,000,000
The metropolitan areas have been placed into the same size categories as they
were for the original AAA study for comparison purposes. The original category
placements in that study were based upon the estimated UA boundary population used in
the Urban Mobility Report that year. Given that MSA’s define a larger area and
populations have likely grown in the different metropolitan areas since the previous
study, a metropolitan area’s current population listed below may fall outside of the above
criteria.
35
Table 9: Small Metropolitan Areas Cost of Crashes Estimates
Metropolitan Area Population1
Cost of Crashes
Estimate Cost per Person
Anchorage, AK 364,701 $419,243,928 $1,150
Bakersfield, CA 800,458 $1,275,724,168 $1,594
Beaumont-Port Arthur, TX 378,255 $1,150,195,836 $3,041
Boulder, CO 293,161 $428,639,204 $1,462
Brownsville-Harlingen, TX 392,736 $689,772,176 $1,756
Cape Coral-Fort Myers, FL 593,136 $965,577,836 $1,628
Charleston-North Charleston, SC 644,506 $1,590,875,348 $2,468
Colorado Springs, CO 617,714 $950,968,492 $1,539
Columbia, SC 728,063 $1,694,635,456 $2,328
Corpus Christi, TX 415,376 $787,583,392 $1,896
Eugene-Springfield, OR 346,560 $437,147,580 $1,261
Laredo, TX 236,941 $422,874,060 $1,785
Little Rock-North Little Rock, AR 675,069 $2,190,866,252 $3,245
Pensacola-Ferry Pass-Brent, FL 452,992 $1,117,343,916 $2,467
Salem, OR 391,680 $568,536,072 $1,452
Spokane, WA 462,677 $475,409,800 $1,028
Notes: 12008 estimate based on MSA boundary
36
Table 10: Medium Metropolitan Areas Cost of Crashes Estimates
Metropolitan Area Population1
Cost of Crashes
Estimate Cost per Person
Akron, OH 698,553 $1,060,800,996 $1,519
Albany-Schenectady-Troy, NY 853,919 $1,226,466,816 $1,436
Albuquerque, NM 845,913 $1,667,738,712 $1,972
Allentown-Bethlehem-Easton, PA-NJ 808,210 $1,252,007,780 $1,549
Austin-Round Rock, TX 1,652,602 $3,016,651,788 $1,825
Birmingham-Hoover, AL 1,117,608 $1,978,059,408 $1,770
Bridgeport-Stamford-Norwalk, CT 895,030 $1,350,256,036 $1,509
Charlotte-Gastonia-Concord, NC-SC 1,701,799 $3,763,365,800 $2,211
Dayton, OH 836,544 $1,308,873,704 $1,565
El Paso, TX 742,062 $1,117,923,564 $1,507
Fresno, CA 909,153 $1,393,387,200 $1,533
Grand Rapids-Wyoming, MI 776,833 $1,108,205,200 $1,427
Hartford-West Hartford-East Hartford, CT 1,190,512 $1,931,548,304 $1,622
Honolulu, HI2 - - -
Jacksonville, FL 1,313,228 $2,848,078,092 $2,169
Louisville, KY-IN 1,244,696 $2,269,554,360 $1,823
Nashville-Davidson-Murfreesboro, TN 1,550,733 $3,510,148,988 $2,264
New Haven-Milford, CT 846,101 $1,561,317,736 $1,845
Oklahoma City, OK 1,206,142 $2,416,150,780 $2,003
Omaha-Council Bluffs, NE-IA 837,925 $1,296,326,560 $1,547
Oxnard-Thousand Oaks-Ventura, CA 797,740 $1,042,910,080 $1,307
Raleigh-Cary, Durham, NC 1,088,765 $2,136,683,316 $1,962
Richmond, VA 1,225,626 $2,294,309,640 $1,872
37
Table 10: Medium Metropolitan Areas Cost of Crashes Estimates
Metropolitan Area Population1
Cost of Crashes
Estimate Cost per Person
Rochester, NY 1,034,090 $1,472,236,600 $1,424
Salt Lake City, UT 1,115,692 $1,915,161,976 $1,717
Sarasota-Bradenton-Venice, FL 687,823 $1,213,989,468 $1,765
Springfield, MA 687,558 $520,675,808 $757
Toledo, OH 649,104 $1,273,015,708 $1,961
Tucson, AZ 1,012,018 $1,857,073,412 $1,835
Tulsa, OK 916,079 $2,045,936,048 $2,233
Notes: 12008 estimate based on MSA boundary 2Data not available for Honolulu, HI
38
Table 11: Large Metropolitan Areas Cost of Crashes Estimates
Metropolitan Area Population1
Cost of Crashes
Estimate Cost per Person
Baltimore-Towson, MD 2,667,117 $4,306,142,472 $1,615
Buffalo-Cheektowaga-Tonawanda, NY 1,124,309 $1,866,351,384 $1,660
Cincinnati-Middletown, OH-KY-IN 2,155,137 $3,304,915,776 $1,534
Cleveland-Elyria-Mentor, OH 2,088,291 $3,156,333,152 $1,511
Columbus, OH 1,773,120 $3,087,750,008 $1,741
Denver-Aurora, CO 2,506,626 $3,580,024,484 $1,428
Indianapolis, IN 1,715,459 $2,451,920,128 $1,429
Kansas City, MO-KS 2,002,047 $3,183,971,172 $1,590
Las Vegas-Paradise, NV 1,865,746 $3,805,733,400 $2,040
Memphis, TN-MS-AR 1,285,732 $2,957,204,176 $2,300
Milwaukee-Waukesha-West Allis, WI 1,549,308 $2,128,602,512 $1,374
Minneapolis-St. Paul-Bloomington, MN-WI
3,229,878 $3,485,304,892 $1,079
New Orleans-Metairie-Kenner, LA 1,134,029 $2,945,990,524 $2,598
Orlando, FL 2,054,574 $4,407,656,884 $2,145
Pittsburgh, PA 2,351,192 $3,085,288,892 $1,312
Portland-Vancouver-Beaverton, OR-WA 2,207,462 $2,464,473,472 $1,116
Providence-New Bedford-Fall River, RI-MA2
- - -
Riverside-San Bernardino-Ontario, CA 4,115,871 $6,033,208,896 $1,466
Sacramento-Arden-Arcade-Roseville, CA 2,109,832 $2,719,705,144 $1,289
San Antonio, TX 2,031,445 $4,184,358,308 $2,060
San Diego-Carlsbad-San Marcos, CA 3,001,072 $3,697,899,836 $1,232
San Jose-Sunnyvale-Santa Clara, CA 1,819,198 $1,683,089,248 $925
39
Table 11: Large Metropolitan Areas Cost of Crashes Estimates
Metropolitan Area Population1
Cost of Crashes
Estimate Cost per Person
St. Louis, MO-IL 2,816,710 $4,415,614,016 $1,568
Tampa-St. Petersburg-Clearwater, FL 2,733,761 $6,582,675,232 $2,408
Virginia Beach-Norfolk-Newport News, VA-NC
1,658,292 $2,542,632,540 $1,533
Notes: 12008 estimate based on MSA boundary 2Data not available for Providence, RI
40
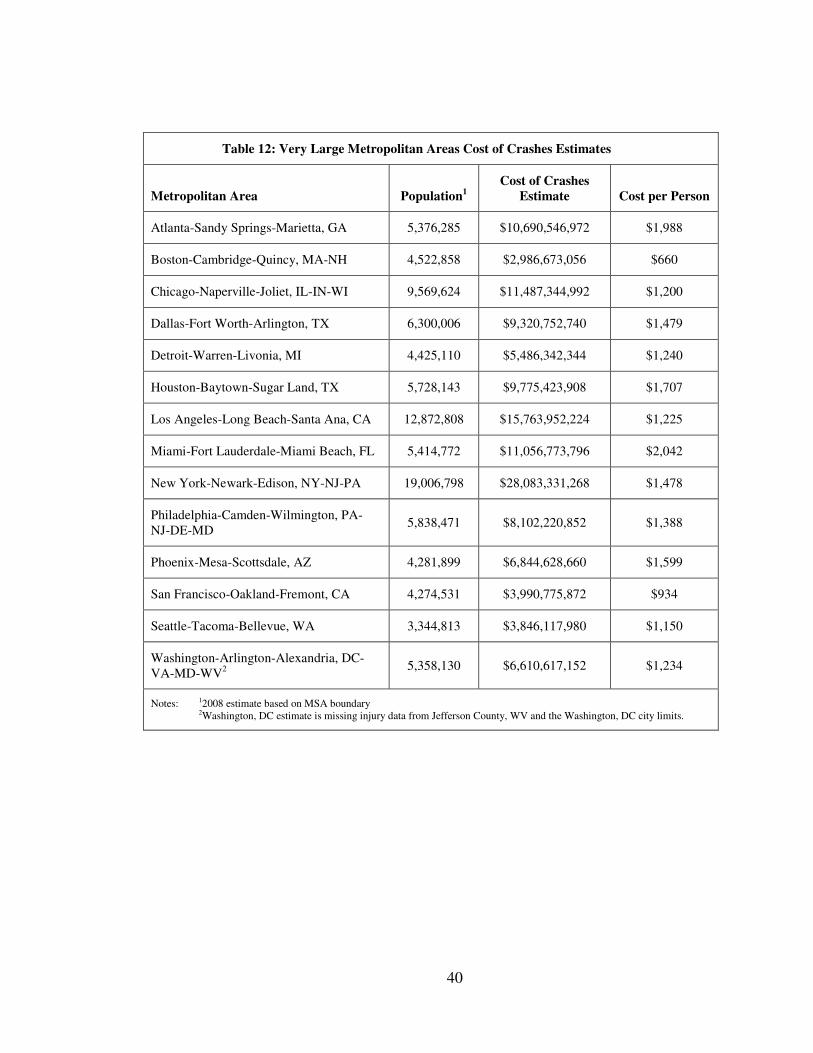
Table 12: Very Large Metropolitan Areas Cost of Crashes Estimates
Metropolitan Area Population1
Cost of Crashes
Estimate Cost per Person
Atlanta-Sandy Springs-Marietta, GA 5,376,285 $10,690,546,972 $1,988
Boston-Cambridge-Quincy, MA-NH 4,522,858 $2,986,673,056 $660
Chicago-Naperville-Joliet, IL-IN-WI 9,569,624 $11,487,344,992 $1,200
Dallas-Fort Worth-Arlington, TX 6,300,006 $9,320,752,740 $1,479
Detroit-Warren-Livonia, MI 4,425,110 $5,486,342,344 $1,240
Houston-Baytown-Sugar Land, TX 5,728,143 $9,775,423,908 $1,707
Los Angeles-Long Beach-Santa Ana, CA 12,872,808 $15,763,952,224 $1,225
Miami-Fort Lauderdale-Miami Beach, FL 5,414,772 $11,056,773,796 $2,042
New York-Newark-Edison, NY-NJ-PA 19,006,798 $28,083,331,268 $1,478
Philadelphia-Camden-Wilmington, PA-NJ-DE-MD
5,838,471 $8,102,220,852 $1,388
Phoenix-Mesa-Scottsdale, AZ 4,281,899 $6,844,628,660 $1,599
San Francisco-Oakland-Fremont, CA 4,274,531 $3,990,775,872 $934
Seattle-Tacoma-Bellevue, WA 3,344,813 $3,846,117,980 $1,150
Washington-Arlington-Alexandria, DC-VA-MD-WV2
5,358,130 $6,610,617,152 $1,234
Notes: 12008 estimate based on MSA boundary 2Washington, DC estimate is missing injury data from Jefferson County, WV and the Washington, DC city limits.
41
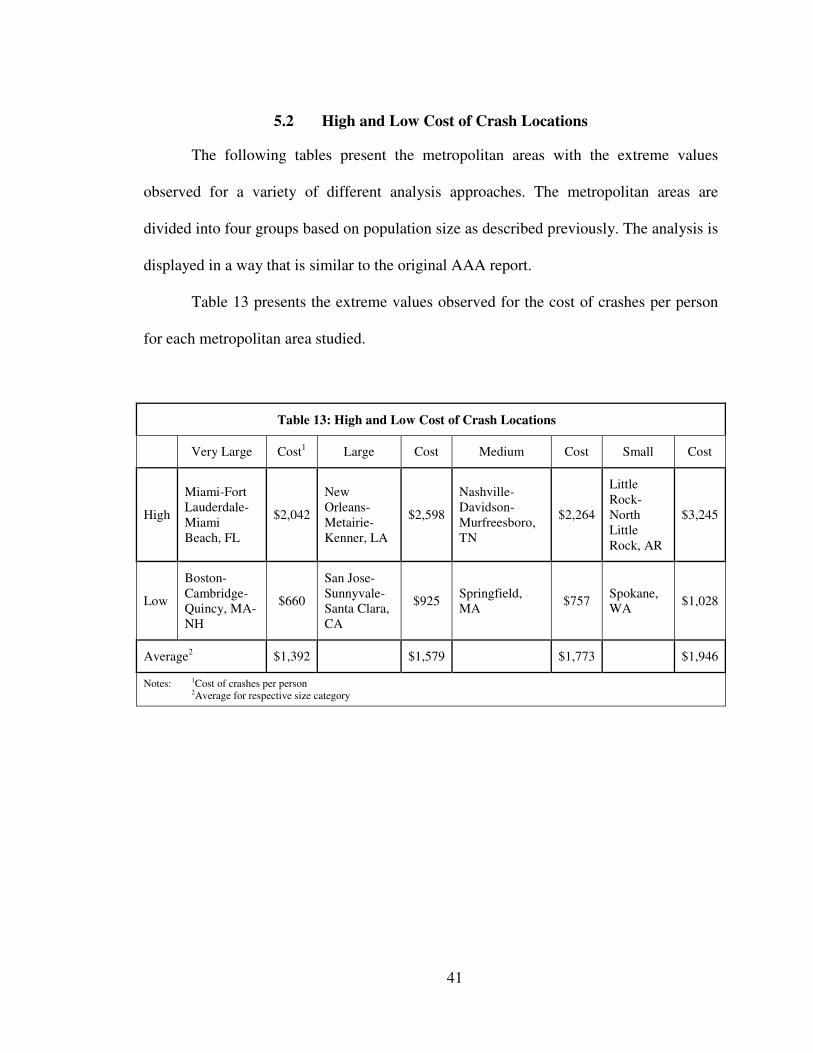
5.2 High and Low Cost of Crash Locations
The following tables present the metropolitan areas with the extreme values
observed for a variety of different analysis approaches. The metropolitan areas are
divided into four groups based on population size as described previously. The analysis is
displayed in a way that is similar to the original AAA report.
Table 13 presents the extreme values observed for the cost of crashes per person
for each metropolitan area studied.
Table 13: High and Low Cost of Crash Locations
Very Large Cost1 Large Cost Medium Cost Small Cost
High
Miami-Fort Lauderdale-Miami Beach, FL
$2,042
New Orleans-Metairie-Kenner, LA
$2,598
Nashville-Davidson-Murfreesboro, TN
$2,264
Little Rock-North Little Rock, AR
$3,245
Low
Boston-Cambridge-Quincy, MA-NH
$660
San Jose-Sunnyvale-Santa Clara, CA
$925 Springfield, MA
$757 Spokane, WA
$1,028
Average2 $1,392 $1,579 $1,773 $1,946
Notes: 1Cost of crashes per person 2Average for respective size category
42
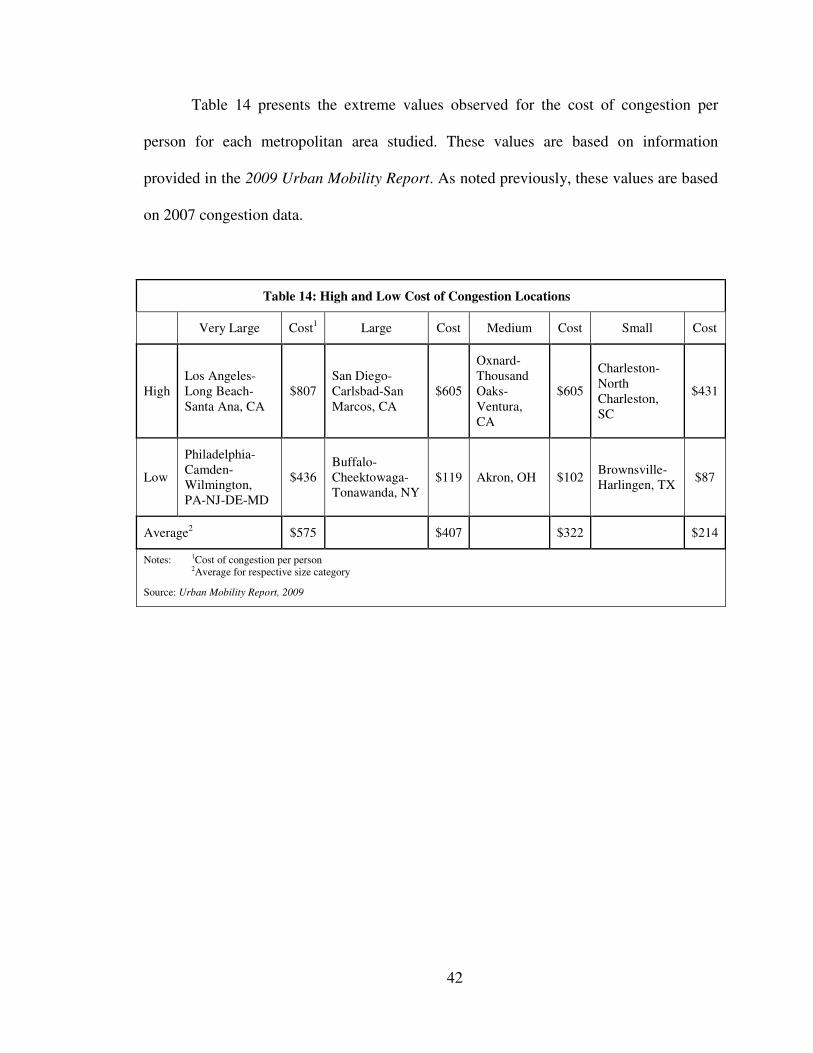
Table 14 presents the extreme values observed for the cost of congestion per
person for each metropolitan area studied. These values are based on information
provided in the 2009 Urban Mobility Report. As noted previously, these values are based
on 2007 congestion data.
Table 14: High and Low Cost of Congestion Locations
Very Large Cost1 Large Cost Medium Cost Small Cost
High Los Angeles-Long Beach-Santa Ana, CA
$807 San Diego-Carlsbad-San Marcos, CA
$605
Oxnard-Thousand Oaks-Ventura, CA
$605
Charleston-North Charleston, SC
$431
Low
Philadelphia-Camden-Wilmington, PA-NJ-DE-MD
$436 Buffalo-Cheektowaga-Tonawanda, NY
$119 Akron, OH $102 Brownsville-Harlingen, TX
$87
Average2 $575 $407 $322 $214
Notes: 1Cost of congestion per person 2Average for respective size category
Source: Urban Mobility Report, 2009

43
Table 15 presents the extreme values observed for the ratio of the cost of crashes
per person to the cost of congestion per person for each metropolitan area observed.
Table 15: High and Low Crash to Congestion Locations
Very Large Ratio1 Large Ratio Medium Ratio Small Ratio
High
Miami-Fort Lauderdale-Miami Beach, FL
3.75 Buffalo-Cheektowaga-Tonawanda, NY
13.94 Akron, OH 14.94 Beaumont-Port Arthur, TX
24.43
Low
Boston-Cambridge-Quincy, MA-NH
1.39 San Jose-Sunnyvale-Santa Clara, CA
1.56
Oxnard-Thousand Oaks-Ventura, CA
2.16 Cape Coral-Fort Myers, FL
4.93
Average2 2.42 3.88 5.51 9.10
Notes: 1Ratio = Cost of crashes per person / Cost of congestion per person 2Average for respective size category
Interestingly, the metropolitan area with the lowest cost of congestion for
medium, large, and very large areas is also the metropolitan area with the highest ratio of
the cost of crashes per person to the cost of congestion per person. This suggests that the
high ratio values are being driven more by the low cost of congestion than the high cost
of safety.
5.3 Cost of Crashes vs Cost of Congestion
The following graphs show the average cost of crashes per person compared to
the average cost of congestion per person. The estimates are based on groups of
metropolitan areas by different population size categories.
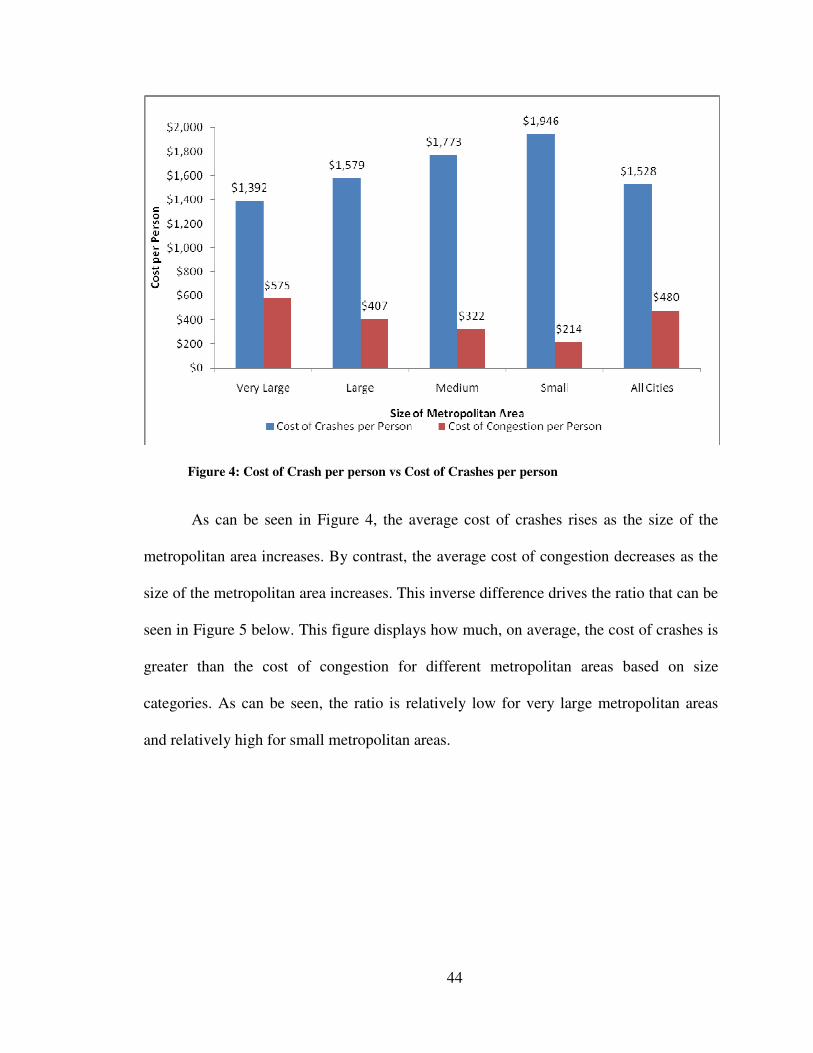
44
Figure 4: Cost of Crash per person vs Cost of Crashes per person
As can be seen in Figure 4, the average cost of crashes rises as the size of the
metropolitan area increases. By contrast, the average cost of congestion decreases as the
size of the metropolitan area increases. This inverse difference drives the ratio that can be
seen in Figure 5 below. This figure displays how much, on average, the cost of crashes is
greater than the cost of congestion for different metropolitan areas based on size
categories. As can be seen, the ratio is relatively low for very large metropolitan areas
and relatively high for small metropolitan areas.
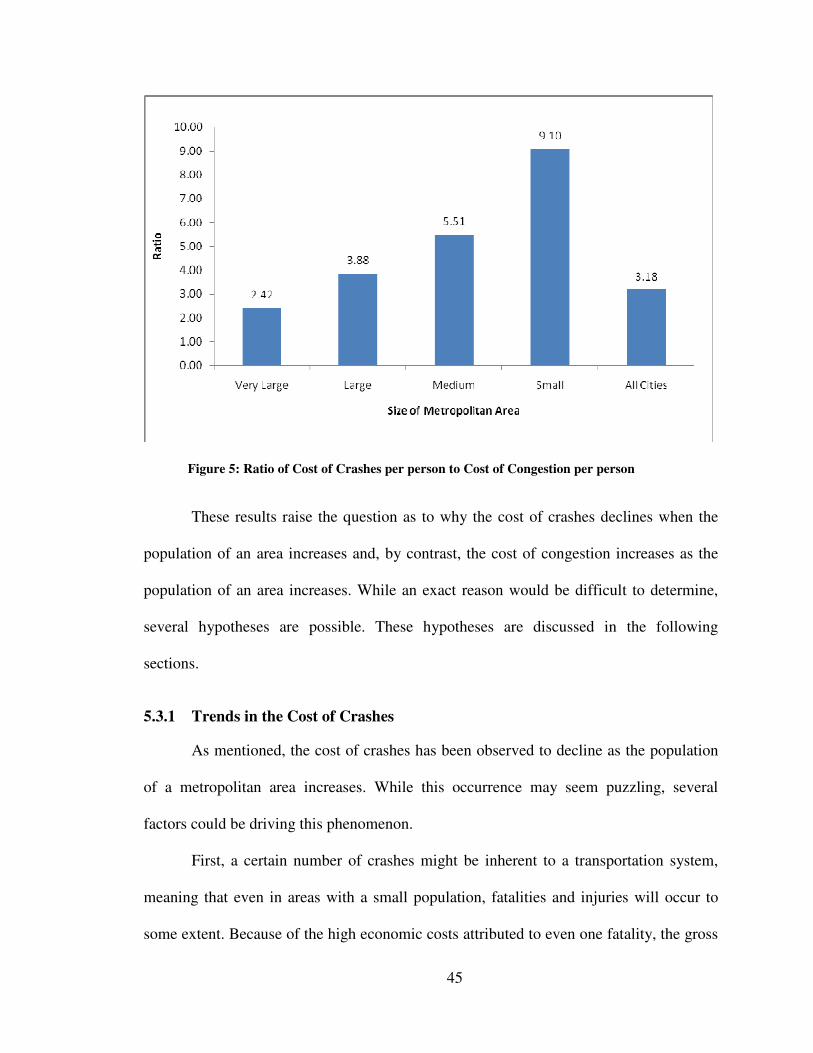
45
Figure 5: Ratio of Cost of Crashes per person to Cost of Congestion per person
These results raise the question as to why the cost of crashes declines when the
population of an area increases and, by contrast, the cost of congestion increases as the
population of an area increases. While an exact reason would be difficult to determine,
several hypotheses are possible. These hypotheses are discussed in the following
sections.
5.3.1 Trends in the Cost of Crashes
As mentioned, the cost of crashes has been observed to decline as the population
of a metropolitan area increases. While this occurrence may seem puzzling, several
factors could be driving this phenomenon.
First, a certain number of crashes might be inherent to a transportation system,
meaning that even in areas with a small population, fatalities and injuries will occur to
some extent. Because of the high economic costs attributed to even one fatality, the gross
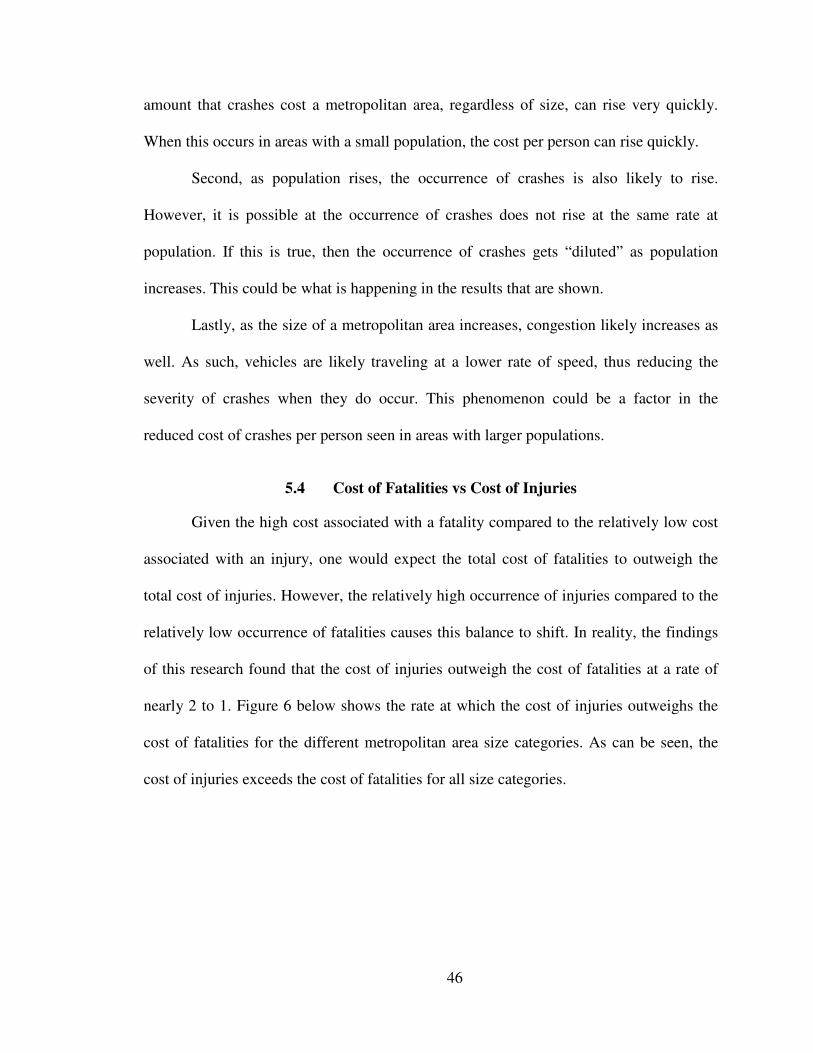
46
amount that crashes cost a metropolitan area, regardless of size, can rise very quickly.
When this occurs in areas with a small population, the cost per person can rise quickly.
Second, as population rises, the occurrence of crashes is also likely to rise.
However, it is possible at the occurrence of crashes does not rise at the same rate at
population. If this is true, then the occurrence of crashes gets “diluted” as population
increases. This could be what is happening in the results that are shown.
Lastly, as the size of a metropolitan area increases, congestion likely increases as
well. As such, vehicles are likely traveling at a lower rate of speed, thus reducing the
severity of crashes when they do occur. This phenomenon could be a factor in the
reduced cost of crashes per person seen in areas with larger populations.
5.4 Cost of Fatalities vs Cost of Injuries
Given the high cost associated with a fatality compared to the relatively low cost
associated with an injury, one would expect the total cost of fatalities to outweigh the
total cost of injuries. However, the relatively high occurrence of injuries compared to the
relatively low occurrence of fatalities causes this balance to shift. In reality, the findings
of this research found that the cost of injuries outweigh the cost of fatalities at a rate of
nearly 2 to 1. Figure 6 below shows the rate at which the cost of injuries outweighs the
cost of fatalities for the different metropolitan area size categories. As can be seen, the
cost of injuries exceeds the cost of fatalities for all size categories.
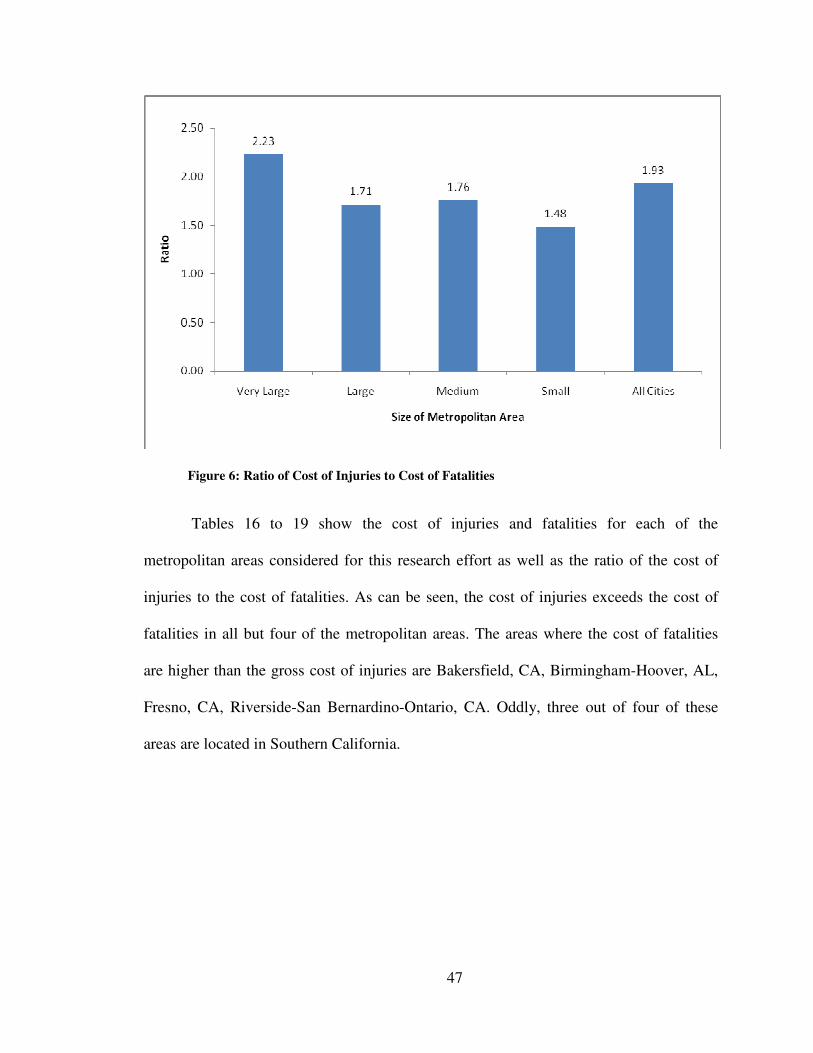
47
Figure 6: Ratio of Cost of Injuries to Cost of Fatalities
Tables 16 to 19 show the cost of injuries and fatalities for each of the
metropolitan areas considered for this research effort as well as the ratio of the cost of
injuries to the cost of fatalities. As can be seen, the cost of injuries exceeds the cost of
fatalities in all but four of the metropolitan areas. The areas where the cost of fatalities
are higher than the gross cost of injuries are Bakersfield, CA, Birmingham-Hoover, AL,
Fresno, CA, Riverside-San Bernardino-Ontario, CA. Oddly, three out of four of these
areas are located in Southern California.
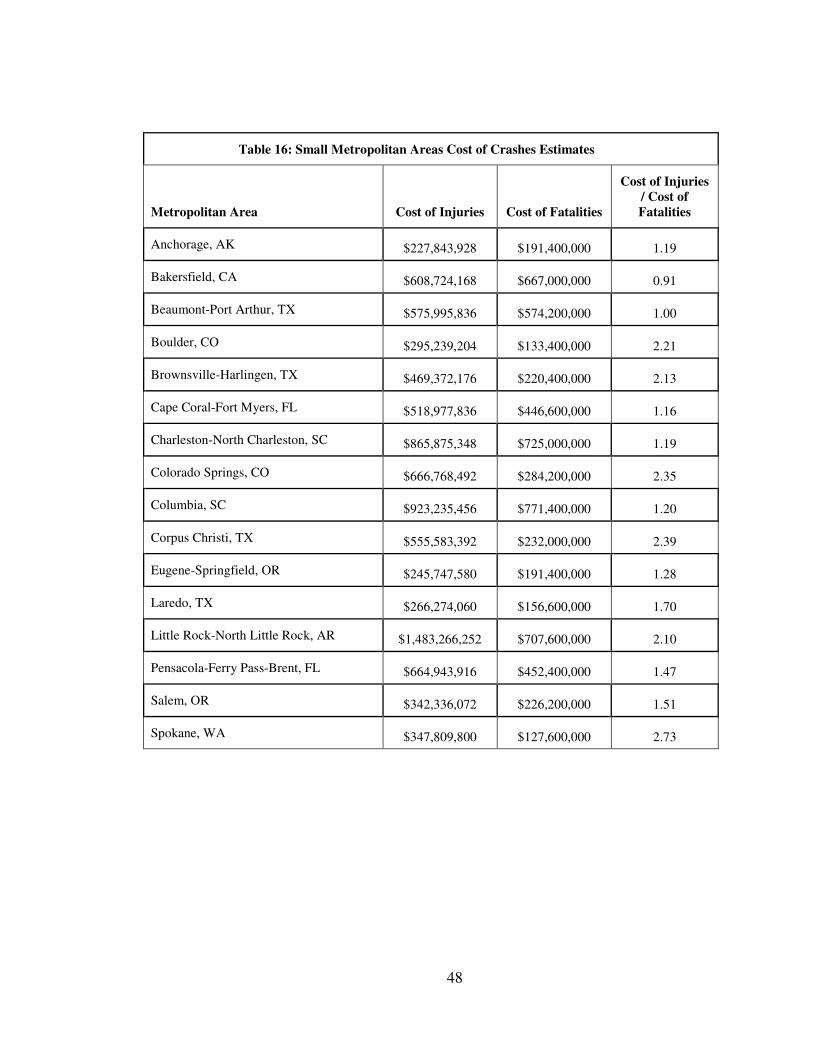
48
Table 16: Small Metropolitan Areas Cost of Crashes Estimates
Metropolitan Area Cost of Injuries
Cost of Fatalities
Cost of Injuries
/ Cost of
Fatalities
Anchorage, AK $227,843,928 $191,400,000 1.19
Bakersfield, CA $608,724,168 $667,000,000 0.91
Beaumont-Port Arthur, TX $575,995,836 $574,200,000 1.00
Boulder, CO $295,239,204 $133,400,000 2.21
Brownsville-Harlingen, TX $469,372,176 $220,400,000 2.13
Cape Coral-Fort Myers, FL $518,977,836 $446,600,000 1.16
Charleston-North Charleston, SC $865,875,348 $725,000,000 1.19
Colorado Springs, CO $666,768,492 $284,200,000 2.35
Columbia, SC $923,235,456 $771,400,000 1.20
Corpus Christi, TX $555,583,392 $232,000,000 2.39
Eugene-Springfield, OR $245,747,580 $191,400,000 1.28
Laredo, TX $266,274,060 $156,600,000 1.70
Little Rock-North Little Rock, AR $1,483,266,252 $707,600,000 2.10
Pensacola-Ferry Pass-Brent, FL $664,943,916 $452,400,000 1.47
Salem, OR $342,336,072 $226,200,000 1.51
Spokane, WA $347,809,800 $127,600,000 2.73
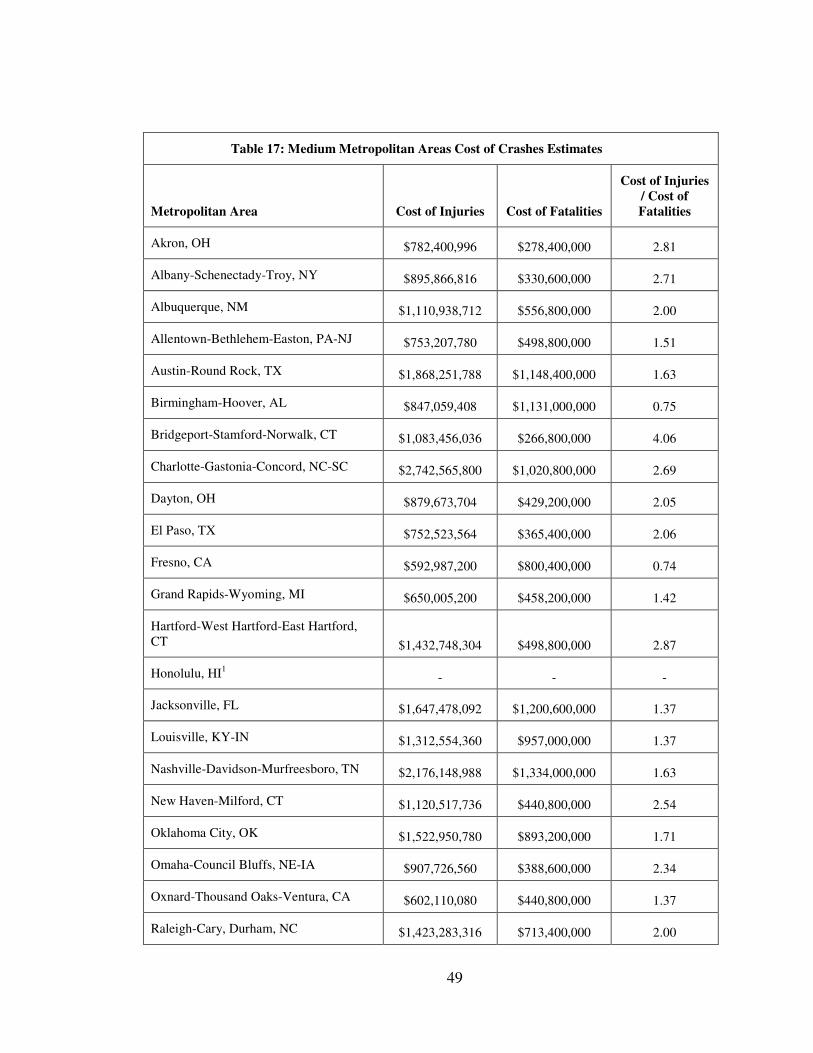
49
Table 17: Medium Metropolitan Areas Cost of Crashes Estimates
Metropolitan Area Cost of Injuries
Cost of Fatalities
Cost of Injuries
/ Cost of
Fatalities
Akron, OH $782,400,996 $278,400,000 2.81
Albany-Schenectady-Troy, NY $895,866,816 $330,600,000 2.71
Albuquerque, NM $1,110,938,712 $556,800,000 2.00
Allentown-Bethlehem-Easton, PA-NJ $753,207,780 $498,800,000 1.51
Austin-Round Rock, TX $1,868,251,788 $1,148,400,000 1.63
Birmingham-Hoover, AL $847,059,408 $1,131,000,000 0.75
Bridgeport-Stamford-Norwalk, CT $1,083,456,036 $266,800,000 4.06
Charlotte-Gastonia-Concord, NC-SC $2,742,565,800 $1,020,800,000 2.69
Dayton, OH $879,673,704 $429,200,000 2.05
El Paso, TX $752,523,564 $365,400,000 2.06
Fresno, CA $592,987,200 $800,400,000 0.74
Grand Rapids-Wyoming, MI $650,005,200 $458,200,000 1.42
Hartford-West Hartford-East Hartford, CT $1,432,748,304 $498,800,000 2.87
Honolulu, HI1 - - -
Jacksonville, FL $1,647,478,092 $1,200,600,000 1.37
Louisville, KY-IN $1,312,554,360 $957,000,000 1.37
Nashville-Davidson-Murfreesboro, TN $2,176,148,988 $1,334,000,000 1.63
New Haven-Milford, CT $1,120,517,736 $440,800,000 2.54
Oklahoma City, OK $1,522,950,780 $893,200,000 1.71
Omaha-Council Bluffs, NE-IA $907,726,560 $388,600,000 2.34
Oxnard-Thousand Oaks-Ventura, CA $602,110,080 $440,800,000 1.37
Raleigh-Cary, Durham, NC $1,423,283,316 $713,400,000 2.00
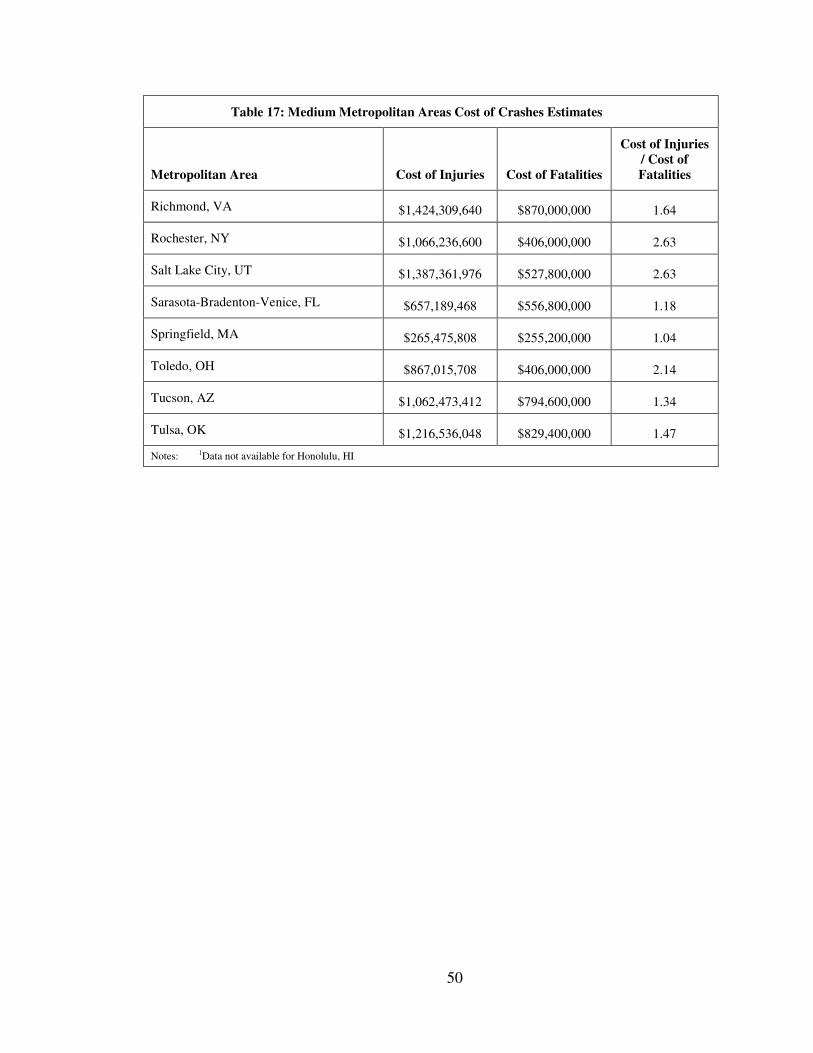
50
Table 17: Medium Metropolitan Areas Cost of Crashes Estimates
Metropolitan Area Cost of Injuries
Cost of Fatalities
Cost of Injuries
/ Cost of
Fatalities
Richmond, VA $1,424,309,640 $870,000,000 1.64
Rochester, NY $1,066,236,600 $406,000,000 2.63
Salt Lake City, UT $1,387,361,976 $527,800,000 2.63
Sarasota-Bradenton-Venice, FL $657,189,468 $556,800,000 1.18
Springfield, MA $265,475,808 $255,200,000 1.04
Toledo, OH $867,015,708 $406,000,000 2.14
Tucson, AZ $1,062,473,412 $794,600,000 1.34
Tulsa, OK $1,216,536,048 $829,400,000 1.47
Notes: 1Data not available for Honolulu, HI
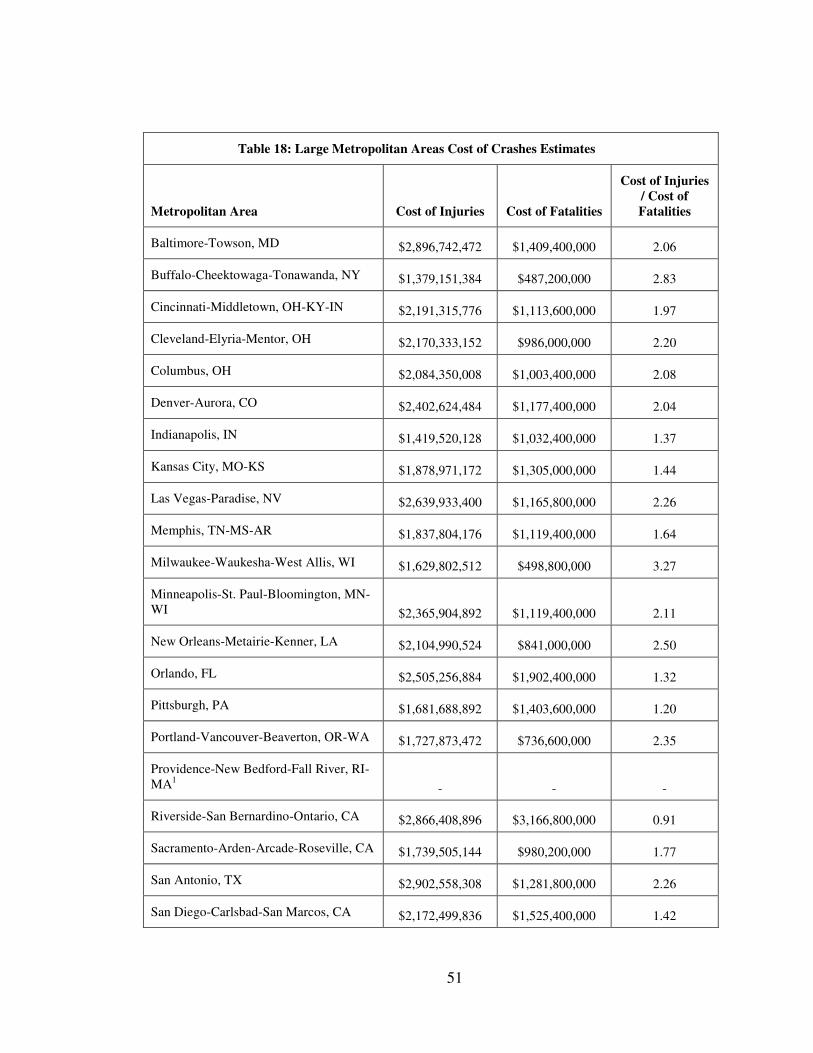
51
Table 18: Large Metropolitan Areas Cost of Crashes Estimates
Metropolitan Area Cost of Injuries
Cost of Fatalities
Cost of Injuries
/ Cost of
Fatalities
Baltimore-Towson, MD $2,896,742,472 $1,409,400,000 2.06
Buffalo-Cheektowaga-Tonawanda, NY $1,379,151,384 $487,200,000 2.83
Cincinnati-Middletown, OH-KY-IN $2,191,315,776 $1,113,600,000 1.97
Cleveland-Elyria-Mentor, OH $2,170,333,152 $986,000,000 2.20
Columbus, OH $2,084,350,008 $1,003,400,000 2.08
Denver-Aurora, CO $2,402,624,484 $1,177,400,000 2.04
Indianapolis, IN $1,419,520,128 $1,032,400,000 1.37
Kansas City, MO-KS $1,878,971,172 $1,305,000,000 1.44
Las Vegas-Paradise, NV $2,639,933,400 $1,165,800,000 2.26
Memphis, TN-MS-AR $1,837,804,176 $1,119,400,000 1.64
Milwaukee-Waukesha-West Allis, WI $1,629,802,512 $498,800,000 3.27
Minneapolis-St. Paul-Bloomington, MN-WI $2,365,904,892 $1,119,400,000 2.11
New Orleans-Metairie-Kenner, LA $2,104,990,524 $841,000,000 2.50
Orlando, FL $2,505,256,884 $1,902,400,000 1.32
Pittsburgh, PA $1,681,688,892 $1,403,600,000 1.20
Portland-Vancouver-Beaverton, OR-WA $1,727,873,472 $736,600,000 2.35
Providence-New Bedford-Fall River, RI-MA1 - - -
Riverside-San Bernardino-Ontario, CA $2,866,408,896 $3,166,800,000 0.91
Sacramento-Arden-Arcade-Roseville, CA $1,739,505,144 $980,200,000 1.77
San Antonio, TX $2,902,558,308 $1,281,800,000 2.26
San Diego-Carlsbad-San Marcos, CA $2,172,499,836 $1,525,400,000 1.42
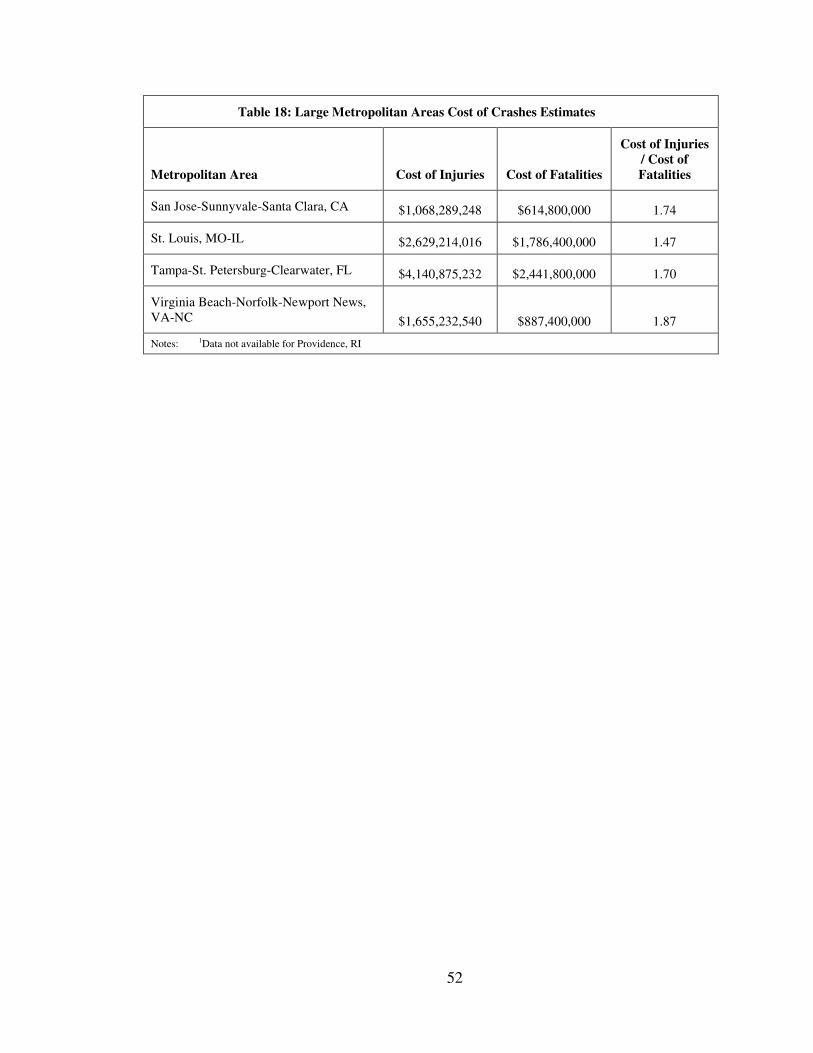
52
Table 18: Large Metropolitan Areas Cost of Crashes Estimates
Metropolitan Area Cost of Injuries
Cost of Fatalities
Cost of Injuries
/ Cost of
Fatalities
San Jose-Sunnyvale-Santa Clara, CA $1,068,289,248 $614,800,000 1.74
St. Louis, MO-IL $2,629,214,016 $1,786,400,000 1.47
Tampa-St. Petersburg-Clearwater, FL $4,140,875,232 $2,441,800,000 1.70
Virginia Beach-Norfolk-Newport News, VA-NC $1,655,232,540 $887,400,000 1.87
Notes: 1Data not available for Providence, RI
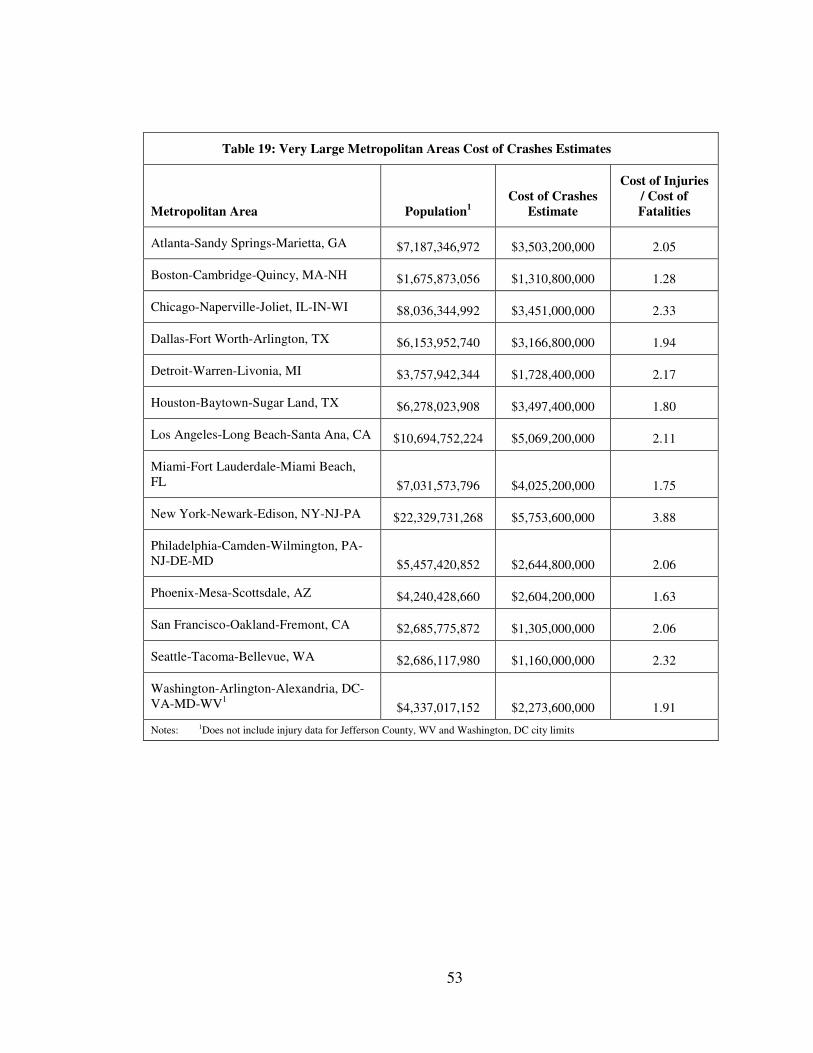
53
Table 19: Very Large Metropolitan Areas Cost of Crashes Estimates
Metropolitan Area Population1
Cost of Crashes
Estimate
Cost of Injuries
/ Cost of
Fatalities
Atlanta-Sandy Springs-Marietta, GA $7,187,346,972 $3,503,200,000 2.05
Boston-Cambridge-Quincy, MA-NH $1,675,873,056 $1,310,800,000 1.28
Chicago-Naperville-Joliet, IL-IN-WI $8,036,344,992 $3,451,000,000 2.33
Dallas-Fort Worth-Arlington, TX $6,153,952,740 $3,166,800,000 1.94
Detroit-Warren-Livonia, MI $3,757,942,344 $1,728,400,000 2.17
Houston-Baytown-Sugar Land, TX $6,278,023,908 $3,497,400,000 1.80
Los Angeles-Long Beach-Santa Ana, CA $10,694,752,224 $5,069,200,000 2.11
Miami-Fort Lauderdale-Miami Beach, FL $7,031,573,796 $4,025,200,000 1.75
New York-Newark-Edison, NY-NJ-PA $22,329,731,268 $5,753,600,000 3.88
Philadelphia-Camden-Wilmington, PA-NJ-DE-MD $5,457,420,852 $2,644,800,000 2.06
Phoenix-Mesa-Scottsdale, AZ $4,240,428,660 $2,604,200,000 1.63
San Francisco-Oakland-Fremont, CA $2,685,775,872 $1,305,000,000 2.06
Seattle-Tacoma-Bellevue, WA $2,686,117,980 $1,160,000,000 2.32
Washington-Arlington-Alexandria, DC-VA-MD-WV1 $4,337,017,152 $2,273,600,000 1.91
Notes: 1Does not include injury data for Jefferson County, WV and Washington, DC city limits
54
5.5 Updated Cost of Crash Estimates vs Previous Cost of Crash Estimates
The economic cost figures for this research, as has been noted, are based on an
updated methodology and cost estimates provided by the FWHA. As such, it is difficult
to compare how the cost estimates for different metropolitan areas, or the country as a
whole, have changed since the publishing of the original report in 2008.
First, to assess the magnitude of how the changing economic estimates, such as
the VSL, affect the overall cost estimates, the following graphs have been prepared.
Figure 7 shows the cost of crashes per person for 2008 crash data, but based on the
economic cost estimates for fatalities and injuries used in the previous study. The
previous cost estimates have been adjusted based on estimated growth in the United
States Gross Domestic Product (GDP). The cost of a fatality and injury, based on the
GDP adjustment, were assumed to be $3.48 million and $73,146, respectively.
For comparison purposes, the cost of crashes per person for 2008 crash data based
on the updated VSL estimates has also been included in this section in Figure 8. As can
be seen by the two figures, the updated VSL has a significant effect on the resultant cost
per person estimates. This is due to the assume VSL rising from $3.25 million in the
previous study to $5.8 million for this study. In addition, the cost of injuries rose from
$68,170 to $114,036 based on the updated VSL and methodology for estimating the cost
of an injury discussed in the methodology section of this document.
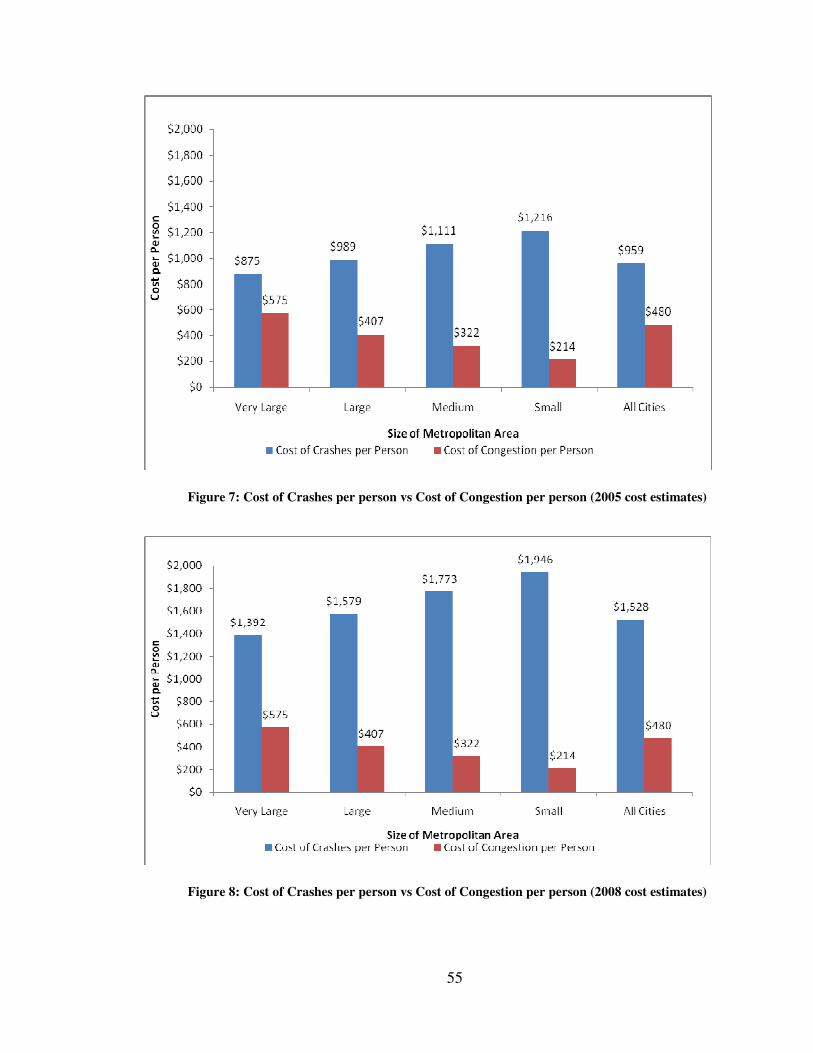
55
Figure 7: Cost of Crashes per person vs Cost of Congestion per person (2005 cost estimates)
Figure 8: Cost of Crashes per person vs Cost of Congestion per person (2008 cost estimates)
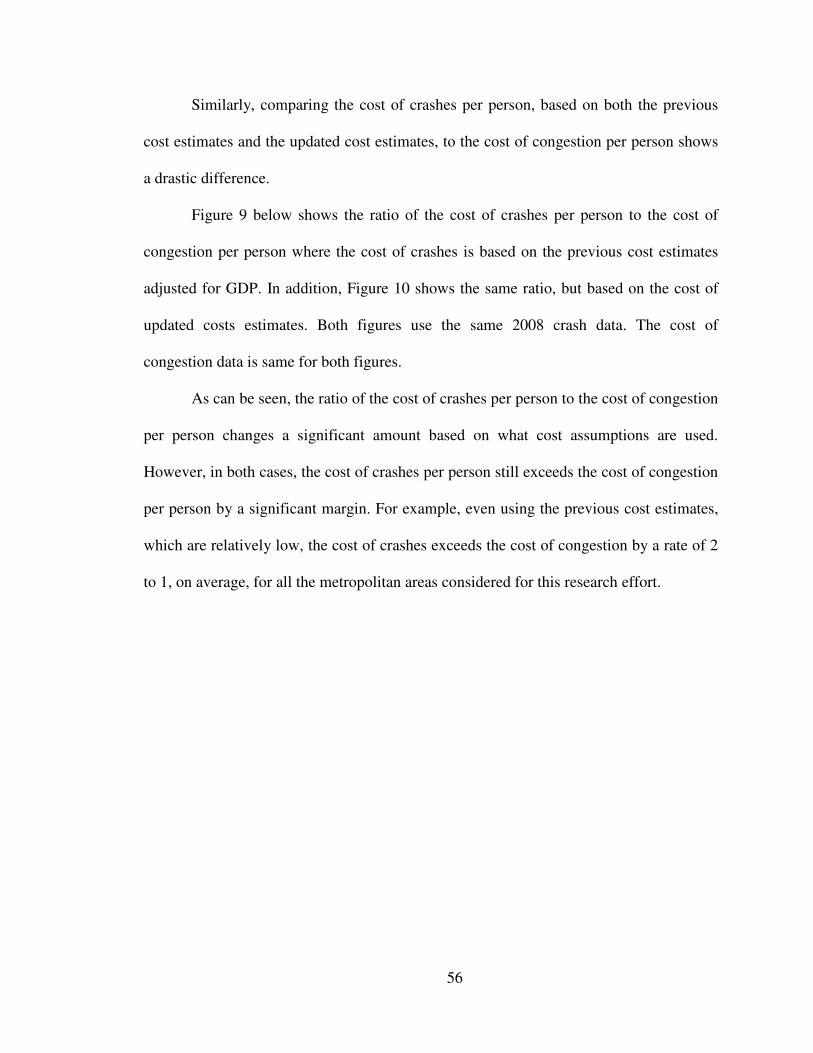
56
Similarly, comparing the cost of crashes per person, based on both the previous
cost estimates and the updated cost estimates, to the cost of congestion per person shows
a drastic difference.
Figure 9 below shows the ratio of the cost of crashes per person to the cost of
congestion per person where the cost of crashes is based on the previous cost estimates
adjusted for GDP. In addition, Figure 10 shows the same ratio, but based on the cost of
updated costs estimates. Both figures use the same 2008 crash data. The cost of
congestion data is same for both figures.
As can be seen, the ratio of the cost of crashes per person to the cost of congestion
per person changes a significant amount based on what cost assumptions are used.
However, in both cases, the cost of crashes per person still exceeds the cost of congestion
per person by a significant margin. For example, even using the previous cost estimates,
which are relatively low, the cost of crashes exceeds the cost of congestion by a rate of 2
to 1, on average, for all the metropolitan areas considered for this research effort.
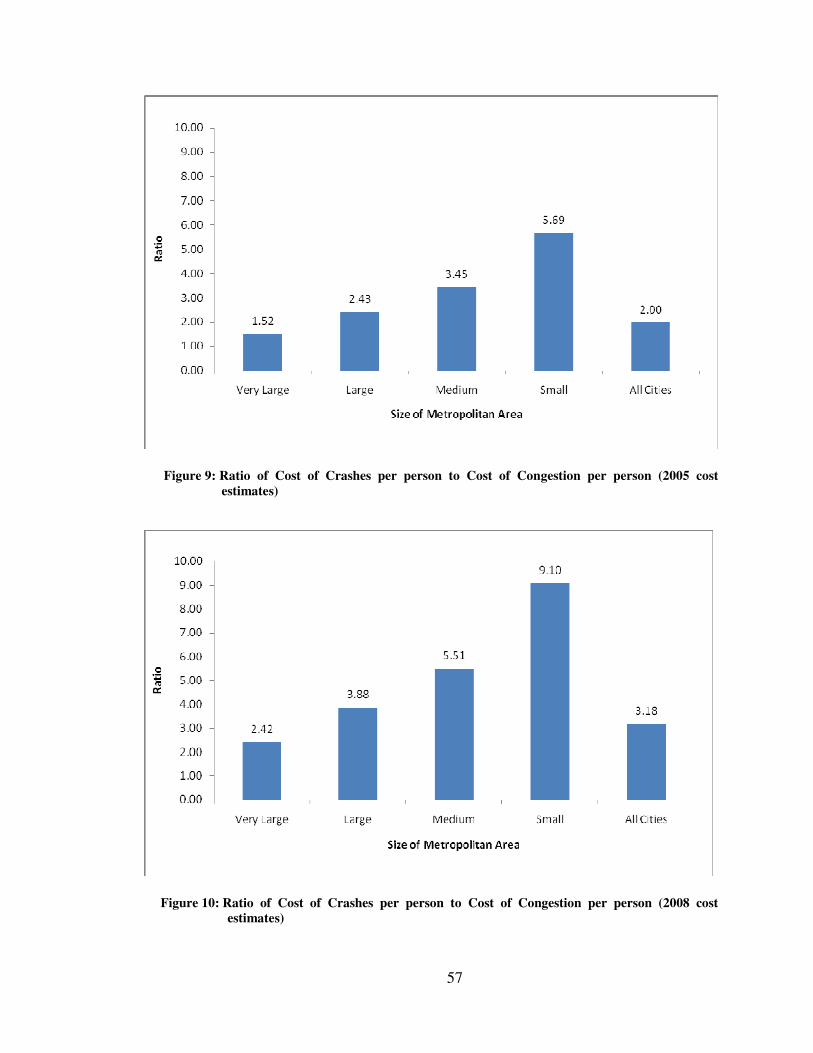
57
Figure 9: Ratio of Cost of Crashes per person to Cost of Congestion per person (2005 cost
estimates)
Figure 10: Ratio of Cost of Crashes per person to Cost of Congestion per person (2008 cost
estimates)
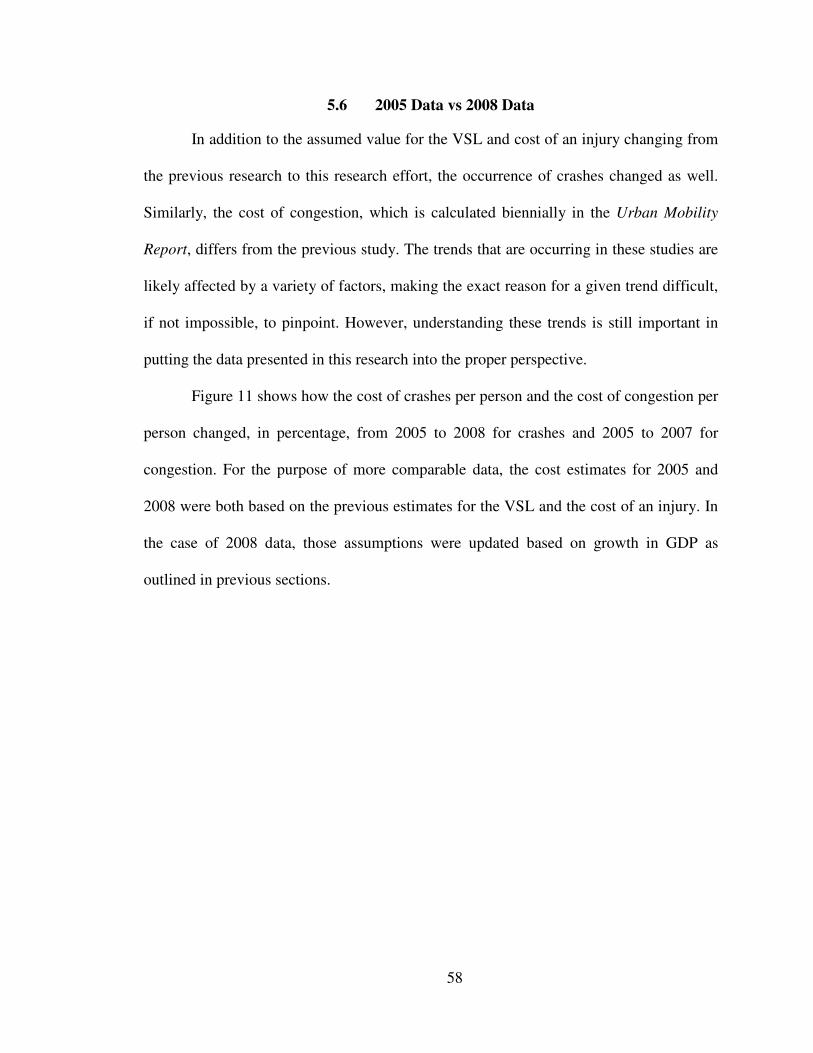
58
5.6 2005 Data vs 2008 Data
In addition to the assumed value for the VSL and cost of an injury changing from
the previous research to this research effort, the occurrence of crashes changed as well.
Similarly, the cost of congestion, which is calculated biennially in the Urban Mobility
Report, differs from the previous study. The trends that are occurring in these studies are
likely affected by a variety of factors, making the exact reason for a given trend difficult,
if not impossible, to pinpoint. However, understanding these trends is still important in
putting the data presented in this research into the proper perspective.
Figure 11 shows how the cost of crashes per person and the cost of congestion per
person changed, in percentage, from 2005 to 2008 for crashes and 2005 to 2007 for
congestion. For the purpose of more comparable data, the cost estimates for 2005 and
2008 were both based on the previous estimates for the VSL and the cost of an injury. In
the case of 2008 data, those assumptions were updated based on growth in GDP as
outlined in previous sections.
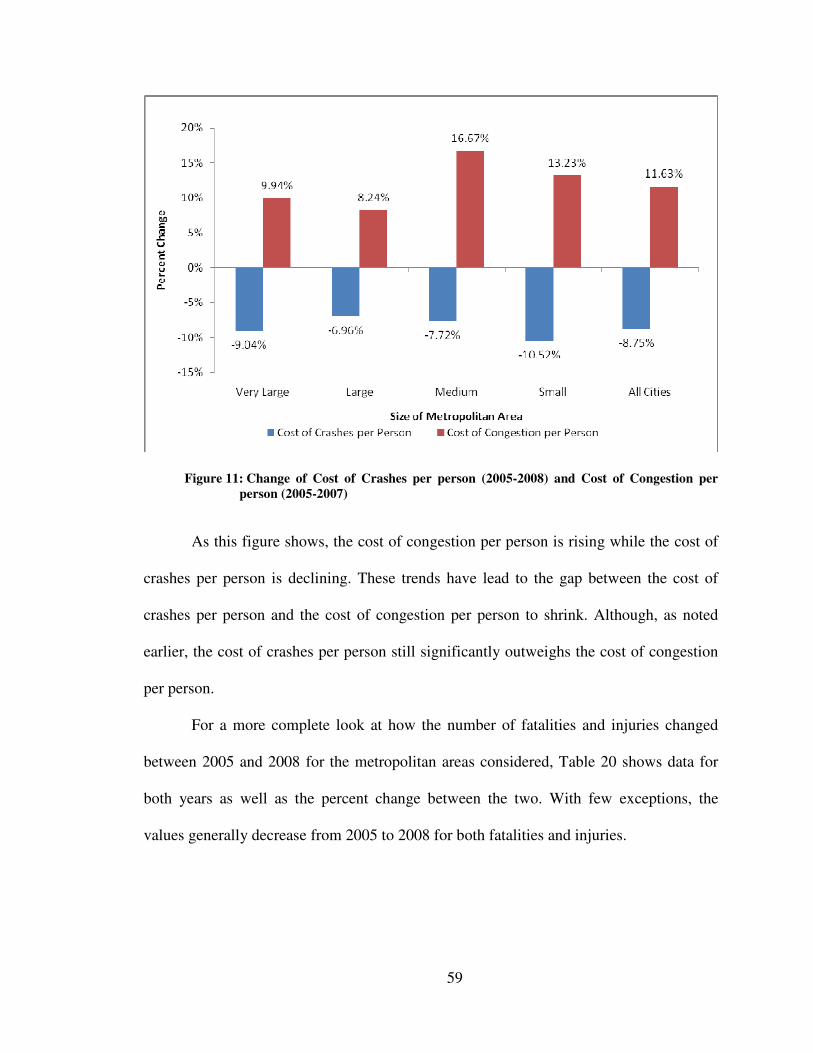
59
Figure 11: Change of Cost of Crashes per person (2005-2008) and Cost of Congestion per
person (2005-2007)
As this figure shows, the cost of congestion per person is rising while the cost of
crashes per person is declining. These trends have lead to the gap between the cost of
crashes per person and the cost of congestion per person to shrink. Although, as noted
earlier, the cost of crashes per person still significantly outweighs the cost of congestion
per person.
For a more complete look at how the number of fatalities and injuries changed
between 2005 and 2008 for the metropolitan areas considered, Table 20 shows data for
both years as well as the percent change between the two. With few exceptions, the
values generally decrease from 2005 to 2008 for both fatalities and injuries.
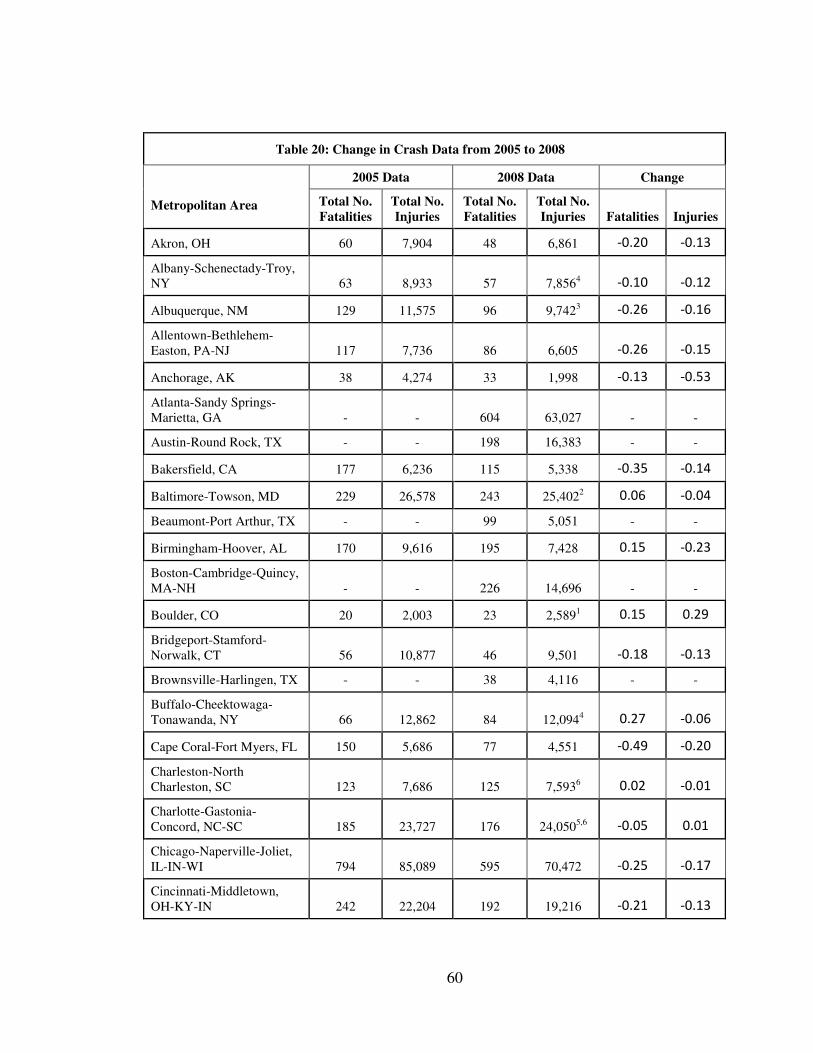
60
Table 20: Change in Crash Data from 2005 to 2008
Metropolitan Area
2005 Data 2008 Data Change
Total No.
Fatalities
Total No.
Injuries
Total No.
Fatalities
Total No.
Injuries Fatalities Injuries
Akron, OH 60 7,904 48 6,861 -0.20 -0.13
Albany-Schenectady-Troy, NY 63 8,933 57 7,8564 -0.10 -0.12
Albuquerque, NM 129 11,575 96 9,7423 -0.26 -0.16
Allentown-Bethlehem-Easton, PA-NJ 117 7,736 86 6,605 -0.26 -0.15
Anchorage, AK 38 4,274 33 1,998 -0.13 -0.53
Atlanta-Sandy Springs-Marietta, GA - - 604 63,027 - -
Austin-Round Rock, TX - - 198 16,383 - -
Bakersfield, CA 177 6,236 115 5,338 -0.35 -0.14
Baltimore-Towson, MD 229 26,578 243 25,4022 0.06 -0.04
Beaumont-Port Arthur, TX - - 99 5,051 - -
Birmingham-Hoover, AL 170 9,616 195 7,428 0.15 -0.23
Boston-Cambridge-Quincy, MA-NH - - 226 14,696 - -
Boulder, CO 20 2,003 23 2,5891 0.15 0.29
Bridgeport-Stamford-Norwalk, CT 56 10,877 46 9,501 -0.18 -0.13
Brownsville-Harlingen, TX - - 38 4,116 - -
Buffalo-Cheektowaga-Tonawanda, NY 66 12,862 84 12,0944 0.27 -0.06
Cape Coral-Fort Myers, FL 150 5,686 77 4,551 -0.49 -0.20
Charleston-North Charleston, SC 123 7,686 125 7,5936 0.02 -0.01
Charlotte-Gastonia-Concord, NC-SC 185 23,727 176 24,0505,6 -0.05 0.01
Chicago-Naperville-Joliet, IL-IN-WI 794 85,089 595 70,472 -0.25 -0.17
Cincinnati-Middletown, OH-KY-IN 242 22,204 192 19,216 -0.21 -0.13
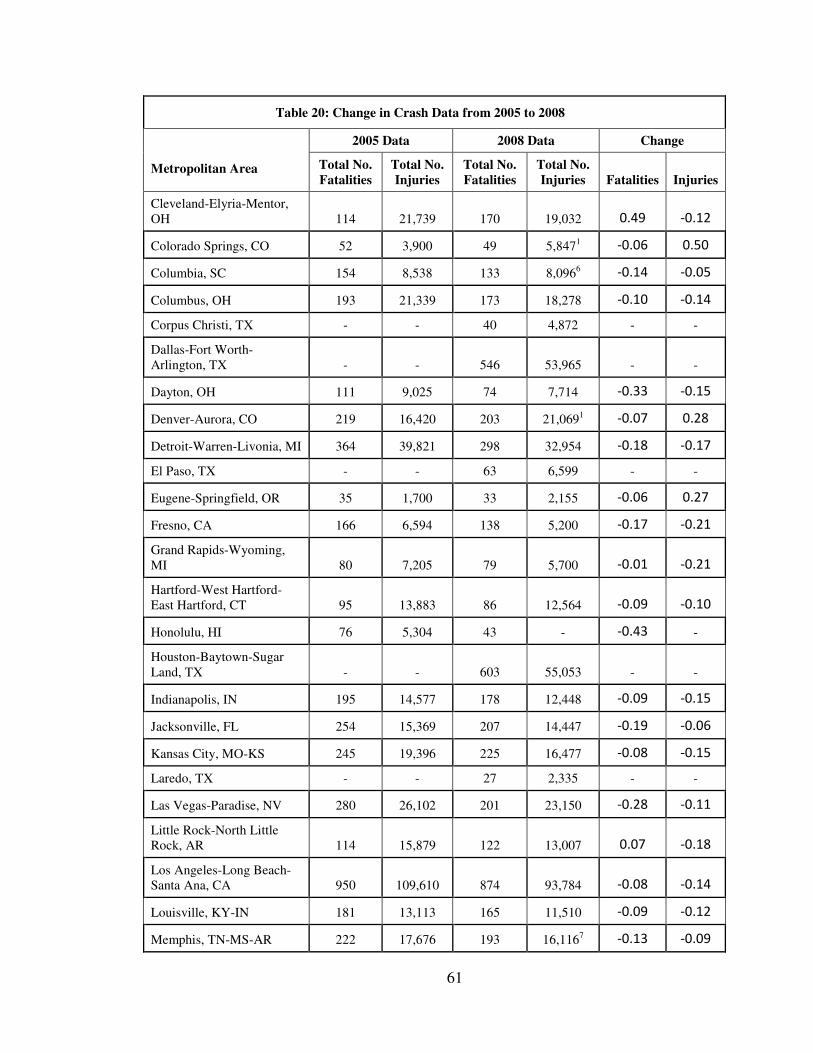
61
Table 20: Change in Crash Data from 2005 to 2008
Metropolitan Area
2005 Data 2008 Data Change
Total No.
Fatalities
Total No.
Injuries
Total No.
Fatalities
Total No.
Injuries Fatalities Injuries
Cleveland-Elyria-Mentor, OH 114 21,739 170 19,032 0.49 -0.12
Colorado Springs, CO 52 3,900 49 5,8471 -0.06 0.50
Columbia, SC 154 8,538 133 8,0966 -0.14 -0.05
Columbus, OH 193 21,339 173 18,278 -0.10 -0.14
Corpus Christi, TX - - 40 4,872 - -
Dallas-Fort Worth-Arlington, TX - - 546 53,965 - -
Dayton, OH 111 9,025 74 7,714 -0.33 -0.15
Denver-Aurora, CO 219 16,420 203 21,0691 -0.07 0.28
Detroit-Warren-Livonia, MI 364 39,821 298 32,954 -0.18 -0.17
El Paso, TX - - 63 6,599 - -
Eugene-Springfield, OR 35 1,700 33 2,155 -0.06 0.27
Fresno, CA 166 6,594 138 5,200 -0.17 -0.21
Grand Rapids-Wyoming, MI 80 7,205 79 5,700 -0.01 -0.21
Hartford-West Hartford-East Hartford, CT 95 13,883 86 12,564 -0.09 -0.10
Honolulu, HI 76 5,304 43 - -0.43 -
Houston-Baytown-Sugar Land, TX - - 603 55,053 - -
Indianapolis, IN 195 14,577 178 12,448 -0.09 -0.15
Jacksonville, FL 254 15,369 207 14,447 -0.19 -0.06
Kansas City, MO-KS 245 19,396 225 16,477 -0.08 -0.15
Laredo, TX - - 27 2,335 - -
Las Vegas-Paradise, NV 280 26,102 201 23,150 -0.28 -0.11
Little Rock-North Little Rock, AR 114 15,879 122 13,007 0.07 -0.18
Los Angeles-Long Beach-Santa Ana, CA 950 109,610 874 93,784 -0.08 -0.14
Louisville, KY-IN 181 13,113 165 11,510 -0.09 -0.12
Memphis, TN-MS-AR 222 17,676 193 16,1167 -0.13 -0.09
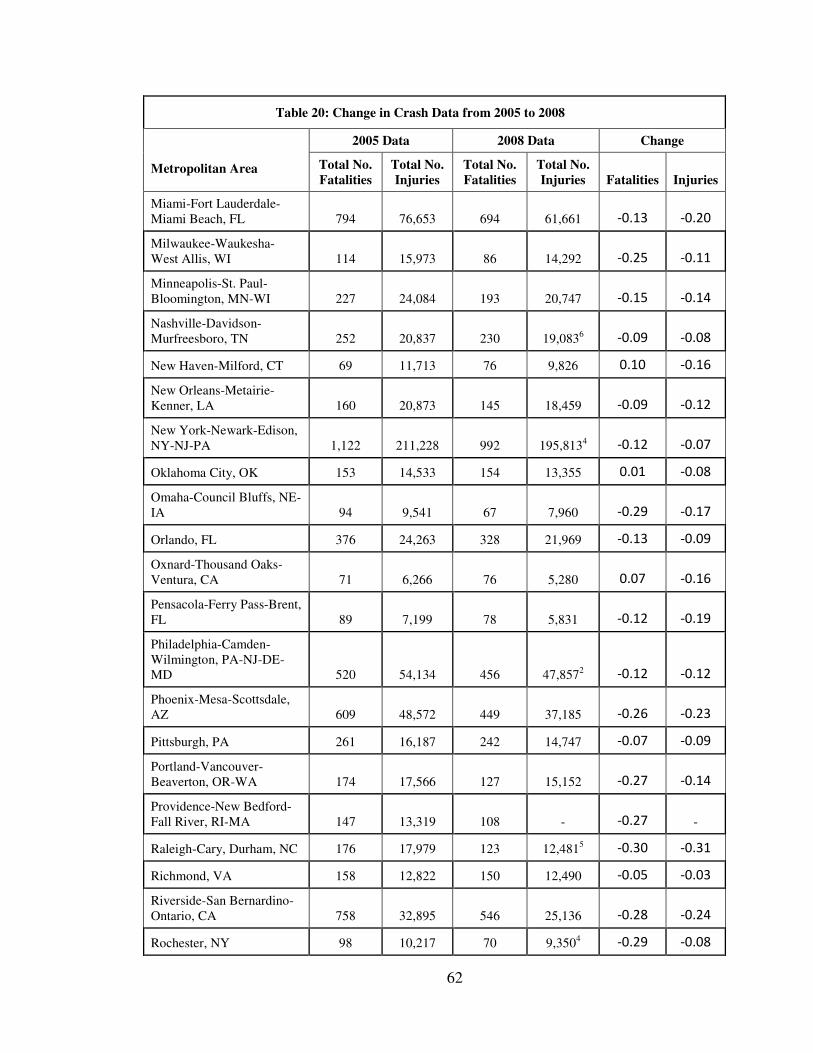
62
Table 20: Change in Crash Data from 2005 to 2008
Metropolitan Area
2005 Data 2008 Data Change
Total No.
Fatalities
Total No.
Injuries
Total No.
Fatalities
Total No.
Injuries Fatalities Injuries
Miami-Fort Lauderdale-Miami Beach, FL 794 76,653 694 61,661 -0.13 -0.20
Milwaukee-Waukesha-West Allis, WI 114 15,973 86 14,292 -0.25 -0.11
Minneapolis-St. Paul-Bloomington, MN-WI 227 24,084 193 20,747 -0.15 -0.14
Nashville-Davidson-Murfreesboro, TN 252 20,837 230 19,0836 -0.09 -0.08
New Haven-Milford, CT 69 11,713 76 9,826 0.10 -0.16
New Orleans-Metairie-Kenner, LA 160 20,873 145 18,459 -0.09 -0.12
New York-Newark-Edison, NY-NJ-PA 1,122 211,228 992 195,8134 -0.12 -0.07
Oklahoma City, OK 153 14,533 154 13,355 0.01 -0.08
Omaha-Council Bluffs, NE-IA 94 9,541 67 7,960 -0.29 -0.17
Orlando, FL 376 24,263 328 21,969 -0.13 -0.09
Oxnard-Thousand Oaks-Ventura, CA 71 6,266 76 5,280 0.07 -0.16
Pensacola-Ferry Pass-Brent, FL 89 7,199 78 5,831 -0.12 -0.19
Philadelphia-Camden-Wilmington, PA-NJ-DE-MD 520 54,134 456 47,8572 -0.12 -0.12
Phoenix-Mesa-Scottsdale, AZ 609 48,572 449 37,185 -0.26 -0.23
Pittsburgh, PA 261 16,187 242 14,747 -0.07 -0.09
Portland-Vancouver-Beaverton, OR-WA 174 17,566 127 15,152 -0.27 -0.14
Providence-New Bedford-Fall River, RI-MA 147 13,319 108 - -0.27 -
Raleigh-Cary, Durham, NC 176 17,979 123 12,4815 -0.30 -0.31
Richmond, VA 158 12,822 150 12,490 -0.05 -0.03
Riverside-San Bernardino-Ontario, CA 758 32,895 546 25,136 -0.28 -0.24
Rochester, NY 98 10,217 70 9,3504 -0.29 -0.08
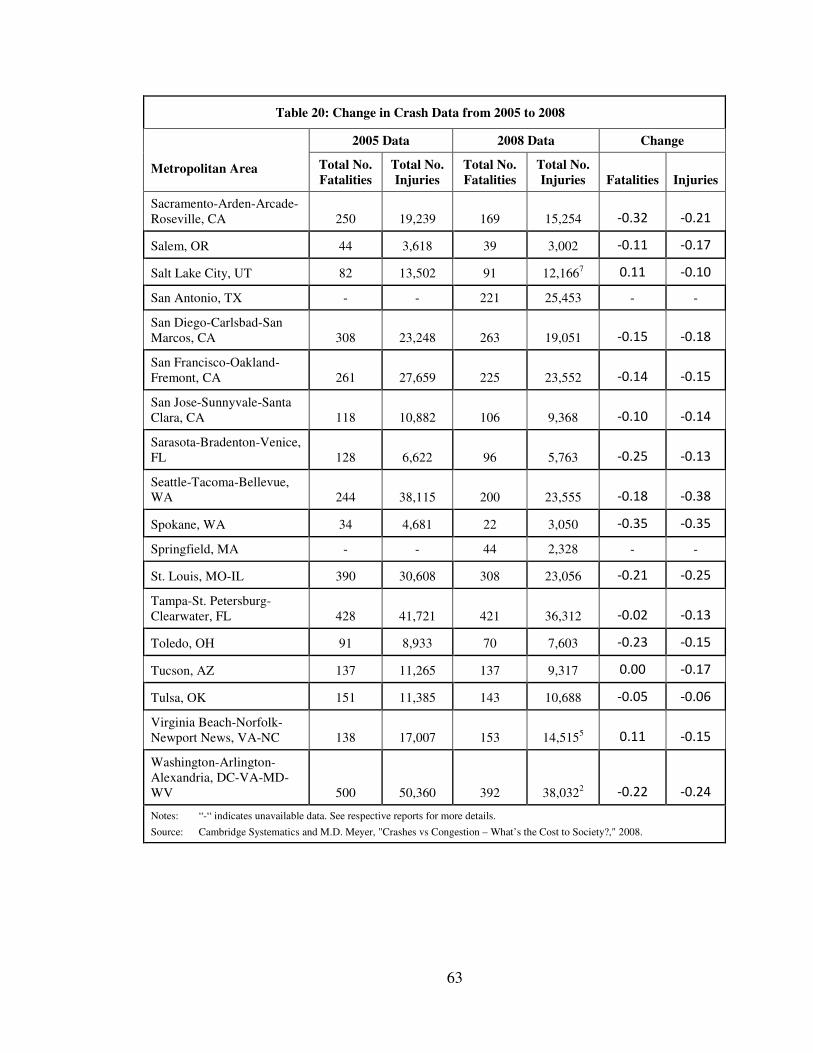
63
Table 20: Change in Crash Data from 2005 to 2008
Metropolitan Area
2005 Data 2008 Data Change
Total No.
Fatalities
Total No.
Injuries
Total No.
Fatalities
Total No.
Injuries Fatalities Injuries
Sacramento-Arden-Arcade-Roseville, CA 250 19,239 169 15,254 -0.32 -0.21
Salem, OR 44 3,618 39 3,002 -0.11 -0.17
Salt Lake City, UT 82 13,502 91 12,1667 0.11 -0.10
San Antonio, TX - - 221 25,453 - -
San Diego-Carlsbad-San Marcos, CA 308 23,248 263 19,051 -0.15 -0.18
San Francisco-Oakland-Fremont, CA 261 27,659 225 23,552 -0.14 -0.15
San Jose-Sunnyvale-Santa Clara, CA 118 10,882 106 9,368 -0.10 -0.14
Sarasota-Bradenton-Venice, FL 128 6,622 96 5,763 -0.25 -0.13
Seattle-Tacoma-Bellevue, WA 244 38,115 200 23,555 -0.18 -0.38
Spokane, WA 34 4,681 22 3,050 -0.35 -0.35
Springfield, MA - - 44 2,328 - -
St. Louis, MO-IL 390 30,608 308 23,056 -0.21 -0.25
Tampa-St. Petersburg-Clearwater, FL 428 41,721 421 36,312 -0.02 -0.13
Toledo, OH 91 8,933 70 7,603 -0.23 -0.15
Tucson, AZ 137 11,265 137 9,317 0.00 -0.17
Tulsa, OK 151 11,385 143 10,688 -0.05 -0.06
Virginia Beach-Norfolk-Newport News, VA-NC 138 17,007 153 14,5155 0.11 -0.15
Washington-Arlington-Alexandria, DC-VA-MD-WV 500 50,360 392 38,0322 -0.22 -0.24
Notes: “-“ indicates unavailable data. See respective reports for more details.
Source: Cambridge Systematics and M.D. Meyer, "Crashes vs Congestion – What’s the Cost to Society?," 2008.
64
CHAPTER 6
SAFETY IN PLANNING
The chapter summarizes key literature on the linkage between safety and long-
range transportation planning. An analysis of a possible link between incorporating safety
into transportation planning and the economic costs of traffic crashes developed for this
research is also included.
6.1 Literature on Safety in Transportation Planning
This section outlines the literature on safety and transportation planning.
6.1.1 NCHRP Report on Transportation Planning and Safety
The National Cooperative Highway Research Program (NCHRP) recently
published a report that focused on integrating transportation safety into long-range
planning. The document, entitled Incorporating Safety into Long-Range Transportation
Planning, examines long-range transportation planning documents. The report evaluates
how different transportation agencies around the United States are incorporating safety
into long-range transportation plans and what could be considered best practice. The
report concludes that the safety of a transportation system is greatly influenced by the
design and layout of that system [22]. As such, considering safety when creating the
vision for the transportation system can have a positive effect on the future safety of the
system. Specifically, inclusion of safety in the vision and goals of the document was
identified as key ways in which safety should be addressed.
Improving safety has also been identified as a way to improve congestion
problems that a particular metropolitan area might be facing. It has been estimated that 50
to 70 percent of urban congestion is related to traffic crash incidents [22]. Given these
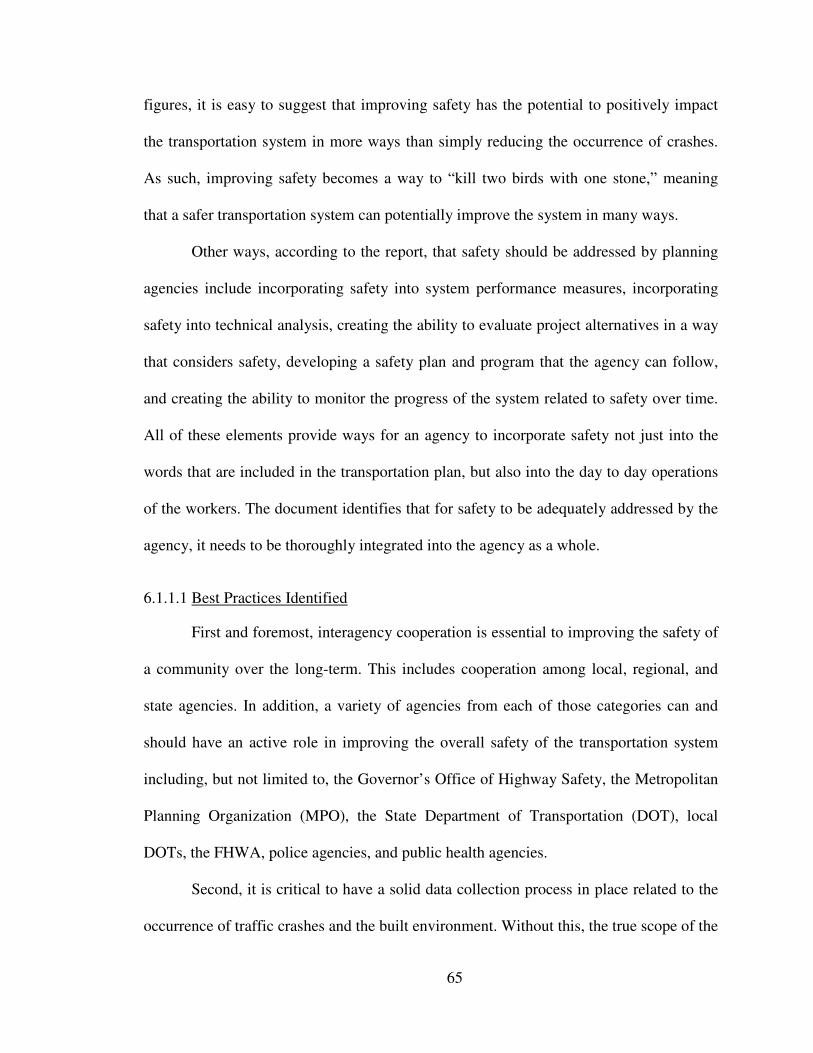
65
figures, it is easy to suggest that improving safety has the potential to positively impact
the transportation system in more ways than simply reducing the occurrence of crashes.
As such, improving safety becomes a way to “kill two birds with one stone,” meaning
that a safer transportation system can potentially improve the system in many ways.
Other ways, according to the report, that safety should be addressed by planning
agencies include incorporating safety into system performance measures, incorporating
safety into technical analysis, creating the ability to evaluate project alternatives in a way
that considers safety, developing a safety plan and program that the agency can follow,
and creating the ability to monitor the progress of the system related to safety over time.
All of these elements provide ways for an agency to incorporate safety not just into the
words that are included in the transportation plan, but also into the day to day operations
of the workers. The document identifies that for safety to be adequately addressed by the
agency, it needs to be thoroughly integrated into the agency as a whole.
6.1.1.1 Best Practices Identified
First and foremost, interagency cooperation is essential to improving the safety of
a community over the long-term. This includes cooperation among local, regional, and
state agencies. In addition, a variety of agencies from each of those categories can and
should have an active role in improving the overall safety of the transportation system
including, but not limited to, the Governor’s Office of Highway Safety, the Metropolitan
Planning Organization (MPO), the State Department of Transportation (DOT), local
DOTs, the FHWA, police agencies, and public health agencies.
Second, it is critical to have a solid data collection process in place related to the
occurrence of traffic crashes and the built environment. Without this, the true scope of the
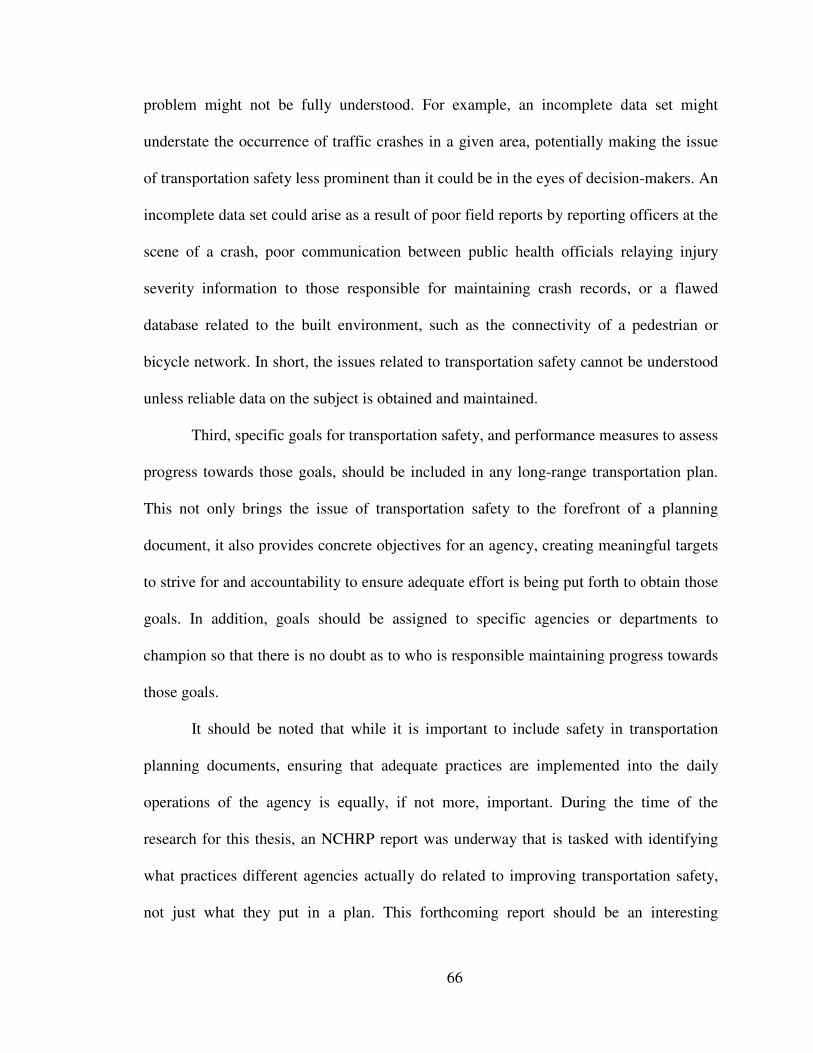
66
problem might not be fully understood. For example, an incomplete data set might
understate the occurrence of traffic crashes in a given area, potentially making the issue
of transportation safety less prominent than it could be in the eyes of decision-makers. An
incomplete data set could arise as a result of poor field reports by reporting officers at the
scene of a crash, poor communication between public health officials relaying injury
severity information to those responsible for maintaining crash records, or a flawed
database related to the built environment, such as the connectivity of a pedestrian or
bicycle network. In short, the issues related to transportation safety cannot be understood
unless reliable data on the subject is obtained and maintained.
Third, specific goals for transportation safety, and performance measures to assess
progress towards those goals, should be included in any long-range transportation plan.
This not only brings the issue of transportation safety to the forefront of a planning
document, it also provides concrete objectives for an agency, creating meaningful targets
to strive for and accountability to ensure adequate effort is being put forth to obtain those
goals. In addition, goals should be assigned to specific agencies or departments to
champion so that there is no doubt as to who is responsible maintaining progress towards
those goals.
It should be noted that while it is important to include safety in transportation
planning documents, ensuring that adequate practices are implemented into the daily
operations of the agency is equally, if not more, important. During the time of the
research for this thesis, an NCHRP report was underway that is tasked with identifying
what practices different agencies actually do related to improving transportation safety,
not just what they put in a plan. This forthcoming report should be an interesting
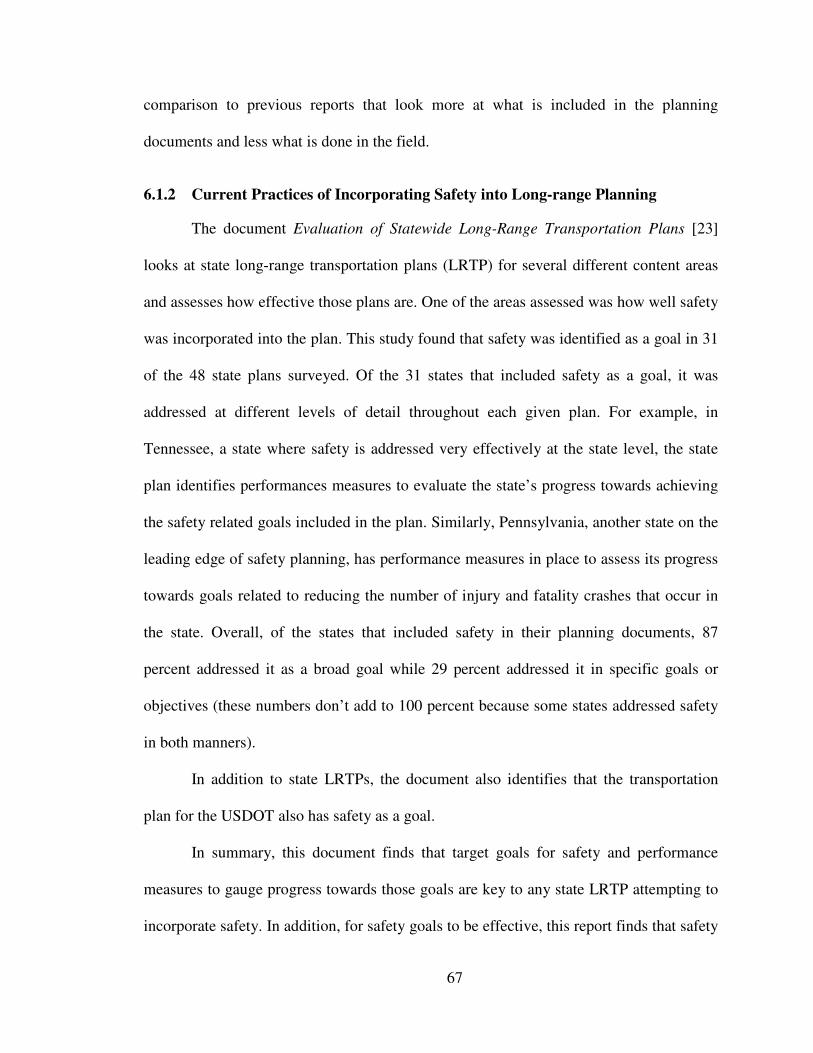
67
comparison to previous reports that look more at what is included in the planning
documents and less what is done in the field.
6.1.2 Current Practices of Incorporating Safety into Long-range Planning
The document Evaluation of Statewide Long-Range Transportation Plans [23]
looks at state long-range transportation plans (LRTP) for several different content areas
and assesses how effective those plans are. One of the areas assessed was how well safety
was incorporated into the plan. This study found that safety was identified as a goal in 31
of the 48 state plans surveyed. Of the 31 states that included safety as a goal, it was
addressed at different levels of detail throughout each given plan. For example, in
Tennessee, a state where safety is addressed very effectively at the state level, the state
plan identifies performances measures to evaluate the state’s progress towards achieving
the safety related goals included in the plan. Similarly, Pennsylvania, another state on the
leading edge of safety planning, has performance measures in place to assess its progress
towards goals related to reducing the number of injury and fatality crashes that occur in
the state. Overall, of the states that included safety in their planning documents, 87
percent addressed it as a broad goal while 29 percent addressed it in specific goals or
objectives (these numbers don’t add to 100 percent because some states addressed safety
in both manners).
In addition to state LRTPs, the document also identifies that the transportation
plan for the USDOT also has safety as a goal.
In summary, this document finds that target goals for safety and performance
measures to gauge progress towards those goals are key to any state LRTP attempting to
incorporate safety. In addition, for safety goals to be effective, this report finds that safety
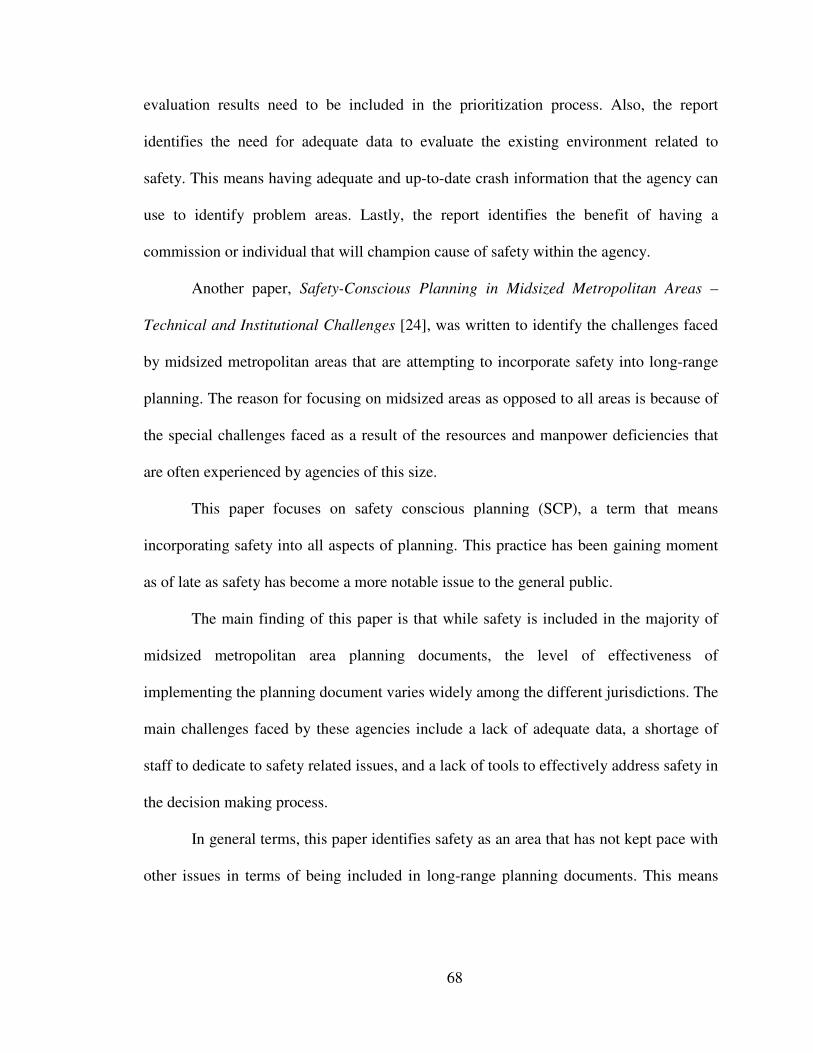
68
evaluation results need to be included in the prioritization process. Also, the report
identifies the need for adequate data to evaluate the existing environment related to
safety. This means having adequate and up-to-date crash information that the agency can
use to identify problem areas. Lastly, the report identifies the benefit of having a
commission or individual that will champion cause of safety within the agency.
Another paper, Safety-Conscious Planning in Midsized Metropolitan Areas –
Technical and Institutional Challenges [24], was written to identify the challenges faced
by midsized metropolitan areas that are attempting to incorporate safety into long-range
planning. The reason for focusing on midsized areas as opposed to all areas is because of
the special challenges faced as a result of the resources and manpower deficiencies that
are often experienced by agencies of this size.
This paper focuses on safety conscious planning (SCP), a term that means
incorporating safety into all aspects of planning. This practice has been gaining moment
as of late as safety has become a more notable issue to the general public.
The main finding of this paper is that while safety is included in the majority of
midsized metropolitan area planning documents, the level of effectiveness of
implementing the planning document varies widely among the different jurisdictions. The
main challenges faced by these agencies include a lack of adequate data, a shortage of
staff to dedicate to safety related issues, and a lack of tools to effectively address safety in
the decision making process.
In general terms, this paper identifies safety as an area that has not kept pace with
other issues in terms of being included in long-range planning documents. This means
69
that while other areas have had improvements in the tools available to better address
long-range issues, safety has been somewhat lagging in this area.
This paper suggests better safety planning processes can result from an internal
champion working to increase the awareness and focus on safety issues within an agency.
In addition, including safety in the project selection process will help to ensure that safety
benefits are considered when transportation improvement funds are allocated. This,
however, will not be effective unless an adequate system is in place for quantifying the
benefits or costs that would result from constructing, or not constructing, a safety
improvement. The paper found that while a lot of agencies identify safety as a goal, few
have found ways to adequately quantify safety. Lastly, having a state DOT that is an
advocate for advanced safety practices can be very beneficial to improving the
capabilities and practices of agencies within the state. This results from interagency
information sharing and training sessions.
6.1.3 Transportation Safety Public Campaigns
A common way for agencies to try and reduce the occurrence of traffic crashes is
through public campaigns. These campaigns, even though the tactics can vary, all focus
on educating users of the transportation system as to ways in which safety can be
improved or crashes reduced.
Several documents were found that focused on the effective implementation of
these campaigns. The purpose of this section is to outline the findings of these
documents.
70
6.1.3.1 Current Public Campaign Practices
The paper Communicating Highway Safety - What Works [25] is mainly focused
on the effects of public campaigns whose purpose is to change driver behavior to benefit
traffic safety. Specifically, this paper looks at the, “type of media components, types of
collaboration, context or environment in which the campaign is intended to have impact,
structure or procedural steps in which campaigns are organized, principles for what
works in a campaign, and the desired level of effects of a campaign.”
The main motivating element behind this paper is the fact that people’s actions
can affect traffic safety much more than improved technology. This is contrary to the
belief that major future increases in reductions in injuries and fatalities will come from a
better design of roads or vehicles. While it is true that improving those designs will help,
modifying the driving styles of the public can be just as effective, if not more so, in
improving the safety of the roadway system.
The results of this study found that we should have guarded optimism as to the
ability of programs to influence driver behavior. This means that programs were found to
have some influence, but minor or major challenges may be present in the
implementation of these programs.
Some of examples of what was found to work in these programs are listed below:
• More effective campaigns carefully target or segment the audience that the
campaign is intended to reach.
• Campaigns for preventive behavior are more effective if they emphasize the
negative consequences of current behavior. Arousing fear (at least in the context
71
of highway safety) has been found to be highly to moderately successful as a
campaign strategy.
• Campaigns are more effective if they emphasize current rewards rather than the
avoidance of distant negative consequences.
• More effective campaigns set fairly modest, attainable goals in terms of
behavioral change.
• More effective campaigns go in tandem with an aggressive enforcement strategy.
• More effective campaigns address the existing knowledge and beliefs of target
audiences that are impeding adoption of desired behaviors.
These findings give some direction to agencies that are looking to include
transportation safety improvement goals in their LRTP. First, money should be allocated
to fund these types of programs. While large roadway safety improvement construction
projects have the potential to improve safety in specific locations, these programs have
the ability to influence driver behavior over a large region. Second, funding for
enforcement should be considered part of the budget to improve safety. This study found
that pairing enforcement with campaigns can be a very effective way to influence
behavior. Lastly, goals focused on improving highway safety should be modest to enable
short term “wins” to occur for the responsible agency. These wins will help lift morale
and motivate future safety improvement projects.
6.1.4 General Findings
In general, the literature review found that agencies are, in most cases, including
safety in some form in their LRTP. However, simply including the language in the
72
planning documents does little to actually improve the safety of the transportation system
by reducing traffic crash injuries and fatalities. The authors of these various documents
found that the best way to encourage transportation safety projects is through various
avenues. First, it is essential that a person or agency champion the cause of transportation
safety. This will result in a constant voice advocating for the allocation of transportation
improvement funds to safety related projects. Second, time and effort must be spent
creating an accurate and complete data set of existing crash and safety data so that the
current state of the transportation system in terms of safety is known. Third, relevant
performance measures must be defined so that progress towards goals can be determined.
Fourth, safety improvements or costs must be quantified so that safety benefits can be
accurately included in the project selection process. The inclusion of safety in the project
selection process was called out in several different documents as being critical to
influencing the direction of improvement projects. Without the inclusion of safety in this
process, safety will not be a driving force in determining how funds are spent.
6.2 Long-Range Transportation Plan Evaluations
For the purpose of evaluating the effect that long-range planning documents can
have on the cost of crashes per person results discussed earlier, several plans were
analyzed. The plans chosen for this analysis represent the five metropolitan areas with the
highest and lowest cost of crashes per person of those in the “Large” population category,
as explained previously. Table 21 displays these metropolitan areas and the
corresponding cost of crashes per person for each.
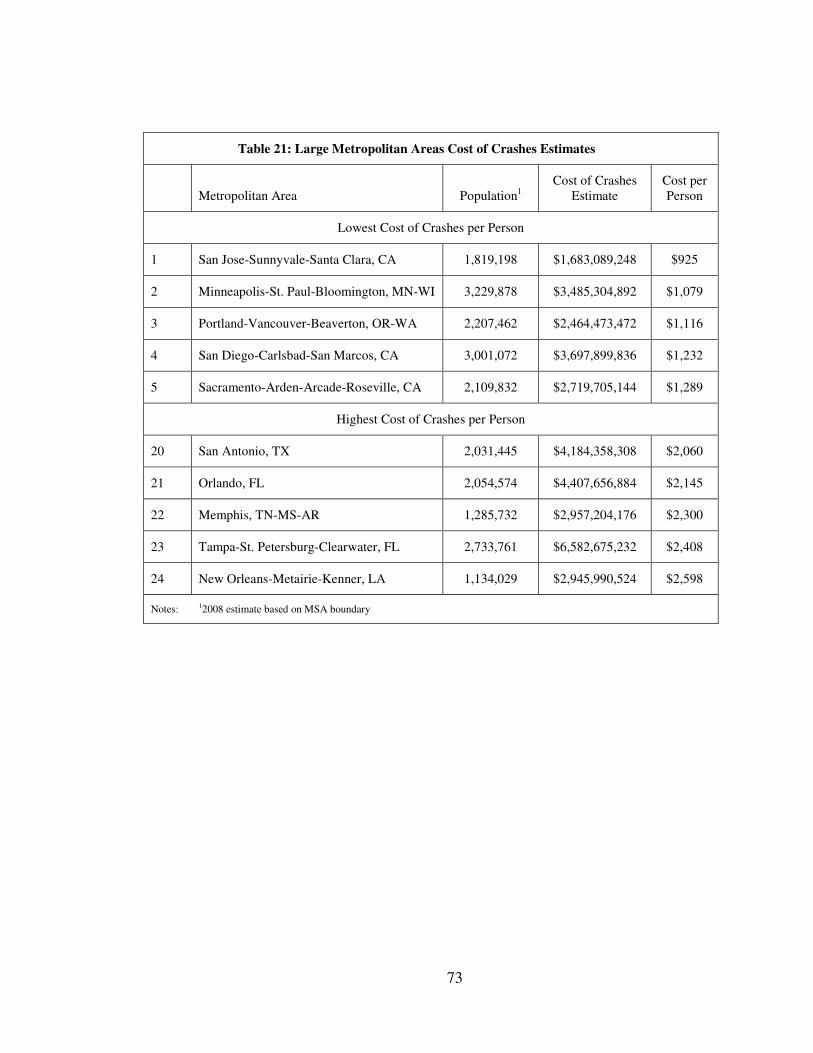
73
Table 21: Large Metropolitan Areas Cost of Crashes Estimates
Metropolitan Area Population1
Cost of Crashes Estimate
Cost per Person
Lowest Cost of Crashes per Person
1 San Jose-Sunnyvale-Santa Clara, CA 1,819,198 $1,683,089,248 $925
2 Minneapolis-St. Paul-Bloomington, MN-WI 3,229,878 $3,485,304,892 $1,079
3 Portland-Vancouver-Beaverton, OR-WA 2,207,462 $2,464,473,472 $1,116
4 San Diego-Carlsbad-San Marcos, CA 3,001,072 $3,697,899,836 $1,232
5 Sacramento-Arden-Arcade-Roseville, CA 2,109,832 $2,719,705,144 $1,289
Highest Cost of Crashes per Person
20 San Antonio, TX 2,031,445 $4,184,358,308 $2,060
21 Orlando, FL 2,054,574 $4,407,656,884 $2,145
22 Memphis, TN-MS-AR 1,285,732 $2,957,204,176 $2,300
23 Tampa-St. Petersburg-Clearwater, FL 2,733,761 $6,582,675,232 $2,408
24 New Orleans-Metairie-Kenner, LA 1,134,029 $2,945,990,524 $2,598
Notes: 12008 estimate based on MSA boundary
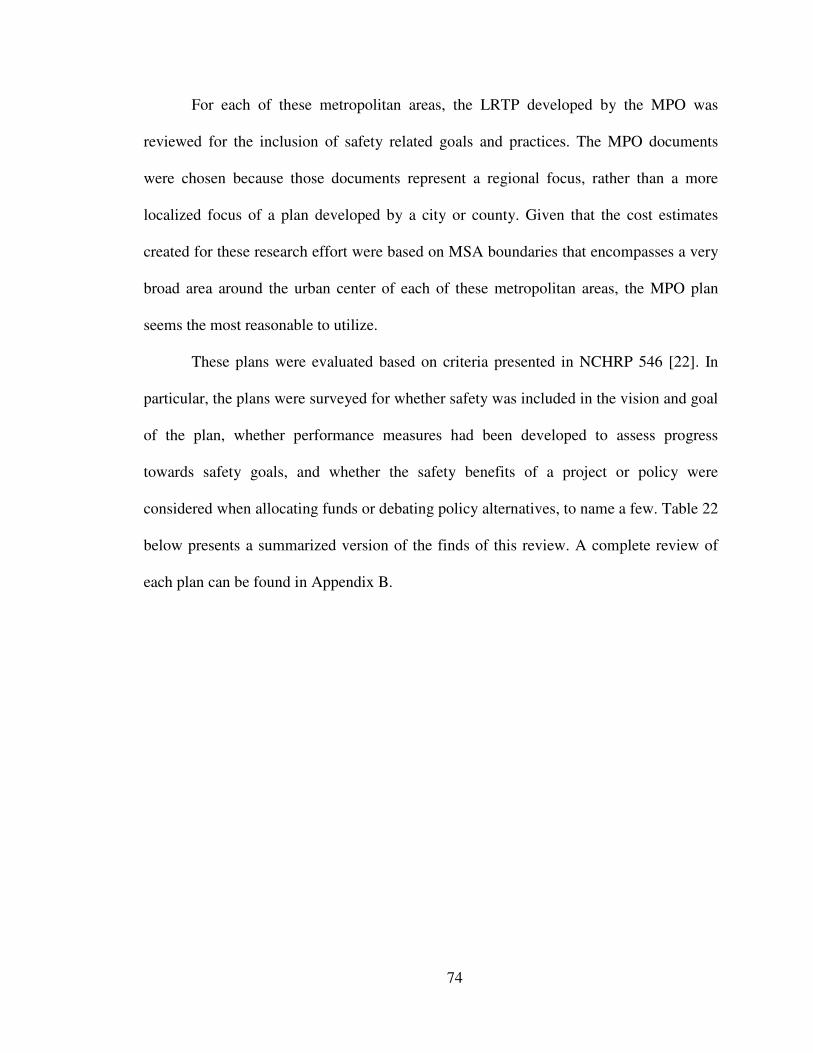
74
For each of these metropolitan areas, the LRTP developed by the MPO was
reviewed for the inclusion of safety related goals and practices. The MPO documents
were chosen because those documents represent a regional focus, rather than a more
localized focus of a plan developed by a city or county. Given that the cost estimates
created for these research effort were based on MSA boundaries that encompasses a very
broad area around the urban center of each of these metropolitan areas, the MPO plan
seems the most reasonable to utilize.
These plans were evaluated based on criteria presented in NCHRP 546 [22]. In
particular, the plans were surveyed for whether safety was included in the vision and goal
of the plan, whether performance measures had been developed to assess progress
towards safety goals, and whether the safety benefits of a project or policy were
considered when allocating funds or debating policy alternatives, to name a few. Table 22
below presents a summarized version of the finds of this review. A complete review of
each plan can be found in Appendix B.
75
Table 22: Evaluation of Long-Range Transportation Plan Summary
Low Cost of Crashes Locations High Cost of Crashes Locations
San
Jo
se,
CA
Min
nea
po
lis,
MN
Po
rtla
nd
, O
R
San
d D
ieg
o,
CA
Sac
ram
ento
, C
A
San
An
ton
io,
TX
Orl
and
o,
FL
Mem
ph
is,
TN
Tam
pa,
FL
New
Orl
ean
s, L
A
Safety in vision statement? + +/x + + x + + +/x x x
Safety included in goals? + x + +/x +/x + + + + +/x
Safety related performance measures?
+ x + x x x + x +/x x
Safety used in project identification?
+ x + x x + + + + x
Safety analysis tools used? + x + x x x + x + x
Safety evaluation criteria used to assess merits of different strategies or projects?
x +/ x + x x +/x + x + x
Product of planning process includes safety-related actions?
+ x + x x x + + x x
Safety included in prioritization process?
x x + x +/x + + + + x
Monitoring process in place? + x + x x x + x +/x x
Key safety stakeholders involved in the planning process?
+ + + x + + + + + x
+ 8 1 10 1 1 5 10 5 6 0
+/x 0 2 0 1 2 1 0 1 2 1
x 2 7 0 8 7 4 0 4 2 9
Notes: “+” indicates that the plan meets the respective criteria
“+/-“ indicates that the plan partially meets the respective criteria
“-“ indicates that the plan does not meet the respective criteria
76
As can been seen by the summary above, there does not seem to be a correlation
between an metropolitan area having a low cost of crashes per person and also having a
strong LRTP in terms of safety, or vice versa. In fact, three of the four worst plans in
terms of how safety is included in the plan, Minneapolis, MN, San Diego, CA, and
Sacramento, CA, are plans that are among the best in terms of the cost of crashes per
person.
These results beg the question, “Why does it appear that the incorporation of
safety into planning has such little effect on the cost of crashes experienced by the
corresponding metropolitan area?” To answer this question, we must address the
limitations of the analysis method used for this evaluation and also the limitations of the
effect that transportation planning can have on safety.
6.2.1 Limitations of Evaluating LRTP
As noted, LRTPs are documents that address the long-range future of the
transportation system for a given area. As such, they generally reflect the priorities and
values of an agency by describing the visions and priorities for the region. However,
these documents are not necessarily the only documents that are considered when policy
or project decisions are made. In addition to LRTPs, agencies will often consider
documents such as pedestrian plans, bicycle plans, state plans, local plans, and others. In
short, the LRTP is one document among many that could be considered a policy
document for a region.
In addition to a multitude of documents, an agency also must deal with a shifting
political climate when decisions are made. For example, while a policy document might
suggest a priority should be put on safety-related projects, the political forces in the area
77
might want to focus on projects that would have a more immediate impact, such roadway
resurfacing projects or capacity increasing projects. In such cases, when immediate
impacts are desired, safety projects often lose out because the true benefits cannot be
realized for sure until several years’ worth of data is collected after the project has been
completed.
Lastly, a review of LRTPs is limited by the lack of real world information that it
provides. For example, while a LRTP plan may state that safety-related projects should
be a priority of an agency, the actual actions of the agency might not reflect that.
Similarly, while a LRTP might not explicitly call out that safety should be a priority for
the area, individual departments or staff members might take it upon themselves to ensure
that safety is adequately addressed in the operation of the agency. In general, while
LRTPs might give us an idea of what is happening at an agency, they do not give us the
complete picture of the actual environment as it relates to safety practices.
78
CHAPTER 7
CONCLUSIONS AND RECOMMENDATIONS
7.1 Summary
Although the cost of congestion is a more discussed phenomenon, this research
has shown that the cost of traffic crashes exceeds the cost of congestion for 83 of the
largest metropolitan areas in the U.S on a per person basis at a rate of over 3 to 1 based
on the 2009 Urban Mobility Report and 2008 crash data. These findings are consistent
with a previous report published by AAA that compared the cost of crashes to the cost of
safety for 2005 data. In that report, the cost of crashes exceeded the cost of safety at a rate
of over 2 to 1. The cost of crashes estimates for the two studies are based on different
VSL and injury estimates due to the FHWA recently revisiting the assumed VSL used in
department studies, raising the value from roughly $3.25 million in 2005 to $5.8 million
for this study. However, even when considering the cost of crashes in 2008 based on the
lower previous cost estimate, the cost of crashes still outweigh the cost of congestion by a
significant margin.
While the result of the cost of crashes exceeding the cost of congestion continued
for this research, interesting trends emerged for the two factors. Between 2005 and 2008,
the cost of crashes was generally on the decline, declining an average of nearly 9 percent,
while the cost of congestion was generally increasing, rising an average of over 11
percent. However, both factors have seen a decline in recent years, mostly likely due to
the recent economic downturn experienced in the U.S. As noted, though, even with these
inverse trends occurring, the cost of crashes still outweighs the cost of congestion.
79
7.2 Recommendations
Although recent trends in traffic related fatalities and injuries have shown a
decline from historical averages, evidence suggests that those occurrences are more likely
the result of outside factors, such as the recent economic downturn, rather than a shift in
driver behavior or the overall safety of the transportation network. As such, significant
effort needs to be taken to reduce the occurrence and severity of traffic crashes in the
future. The following recommendations are aimed at identifying strategies that agencies
can implement to combat traffic related fatalities and injuries in their region.
• Encourage cooperation amongst partnering agencies to address regional safety
issues. Combating the overall safety of the region often is outside of the scope of a
singular agency. Improvements will be seen when many agencies, such as local
agencies, state agencies, regional agencies, and agencies that focus on variety of
travel modes, work together for the common goal of improving safety and reducing
crash related injuries and fatalities.
• Include the safety benefits of a project or policy in the prioritization process. By
including safety in the project prioritization process, an agency is more likely to build
projects that have a positive impact on the safety of the infrastructure system. In
addition, securing consistent funding for safety improvements is a critical component
of having a positive impact of the safety of the transportation system.
• Develop and maintain a comprehensive data collection program for crash
related statistics. This database should be as detailed as possible and preferably
GIS-based. Without adequate crash data, an agency is blind to the current safety of
the transportation system. A complete crash database will allow an agency to identify
80
where safety concerns exist, what type of crashes are a problem, and potentially
identify system wide approaches to combat those issues.
• Work with local police agencies to produce consistent reporting methods for
crashes. Crash data is only as good as the information that is collected in the field. As
such, effort should be taken to ensure that this information is as consistent and
complete as possible. Agencies should work together to make data as comparable as
possible across jurisdictional lines.
• Encourage cooperation amongst health officials and police officials to accurately
report the injury severity of crashes. When a victim of a crash leaves the scene and
is treated at a hospital, a possibility exists that the original crash report might not be
updated to accurately record the severity of the injury that results from the crash.
Communication between police and health officials should exist so that the final crash
report is as accurate and complete as possible.
• Incorporate transportation safety into the daily operations of the agency.
Improving transportation safety is not something that can occur overnight or with
minimal effort by the governing jurisdiction. Positive results will come from a
dedicated agency who works to include the potential safety benefits or costs of a
particular project or policy into every decision.
• Consider improving safety to be both a short-term and long-term issue. While
significant improvements in the safety of a transportation system will be the result of
years of dedication to the issue, small steps towards or away from that goal are made
each time an individual project is built. By making pro-safety decisions on specific
projects, big or small, the overall safety of the network is increased.
81
• Create a national database of injury crash data. Injury case data is currently much
more difficult to analyze because no national database exists like there is for fatality
data. States should be required to report injury information at the county level to a
national agency so that a more accurate picture of the trends related to injury
information can be analyzed.
7.3 Future Research
To improve the confidence that can be had in analyses conducted like what was
done for this thesis, further research should be done related to the economic costs
associated with traffic crashes. In particular, little research on the economic impact of
injuries has been conducted to date.
Much like the Urban Mobility Report, the economic cost of traffic crashes should
be reported biennially. Having this information produced every other year will help
ensure that safety stays in the conversation as to where transportation improvement
dollars should be spent. Also, a more in-depth look at how the practices of an agency
affect the occurrence of traffic crashes would be an interesting exercise. Similarly, a
significant amount of research could be conducted related to the correlation between the
occurrence of crashes and the existing environment, such as building density, congestion
levels, transit ridership, and other factors that could affect the occurrence of crashes.
Understanding these relationships could go a long way to helping agencies understand
where resources should be invested to reduce crashes and, by doing so, save lives.

82
APPENDIX A
MSA AREA DEFINITIONS
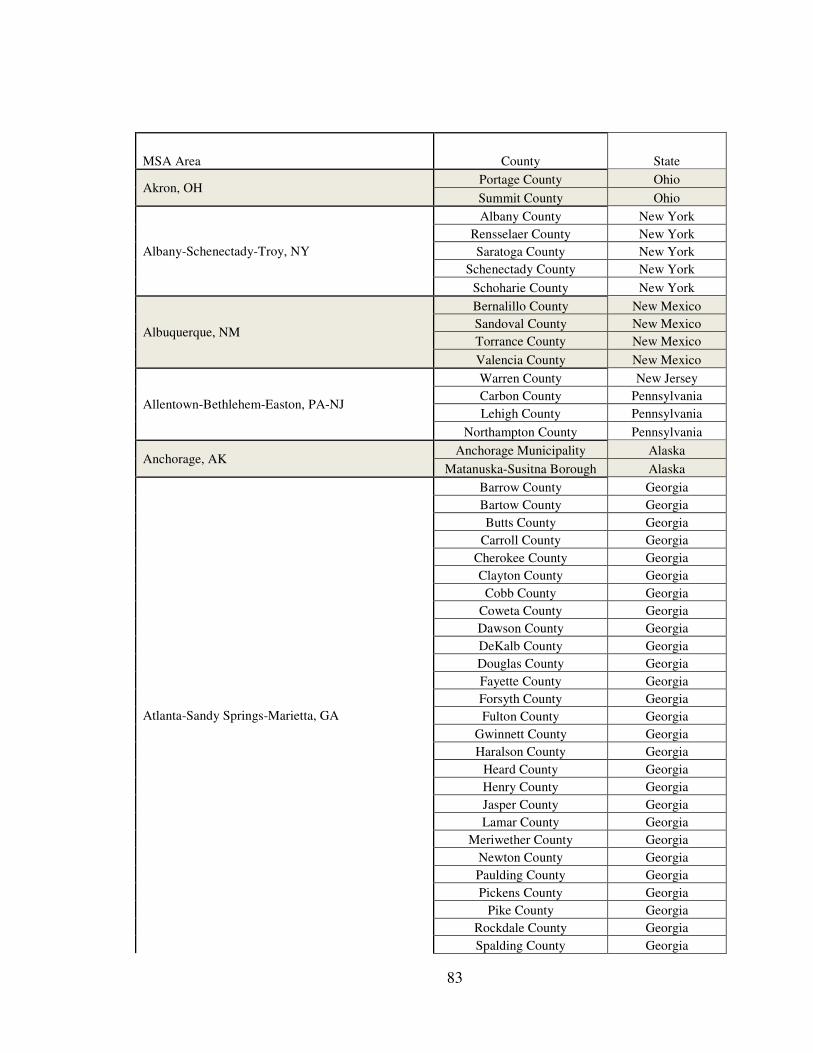
83
MSA Area County State
Akron, OH Portage County Ohio
Summit County Ohio
Albany-Schenectady-Troy, NY
Albany County New York
Rensselaer County New York
Saratoga County New York
Schenectady County New York
Schoharie County New York
Albuquerque, NM
Bernalillo County New Mexico
Sandoval County New Mexico
Torrance County New Mexico
Valencia County New Mexico
Allentown-Bethlehem-Easton, PA-NJ
Warren County New Jersey
Carbon County Pennsylvania
Lehigh County Pennsylvania
Northampton County Pennsylvania
Anchorage, AK Anchorage Municipality Alaska
Matanuska-Susitna Borough Alaska
Atlanta-Sandy Springs-Marietta, GA
Barrow County Georgia
Bartow County Georgia
Butts County Georgia
Carroll County Georgia
Cherokee County Georgia
Clayton County Georgia
Cobb County Georgia
Coweta County Georgia
Dawson County Georgia
DeKalb County Georgia
Douglas County Georgia
Fayette County Georgia
Forsyth County Georgia
Fulton County Georgia
Gwinnett County Georgia
Haralson County Georgia
Heard County Georgia
Henry County Georgia
Jasper County Georgia
Lamar County Georgia
Meriwether County Georgia
Newton County Georgia
Paulding County Georgia
Pickens County Georgia
Pike County Georgia
Rockdale County Georgia
Spalding County Georgia
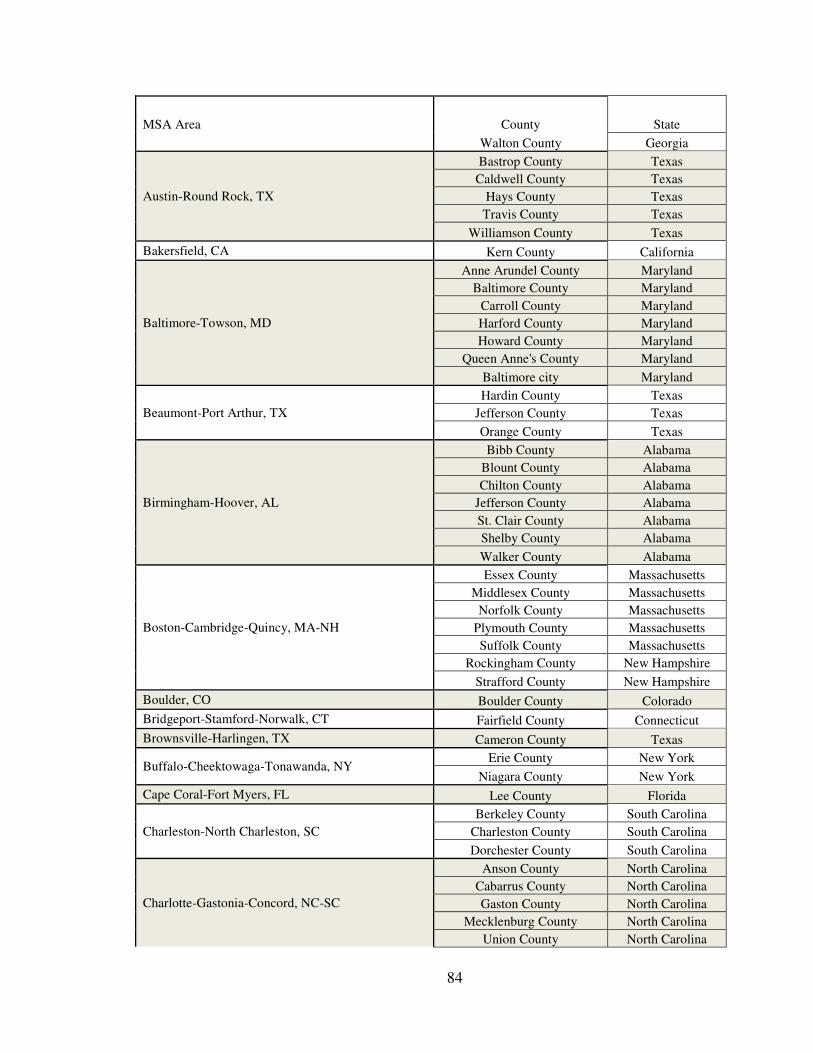
84
MSA Area County State
Walton County Georgia
Austin-Round Rock, TX
Bastrop County Texas
Caldwell County Texas
Hays County Texas
Travis County Texas
Williamson County Texas
Bakersfield, CA Kern County California
Baltimore-Towson, MD
Anne Arundel County Maryland
Baltimore County Maryland
Carroll County Maryland
Harford County Maryland
Howard County Maryland
Queen Anne's County Maryland
Baltimore city Maryland
Beaumont-Port Arthur, TX
Hardin County Texas
Jefferson County Texas
Orange County Texas
Birmingham-Hoover, AL
Bibb County Alabama
Blount County Alabama
Chilton County Alabama
Jefferson County Alabama
St. Clair County Alabama
Shelby County Alabama
Walker County Alabama
Boston-Cambridge-Quincy, MA-NH
Essex County Massachusetts
Middlesex County Massachusetts
Norfolk County Massachusetts
Plymouth County Massachusetts
Suffolk County Massachusetts
Rockingham County New Hampshire
Strafford County New Hampshire
Boulder, CO Boulder County Colorado
Bridgeport-Stamford-Norwalk, CT Fairfield County Connecticut
Brownsville-Harlingen, TX Cameron County Texas
Buffalo-Cheektowaga-Tonawanda, NY Erie County New York
Niagara County New York
Cape Coral-Fort Myers, FL Lee County Florida
Charleston-North Charleston, SC
Berkeley County South Carolina
Charleston County South Carolina
Dorchester County South Carolina
Charlotte-Gastonia-Concord, NC-SC
Anson County North Carolina
Cabarrus County North Carolina
Gaston County North Carolina
Mecklenburg County North Carolina
Union County North Carolina
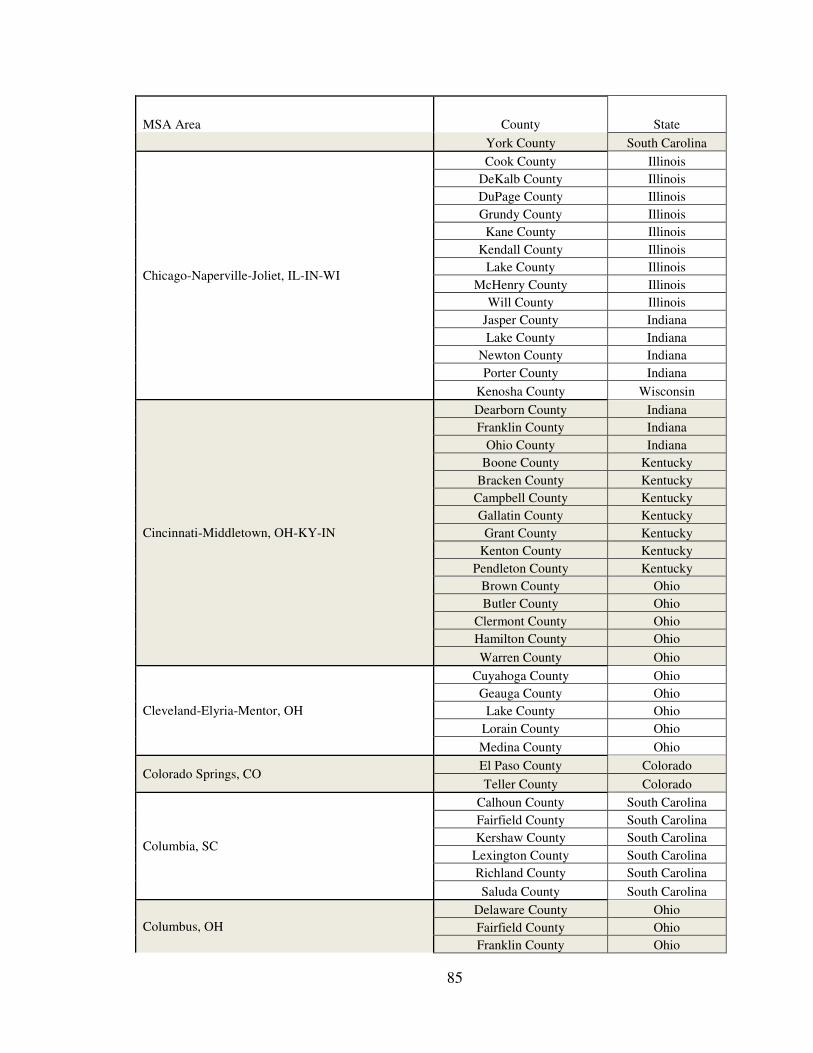
85
MSA Area County State
York County South Carolina
Chicago-Naperville-Joliet, IL-IN-WI
Cook County Illinois
DeKalb County Illinois
DuPage County Illinois
Grundy County Illinois
Kane County Illinois
Kendall County Illinois
Lake County Illinois
McHenry County Illinois
Will County Illinois
Jasper County Indiana
Lake County Indiana
Newton County Indiana
Porter County Indiana
Kenosha County Wisconsin
Cincinnati-Middletown, OH-KY-IN
Dearborn County Indiana
Franklin County Indiana
Ohio County Indiana
Boone County Kentucky
Bracken County Kentucky
Campbell County Kentucky
Gallatin County Kentucky
Grant County Kentucky
Kenton County Kentucky
Pendleton County Kentucky
Brown County Ohio
Butler County Ohio
Clermont County Ohio
Hamilton County Ohio
Warren County Ohio
Cleveland-Elyria-Mentor, OH
Cuyahoga County Ohio
Geauga County Ohio
Lake County Ohio
Lorain County Ohio
Medina County Ohio
Colorado Springs, CO El Paso County Colorado
Teller County Colorado
Columbia, SC
Calhoun County South Carolina
Fairfield County South Carolina
Kershaw County South Carolina
Lexington County South Carolina
Richland County South Carolina
Saluda County South Carolina
Columbus, OH
Delaware County Ohio
Fairfield County Ohio
Franklin County Ohio
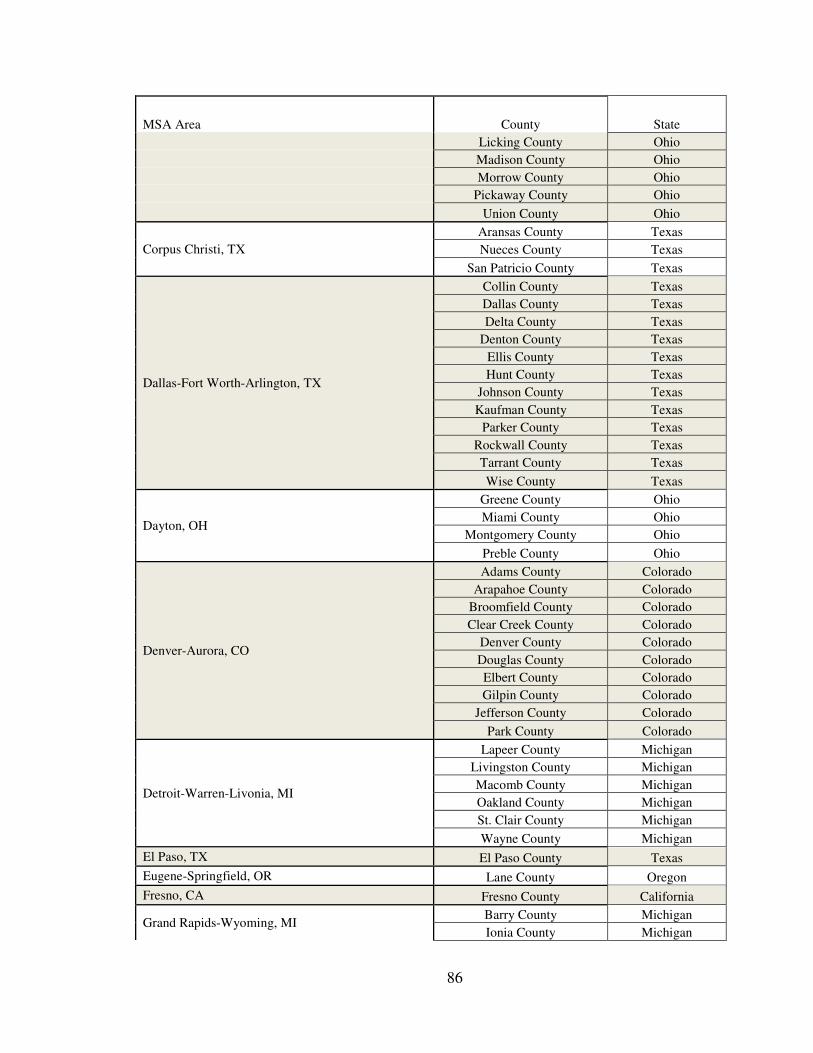
86
MSA Area County State
Licking County Ohio
Madison County Ohio
Morrow County Ohio
Pickaway County Ohio
Union County Ohio
Corpus Christi, TX
Aransas County Texas
Nueces County Texas
San Patricio County Texas
Dallas-Fort Worth-Arlington, TX
Collin County Texas
Dallas County Texas
Delta County Texas
Denton County Texas
Ellis County Texas
Hunt County Texas
Johnson County Texas
Kaufman County Texas
Parker County Texas
Rockwall County Texas
Tarrant County Texas
Wise County Texas
Dayton, OH
Greene County Ohio
Miami County Ohio
Montgomery County Ohio
Preble County Ohio
Denver-Aurora, CO
Adams County Colorado
Arapahoe County Colorado
Broomfield County Colorado
Clear Creek County Colorado
Denver County Colorado
Douglas County Colorado
Elbert County Colorado
Gilpin County Colorado
Jefferson County Colorado
Park County Colorado
Detroit-Warren-Livonia, MI
Lapeer County Michigan
Livingston County Michigan
Macomb County Michigan
Oakland County Michigan
St. Clair County Michigan
Wayne County Michigan
El Paso, TX El Paso County Texas
Eugene-Springfield, OR Lane County Oregon
Fresno, CA Fresno County California
Grand Rapids-Wyoming, MI Barry County Michigan
Ionia County Michigan
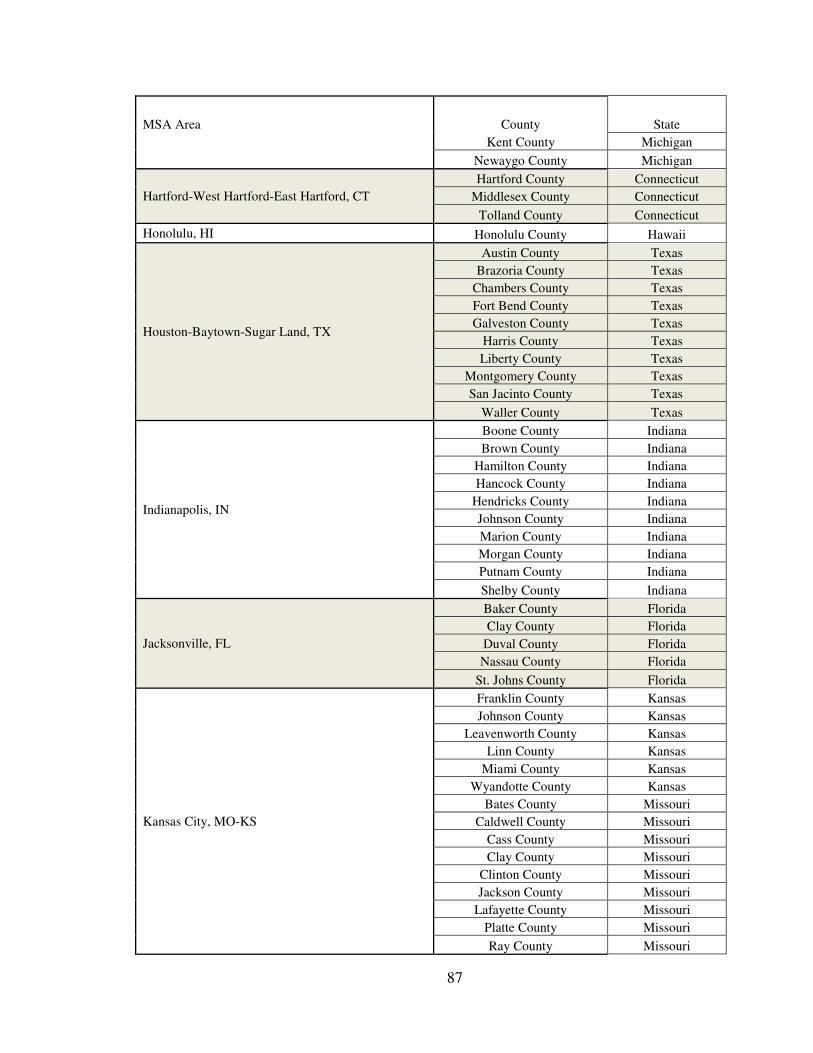
87
MSA Area County State
Kent County Michigan
Newaygo County Michigan
Hartford-West Hartford-East Hartford, CT
Hartford County Connecticut
Middlesex County Connecticut
Tolland County Connecticut
Honolulu, HI Honolulu County Hawaii
Houston-Baytown-Sugar Land, TX
Austin County Texas
Brazoria County Texas
Chambers County Texas
Fort Bend County Texas
Galveston County Texas
Harris County Texas
Liberty County Texas
Montgomery County Texas
San Jacinto County Texas
Waller County Texas
Indianapolis, IN
Boone County Indiana
Brown County Indiana
Hamilton County Indiana
Hancock County Indiana
Hendricks County Indiana
Johnson County Indiana
Marion County Indiana
Morgan County Indiana
Putnam County Indiana
Shelby County Indiana
Jacksonville, FL
Baker County Florida
Clay County Florida
Duval County Florida
Nassau County Florida
St. Johns County Florida
Kansas City, MO-KS
Franklin County Kansas
Johnson County Kansas
Leavenworth County Kansas
Linn County Kansas
Miami County Kansas
Wyandotte County Kansas
Bates County Missouri
Caldwell County Missouri
Cass County Missouri
Clay County Missouri
Clinton County Missouri
Jackson County Missouri
Lafayette County Missouri
Platte County Missouri
Ray County Missouri
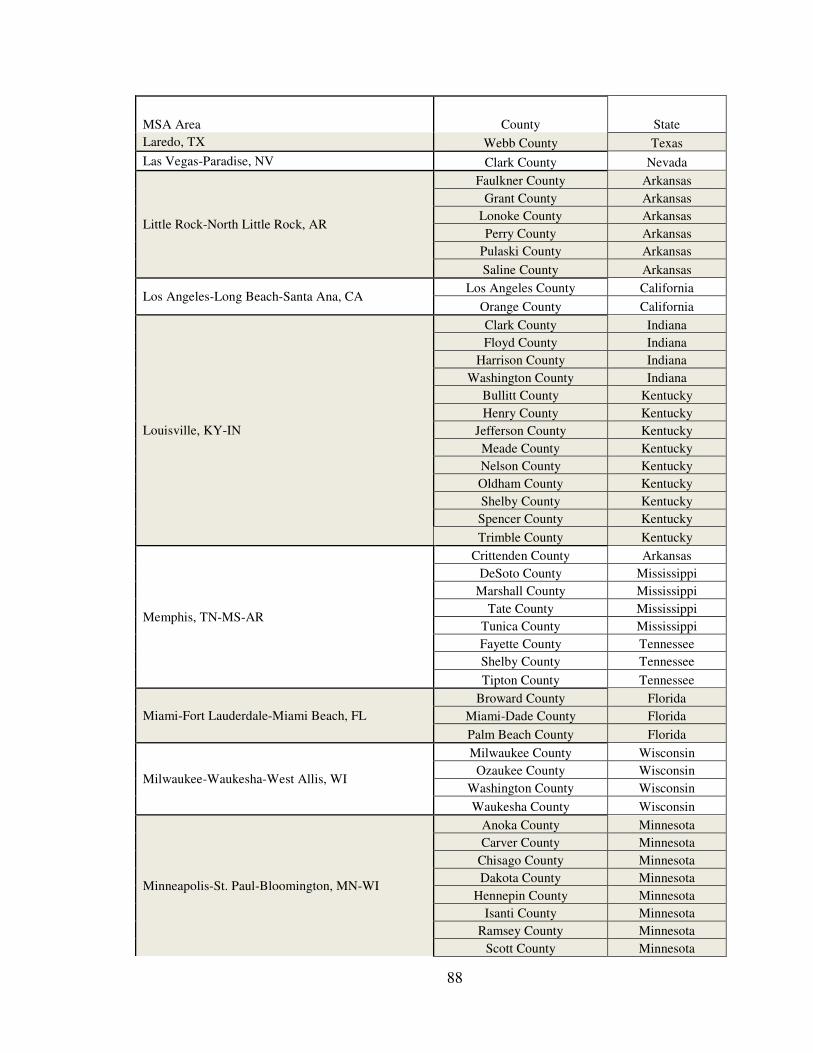
88
MSA Area County State
Laredo, TX Webb County Texas
Las Vegas-Paradise, NV Clark County Nevada
Little Rock-North Little Rock, AR
Faulkner County Arkansas
Grant County Arkansas
Lonoke County Arkansas
Perry County Arkansas
Pulaski County Arkansas
Saline County Arkansas
Los Angeles-Long Beach-Santa Ana, CA Los Angeles County California
Orange County California
Louisville, KY-IN
Clark County Indiana
Floyd County Indiana
Harrison County Indiana
Washington County Indiana
Bullitt County Kentucky
Henry County Kentucky
Jefferson County Kentucky
Meade County Kentucky
Nelson County Kentucky
Oldham County Kentucky
Shelby County Kentucky
Spencer County Kentucky
Trimble County Kentucky
Memphis, TN-MS-AR
Crittenden County Arkansas
DeSoto County Mississippi
Marshall County Mississippi
Tate County Mississippi
Tunica County Mississippi
Fayette County Tennessee
Shelby County Tennessee
Tipton County Tennessee
Miami-Fort Lauderdale-Miami Beach, FL
Broward County Florida
Miami-Dade County Florida
Palm Beach County Florida
Milwaukee-Waukesha-West Allis, WI
Milwaukee County Wisconsin
Ozaukee County Wisconsin
Washington County Wisconsin
Waukesha County Wisconsin
Minneapolis-St. Paul-Bloomington, MN-WI
Anoka County Minnesota
Carver County Minnesota
Chisago County Minnesota
Dakota County Minnesota
Hennepin County Minnesota
Isanti County Minnesota
Ramsey County Minnesota
Scott County Minnesota
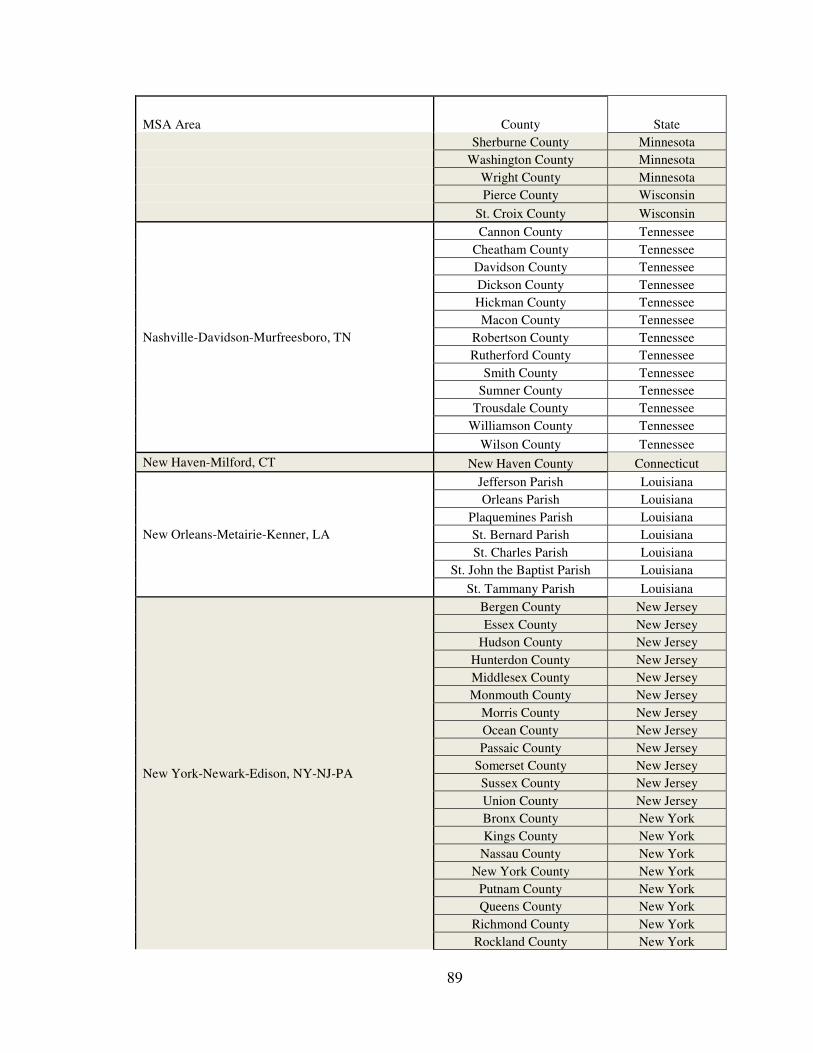
89
MSA Area County State
Sherburne County Minnesota
Washington County Minnesota
Wright County Minnesota
Pierce County Wisconsin
St. Croix County Wisconsin
Nashville-Davidson-Murfreesboro, TN
Cannon County Tennessee
Cheatham County Tennessee
Davidson County Tennessee
Dickson County Tennessee
Hickman County Tennessee
Macon County Tennessee
Robertson County Tennessee
Rutherford County Tennessee
Smith County Tennessee
Sumner County Tennessee
Trousdale County Tennessee
Williamson County Tennessee
Wilson County Tennessee
New Haven-Milford, CT New Haven County Connecticut
New Orleans-Metairie-Kenner, LA
Jefferson Parish Louisiana
Orleans Parish Louisiana
Plaquemines Parish Louisiana
St. Bernard Parish Louisiana
St. Charles Parish Louisiana
St. John the Baptist Parish Louisiana
St. Tammany Parish Louisiana
New York-Newark-Edison, NY-NJ-PA
Bergen County New Jersey
Essex County New Jersey
Hudson County New Jersey
Hunterdon County New Jersey
Middlesex County New Jersey
Monmouth County New Jersey
Morris County New Jersey
Ocean County New Jersey
Passaic County New Jersey
Somerset County New Jersey
Sussex County New Jersey
Union County New Jersey
Bronx County New York
Kings County New York
Nassau County New York
New York County New York
Putnam County New York
Queens County New York
Richmond County New York
Rockland County New York
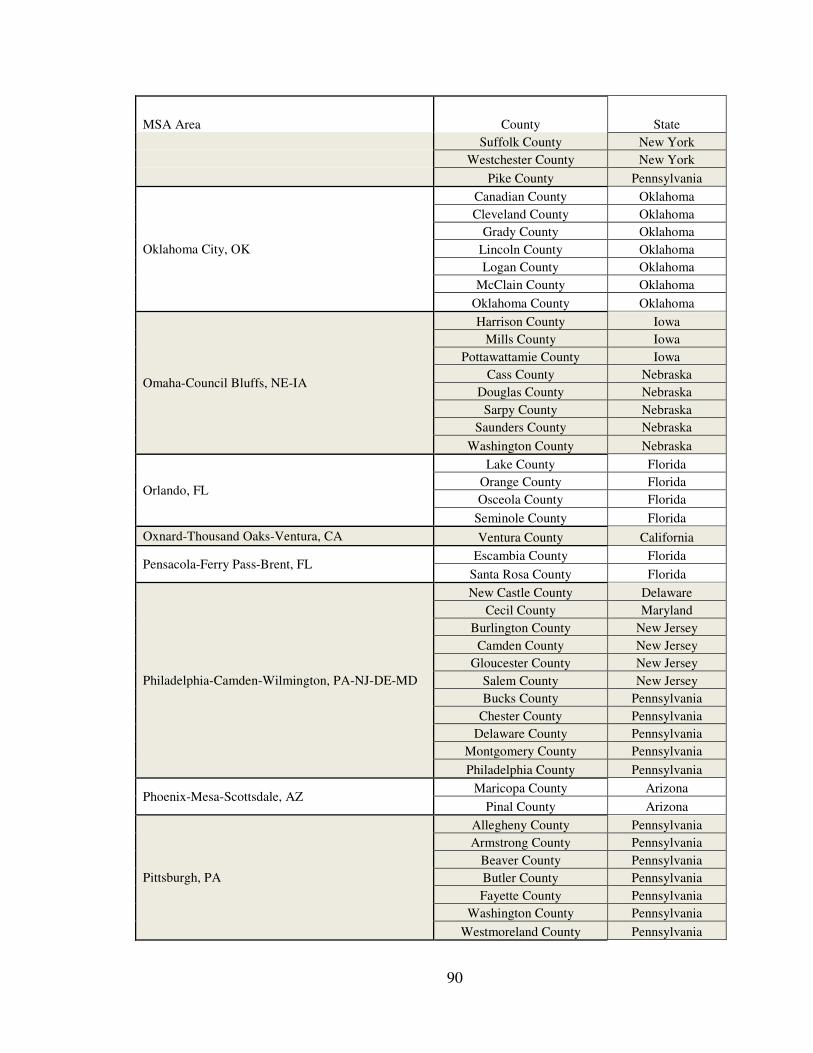
90
MSA Area County State
Suffolk County New York
Westchester County New York
Pike County Pennsylvania
Oklahoma City, OK
Canadian County Oklahoma
Cleveland County Oklahoma
Grady County Oklahoma
Lincoln County Oklahoma
Logan County Oklahoma
McClain County Oklahoma
Oklahoma County Oklahoma
Omaha-Council Bluffs, NE-IA
Harrison County Iowa
Mills County Iowa
Pottawattamie County Iowa
Cass County Nebraska
Douglas County Nebraska
Sarpy County Nebraska
Saunders County Nebraska
Washington County Nebraska
Orlando, FL
Lake County Florida
Orange County Florida
Osceola County Florida
Seminole County Florida
Oxnard-Thousand Oaks-Ventura, CA Ventura County California
Pensacola-Ferry Pass-Brent, FL Escambia County Florida
Santa Rosa County Florida
Philadelphia-Camden-Wilmington, PA-NJ-DE-MD
New Castle County Delaware
Cecil County Maryland
Burlington County New Jersey
Camden County New Jersey
Gloucester County New Jersey
Salem County New Jersey
Bucks County Pennsylvania
Chester County Pennsylvania
Delaware County Pennsylvania
Montgomery County Pennsylvania
Philadelphia County Pennsylvania
Phoenix-Mesa-Scottsdale, AZ Maricopa County Arizona
Pinal County Arizona
Pittsburgh, PA
Allegheny County Pennsylvania
Armstrong County Pennsylvania
Beaver County Pennsylvania
Butler County Pennsylvania
Fayette County Pennsylvania
Washington County Pennsylvania
Westmoreland County Pennsylvania
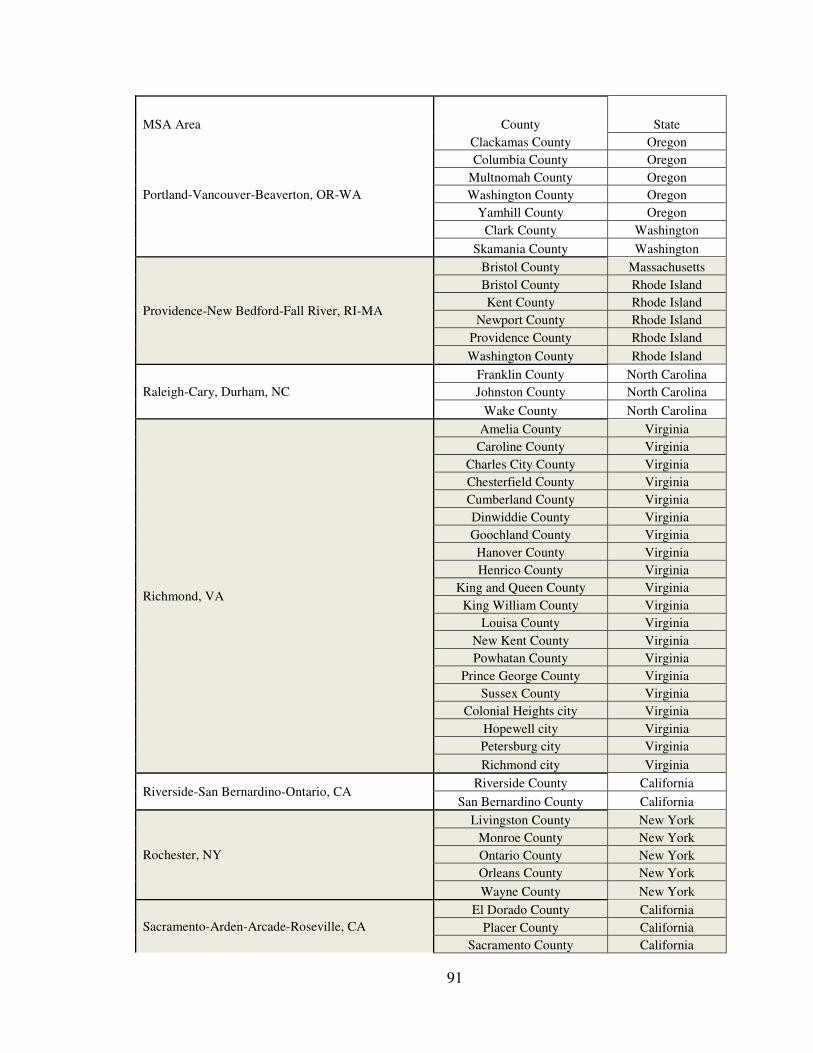
91
MSA Area County State
Portland-Vancouver-Beaverton, OR-WA
Clackamas County Oregon
Columbia County Oregon
Multnomah County Oregon
Washington County Oregon
Yamhill County Oregon
Clark County Washington
Skamania County Washington
Providence-New Bedford-Fall River, RI-MA
Bristol County Massachusetts
Bristol County Rhode Island
Kent County Rhode Island
Newport County Rhode Island
Providence County Rhode Island
Washington County Rhode Island
Raleigh-Cary, Durham, NC
Franklin County North Carolina
Johnston County North Carolina
Wake County North Carolina
Richmond, VA
Amelia County Virginia
Caroline County Virginia
Charles City County Virginia
Chesterfield County Virginia
Cumberland County Virginia
Dinwiddie County Virginia
Goochland County Virginia
Hanover County Virginia
Henrico County Virginia
King and Queen County Virginia
King William County Virginia
Louisa County Virginia
New Kent County Virginia
Powhatan County Virginia
Prince George County Virginia
Sussex County Virginia
Colonial Heights city Virginia
Hopewell city Virginia
Petersburg city Virginia
Richmond city Virginia
Riverside-San Bernardino-Ontario, CA Riverside County California
San Bernardino County California
Rochester, NY
Livingston County New York
Monroe County New York
Ontario County New York
Orleans County New York
Wayne County New York
Sacramento-Arden-Arcade-Roseville, CA
El Dorado County California
Placer County California
Sacramento County California
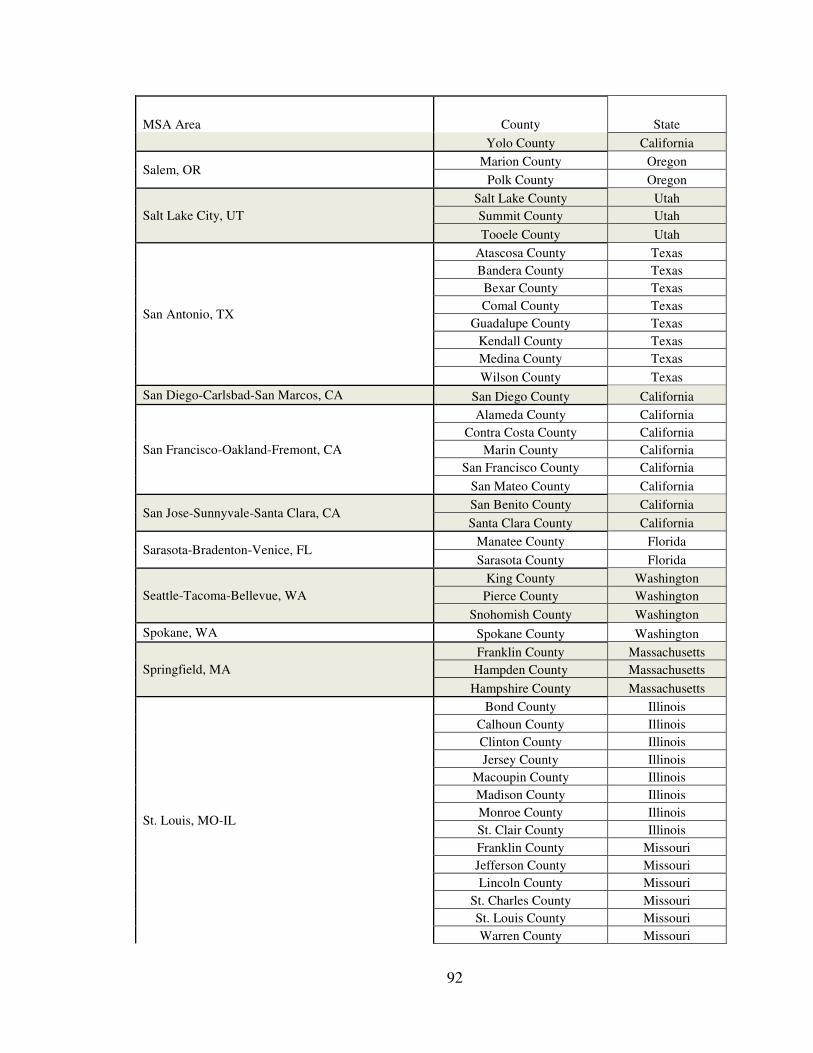
92
MSA Area County State
Yolo County California
Salem, OR Marion County Oregon
Polk County Oregon
Salt Lake City, UT
Salt Lake County Utah
Summit County Utah
Tooele County Utah
San Antonio, TX
Atascosa County Texas
Bandera County Texas
Bexar County Texas
Comal County Texas
Guadalupe County Texas
Kendall County Texas
Medina County Texas
Wilson County Texas
San Diego-Carlsbad-San Marcos, CA San Diego County California
San Francisco-Oakland-Fremont, CA
Alameda County California
Contra Costa County California
Marin County California
San Francisco County California
San Mateo County California
San Jose-Sunnyvale-Santa Clara, CA San Benito County California
Santa Clara County California
Sarasota-Bradenton-Venice, FL Manatee County Florida
Sarasota County Florida
Seattle-Tacoma-Bellevue, WA
King County Washington
Pierce County Washington
Snohomish County Washington
Spokane, WA Spokane County Washington
Springfield, MA
Franklin County Massachusetts
Hampden County Massachusetts
Hampshire County Massachusetts
St. Louis, MO-IL
Bond County Illinois
Calhoun County Illinois
Clinton County Illinois
Jersey County Illinois
Macoupin County Illinois
Madison County Illinois
Monroe County Illinois
St. Clair County Illinois
Franklin County Missouri
Jefferson County Missouri
Lincoln County Missouri
St. Charles County Missouri
St. Louis County Missouri
Warren County Missouri
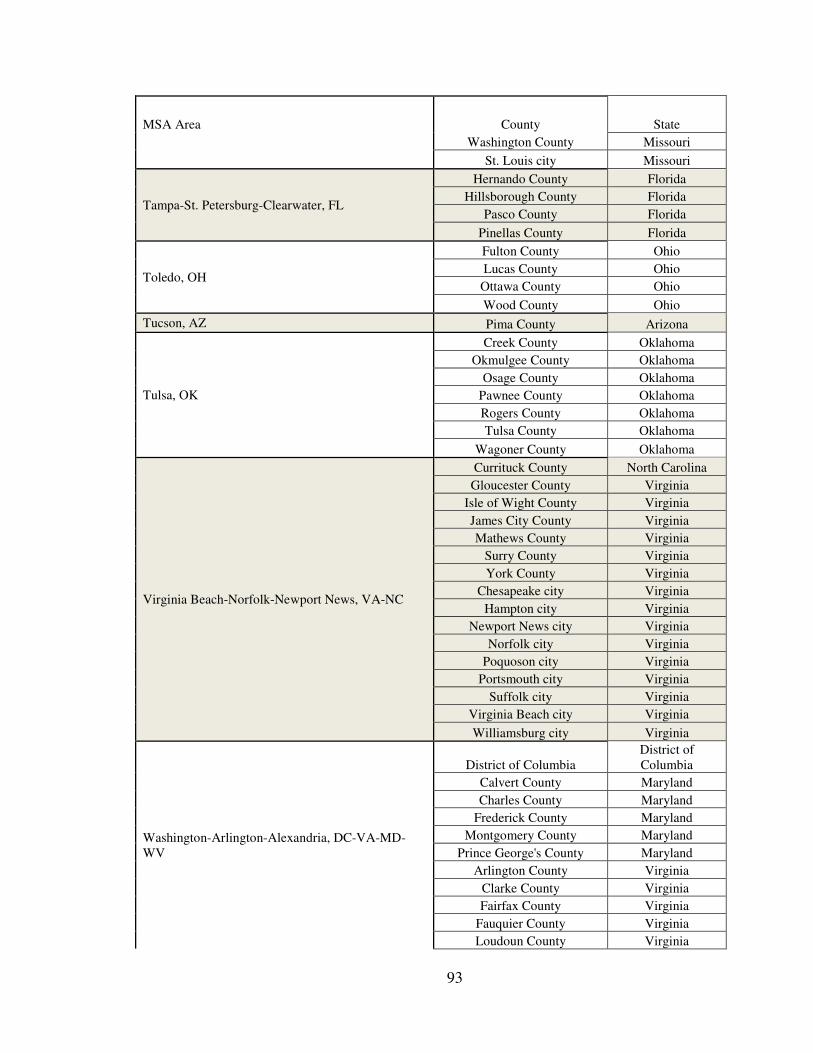
93
MSA Area County State
Washington County Missouri
St. Louis city Missouri
Tampa-St. Petersburg-Clearwater, FL
Hernando County Florida
Hillsborough County Florida
Pasco County Florida
Pinellas County Florida
Toledo, OH
Fulton County Ohio
Lucas County Ohio
Ottawa County Ohio
Wood County Ohio
Tucson, AZ Pima County Arizona
Tulsa, OK
Creek County Oklahoma
Okmulgee County Oklahoma
Osage County Oklahoma
Pawnee County Oklahoma
Rogers County Oklahoma
Tulsa County Oklahoma
Wagoner County Oklahoma
Virginia Beach-Norfolk-Newport News, VA-NC
Currituck County North Carolina
Gloucester County Virginia
Isle of Wight County Virginia
James City County Virginia
Mathews County Virginia
Surry County Virginia
York County Virginia
Chesapeake city Virginia
Hampton city Virginia
Newport News city Virginia
Norfolk city Virginia
Poquoson city Virginia
Portsmouth city Virginia
Suffolk city Virginia
Virginia Beach city Virginia
Williamsburg city Virginia
Washington-Arlington-Alexandria, DC-VA-MD-WV
District of Columbia District of Columbia
Calvert County Maryland
Charles County Maryland
Frederick County Maryland
Montgomery County Maryland
Prince George's County Maryland
Arlington County Virginia
Clarke County Virginia
Fairfax County Virginia
Fauquier County Virginia
Loudoun County Virginia
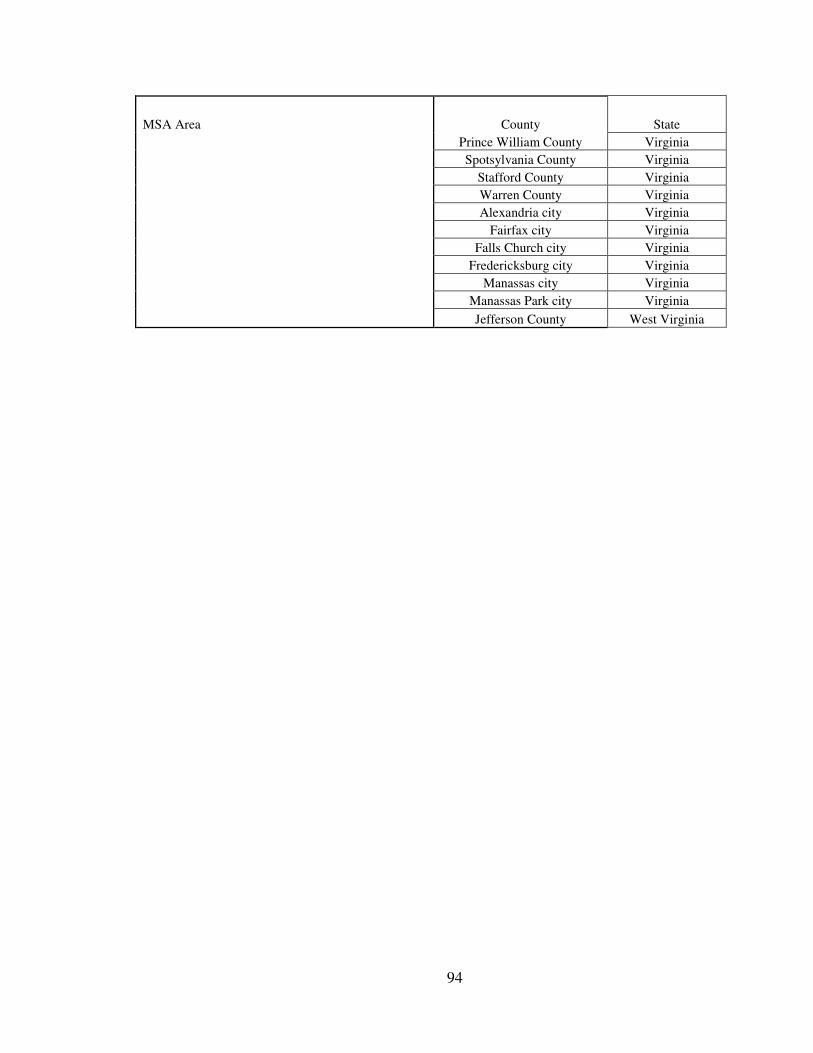
94
MSA Area County State
Prince William County Virginia
Spotsylvania County Virginia
Stafford County Virginia
Warren County Virginia
Alexandria city Virginia
Fairfax city Virginia
Falls Church city Virginia
Fredericksburg city Virginia
Manassas city Virginia
Manassas Park city Virginia
Jefferson County West Virginia

95
APPENDIX B
LONG-RANGE TRANSPORTATION PLAN EVALUATIONS
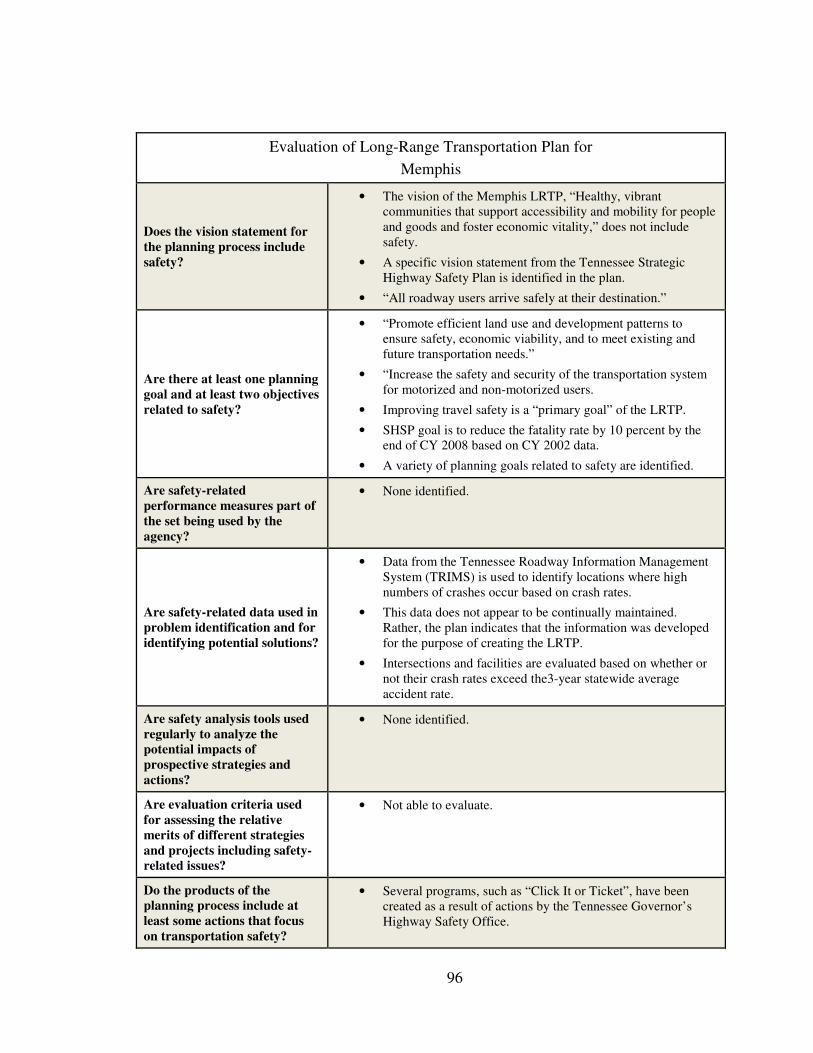
96
Evaluation of Long-Range Transportation Plan for
Memphis
Does the vision statement for
the planning process include
safety?
• The vision of the Memphis LRTP, “Healthy, vibrant communities that support accessibility and mobility for people and goods and foster economic vitality,” does not include safety.
• A specific vision statement from the Tennessee Strategic Highway Safety Plan is identified in the plan.
• “All roadway users arrive safely at their destination.”
Are there at least one planning
goal and at least two objectives
related to safety?
• “Promote efficient land use and development patterns to ensure safety, economic viability, and to meet existing and future transportation needs.”
• “Increase the safety and security of the transportation system for motorized and non-motorized users.
• Improving travel safety is a “primary goal” of the LRTP.
• SHSP goal is to reduce the fatality rate by 10 percent by the end of CY 2008 based on CY 2002 data.
• A variety of planning goals related to safety are identified.
Are safety-related
performance measures part of
the set being used by the
agency?
• None identified.
Are safety-related data used in
problem identification and for
identifying potential solutions?
• Data from the Tennessee Roadway Information Management System (TRIMS) is used to identify locations where high numbers of crashes occur based on crash rates.
• This data does not appear to be continually maintained. Rather, the plan indicates that the information was developed for the purpose of creating the LRTP.
• Intersections and facilities are evaluated based on whether or not their crash rates exceed the3-year statewide average accident rate.
Are safety analysis tools used
regularly to analyze the
potential impacts of
prospective strategies and
actions?
• None identified.
Are evaluation criteria used
for assessing the relative
merits of different strategies
and projects including safety-
related issues?
• Not able to evaluate.
Do the products of the
planning process include at
least some actions that focus
on transportation safety?
• Several programs, such as “Click It or Ticket”, have been created as a result of actions by the Tennessee Governor’s Highway Safety Office.
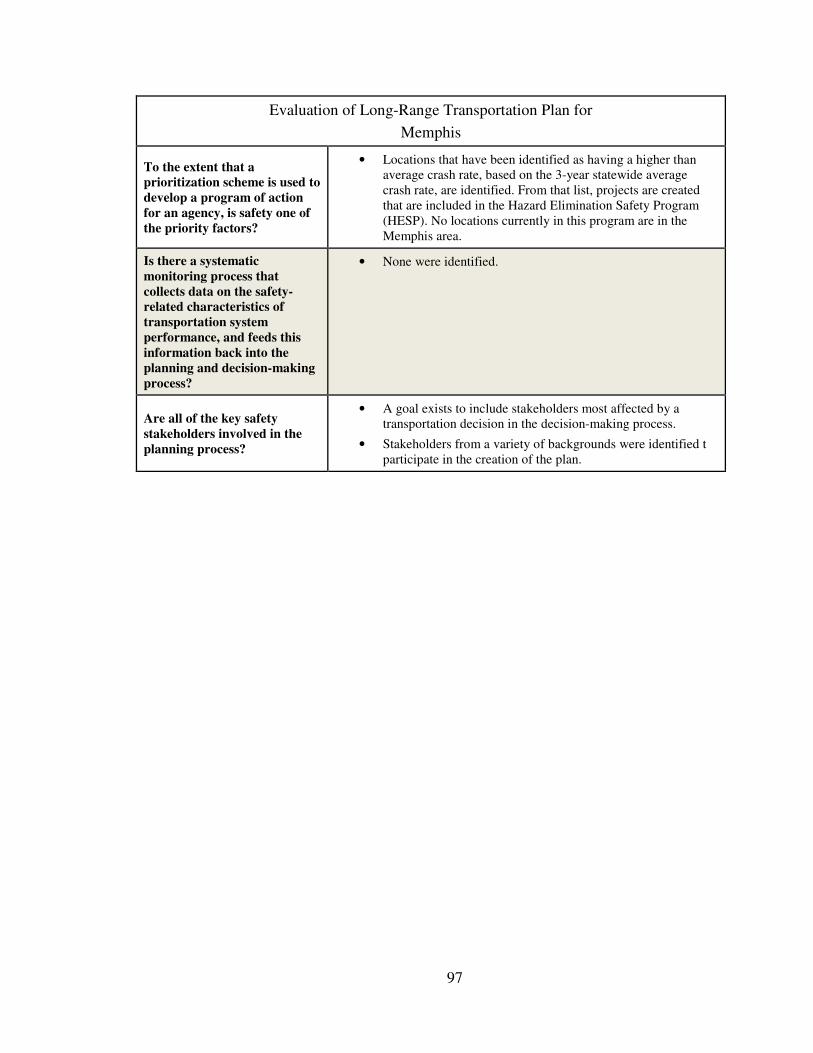
97
Evaluation of Long-Range Transportation Plan for
Memphis
To the extent that a
prioritization scheme is used to
develop a program of action
for an agency, is safety one of
the priority factors?
• Locations that have been identified as having a higher than average crash rate, based on the 3-year statewide average crash rate, are identified. From that list, projects are created that are included in the Hazard Elimination Safety Program (HESP). No locations currently in this program are in the Memphis area.
Is there a systematic
monitoring process that
collects data on the safety-
related characteristics of
transportation system
performance, and feeds this
information back into the
planning and decision-making
process?
• None were identified.
Are all of the key safety
stakeholders involved in the
planning process?
• A goal exists to include stakeholders most affected by a transportation decision in the decision-making process.
• Stakeholders from a variety of backgrounds were identified t participate in the creation of the plan.
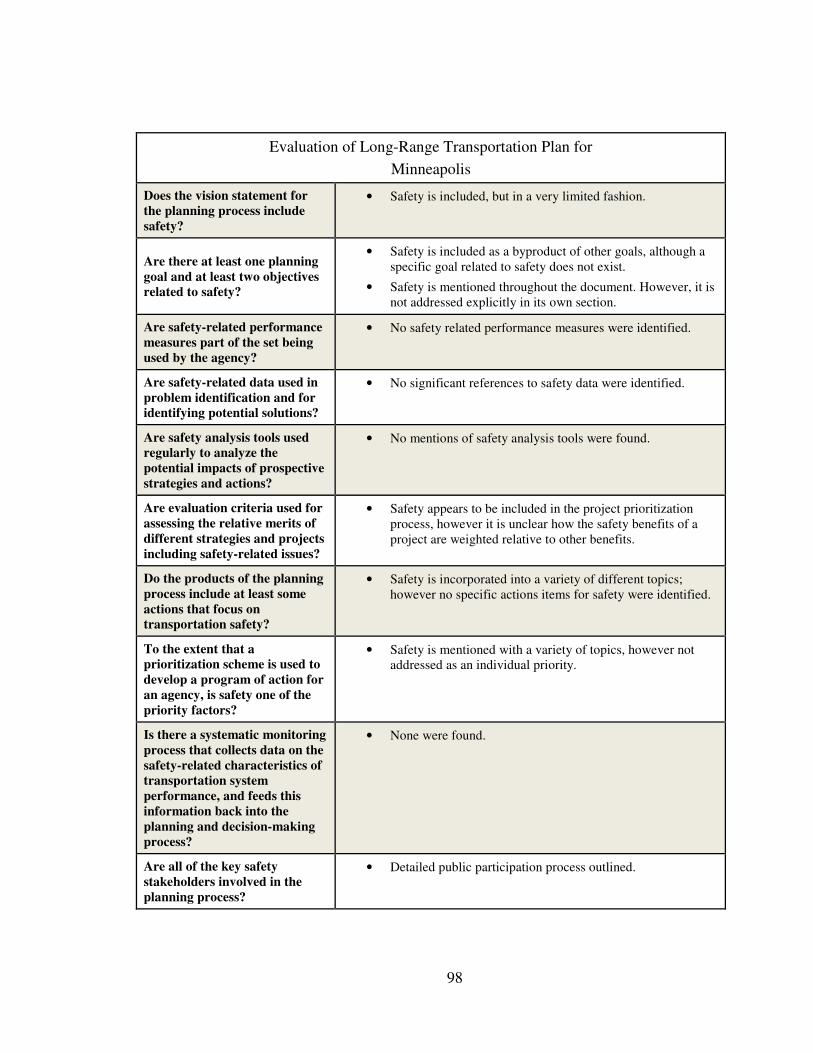
98
Evaluation of Long-Range Transportation Plan for
Minneapolis
Does the vision statement for
the planning process include
safety?
• Safety is included, but in a very limited fashion.
Are there at least one planning
goal and at least two objectives
related to safety?
• Safety is included as a byproduct of other goals, although a specific goal related to safety does not exist.
• Safety is mentioned throughout the document. However, it is not addressed explicitly in its own section.
Are safety-related performance
measures part of the set being
used by the agency?
• No safety related performance measures were identified.
Are safety-related data used in
problem identification and for
identifying potential solutions?
• No significant references to safety data were identified.
Are safety analysis tools used
regularly to analyze the
potential impacts of prospective
strategies and actions?
• No mentions of safety analysis tools were found.
Are evaluation criteria used for
assessing the relative merits of
different strategies and projects
including safety-related issues?
• Safety appears to be included in the project prioritization process, however it is unclear how the safety benefits of a project are weighted relative to other benefits.
Do the products of the planning
process include at least some
actions that focus on
transportation safety?
• Safety is incorporated into a variety of different topics; however no specific actions items for safety were identified.
To the extent that a
prioritization scheme is used to
develop a program of action for
an agency, is safety one of the
priority factors?
• Safety is mentioned with a variety of topics, however not addressed as an individual priority.
Is there a systematic monitoring
process that collects data on the
safety-related characteristics of
transportation system
performance, and feeds this
information back into the
planning and decision-making
process?
• None were found.
Are all of the key safety
stakeholders involved in the
planning process?
• Detailed public participation process outlined.
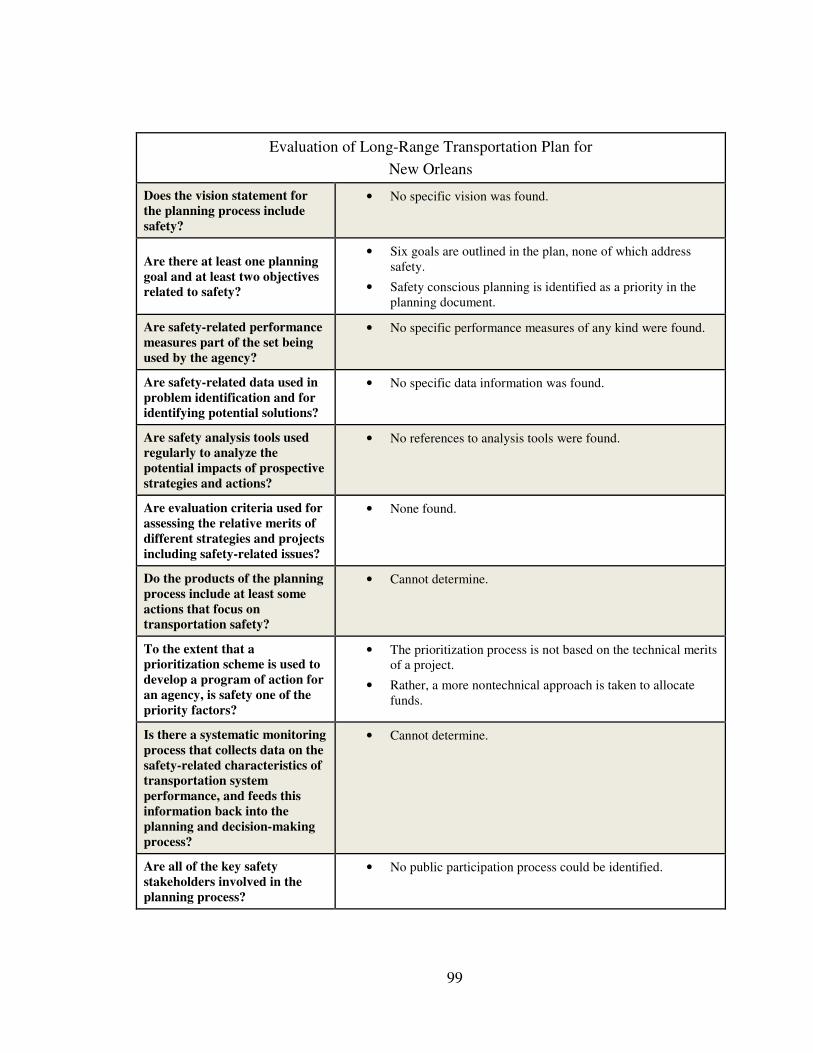
99
Evaluation of Long-Range Transportation Plan for
New Orleans
Does the vision statement for
the planning process include
safety?
• No specific vision was found.
Are there at least one planning
goal and at least two objectives
related to safety?
• Six goals are outlined in the plan, none of which address safety.
• Safety conscious planning is identified as a priority in the planning document.
Are safety-related performance
measures part of the set being
used by the agency?
• No specific performance measures of any kind were found.
Are safety-related data used in
problem identification and for
identifying potential solutions?
• No specific data information was found.
Are safety analysis tools used
regularly to analyze the
potential impacts of prospective
strategies and actions?
• No references to analysis tools were found.
Are evaluation criteria used for
assessing the relative merits of
different strategies and projects
including safety-related issues?
• None found.
Do the products of the planning
process include at least some
actions that focus on
transportation safety?
• Cannot determine.
To the extent that a
prioritization scheme is used to
develop a program of action for
an agency, is safety one of the
priority factors?
• The prioritization process is not based on the technical merits of a project.
• Rather, a more nontechnical approach is taken to allocate funds.
Is there a systematic monitoring
process that collects data on the
safety-related characteristics of
transportation system
performance, and feeds this
information back into the
planning and decision-making
process?
• Cannot determine.
Are all of the key safety
stakeholders involved in the
planning process?
• No public participation process could be identified.
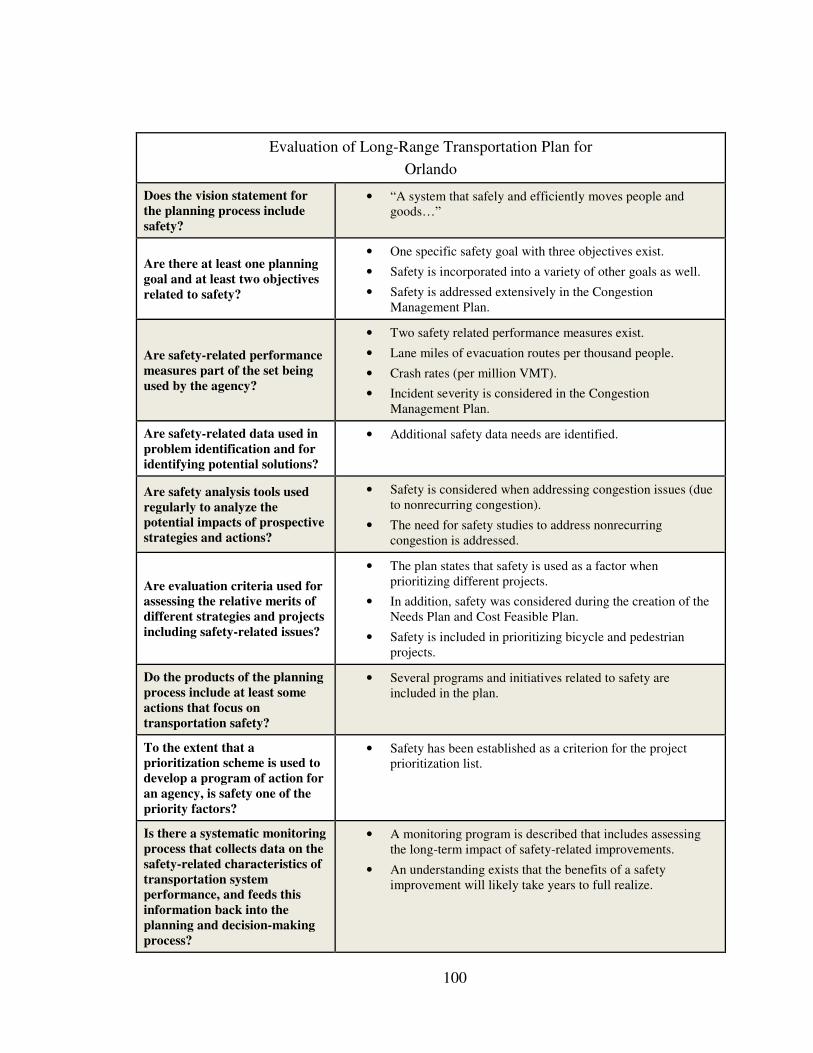
100
Evaluation of Long-Range Transportation Plan for
Orlando
Does the vision statement for
the planning process include
safety?
• “A system that safely and efficiently moves people and goods…”
Are there at least one planning
goal and at least two objectives
related to safety?
• One specific safety goal with three objectives exist.
• Safety is incorporated into a variety of other goals as well.
• Safety is addressed extensively in the Congestion Management Plan.
Are safety-related performance
measures part of the set being
used by the agency?
• Two safety related performance measures exist.
• Lane miles of evacuation routes per thousand people.
• Crash rates (per million VMT).
• Incident severity is considered in the Congestion Management Plan.
Are safety-related data used in
problem identification and for
identifying potential solutions?
• Additional safety data needs are identified.
Are safety analysis tools used
regularly to analyze the
potential impacts of prospective
strategies and actions?
• Safety is considered when addressing congestion issues (due to nonrecurring congestion).
• The need for safety studies to address nonrecurring congestion is addressed.
Are evaluation criteria used for
assessing the relative merits of
different strategies and projects
including safety-related issues?
• The plan states that safety is used as a factor when prioritizing different projects.
• In addition, safety was considered during the creation of the Needs Plan and Cost Feasible Plan.
• Safety is included in prioritizing bicycle and pedestrian projects.
Do the products of the planning
process include at least some
actions that focus on
transportation safety?
• Several programs and initiatives related to safety are included in the plan.
To the extent that a
prioritization scheme is used to
develop a program of action for
an agency, is safety one of the
priority factors?
• Safety has been established as a criterion for the project prioritization list.
Is there a systematic monitoring
process that collects data on the
safety-related characteristics of
transportation system
performance, and feeds this
information back into the
planning and decision-making
process?
• A monitoring program is described that includes assessing the long-term impact of safety-related improvements.
• An understanding exists that the benefits of a safety improvement will likely take years to full realize.

101
Evaluation of Long-Range Transportation Plan for
Orlando
Are all of the key safety
stakeholders involved in the
planning process?
• A detailed public involvement plan was created for the development of the most recent plan.
• An effort to coordinate safety campaigns throughout the region has been identified.
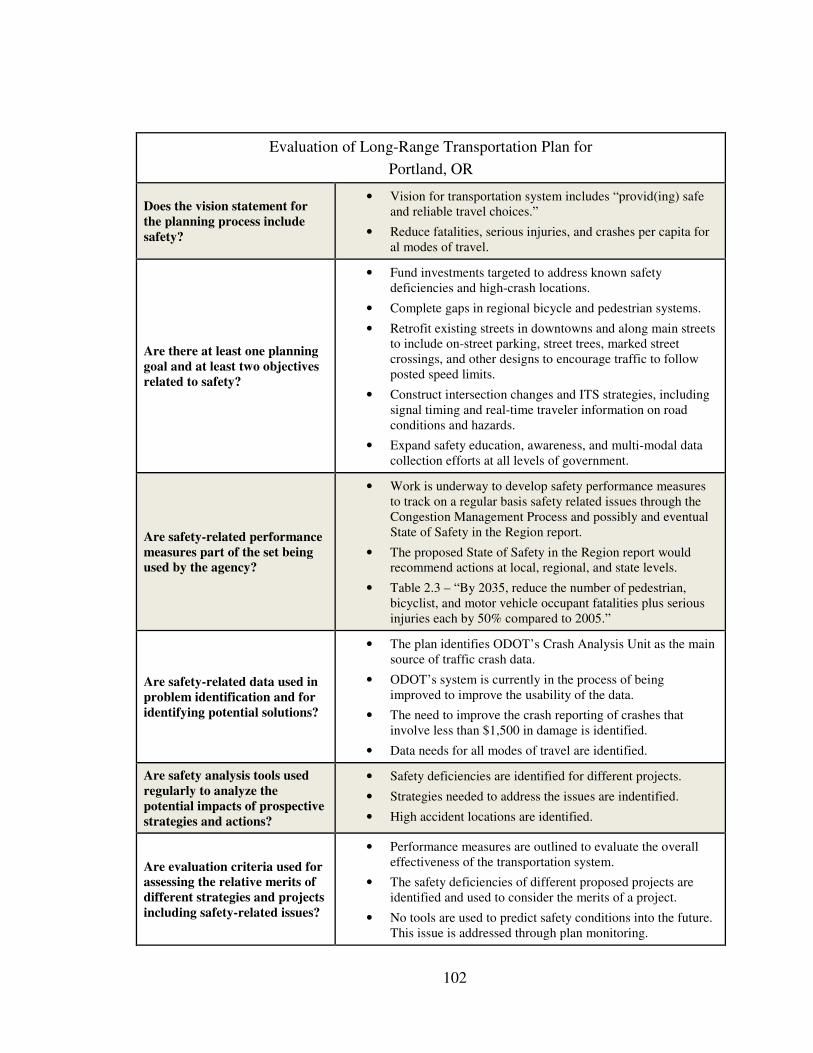
102
Evaluation of Long-Range Transportation Plan for
Portland, OR
Does the vision statement for
the planning process include
safety?
• Vision for transportation system includes “provid(ing) safe and reliable travel choices.”
• Reduce fatalities, serious injuries, and crashes per capita for al modes of travel.
Are there at least one planning
goal and at least two objectives
related to safety?
• Fund investments targeted to address known safety deficiencies and high-crash locations.
• Complete gaps in regional bicycle and pedestrian systems.
• Retrofit existing streets in downtowns and along main streets to include on-street parking, street trees, marked street crossings, and other designs to encourage traffic to follow posted speed limits.
• Construct intersection changes and ITS strategies, including signal timing and real-time traveler information on road conditions and hazards.
• Expand safety education, awareness, and multi-modal data collection efforts at all levels of government.
Are safety-related performance
measures part of the set being
used by the agency?
• Work is underway to develop safety performance measures to track on a regular basis safety related issues through the Congestion Management Process and possibly and eventual State of Safety in the Region report.
• The proposed State of Safety in the Region report would recommend actions at local, regional, and state levels.
• Table 2.3 – “By 2035, reduce the number of pedestrian, bicyclist, and motor vehicle occupant fatalities plus serious injuries each by 50% compared to 2005.”
Are safety-related data used in
problem identification and for
identifying potential solutions?
• The plan identifies ODOT’s Crash Analysis Unit as the main source of traffic crash data.
• ODOT’s system is currently in the process of being improved to improve the usability of the data.
• The need to improve the crash reporting of crashes that involve less than $1,500 in damage is identified.
• Data needs for all modes of travel are identified.
Are safety analysis tools used
regularly to analyze the
potential impacts of prospective
strategies and actions?
• Safety deficiencies are identified for different projects.
• Strategies needed to address the issues are indentified.
• High accident locations are identified.
Are evaluation criteria used for
assessing the relative merits of
different strategies and projects
including safety-related issues?
• Performance measures are outlined to evaluate the overall effectiveness of the transportation system.
• The safety deficiencies of different proposed projects are identified and used to consider the merits of a project.
• No tools are used to predict safety conditions into the future. This issue is addressed through plan monitoring.
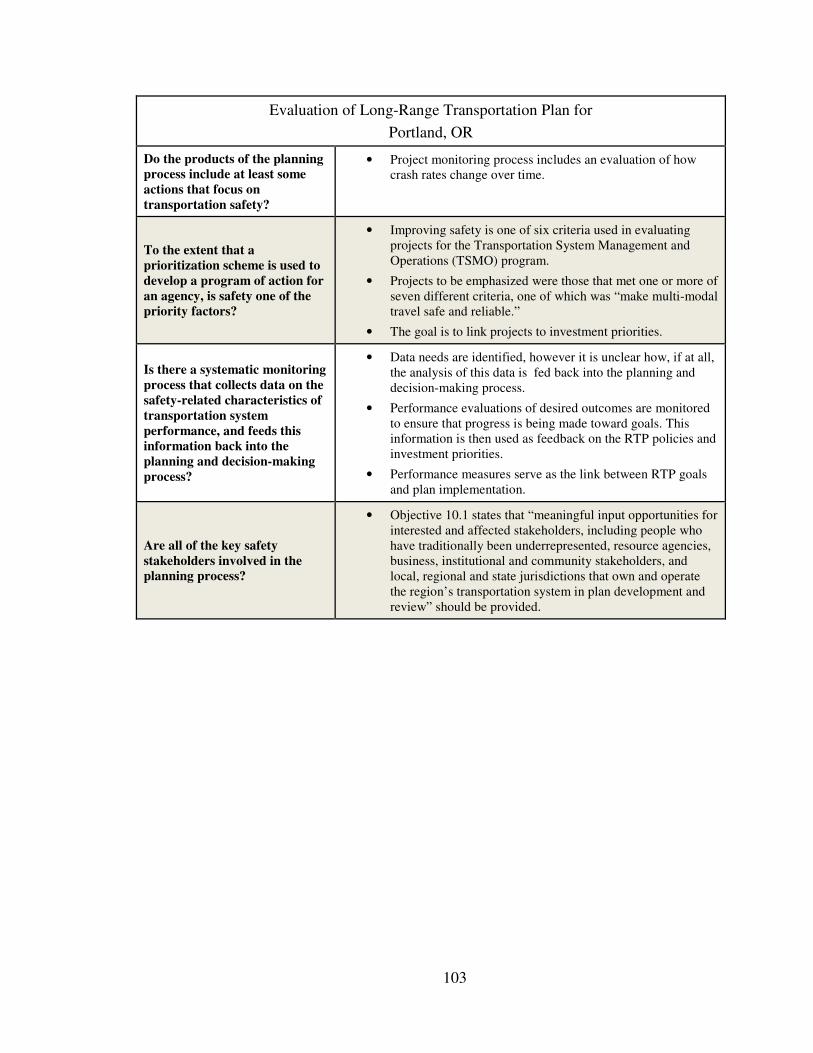
103
Evaluation of Long-Range Transportation Plan for
Portland, OR
Do the products of the planning
process include at least some
actions that focus on
transportation safety?
• Project monitoring process includes an evaluation of how crash rates change over time.
To the extent that a
prioritization scheme is used to
develop a program of action for
an agency, is safety one of the
priority factors?
• Improving safety is one of six criteria used in evaluating projects for the Transportation System Management and Operations (TSMO) program.
• Projects to be emphasized were those that met one or more of seven different criteria, one of which was “make multi-modal travel safe and reliable.”
• The goal is to link projects to investment priorities.
Is there a systematic monitoring
process that collects data on the
safety-related characteristics of
transportation system
performance, and feeds this
information back into the
planning and decision-making
process?
• Data needs are identified, however it is unclear how, if at all, the analysis of this data is fed back into the planning and decision-making process.
• Performance evaluations of desired outcomes are monitored to ensure that progress is being made toward goals. This information is then used as feedback on the RTP policies and investment priorities.
• Performance measures serve as the link between RTP goals and plan implementation.
Are all of the key safety
stakeholders involved in the
planning process?
• Objective 10.1 states that “meaningful input opportunities for interested and affected stakeholders, including people who have traditionally been underrepresented, resource agencies, business, institutional and community stakeholders, and local, regional and state jurisdictions that own and operate the region’s transportation system in plan development and review” should be provided.
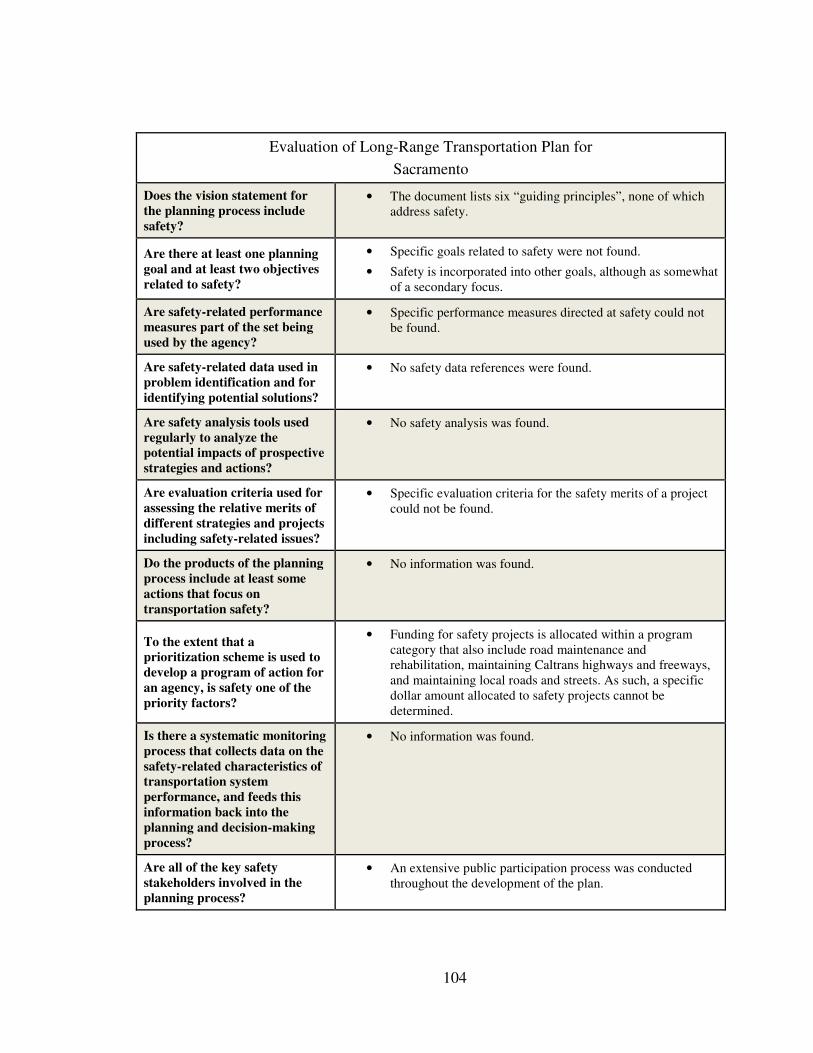
104
Evaluation of Long-Range Transportation Plan for
Sacramento
Does the vision statement for
the planning process include
safety?
• The document lists six “guiding principles”, none of which address safety.
Are there at least one planning
goal and at least two objectives
related to safety?
• Specific goals related to safety were not found.
• Safety is incorporated into other goals, although as somewhat of a secondary focus.
Are safety-related performance
measures part of the set being
used by the agency?
• Specific performance measures directed at safety could not be found.
Are safety-related data used in
problem identification and for
identifying potential solutions?
• No safety data references were found.
Are safety analysis tools used
regularly to analyze the
potential impacts of prospective
strategies and actions?
• No safety analysis was found.
Are evaluation criteria used for
assessing the relative merits of
different strategies and projects
including safety-related issues?
• Specific evaluation criteria for the safety merits of a project could not be found.
Do the products of the planning
process include at least some
actions that focus on
transportation safety?
• No information was found.
To the extent that a
prioritization scheme is used to
develop a program of action for
an agency, is safety one of the
priority factors?
• Funding for safety projects is allocated within a program category that also include road maintenance and rehabilitation, maintaining Caltrans highways and freeways, and maintaining local roads and streets. As such, a specific dollar amount allocated to safety projects cannot be determined.
Is there a systematic monitoring
process that collects data on the
safety-related characteristics of
transportation system
performance, and feeds this
information back into the
planning and decision-making
process?
• No information was found.
Are all of the key safety
stakeholders involved in the
planning process?
• An extensive public participation process was conducted throughout the development of the plan.
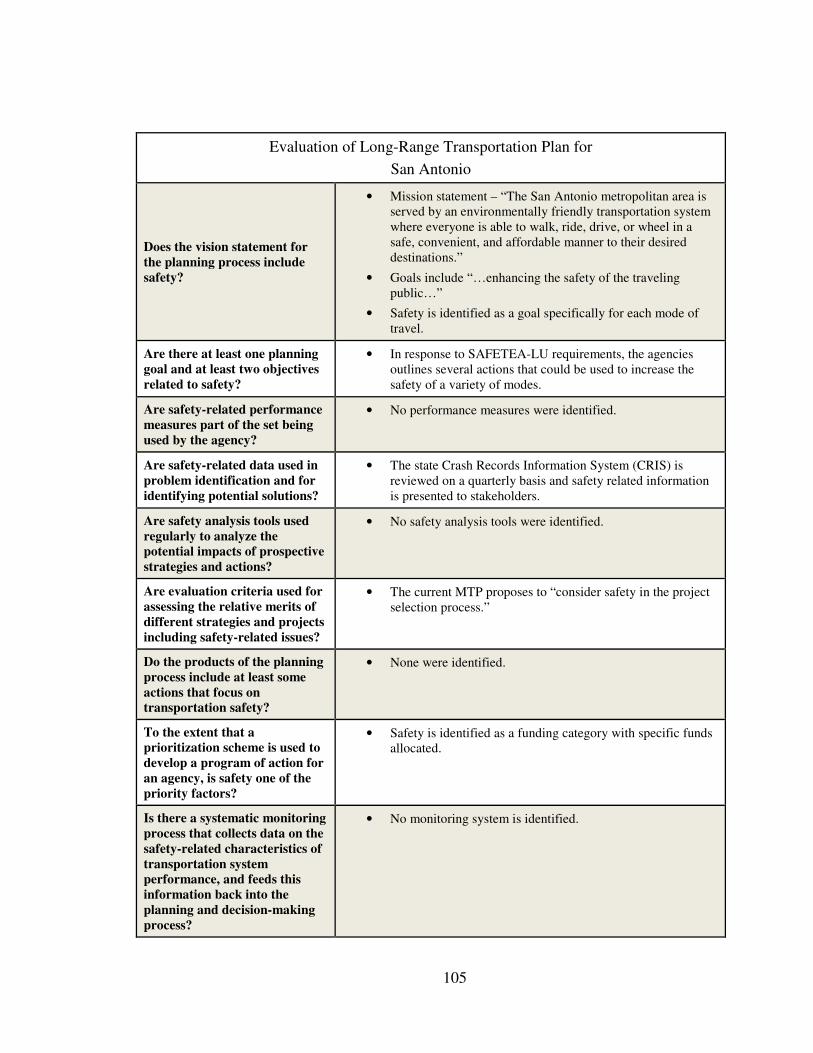
105
Evaluation of Long-Range Transportation Plan for
San Antonio
Does the vision statement for
the planning process include
safety?
• Mission statement – “The San Antonio metropolitan area is served by an environmentally friendly transportation system where everyone is able to walk, ride, drive, or wheel in a safe, convenient, and affordable manner to their desired destinations.”
• Goals include “…enhancing the safety of the traveling public…”
• Safety is identified as a goal specifically for each mode of travel.
Are there at least one planning
goal and at least two objectives
related to safety?
• In response to SAFETEA-LU requirements, the agencies outlines several actions that could be used to increase the safety of a variety of modes.
Are safety-related performance
measures part of the set being
used by the agency?
• No performance measures were identified.
Are safety-related data used in
problem identification and for
identifying potential solutions?
• The state Crash Records Information System (CRIS) is reviewed on a quarterly basis and safety related information is presented to stakeholders.
Are safety analysis tools used
regularly to analyze the
potential impacts of prospective
strategies and actions?
• No safety analysis tools were identified.
Are evaluation criteria used for
assessing the relative merits of
different strategies and projects
including safety-related issues?
• The current MTP proposes to “consider safety in the project selection process.”
Do the products of the planning
process include at least some
actions that focus on
transportation safety?
• None were identified.
To the extent that a
prioritization scheme is used to
develop a program of action for
an agency, is safety one of the
priority factors?
• Safety is identified as a funding category with specific funds allocated.
Is there a systematic monitoring
process that collects data on the
safety-related characteristics of
transportation system
performance, and feeds this
information back into the
planning and decision-making
process?
• No monitoring system is identified.

106
Evaluation of Long-Range Transportation Plan for
San Antonio
Are all of the key safety
stakeholders involved in the
planning process?
• A public involvement process is outlined with the purpose of including the public early, continuously, and in a meaningful way for all transportation related projects.
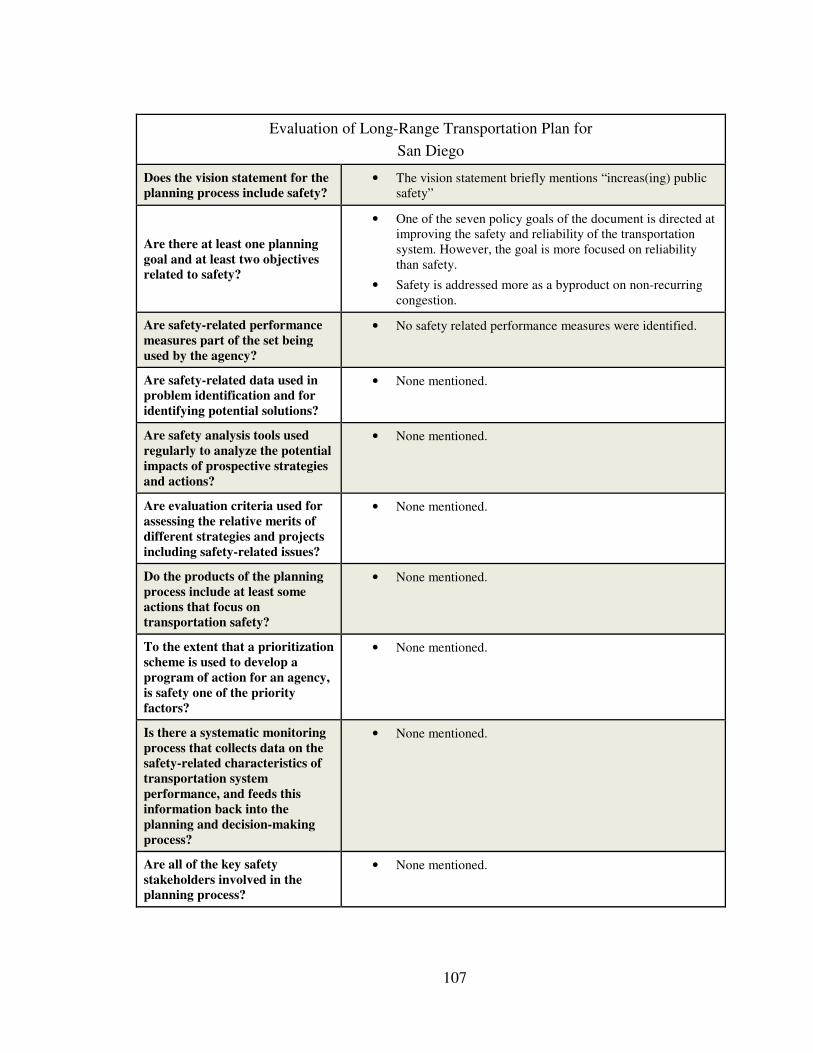
107
Evaluation of Long-Range Transportation Plan for
San Diego
Does the vision statement for the
planning process include safety?
• The vision statement briefly mentions “increas(ing) public safety”
Are there at least one planning
goal and at least two objectives
related to safety?
• One of the seven policy goals of the document is directed at improving the safety and reliability of the transportation system. However, the goal is more focused on reliability than safety.
• Safety is addressed more as a byproduct on non-recurring congestion.
Are safety-related performance
measures part of the set being
used by the agency?
• No safety related performance measures were identified.
Are safety-related data used in
problem identification and for
identifying potential solutions?
• None mentioned.
Are safety analysis tools used
regularly to analyze the potential
impacts of prospective strategies
and actions?
• None mentioned.
Are evaluation criteria used for
assessing the relative merits of
different strategies and projects
including safety-related issues?
• None mentioned.
Do the products of the planning
process include at least some
actions that focus on
transportation safety?
• None mentioned.
To the extent that a prioritization
scheme is used to develop a
program of action for an agency,
is safety one of the priority
factors?
• None mentioned.
Is there a systematic monitoring
process that collects data on the
safety-related characteristics of
transportation system
performance, and feeds this
information back into the
planning and decision-making
process?
• None mentioned.
Are all of the key safety
stakeholders involved in the
planning process?
• None mentioned.
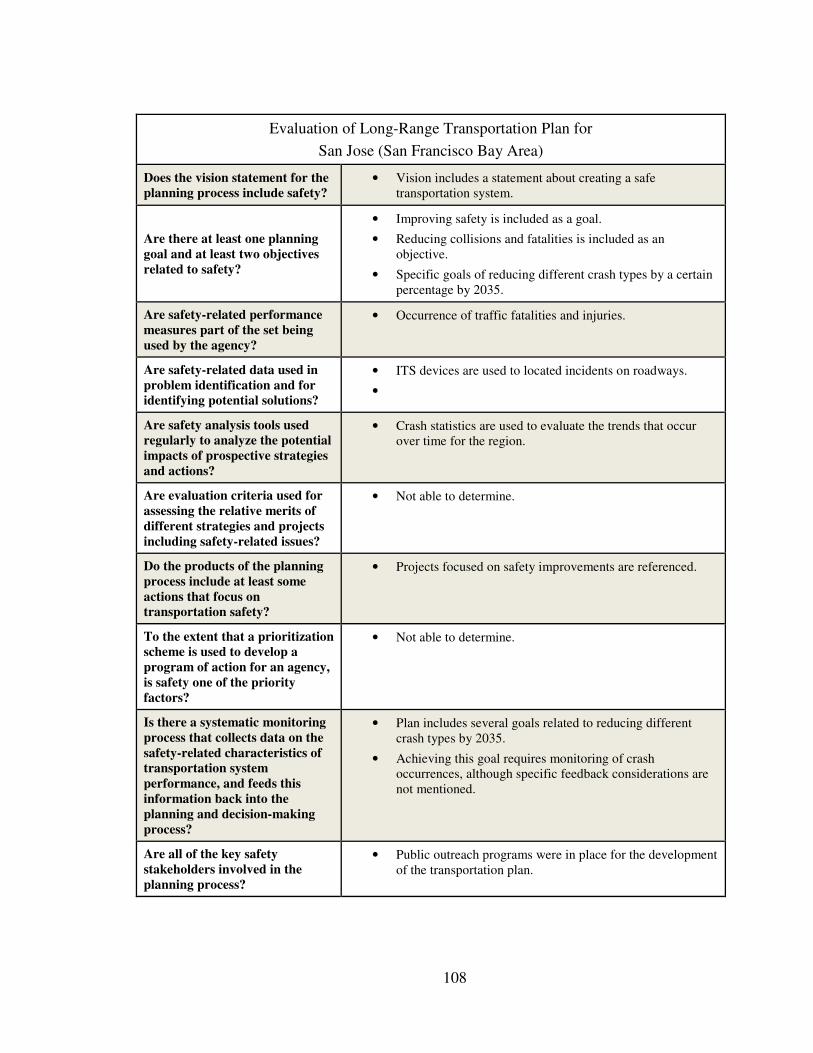
108
Evaluation of Long-Range Transportation Plan for
San Jose (San Francisco Bay Area)
Does the vision statement for the
planning process include safety?
• Vision includes a statement about creating a safe transportation system.
Are there at least one planning
goal and at least two objectives
related to safety?
• Improving safety is included as a goal.
• Reducing collisions and fatalities is included as an objective.
• Specific goals of reducing different crash types by a certain percentage by 2035.
Are safety-related performance
measures part of the set being
used by the agency?
• Occurrence of traffic fatalities and injuries.
Are safety-related data used in
problem identification and for
identifying potential solutions?
• ITS devices are used to located incidents on roadways.
•
Are safety analysis tools used
regularly to analyze the potential
impacts of prospective strategies
and actions?
• Crash statistics are used to evaluate the trends that occur over time for the region.
Are evaluation criteria used for
assessing the relative merits of
different strategies and projects
including safety-related issues?
• Not able to determine.
Do the products of the planning
process include at least some
actions that focus on
transportation safety?
• Projects focused on safety improvements are referenced.
To the extent that a prioritization
scheme is used to develop a
program of action for an agency,
is safety one of the priority
factors?
• Not able to determine.
Is there a systematic monitoring
process that collects data on the
safety-related characteristics of
transportation system
performance, and feeds this
information back into the
planning and decision-making
process?
• Plan includes several goals related to reducing different crash types by 2035.
• Achieving this goal requires monitoring of crash occurrences, although specific feedback considerations are not mentioned.
Are all of the key safety
stakeholders involved in the
planning process?
• Public outreach programs were in place for the development of the transportation plan.
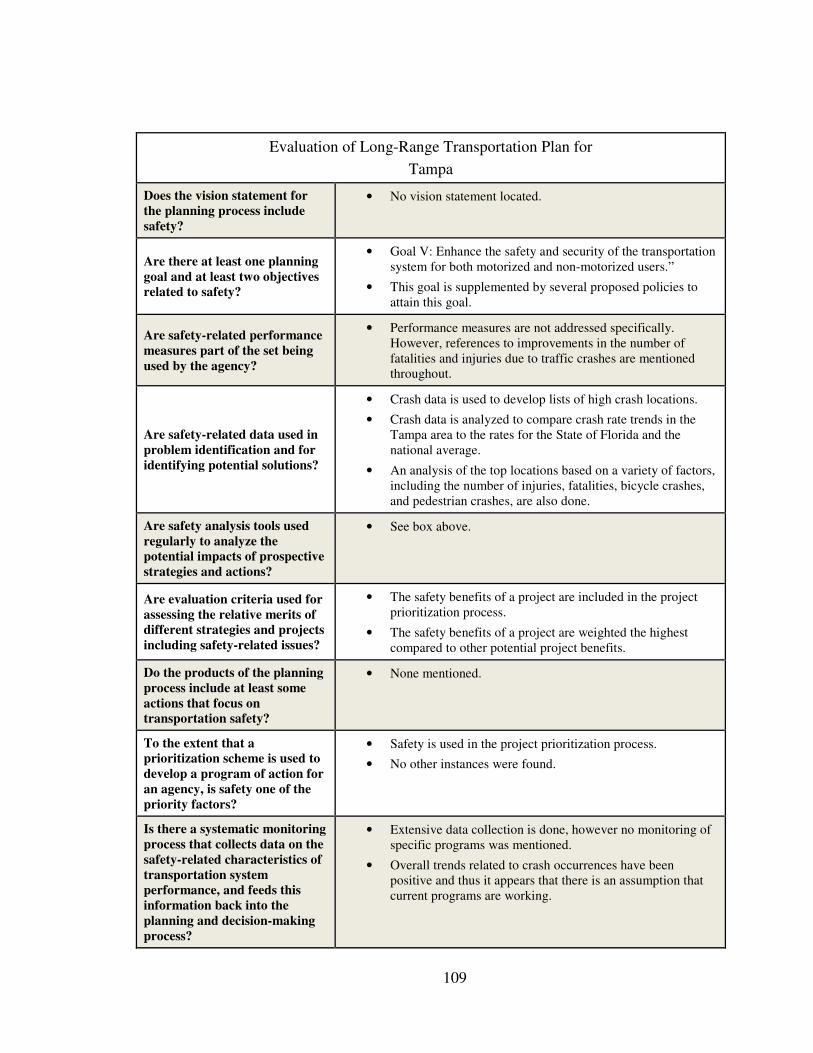
109
Evaluation of Long-Range Transportation Plan for
Tampa
Does the vision statement for
the planning process include
safety?
• No vision statement located.
Are there at least one planning
goal and at least two objectives
related to safety?
• Goal V: Enhance the safety and security of the transportation system for both motorized and non-motorized users.”
• This goal is supplemented by several proposed policies to attain this goal.
Are safety-related performance
measures part of the set being
used by the agency?
• Performance measures are not addressed specifically. However, references to improvements in the number of fatalities and injuries due to traffic crashes are mentioned throughout.
Are safety-related data used in
problem identification and for
identifying potential solutions?
• Crash data is used to develop lists of high crash locations.
• Crash data is analyzed to compare crash rate trends in the Tampa area to the rates for the State of Florida and the national average.
• An analysis of the top locations based on a variety of factors, including the number of injuries, fatalities, bicycle crashes, and pedestrian crashes, are also done.
Are safety analysis tools used
regularly to analyze the
potential impacts of prospective
strategies and actions?
• See box above.
Are evaluation criteria used for
assessing the relative merits of
different strategies and projects
including safety-related issues?
• The safety benefits of a project are included in the project prioritization process.
• The safety benefits of a project are weighted the highest compared to other potential project benefits.
Do the products of the planning
process include at least some
actions that focus on
transportation safety?
• None mentioned.
To the extent that a
prioritization scheme is used to
develop a program of action for
an agency, is safety one of the
priority factors?
• Safety is used in the project prioritization process.
• No other instances were found.
Is there a systematic monitoring
process that collects data on the
safety-related characteristics of
transportation system
performance, and feeds this
information back into the
planning and decision-making
process?
• Extensive data collection is done, however no monitoring of specific programs was mentioned.
• Overall trends related to crash occurrences have been positive and thus it appears that there is an assumption that current programs are working.

110
Evaluation of Long-Range Transportation Plan for
Tampa
Are all of the key safety
stakeholders involved in the
planning process?
• An objective of the agency is to “support community education and involvement in transportation planning.”
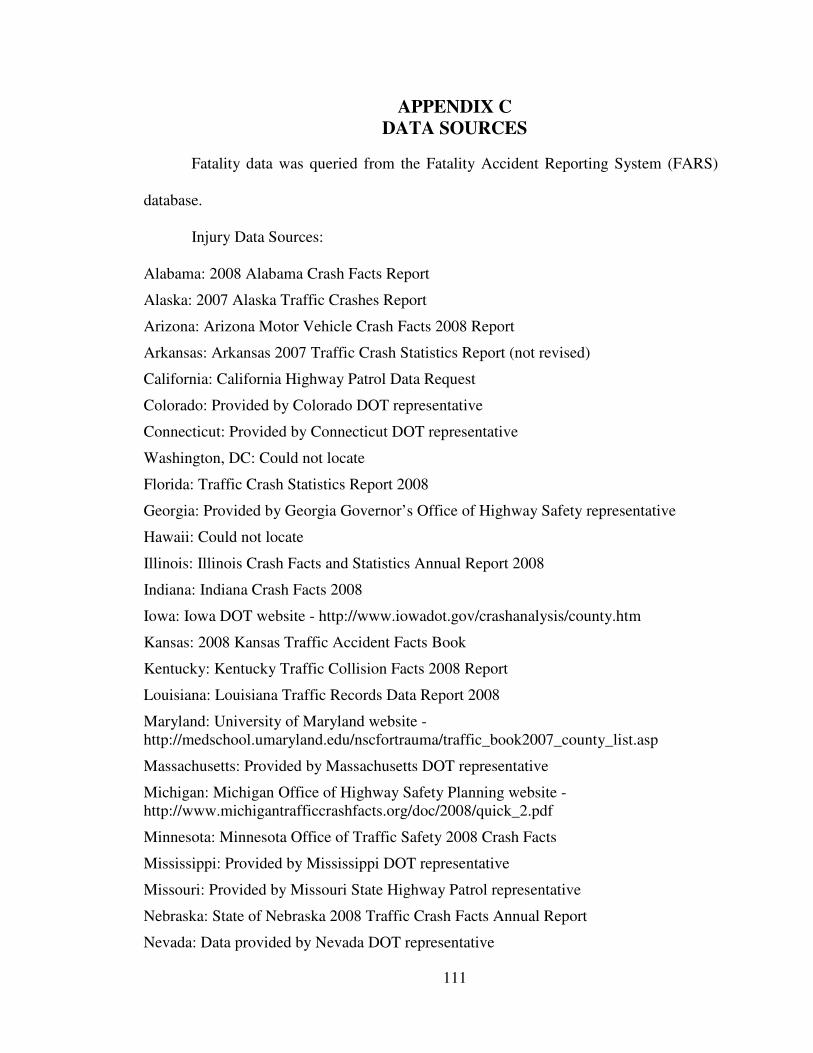
111
APPENDIX C
DATA SOURCES
Fatality data was queried from the Fatality Accident Reporting System (FARS)
database.
Injury Data Sources:
Alabama: 2008 Alabama Crash Facts Report
Alaska: 2007 Alaska Traffic Crashes Report
Arizona: Arizona Motor Vehicle Crash Facts 2008 Report
Arkansas: Arkansas 2007 Traffic Crash Statistics Report (not revised)
California: California Highway Patrol Data Request
Colorado: Provided by Colorado DOT representative
Connecticut: Provided by Connecticut DOT representative
Washington, DC: Could not locate
Florida: Traffic Crash Statistics Report 2008
Georgia: Provided by Georgia Governor’s Office of Highway Safety representative
Hawaii: Could not locate
Illinois: Illinois Crash Facts and Statistics Annual Report 2008
Indiana: Indiana Crash Facts 2008
Iowa: Iowa DOT website - http://www.iowadot.gov/crashanalysis/county.htm
Kansas: 2008 Kansas Traffic Accident Facts Book
Kentucky: Kentucky Traffic Collision Facts 2008 Report
Louisiana: Louisiana Traffic Records Data Report 2008
Maryland: University of Maryland website - http://medschool.umaryland.edu/nscfortrauma/traffic_book2007_county_list.asp
Massachusetts: Provided by Massachusetts DOT representative
Michigan: Michigan Office of Highway Safety Planning website - http://www.michigantrafficcrashfacts.org/doc/2008/quick_2.pdf
Minnesota: Minnesota Office of Traffic Safety 2008 Crash Facts
Mississippi: Provided by Mississippi DOT representative
Missouri: Provided by Missouri State Highway Patrol representative
Nebraska: State of Nebraska 2008 Traffic Crash Facts Annual Report
Nevada: Data provided by Nevada DOT representative
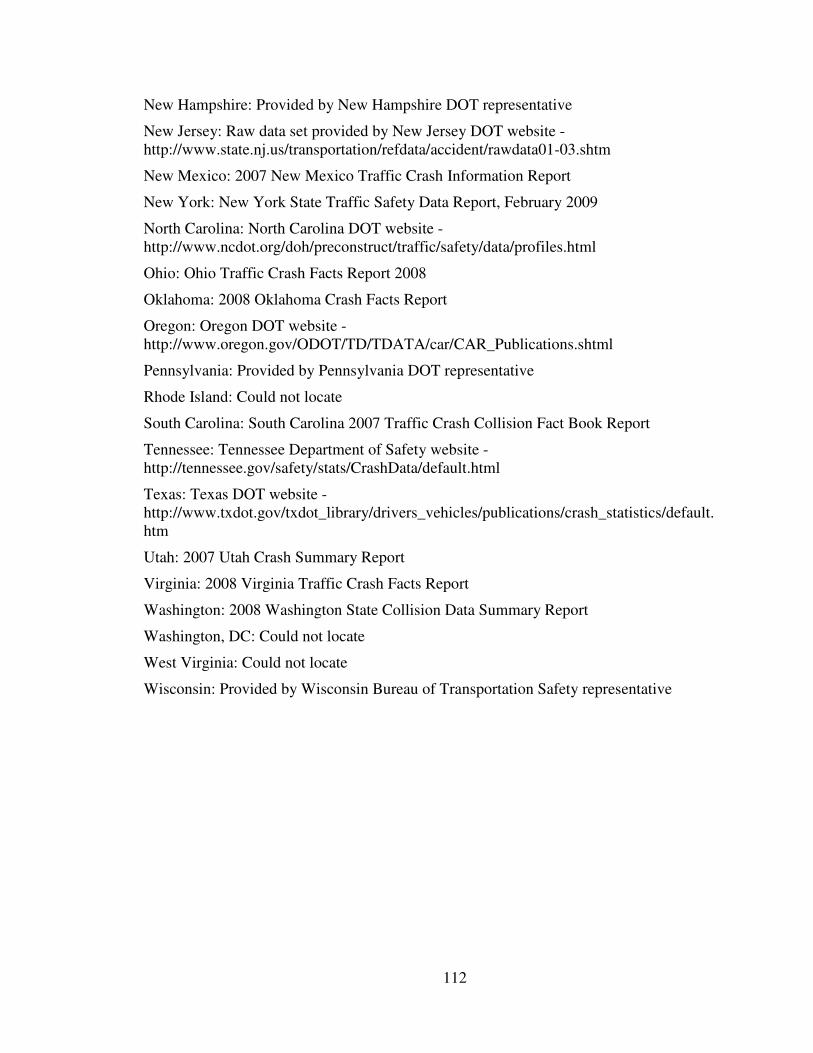
112
New Hampshire: Provided by New Hampshire DOT representative
New Jersey: Raw data set provided by New Jersey DOT website - http://www.state.nj.us/transportation/refdata/accident/rawdata01-03.shtm
New Mexico: 2007 New Mexico Traffic Crash Information Report
New York: New York State Traffic Safety Data Report, February 2009
North Carolina: North Carolina DOT website - http://www.ncdot.org/doh/preconstruct/traffic/safety/data/profiles.html
Ohio: Ohio Traffic Crash Facts Report 2008
Oklahoma: 2008 Oklahoma Crash Facts Report
Oregon: Oregon DOT website - http://www.oregon.gov/ODOT/TD/TDATA/car/CAR_Publications.shtml
Pennsylvania: Provided by Pennsylvania DOT representative
Rhode Island: Could not locate
South Carolina: South Carolina 2007 Traffic Crash Collision Fact Book Report
Tennessee: Tennessee Department of Safety website - http://tennessee.gov/safety/stats/CrashData/default.html
Texas: Texas DOT website - http://www.txdot.gov/txdot_library/drivers_vehicles/publications/crash_statistics/default.htm
Utah: 2007 Utah Crash Summary Report
Virginia: 2008 Virginia Traffic Crash Facts Report
Washington: 2008 Washington State Collision Data Summary Report
Washington, DC: Could not locate
West Virginia: Could not locate
Wisconsin: Provided by Wisconsin Bureau of Transportation Safety representative
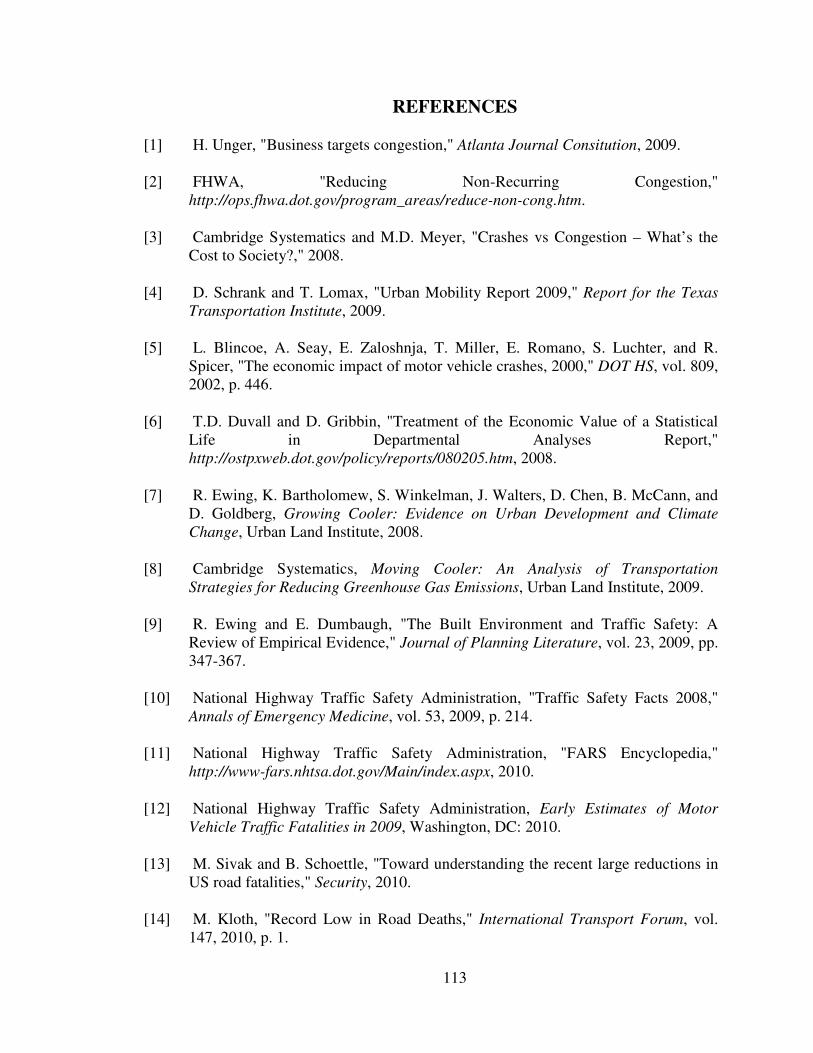
113
REFERENCES
[1] H. Unger, "Business targets congestion," Atlanta Journal Consitution, 2009.
[2] FHWA, "Reducing Non-Recurring Congestion," http://ops.fhwa.dot.gov/program_areas/reduce-non-cong.htm.
[3] Cambridge Systematics and M.D. Meyer, "Crashes vs Congestion – What’s the Cost to Society?," 2008.
[4] D. Schrank and T. Lomax, "Urban Mobility Report 2009," Report for the Texas
Transportation Institute, 2009.
[5] L. Blincoe, A. Seay, E. Zaloshnja, T. Miller, E. Romano, S. Luchter, and R. Spicer, "The economic impact of motor vehicle crashes, 2000," DOT HS, vol. 809, 2002, p. 446.
[6] T.D. Duvall and D. Gribbin, "Treatment of the Economic Value of a Statistical Life in Departmental Analyses Report," http://ostpxweb.dot.gov/policy/reports/080205.htm, 2008.
[7] R. Ewing, K. Bartholomew, S. Winkelman, J. Walters, D. Chen, B. McCann, and D. Goldberg, Growing Cooler: Evidence on Urban Development and Climate
Change, Urban Land Institute, 2008.
[8] Cambridge Systematics, Moving Cooler: An Analysis of Transportation
Strategies for Reducing Greenhouse Gas Emissions, Urban Land Institute, 2009.
[9] R. Ewing and E. Dumbaugh, "The Built Environment and Traffic Safety: A Review of Empirical Evidence," Journal of Planning Literature, vol. 23, 2009, pp. 347-367.
[10] National Highway Traffic Safety Administration, "Traffic Safety Facts 2008," Annals of Emergency Medicine, vol. 53, 2009, p. 214.
[11] National Highway Traffic Safety Administration, "FARS Encyclopedia," http://www-fars.nhtsa.dot.gov/Main/index.aspx, 2010.
[12] National Highway Traffic Safety Administration, Early Estimates of Motor
Vehicle Traffic Fatalities in 2009, Washington, DC: 2010.
[13] M. Sivak and B. Schoettle, "Toward understanding the recent large reductions in US road fatalities," Security, 2010.
[14] M. Kloth, "Record Low in Road Deaths," International Transport Forum, vol. 147, 2010, p. 1.
114
[15] U.S. Census Bureau, "Census 2000 Urban and Rural Classification," http://www.census.gov/geo/www/ua/ua_2k.html%20, 2009.
[16] Federal Highway Administration, "Motor Vehicle Accident Costs," http://safety.fhwa.dot.gov/facts_stats/t75702.cfm, 1994, p. 4.
[17] J.R. Mrozek and L.O. Taylor, "What determines the value of life? a meta-analysis," Journal of Policy Analysis and Management, vol. 21, 2002, pp. 253-270.
[18] T. Miller, "Variations between countries in values of statistical life," Journal of
Transport Economics and Policy, 2000, p. 169–188.
[19] W.K. Viscusi, "The Value of Life: Estimates with Risks by Occupation and Industry," SSRN Electronic Journal, 2003.
[20] I. Kochi, B. Hubbell, and R. Kramer, "An Empirical Bayes Approach to Combining and Comparing Estimates of the Value of a Statistical Life for Environmental Policy Analysis," Environmental & Resource Economics, vol. 34, 2006, pp. 385-406.
[21] W.K. Viscusi and J.E. Aldy, "The Value of a Statistical Life: A Critical Review of Market Estimates throughout the World," SSRN Electronic Journal, 2002.
[22] S. Washington, I. Van Schalkwyk, S. Mitra, M.D. Meyer, E. Dumbaugh, and M. Zoll, "Incorporating Safety Into Long-Range Transportation Planning," trb.org, 2006.
[23] K. Noerager and W. Lyons, "Evaluation of Statewide Long-Range Transportation Plans," Transportation, 2002.
[24] D.L. Gaines and M.D. Meyer, "Safety-Conscious Planning in Midsized Metropolitan Areas - Technical and Institutional Challenges," Transportation
Research Record, 2008, pp. 1-7.
[25] L. Rodriquez and M. Andreson-Wilk, "Communicating Highway Safety: What Works," Safety Management, 2002.