the economic benefits of parks, trails, and conserved open ... economic... · the economic benefits...
TRANSCRIPT
The economic benefits of parks, trails, and conserved open spaces in Beaufort County, South Carolina

DR
AF
T

The economic benefits of parks, trails, and conserved open spaces in Beaufort County, South Carolina
The Trust for Public Land
January 2018
Printed on 100% recycled paper ©2018 The Trust for Public Land

DR
AF
T
The Trust for Public Land creates parks
and protects land for people,
ensuring healthy, livable communities
for generations to come.
The Trust for Public Land’s Conservation Economics team has extensive experience measuring the economic benefits and fiscal impacts of land conservation. Partnering with The Trust for Public Land’s award-winning GIS team, the Conservation Economics team has published over 40 economic analyses for jurisdictions throughout the country, including communities in Alabama, Arizona, California, Colorado, Georgia, Illinois, Kansas, Kentucky, Maine, Massachusetts, Minnesota, Missouri, New Hampshire, New Jersey, New York, North Carolina, Ohio, Pennsylvania, Tennessee, Texas, Virginia, Washington, and Wyoming.
The Trust for Public Land has advanced this research working with leading academic partners and research institutions, including Colorado State University, Dartmouth College, Georgia Institute of Technology, Michigan State University, University of California, Davis, University of Georgia, Texas A&M, University of Minnesota, University of New Hampshire, University of Wyoming, and the U.S. Forest Service.
tpl.org/beaufort-county-economic-benefits

AcknowledgmentsThis project would not have been possible without generous support from the Doris Duke Charitable Foundation, Gaylord and Dorothy Donnelley Foundation, and Beaufort County Open Land Trust.
The Trust for Public Land gratefully acknowledges all of the individuals who contribut-ed their time, energy, and ideas toward the creation of this report. The working group below guided the report and provided input throughout the various phases of the report’s production, including scoping, data collection, and review.
Mark Baker, ASLABarbara G. HolmesLisa J. Lord, CWB®
Michael Mathews Robert Merchant Ed Pappas
President, Wood + PartnersDirector of Land Protection, Beaufort County Open Land TrustFormer Director of Land Protection, Beaufort County Open Land TrustChairman, Rural and Critical Land Preservation BoardLong Range Planner / Development Review Planner, Beaufort County Department of Planning and DevelopmentFormer Chairman, Rural and Critical Land Preservation Board

DR
AF
T

1the economic benefits of parks, trails, and conserved open spaces in beaufort county, south carolina
Table of contents
Executive summary .......................................................................................................... 2
Map .................................................................................................................................... 5
Introduction ...................................................................................................................... 6
Enhanced property value ............................................................................................... 9
Stormwater infiltration ................................................................................................... 12
Air pollution .................................................................................................................... 16
Tourism ............................................................................................................................ 18
Recreational use ............................................................................................................. 21
Health care cost savings ................................................................................................ 24
Economic development ................................................................................................ 28
Farming ........................................................................................................................... 32
Defense ........................................................................................................................... 35
Conclusion ...................................................................................................................... 37
Bibliography ................................................................................................................... 38
Appendix A. Recreational use and health care cost savings questionnaire ........... 43
Appendix B. Expanded economic development analysis ........................................ 46

the economic benefits of parks, trails, and conserved open spaces in beaufort county, south carolina2
Executive summaryPARKS, TRAILS, AND CONSERVED OPEN SPACES ARE VALUABLE COMPONENTS of healthy, flourishing communities. This report analyzes these amenities in Beaufort County and documents a selection of the significant economic benefits that they provide to the community. This analysis includes places like Hunting Island State Park, Henry C. Chambers Waterfront Park, the Spanish Moss Trail, Oyster Factory Park, and Chaplin Community Park as well as all lands acquired through the Beaufort County Rural and Critical Land Preservation Program (RCLPP). Parks, trails, and conserved open spaces in Beaufort County enhance property values, infiltrate stormwater, improve air quality, attract visitors to the county, provide recreational opportunities for residents, improve human health, boost economic development, and bolster the farming and defense industries. These amenities support local jobs, increase spending at local businesses, save residents money, and generate local tax revenue. Specifically, the parks, trails, and conserved open spaces in Beaufort County, as pictured in Exhibit 1 , produce the following economic benefits (Table 1 ):1
• Parks, trails, and conserved open spaces increase the value of nearby residential properties in Beaufort County because people enjoy living close to these amenities and are willing to pay for this proximity. Parks, trails, and conserved open spaces in Beaufort County raise the value of nearby homes by a total of $127 million and increase property tax revenues by $1.12 million a year (see Table 2 ). As a subset of the total, Rural and Critical Lands (RCL) are responsible for an increase in property values of $22.5 million and a $174,000 boost tax to revenues (see Table 3 ).
• Parks and conserved lands reduce stormwater by capturing precipitation, slowing its runoff, and reducing the volume of water that enters the stormwater system. Parks, trails, and conserved open spaces provide stormwater infiltration valued at a total of $27.4 million annually, $8.10 million of which is generated by RCL (see Tables 5 and 6 ).
• Trees and shrubs in parks and open spaces remove air pollutants that endanger human health and damage structures. Such spaces provide health benefits and reduce pollution control costs in Beaufort County by a total of $317,000 per year, $72,900 of which is generated by RCL (see Tables 7 and 8 ).
• Tourism is a key component of the Beaufort County economy. At least 9 percent of visitors to Beaufort County come primarily to visit parks, trails, and conserved open spaces. These visitors are estimated to spend $116 million annually in Beaufort County and generate $3.46 million in local tax revenues (see Table 9 ).
• Residents of Beaufort County also enjoy parks, trails, and conserved open spaces. Each year, residents of Beaufort County receive a benefit of $16.8 million for the recreational use of these amenities (see Table 11 ).
• According to the Robert Wood Johnson Foundation, Beaufort is the healthiest county in South Carolina; however, even in this top-ranking county, physical inactivity and obesity are challenging health problems that exist, and parks can help address them. Research shows that park and trail use translates into increased physical activity, resulting in medical care cost savings. All Beaufort County residents who visit parks, trails, and conserved open spaces improve their health. Approximately 5,790 adult residents exclusively use these spaces in Beaufort County to engage in physical activity at a level sufficient to generate measurable health benefits. This yields an annual medical cost savings of $7.91 million (see Table 12 ).
1 The values of the economic benefits estimated in this analysis are reported in 2017 dollars.

3the economic benefits of parks, trails, and conserved open spaces in beaufort county, south carolina
• Parks, trails, and conserved open spaces contribute to the high quality of life in Beaufort County, which plays an important role in attracting business and employees to the county. These assets also enhance the robust recreation economy. By providing opportunities for recreation, these amenities support $12.8 million in resident spending on sports, recreation, and exercise equipment annually. Resident and tourist spending supports 71 sporting goods stores that generate $102 million in sales and provide 595 jobs, further demonstrating that parks, trails, and conserved open spaces are significant contributors to the Beaufort County economy.
• Land conservation supports the farming industry in Beaufort County by helping to maintain the working landscape on which this industry depends. Across the state, Beaufort County is the number one grower of tomatoes in the open and the third harvester of all vegetables. Together, the 137 farms in Beaufort County generate approximately $28.3 million (2007$) in agricultural products annually.
• Land conservation helps the U.S. military create safe buffer zones around installations, separating growing communities from land needed for vital training missions and safe installation operation. Defense is a key industry in Beaufort County, where three major installations support 14,900 jobs.
This study provides information on the benefits of parks, trails, and conserved open spaces in Beaufort County, which until now have been unknown. This analysis estimates the benefits of the system as it currently exists. These benefits are distributed across many sectors of Beaufort County’s economy. Each estimate above represents a different type of value, with different accrual types (e.g., annual versus one-time) and different beneficiaries (e.g., local businesses, government, and residents), and therefore cannot be summed into a single figure. In order to provide a robust and reliable report, this analysis used the most conservative methods supported by existing methodology and literature. For example, in any instance where multiple valuation methods were available, The Trust for Public Land utilized the method that produced the lower bound estimate.
This study illustrates that parks, trails, and conserved open spaces in Beaufort County are key economic drivers that contribute millions in economic benefits annually to the county as a whole (see Table 1 ).
barb
ara
g. h
olm
es

the economic benefits of parks, trails, and conserved open spaces in beaufort county, south carolina4
TABLE 1. SUMMARY OF ESTIMATED ECONOMIC BENEFITS PROVIDED BY
PARKS, TRAILS, AND CONSERVED OPEN SPACES2
For more information about these analyses beyond what is included in each of the following sections, please see the appendices that are available at the end of electronic versions of this report at www.tpl.org/beaufort-county-economic-benefits.
2 The Trust for Public Land has rounded all numbers in the text and tables to three significant digits unless otherwise noted. Because of rounding, some report figures and tables may appear not to sum. The spatially based methodologies for estimating enhanced property value, stormwater infiltration, and air pollution removal allowed for the breakout of economic value for RCL as a compo-nent of all parks, trails, and conserved open spaces. This was not possible for the other analyses.
benefit category* value (2017$)
Enhanced property value
Total additional property value** $127,000,000
Subset attributable to RCL $22,500,000
Additional annual property tax $1,120,000
Subset attributable to RCL $174,000
Stormwater infiltration $27,400,000
Subset attributable to RCL $8,100,000
Air pollution removal $317,000
Subset attributable to RCL $72,900
Tourism
Total park, trail, and conserved open space visitor spending $116,000,000
Local sales tax on park, trail, and conserved open space visitor spending $3,460,000
Recreational use $16,800,000
Health care cost savings $7,910,000
summary of industries supported by parks, trails, and conserved open spaces in beaufort county***
value (2017$)
Economic development
Spending on sports, recreation, and exercise equipment $12,800,000
Sales generated by sporting goods $102,000,000
Farming
Value of agricultural products $28,300,000 (2007$)
Defense
Jobs supported by Beaufort County’s three military installations 14,900
*These benefits are distributed across many sectors of Beaufort County’s economy. Each estimate represents a different type of value, with different time frames, accruing to different beneficiaries, and therefore cannot be summed into a single figure; however, many benefits accrue annually and will continue into the future.** The additional property value does not accrue annually, but rather is a one-time boost to property values that would be realized upon the sale of the home.***The economic development, farming, and defense values presented here are illustrative of the importance of these industries to Beaufort County’s economy. Not all of the value in these categories is exclusively generated by parks, trails, and conserved open spaces; however, these amenities do play an important role in supporting these industries.

5the economic benefits of parks, trails, and conserved open spaces in beaufort county, south carolina
EXHIBIT 1. MAP OF THE PARKS, TRAILS, AND CONSERVED OPEN SPACES IN BEAUFORT COUNTY3
3 This map shows all of the parks, trails, and conserved open spaces that were included in the property value, stormwater, and air pollution analyses. These amenities were finalized with the working group in May 2017.

the economic benefits of parks, trails, and conserved open spaces in beaufort county, south carolina6
IntroductionPARKS, TRAILS, AND CONSERVED OPEN SPACES ARE VALUABLE COMPONENTS of healthy, flourishing communities. These amenities are public goods that are provided and maintained by federal, state, and local governments as well as nonprofit organizations for residents to access at little or no cost per visit. As such, the actual value of park, trail, and open space amenities is often overlooked. Unlike tickets sold to a sporting event for instance, a public park does not increase revenues with additional visitors. In fact, the greater the usage of a local park, the greater the costs to clean and maintain it. Parks can even be seen as a drain on limited resources when undefined, vague benefits are compared with the very real costs for maintenance and operations. Yet parks do provide tangible, and measurable, economic benefits to local residents and governments. Through economic analysis, it is possible to isolate and quantify many of these benefits and help interested parties gain a fuller understanding of the value of their parks, trails, and conserved open spaces.
This report analyzes the parks, trails, and conserved open spaces in Beaufort County and documents a selection of the significant economic benefits that these amenities provide to the community. This analysis includes places north of the Broad River, like Hunting Island State Park, Henry C. Chambers Waterfront Park, and the Spanish Moss Trail, as well as places south of the Broad River, like Oyster Factory Park and Chaplin Community Park. This analysis also examines all lands acquired throughout the county as part of the Beaufort County Rural and Critical Land Preservation Program (RCLPP). The lands studied (as shown in the map on page 5 ) consist of all public parks, public trails, and conserved open spaces inside Beaufort County, regardless of their ownership or management.
Defining parks, trails, and conserved open spacesPrior to this report, there was no single source or map record of the various public and con-served lands in Beaufort County. The Trust for Public Land worked with Beaufort County Open Land Trust, Beaufort County’s Geographic Information System (GIS) Department, local munici-palities, local conservation organizations, and state and federal agencies to acquire, compile, and classify 13 different data layers of parks, trails, and conserved open spaces in Beaufort County.
PARKS, TRAILS, AND CONSERVED OPEN SPACES include state and federally protected lands; municipal and county parks, trails, and conserved lands; private lands with conservation ease-ments; lands held by local, regional, and national land trusts and conservation organizations; and all other publicly conserved spaces including RCL within Beaufort County.
RURAL AND CRITICAL LANDS (RCL) include all lands acquired partially or wholly with funding from the Beaufort County RCLPP since its founding in 1999. These lands are a subset of parks, trails, and conserved open spaces. The spatially based methodologies of the enhanced prop-erty value, stormwater infiltration, and air pollution removal analyses allow the benefits of RCL to be examined as a separate component of the parks, trails and conserved open spaces in Beaufort County.
POCKET PARKS include parcels of less than 0.5 acres or with less than 0.5 acres of green space. Pocket parks are included in the tourism, recreation, health, and economic development sec-tions. They are omitted from the spatially based enhanced property value, stormwater infiltra-tion, and air pollution removal analyses because of their modest size.
PRIVATE AMENITIES including open and recreation lands on private properties, such as golf courses or undeveloped lands in private communities, are not included in this analysis. These private parklike amenities can provide benefits similar to those measured in this report; how-ever, those benefits accrue primarily to the residents in those communities. Additionally, even though such lands are presently open spaces, they may be developed or altered at the own-ers’ discretion negating the benefits.

7the economic benefits of parks, trails, and conserved open spaces in beaufort county, south carolina
Parks, trails, and conserved open spaces enhance property values, infiltrate stormwater, decrease air pollution, attract visitors, provide recreational opportunities, improve human health, boost economic development, bolster the farming industry, and support military installations. These amenities support local jobs, increase spending at local businesses, and generate local tax revenue. More specifically:
• Parks, trails, and conserved open spaces increase the value of nearby residential properties in Beaufort County because people enjoy living close to these amenities and are willing to pay for this proximity. The Trust for Public Land calculated this premium for all homes near parks, trails, and conserved open spaces in Beaufort County in the enhanced property value section . The premium represents real, additional property value that exists due to parks, trails, and conserved open spaces. Further, as property tax is based on a home’s value, additional annual property tax revenue is generated by these homes proximate to these amenities.
• Parks and open spaces can absorb and reduce the volume of stormwater runoff, decreasing local governments’ stormwater management costs. In the stormwater section of this report, The Trust for Public Land uses available stormwater treatment cost data to calculate the economic value of stormwater runoff retained by protected areas in Beaufort County.
• The vegetation in parks and open space plays a role in improving air quality and helping areas avoid the costs associated with pollution. In the air pollution section , The Trust for Public Land estimates the amount of air pollution removal by trees and the monetary value of the pollution removal.
• The parks, trails, and conserved open spaces in Beaufort County draw visitors to Beaufort County. In the tourism section , The Trust for Public Land uses information on visitor characteristics and spending to calculate the economic impact of park, trail, and conserved open space amenities to the local tourism economy.
• Beaufort County’s parks, playgrounds, trails, community centers, and conserved open spaces generate economic benefits within the local community by providing access to an array of recreational activities for free or at lower cost than private venues. These activities include walking and hiking, enjoying nature and observing birds and wildlife, going to the beach, biking, playing sports, picnicking, reading, and relaxing. The Trust for Public Land calculates the millions of dollars saved by residents each year through access to these activities in the recreational use section of the report.
• According to the Robert Wood Johnson Foundation, Beaufort is the healthiest county in South Carolina; however, even in this top-ranking county, physical inactivity and obesity are challenging health problems that exist, and parks can help address these issues. Research shows that park and trail use translates into increased physical activity, resulting in medical care cost savings. While all Beaufort County residents who visit the county’s parks, trails, and conserved open spaces improve their health by visiting, this report calculates the number of adult residents who use these amenities at a level sufficient to generate measurable health benefits. In the health care cost savings section , The Trust for Public Land uses national health guidelines to translate these benefits into their equivalent health care savings value.
• The parks, trails, and conserved open space contribute to the high quality of life in Beaufort County, which plays an important role in attracting businesses and employees to the county. These amenities are assets that also support the area’s robust recreation economy. The economic development section of the report describes the qualitative benefits of parks, trails, and open spaces in Beaufort County and looks at annual spending by residents on recreation.
• Supporting working farms through mechanisms such as easements is a critical tool to keep

the economic benefits of parks, trails, and conserved open spaces in beaufort county, south carolina8
Beaufort’s working lands operational. In the farming section , The Trust for Public Land summarizes the impact that rural land protection has had on local farms in Beaufort County.
• Land conservation helps the U.S. military create safe buffer zones around installations, separating growing communities from training missions and installation operation. To this end, significant acreage has been protected around military installations in Beaufort County. The defense section summarizes the economic impact of the defense industry in the county, and the importance of conserved spaces to the continued support and growth of this industry.
This report brings to light many of these previously intangible benefits of the parks, trails, and conserved open spaces in Beaufort County. In order to provide robust and grounded economic estimates, this analysis relies on the most conservative methods supported by comparable economic valuation studies. In any instance where multiple valuation methods are supported, or where a range of values are available for analysis, The Trust for Public Land selects the method or values producing the lower bound estimate. As such, it is likely that the actual benefits are higher than what The Trust for Public Land estimates in the following pages.
Beaufort County’s park, trail, and conserved open space amenities are key contributors to its reputation as a county of excellence. While this analysis determines many of the economic benefits of parks, trails, and conserved open spaces in Beaufort County, it does not capture the full value of these spaces for area residents. From having a quiet place to walk and reflect to venues for hosting regionally important events, the full value of parks, trails, and conserved open spaces goes far beyond dollars and cents.
mar
ci t
ress
el

9the economic benefits of parks, trails, and conserved open spaces in beaufort county, south carolina
Enhanced property value PARKS, TRAILS, AND CONSERVED OPEN SPACES HAVE A POSITIVE IMPACT ON NEARBY RESIDENTIAL PROPERTY
VALUES.4 All other things being equal, people are willing to pay more for a home close to these amenities. Further, since property tax is based on a home’s value, the increased value of homes near these protected spaces leads to additional property taxes being generated annually. Through economic analysis, it is possible to isolate the impact that parks, trails, and conserved open spaces have on home values. This analysis estimates the enhanced property value due to parks, trails, and conserved open spaces in Beaufort County, as well as the additional tax revenue generated. This analysis also considers the role Rural and Critical Lands play in boosting property values and generating additional taxes.5
The effect of parks, trails, and conserved open spaces on local property value are evident in Beaufort County. These spaces contribute to the nationally recognized quality of life in the county, which is increasingly drawing new residents to the area, both north and south of the Broad River. For example, Southern Living magazine does an annual reader survey to find the best small towns in the South, and the city of Beaufort consistently tops the list, in part because of its stunning scenery and views made possible by these conserved spaces.6 Similar benefits of parks, trails, and conserved open spaces can be seen throughout the county.
The property value added by these protected spaces is separate from the value residents gain from the recreational use of parks, trails, and conserved open spaces; property value goes up even if the resident never visits or uses these places. Property value is affected by two factors: quality of and distance from the park, trail, or conserved open space.
4 Virginia McConnell and Margaret Walls, The Value of Open Space: Evidence from Studies of Nonmarket Benefits (Washington, DC: Resources for the Future, 2005); John L. Crompton, “The Impact of Parks on Property Values: Empirical Evidence from the Past Two Decades in the United States,” Managing Leisure 10, no. 4 (2005): 203–218.
5 The estimated enhancement to property value does not include the increased value associated with beaches, except for the pub-lic access points larger than 0.5 acres that were included in the map shown in Exhibit 1.
6 Valerie Fraser Luesse, “The South’s Best Small Towns 2017,” Southern Living, accessed September 9, 2017, http://www.southernliv-ing.com/souths-best/small-towns#beaufort-south-carolina-marsh-view.
Town of Bluffton uses new Dubois Park to help build community in town’s Historic Districtby the town of bluffton
Dubois Park is located in the heart of Bluffton’s Historic District. This 1.25-acre park, owned and programmed by the Town of Bluffton, was donated to the town to be used as a civic space. Construction initially began in 2012, and over the last five years, the park has seen a number of improvements guided by community input in order to help the Town enhance the Historic District. The park now consists of swings, playground facilities, a covered pavilion, and restrooms, along with artificial turf and open areas with landscaping. It is located within a mix of commercial and residential uses and is well used by visitors and residents of the community.
Since the opening of Dubois Park in 2012, there has been a great deal of new development as well as redevelopment in the surrounding area. This includes the conversion of vacant and residential structures to retail, locally operated small businesses, and new residential homes. The value of the park is so evident that the Town purchased a lot immediately across the street to extend the park network. This will add parking and green space to supplement the high growth in the area and respond to community needs. It is no coincidence that as Dubois Park continues to grow, so does Bluffton’s burgeoning Historic District.

the economic benefits of parks, trails, and conserved open spaces in beaufort county, south carolina10
The quality of parks, trails, and conserved open spaces can affect nearby property values in several ways. Beautiful natural areas with public access, scenic vistas, and bodies of water are markedly valuable. Less attractive or poorly maintained parks, trails, and conserved open spaces may provide only marginal value, and in some cases, they may actually reduce nearby property values. When looking at the impact of individual parks, trails, and conserved open spaces, economic analysis is complicated by the subjective nature of an area’s quality and the variation in quality across time. Over a number of years, for instance, any given open space may go through cycles of disrepair and reconstruction. However, variations in individual premiums can be accounted for when looking at the impact of an entire county’s park, trail, and conserved open space system. A premium can be calculated that isolates the minimum average value added by these spaces, separate from other locational factors that affect a home’s value, such as proximity to transportation networks and central business districts. Using this method, the open space premium is not based on any one park, trail, or conserved open space, but rather on the entire system of these spaces. This makes it possible to generate a reliable estimate of the total impact of these protected areas on property values based on established rates from comparable studies.
In addition to quality, distance from parks, trails, and conserved open spaces is the second factor impacting property values. The premium for proximity to these spaces can impact market values up to 2,000 feet by 20 percent or more.7 A 2009 report from the National Association of Realtors found the premium for homes near parks can extend three blocks and start at 20 percent, declining as distance from the park increases.8 A study in Greenville, South Carolina, found that homes between 300 and 500 feet from neighborhood parks increased their average value by 13 percent, and homes up to 1,500 feet away from parks increased their average value by 6.5 percent.9 Another study in nearby Savannah, Georgia, found that adjacency to a park enhanced sales value.10 Wild areas that provide habitat also boost property values. For example, a study of enhanced property value due to proximity to National Wildlife Refuges found that Southeastern homes located within a half mile of a National Wildlife Refuge and eight miles of an urban center were worth between 7 percent and 9 percent higher than other homes.11 Trails also increase property values. A study in Austin, Texas, found that being directly adjacent to greenbelts increased homes’ average value by 5.7 or 12.2 percent, depending on the greenbelt.12
Using the most conservative method of analysis supported by these and other studies, The Trust for Public Land analyzed the value premium and increased tax revenue from residences due to their proximity to parks, trails, and conserved open spaces in Beaufort County. The Trust for Public Land identified all homes in the county within 500 feet of these spaces using spatial analysis.13 Appraisal data from Beaufort County was used to obtain 2016 property value and tax information for all homes in the county. This information was then combined with the spatial analysis to isolate a 5 percent value premium for residences proximate to parks, trails, and conserved open spaces as well as the accompanying property tax contributions due to this premium. The Trust for Public Land repeated
7 John L. Crompton, The Proximate Principle: The Impact of Parks, Open Space and Water Features on Residential Property Values and the Property Tax Base (Ashburn, VA: National Recreation and Park Association, 2004).
8 Brad Broberg, “Everybody Loves a Park: Green Space Is a Premium When Building, Buying, or Selling,” National Association of Realtors, On Common Ground (2009): 20–25.
9 Molly Espey and Kwame Owusu-Edusei, “Neighborhood Parks and Residential Property Values in Greenville, South Carolina,” Journal of Agricultural & Applied Economics 33 (2001): 487-492.
10 Richard J. Cebula, “The Hedonic Pricing Model Applied to the Housing Market of the City of Savannah and Its Savannah Historic Landmark District,” The Review of Regional Studies 39 (2009): 9-22.
11 Laura O. Taylor, Xiangping Liu, and Timothy Hamilton, Amenity Values of Proximity to National Wildlife Refuges (Arlington, VA: U.S. Fish and Wildlife Service, 2012).
12 Sarah Nicholls and John Crompton, “The Impact of Greenways on Property Values: Evidence from Austin, Texas,” Journal of Leisure Research 37 (2005): 321-341.
13 A home consists of a residential structure that is owned and taxed. This analysis includes single-family homes as well as multiple unit dwellings (i.e., condominiums). Other property types were not considered in this analysis because sufficient data were not available to quantify the benefit. Nonresidential property types are rarely studied in the literature as they are more difficult to statistically analyze—there are more variables that influence value and fewer real estate transactions to compare.

11the economic benefits of parks, trails, and conserved open spaces in beaufort county, south carolina
category value (2016$)
Number of homes within 500 feet of parks, trails, and conserved open spaces 7,450
Total market value of homes within 500 feet of parks, trails, and conserved open spaces $2,530,000,000
Additional market value due to parks, trails, and conserved open spaces $127,000,000
Additional annual property tax revenue due to parks, trails, and conserved open spaces $1,120,000
this procedure for the subset of parcels protected through RCL.
Table 2 shows the results of this analysis for all parks, trails, and conserved spaces in Beaufort County. In 2016, 7,450 of Beaufort County’s 61,200 homes were located within 500 feet of these amenities. These homes had a total market value of $2.53 billion. An additional $127 million in residential property value in Beaufort County resulted from proximity to parks, trails, and conserved open spaces. The residential property tax rates for each parcel were used to determine how much additional tax revenue was raised throughout the county due to this proximity premium. Each year, $1.12 million in additional property tax revenue is generated by parks, trails, and conserved open spaces in Beaufort County.
The Trust for Public Land was also able to calculate the impact of RCL as a subset of all the parks, trails, and conserved open spaces in Beaufort County (Table 3 ). The Trust for Public Land found that 1,990 homes were within 500 feet of RCL properties. These homes had a total market value of $451 million, of which an estimated $22.5 million of value was due to RCL. This additional market value contributes $174,000 in additional property tax revenue each year.
TABLE 2. ENHANCED PROPERTY VALUE DUE TO PROXIMITY TO PARKS, TRAILS,
AND CONSERVED OPEN SPACES IN BEAUFORT COUNTY14
TABLE 3. ENHANCED RESIDENTIAL PROPERTY VALUE DUE TO PROXIMITY TO RCL
IN BEAUFORT COUNTY (2016)
14 Property value and tax revenue calculations in this section were based on 2016 data and adjusted to 2017 dollars using the consumer price index for all goods and all urban consumers. U.S. Department of Labor, Bureau of Labor Statistics, Consumer Price Index, accessed September 11, 2017, http://www.bls.gov/cpi/data.htm.
category value (2016$)
Number of homes within 500 feet of RCL 1,990
Total market value of homes within 500 feet of RCL $451,000,000
Additional market value due to RCL $22,500,000
Additional annual property tax revenue due to RCL $174,000

the economic benefits of parks, trails, and conserved open spaces in beaufort county, south carolina12
Stormwater infiltrationSTORMWATER MANAGEMENT IS AN IMPORTANT ISSUE FOR THE RESIDENTS OF BEAUFORT COUNTY. The county is located on the coast and is crossed by large bodies of water. These features contribute to the natural beauty that is a recognized draw for both tourists and residents, but they also create a strong need to manage stormwater runoff.15 Routine precipitation and extreme weather such as hurricanes produce rainfall that flows off roads, sidewalks, and other impervious surfaces and can cause flooding, erosion, and declines in water quality from pollutants carried with it. Since Beaufort County does not treat most of its stormwater, untreated rainwater can flow directly into waterways, causing costly ecological problems such as algal blooms and reduced drinking water quality.
Parks, trails, and conserved open spaces in Beaufort County reduce stormwater by capturing precipitation and slowing its runoff. These large pervious (absorbent) surface areas allow precipitation to infiltrate and recharge groundwater. Meanwhile, vegetation provides considerable surface area that intercepts and stores rainwater, allowing some to evaporate before it ever reaches the ground. In effect, parks function like storage reservoirs and reduce peak flows of runoff during rain events, and are the original form of green infrastructure.
Understanding the importance of these spaces as part of a robust stormwater management system, the former Western Research Station of the U.S. Forest Service developed a model to estimate the value of stormwater retained by parks, trails, and conserved open spaces. Inputs to the model consist of geographic location, climate region, surface permeability, acres of parkland, land cover, and vegetation types. The model was adapted for use in Beaufort County.
15 Recognizing an increasing need to manage stormwater properly, Beaufort created a countywide stormwater utility in 2006. Beaufort County, “Chapter 99—Stormwater Management,” in Beaufort County, SC Code of Ordinances, accessed August 24, 2017, https://library.municode.com/SC/Beaufort_County/codes/code_of_ordinances.
do
nn
a va
rner

13the economic benefits of parks, trails, and conserved open spaces in beaufort county, south carolina
First, The Trust for Public Land determined the perviousness of parks, trails, and conserved open spaces in Beaufort County using the County’s impervious surface and building footprint spatial data layers. Impervious areas consist of roadways, trails, parking areas, buildings, and hard courts. The 81,400 acres of parks, trails, and conserved open spaces within the county had only 161 acres of impervious surface, making them 0.20 percent impermeable. The Trust for Public Land also analyzed the subset of RCL, which were found to have a similar level of permeability; the 24,400 acres of RCL had only 38 acres of impervious surface, making them 0.16 percent impermeable (Table 4 ).
TABLE 4. ACREAGE AND PERMEABILITY OF PARKS, TRAILS,
AND CONSERVED OPEN SPACES IN BEAUFORT COUNTY16
Second, The Trust for Public Land estimated the amount of perviousness of the rest of Beaufort County (i.e., the county without its parks, trails, and conserved open spaces) using the same impervious surface data. The pervious land consists largely of residential front and back yards and private open space areas such as golf clubs, public institution grounds, and office campuses. Impervious land includes sidewalks, streets, parking areas, and rooftops. Beaufort County, without its parkland, is 97.0 percent permeable and 3.00 percent impermeable. Therefore, Beaufort County’s parks, trails, and conserved open spaces are more permeable than the rest of Beaufort County.
Third, the University of California, Davis, created a stormwater runoff reduction model for Beaufort County. The model uses precipitation data for the county to estimate annual runoff. Typically, Beaufort County receives 53.7 inches of rain per year.17 The reduction in runoff attributable to parks, trails, and conserved open spaces in Beaufort County was calculated by comparing the modeled runoff with the runoff that would leave a hypothetical park site of the same size but with land cover that is typical of the surrounding level of development (i.e., with streets, rooftops, or parking lots). In other words, this analysis does not measure all of the water that is absorbed by parks, trails, and conserved open spaces in Beaufort County, but instead measures the amount of water that is retained
16 For ease of reporting, figures in this report have been rounded to three significant digits. Because of this rounding, these percent-ages appear not to sum to 100 percent. The underlying figures are not rounded and sum to 100 percent.
17 The stormwater model uses real precipitation data from the region in 2016. The selection of which year’s precipitation data to use is based on the annual precipitation that is closest to normal with the smallest standard deviation for annual precipitation and for annual air temperature. Precipitation data are from the National Oceanic and Atmospheric Administration’s National Centers for Environmental Information.
category acres percent of area
Acres of parks, trails, and conserved open spaces
With pervious soil 81,300 99.8%
With impervious soil 161 0.20%
Total 81,400 100%
Acres of RCL
With pervious soil 24,400 99.8%
With impervious soil 38 0.16%
Total 24,400 100%

the economic benefits of parks, trails, and conserved open spaces in beaufort county, south carolina14
by these spaces above what would be absorbed had the land been developed similarly to the rest of the county. The University of California, Davis, completed this analysis for all parks, trails, and conserved open spaces in Beaufort County and for all RCL parcels separately. In total, parks, trails, and conserved open spaces reduced stormwater runoff in Beaufort County by 607 million cubic feet per year (Table 5 ), 180 million cubic feet of which is attributable to RCL (Table 6 ).
The final step in determining the economic value of stormwater infiltration by parks, trails, and conserved open spaces in Beaufort County was to estimate the cost of managing stormwater with infrastructure (e.g., detention ponds, constructed wetlands, and infiltration basins). Beaufort’s protected lands manage a measurable volume of stormwater at no cost, which can be compared with the costs of treating the same volume of stormwater through infrastructure. Looking at these costs provides a comparable value to use when estimating the savings parks produce through their natural retention and treatment features. While Beaufort County does not directly treat stormwater as part of a comprehensive stormwater program, the County does require stormwater treatment infrastructure to be built alongside new construction and redevelopment projects. National studies have found that construction and annual maintenance costs for common stormwater best management practices
TABLE 5. ANNUAL STORMWATER COST SAVINGS FROM PARKS, TRAILS,
AND CONSERVED OPEN SPACES IN BEAUFORT COUNTY
category inches amount (2017$)
Rainfall 53.7 15,900,000,000 cubic feet
Runoff with parks, trails, and conserved open spaces 16.2 4,780,000,000 cubic feet
Runoff without parks, trails, and conserved open spaces 18.2 5,390,000,000 cubic feet
Runoff reduction from parks, trails, and conserved open spaces 2.06 607,000,000 cubic feet
Value of stormwater ($ per cubic foot) $0.05
Total stormwater infiltration value due to parks, trails, and conserved open spaces $27,400,000
category inches amount (2017$)
Rainfall 53.7 4,750,000,000 cubic feet
Runoff with RCL 16.2 1,430,000,000 cubic feet
Runoff without RCL 18.2 1,610,000,000 cubic feet
Runoff reduction from RCL 2.03 180,000,000 cubic feet
Value of stormwater ($ per cubic foot) $0.05
Total stormwater infiltration value due to RCL $8,100,000
TABLE 6. ANNUAL STORMWATER COST SAVINGS FROM RCL IN BEAUFORT COUNTY

15the economic benefits of parks, trails, and conserved open spaces in beaufort county, south carolina
range from $0.05 to $0.86 per cubic foot of stormwater treated.18 To be conservative, The Trust for Public Land uses the lower bound of the stormwater treatment cost range ($0.05 per cubic foot) to estimate the value of stormwater infiltration provided by parks, trails, and conserved open spaces.
In addition to being conservative among national studies, the estimated cost of stormwater treatment is low compared to local costs. The Trust for Public Land analyzed treatment costs specific to Beaufort County and the larger region. Beaufort County’s Stormwater Management Department has recently completed two stormwater treatment facilities.19 Construction and annual maintenance costs for these two sites suggest water treatment costs of $0.16 per cubic foot of treatment.20 This small sample size suggests the stormwater treatment savings provided by Beaufort County’s parks, trails, and conserved open spaces could be as much as three times greater than the conservative estimate that results from this analysis.
The Trust for Public Land estimates a total annual stormwater value of $27.4 million for parks, trails, and conserved open spaces in Beaufort County (see Table 5 ), which includes a total of $8.10 million for RCL properties (see Table 6 ).
18 Based on 2005 cost ranges were adjusted to 2017 dollars using the consumer price index for all goods and all urban consumers. City of Overland Park, Kansas, Overland Park Site BMP Cost Analysis, Olsson Associates, 2007; James P. Heaney and Joong G. Lee, Methods for Optimizing Urban Wet-Weather Control Systems, U.S. Environmental Protection Agency, 2006; Ada Wossink and Bill Hunt, The Economics of Structural Stormwater BMPs in North Carolina, Water Resources Research Institute of the University of North Carolina, 2003; U.S. Environmental Protection Agency, Preliminary Data Summary of Stormwater Best Management Practices, 1999; Chesapeake Research Consortium, The Economics of Stormwater BMPs in the Mid-Atlantic Region, 1997; James P. Heaney, Costs of Urban Stormwater Control, U.S. Environmental Protection Agency, 2002; U.S. Department of Labor, Bureau of Labor Statis-tics, Consumer Price Index.
19 Okatie West regional pond construction and Battery Creek retrofit pond project. These were all of the county stormwater treat-ment projects for which capital and maintenance cost data were available. Eric W. Larson, manager, Beaufort County Stormwater Utility, email message to the author, May 31, 2017.
20 This figure was derived from the average treatment costs for the two projects over a 25-year time horizon. Treatment costs were calculated based on total volume treated divided by total construction, engineering, and annual maintenance costs figures ob-tained from the County.
patr
icia
ro
che

the economic benefits of parks, trails, and conserved open spaces in beaufort county, south carolina16
Air pollutionAIR POLLUTION IS A SIGNIFICANT AND EXPENSIVE PROBLEM that causes injuries to human health and damage to structures. Human cardiovascular and respiratory systems are affected, with broad consequences for health care costs and productivity.21 In addition, acid rain, smog, and ozone increase the need to clean and repair buildings and other infrastructure.22
Trees and shrubs have the ability to remove pollutants from the air. Leaves absorb gases such as nitrogen dioxide, sulfur dioxide, carbon monoxide, and ozone. Particulate matter (PM), which includes small particles of dust, metals, chemicals, and acids, can also be removed by adhering to plant surfaces.23 The vegetation in public parks and conserved open spaces plays a role in improving air quality, helping nearby areas avoid the costs associated with pollution.24
This study includes an analysis of the air pollution removal benefits that result from the parks, trails, and conserved open spaces in Beaufort County, as well as the subset of these lands that were protected through the Rural and Critical Land Preservation Program. These types of spaces provide vegetation that absorbs air pollution and contributes to the nationally recognized air quality in the South.25 Further, as Beaufort County continues to grow at a rapid rate,26 protected spaces are an increasingly important means of mitigating the negative effects of pollution associated with this development and growth.
The Northern Research Station of the U.S. Forest Service in Syracuse, New York, designed a calculator for The Trust for Public Land to estimate air pollution removal by park, trail, and conserved open space vegetation and the value of pollution removed by this vegetation. This calculator utilizes the U.S. Forest Service’s i-Tree Eco model, which is location-specific, and incorporates factors such as tree canopy, pollution, weather, and U.S. Census data for Beaufort County.27
The Trust for Public Land determined the amount of tree canopy cover in the parks, trails, and conserved open spaces in Beaufort County using the 2011 National Land Cover Dataset (the most recent data available). Although Beaufort County has numerous trees on private developments as well as on streets, this study measures only the economic value of trees located on park, trail, and conserved open space properties. Tree canopy covers 43 percent of these lands throughout the county and 33 percent of RCL.
21 Marilena Kampa and Elias Castanas, “Human Health Effects of Air Pollution, Environmental Pollution,” Environmental Pollution 151 (2007): 362–367; Janet Currie, “Pollution and Infant Health,” Child Development Perspectives 7 (2013): 237–242.
22 R. N. Butlin, “Effects of Air Pollutants on Buildings and Materials,” Proceedings of the Royal Society of Edinburgh. Section B. Biological Sciences 97 (1990): 255–272; U.S. Environmental Protection Agency, The Plain English Guide to the Clean Air Act, EPA-456/K-07-001, Office of Air Quality Planning and Statistics, 2007; American Lung Association, “Health Effects of Ozone and Particle Pollution,” accessed October 4, 2017, http://www.lung.org/our-initiatives/healthy-air/sota/health-risks/.
23 Particulate matter includes fine and coarse particles. Fine particles consist of particulate matter less than 2.5 micrometers in diam-eter and are so small they can be detected only with an electron microscope. Sources include all types of combustion, including motor vehicles, power plants, and residential wood burning. Coarse dust particles consist of particulate matter between 2.5 and 10 micrometers in diameter and are generated by crushing and grinding operations as well as dust stirred up by cars traveling on roads. U.S. Environmental Protection Agency, “Particle Pollution (PM),” accessed October 4, 2017, http://www.airnow.gov/index.cfm?action=aqibasics.particle.
24 David J. Nowak et al., “Modeled PM2.5 Removal by Trees in Ten U.S. Cities and Associated Health Effects,” Environmental Pollution 178 (2013): 395–402.
25 Maggie Angst, “Report: You Can Breathe Easily in the Southeast… Literally,” The Island Packet, April 19, 2017, accessed September 6, 2017, http://www.islandpacket.com/news/local/article145519869.html; American Lung Association, State of the Air 2017, 2017.
26 Erin Heffernan, “Beaufort County among Fastest Growing in South Carolina,” The Island Packet, March 23, 2017, accessed Septem-ber 6, 2017, http://www.islandpacket.com/news/local/community/beaufort-news/article140294078.html.
27 This model is designed to estimate annual air pollutant removal (tons m-2) and monetary values ($ m-2) for areas in the United States, based on user-supplied information on location and tree cover. The program uses average removal amounts and values per unit of tree cover that were derived on a county basis from i-Tree Eco analyses across the United States in 2010. Three analyses were conducted to determine the effect per unit of tree cover on a county basis: (1) derivation of the total tree cover, evergreen percentage, and leaf area index, (2) estimation of air pollutant removal and concentration changes, and (3) valuation of air pollut-ant removal using the U.S. Environmental Protection Agency’s Environmental Benefits Mapping and Analysis Program (BenMAP). David J. Nowak et al., “Tree and Forest Effects on Air Quality and Human Health in the United States,” Environmental Pollution 193 (2014): 119–129.

17the economic benefits of parks, trails, and conserved open spaces in beaufort county, south carolina
The i-Tree Eco model processed the tree canopy cover data to estimate hourly changes in annual air pollution removal due to park, trail, and conserved open space trees. The model then estimated the value of these changes for each pollutant based on values established by i-Tree researchers, primarily based on savings in health care costs. These values were derived from the Environmental Protection Agency’s Environmental Benefits Mapping and Analysis Program (BenMAP) as well as other externality values used in energy decision-making developed by a well-cited study.28
A total value of $317,000 in air pollution removal was estimated for parks, trails, and conserved open spaces in Beaufort County (Table 7 ), of which $72,900 was attributable to RCL (Table 8 ).
28 BenMAP was used to estimate the incidence of adverse health effects and associated monetary costs resulting from changes in NO2, O3, PM2.5, and SO2 concentrations. The pollutant removal values for CO and PM10* were CO = $27 t-1 and PM10* = $126 t-1. Values for CO and PM10* were estimated using national median externality values adjusted to 2017 values using the producer price index. For each area, calculated total removal amount and monetary value are divided by the area’s total tree cover to derive the removal amount and monetary value multipliers, respectively. F. J. Murray, L. Marsh, and P. A. Bradford, New York State Energy Plan, Vol. II: Issue Reports, New York State Energy Office, 1994. U.S. Department of Labor, Bureau of Labor Statistics, Producer Price Index, accessed September 6, 2017, www.bls.gov/ppi/.
category inches amount (2017$)
Carbon monoxide 10,000 $130
Nitrogen dioxide 234,000 $2,040
Ozone 1,960,000 $103,000
Coarse dust particles 398,000 $24,300
Fine particles 82,400 $187,000
Sulfur dioxide 299,000 $837
Total 2,980,000 $317,000
TABLE 7. VALUE OF AIR POLLUTION REMOVED BY PARKS, TRAILS,
AND CONSERVED OPEN SPACES IN BEAUFORT COUNTY
category inches amount (2017$)
Carbon monoxide 2,300 $30
Nitrogen dioxide 53,700 $470
Ozone 450,000 $23,600
Coarse dust particles 91,600 $5,590
Fine particles 18,900 $43,000
Sulfur dioxide 68,800 $192
Total 685,000 $72,900
TABLE 8. VALUE OF AIR POLLUTION REMOVED BY RCL IN BEAUFORT COUNTY

the economic benefits of parks, trails, and conserved open spaces in beaufort county, south carolina18
TourismFROM THE SANDY BEACHES OF HILTON HEAD ISLAND TO THE SCENIC CAMPGROUNDS AT HUNTING ISLAND
STATE PARK, Beaufort County’s parks, trails, and conserved open spaces play a critical role in driving the growing tourism industry. Many of Beaufort County’s visitors come to recreate at these amenities and spend considerably on goods, entertainment, lodging, fuel, gifts, and other items during their stay in the county. This section documents the total impact of tourism in Beaufort County and then isolates the contribution of parks, trails, and conserved open spaces to this sector of the county’s economy.
South Carolina has become a top travel destination in the United States. More than 30 million visitors come to the state annually,29 creating a $19.1 billion economic impact.30 An estimated 195,000 jobs, or almost one out of every ten jobs in the state, are supported by tourism.31 Outdoor recreation plays a large role in supporting this growth. More than one-third of visitors to South Carolina participate in outdoor recreation while in the state,32 and according to the most recent travel data, the primary purpose for 21 percent of all leisure visitors traveling to the state is to participate in outdoor recreation.33
29 Combination of total domestic visits (29.5 million) and international visitors (1 million). South Carolina Department of Parks, Recre-ation and Tourism, South Carolina State Comprehensive Outdoor Recreation Plan (SCORP), 2014.
30 Dawn Dawson-House, “Tourism Is Now a $19.1 Billion Industry in South Carolina,” South Carolina Department of Parks, Recreation and Tourism, February 17, 2016, accessed August 4, 2017, https://www.scprt.com/articles/tourism-is-now-a-19-billion-industry-in-south-carolina.
31 Based on employment generated by direct, indirect, and induced impacts of tourism spending. U.S. Travel Association, The Eco-nomic Contribution of Tourism in South Carolina—2015 Tourism Satellite Account Results, 2017.
32 Of the 30.5 million annual visitors to South Carolina, more than 11 million participate in some form of outdoor recreation. South Carolina Department of Parks, Recreation and Tourism, SCORP.
33 South Carolina Department of Parks, Recreation and Tourism and U.S. Travel Association, Domestic Leisure Travel to South Carolina from Out-of-State, 2017; South Carolina Department of Parks, Recreation and Tourism and U.S. Travel Association, In-State Leisure Travel in South Carolina, 2017.
beau
fort
reg
ion
al c
ham
ber
of
com
mer
ce

19the economic benefits of parks, trails, and conserved open spaces in beaufort county, south carolina
Beaufort County is particularly well positioned within the growing tourism industry in South Carolina. Beaufort County ranks third out of all 46 counties in the state in terms of tourism revenue.34 Beaufort County’s parks, trails, beaches, and open spaces both north and south of the Broad River are a primary driver of this tourism. On the north side of the Broad River, there are nationally recognized destinations such as Hunting Island State Park and public spaces such as the Spanish Moss Trail. Hunting Island State Park had 1.35 million visitors in 2014—many of whom come from other parts of the state and county—making it South Carolina’s most visited state park.35 These destinations generate positive economic impacts by drawing visitors who spend money at local businesses, support local jobs, and spur economic growth.
South of the Broad River, there are magnificent open spaces that generate tourism activity, including Hilton Head Island, a leading national attraction, and regional attractions such as Bluffton Oyster Factory. Travel + Leisure magazine readers voted Hilton Head Island the number one island destination in the continental United States and number two in world.36 Opportunities abound for the more than 2.6 million visitors to Hilton Head Island each year37 to recreate, stay, shop, and dine at over 250 restaurants.38 At the center of this economic activity are Hilton Heads Island’s outdoor amenities, including its 12 miles of sandy beaches. Hilton Head Island’s natural assets are a primary driver of visitors, who then contribute to the region’s economy by spending on local goods and services.
While it is clear that Beaufort County’s parks, trails, and conserved open spaces are fundamental drivers of the county’s tourism economy, the actual contribution due to these spaces has not been isolated prior to this analysis. Using survey results and data from the U.S. Travel Association and the South Carolina Department of Parks, Recreation, and Tourism at the county and state levels, The Trust for Public Land determined a conservative estimate for this contribution. Total direct spending by visitors to Beaufort County is $1.29 billion annually. This spending generates $38.4 million in local taxes and $78.2 million in state taxes each year.39 Meanwhile, 9 percent of visitors traveled to South Carolina for the primary purpose of outdoor recreation.40 Applying this portion of visitors to the total tourism spending in the county suggests that a minimum of $116 million in spending each year is attributable to the parks, trails, and conserved open spaces that make the outdoors accessible to tourists (see Table 9 ). Spending by these park–, trail–, and open space–related visitors generates $3.46 million and $7.04 million in local and state tax revenues, respectively.
34 U.S. Travel Association, The Economic Impact of Travel on South Carolina Counties 2015, Washington, DC, 2016.35 Erin Moody, “Hunting Island Tops List of Most Visited SC State Parks in 2014,” The Beaufort Gazette, February 03, 2015, accessed
August 16, 2017, http://www.islandpacket.com/news/local/community/beaufort-news/article33630105.html.36 Mandy Matney, “Hooray, Hilton Head: Named ‘Best Island’ in the US, No. 2 in the World. Here’s Why,” The Island Packet, July 11,
2017, accessed August 14, 2017, http://www.islandpacket.com/news/local/article160695859.html.37 Based on 2016 visitor data. Total visitor numbers include hotel, home & villa, timeshare, second homeowner, and day trip visitors
to Hilton Head Island and are collected by Hilton Head Island Chamber of Commerce in collaboration with Smith Travel Research, DestiMetrics, and the University of South Carolina Beaufort. Kelli Brunson, research & digital marketing coordinator, Hilton Head Island Chamber of Commerce, e-mail message to the author, August 14, 2017.
38 Hilton Head Island Chamber of Commerce, “It’s Always the Best of Fun & Sun at Hilton Head Island,” accessed August 14, 2017, https://www.hiltonheadisland.org/. Based on 2015 data, the most recent year for which countywide spending data were available, and adjusted to 2017$. U.S. Travel Association, Impact of Travel in SC.
39 Based on 2015 data, the most recent year for which countywide spending data were available, and adjusted to 2017$. This spend-ing includes all domestic visitors to Beaufort County, including residents and nonresidents of South Carolina. U.S. Travel Associa-tion, Impact of Travel in SC.
40 The state is the smallest geographic unit for which data are available. South Carolina Department of Parks, Recreation and Tourism and U.S. Travel Association, Total Domestic Travel to South Carolina, 2017.

the economic benefits of parks, trails, and conserved open spaces in beaufort county, south carolina20
TABLE 9. TOURISM IMPACTS OF PARKS, TRAILS,
AND CONSERVED OPEN SPACES IN BEAUFORT COUNTY (2015)41
These figures are conservative because they only include spending and tax revenues generated by visitors who come to Beaufort County for the primary purpose of outdoor recreation, and not visitors who come for another primary reason. For example, many visitors come to places such as the Marine Corps Recruit Depot at Parris Island for family day or graduation, and they may extend their stay in order to enjoy these park, trail, and open space amenities, further increasing their spending impacts in the county. As mentioned above, more than a third of visitors to the state engaged in some form of outdoor recreation while in the area.42 Further, the percentage used to represent visitors’ primary purpose of travel used in this analysis is based on statewide data. Beaufort County is a top travel destination in the state and is particularly well known for its beaches and other outdoor amenities. It is therefore highly likely that the actual percentage of visitors whose primary purpose for visiting the county for outdoor recreation is higher than the state average. Even using these conservative estimates, it is clear that Beaufort County’s outdoor amenities are a vital driver of the county’s growing tourism economy.
41 Total spending, tax, and employment estimates are based on U.S. Travel Association, Impact of Travel in SC, adjusted from 2015$ to 2017$ using the consumer price index for all items and all urban consumers. The percentage of tourists whose primary reason to visit Beaufort County was outdoor recreation is based on South Carolina Department of Parks, Recreation and Tourism and U.S. Travel Association, Total Travel.
42 More than 11 million visitors participated in some form of outdoor recreation during their trip, compared to 31.5 million total visi-tors. South Carolina Department of Parks, Recreation and Tourism, SCORP.
category value (2017$)
Total direct travel spending by visitors to Beaufort County $1,290,000,000
Total local tourism tax revenue in Beaufort County $38,400,000
Total state tourism tax revenue in Beaufort County $78,200,000
Percentage of tourists whose primary reason to visit Beaufort County was outdoor recreation 9%
Approximate spending of tourists attributable to parks, trails, and conserved open spaces $116,000,000
Approximate local tourism tax revenue attributable to parks, trails, and conserved open spaces $3,460,000
Approximate state tourism tax revenue attributable to parks, trails, and conserved open spaces $7,040,000

21the economic benefits of parks, trails, and conserved open spaces in beaufort county, south carolina
Recreational useIN ADDITION TO BOLSTERING THE TOURISM ECONOMY, the parks, trails, and publicly accessible conserved open spaces in Beaufort County provide substantial economic benefits through their wide use by local residents. These amenities offer direct value to Beaufort County residents by providing access to recreational opportunities such as hiking, walking, enjoying nature, observing wildlife and birding, visiting the beach, visiting with family, relaxing, playing in playgrounds, and picnicking.
Most recreational uses in parks, trails, and publicly accessible conserved open spaces, such as those in Beaufort County, are available at low or no cost to the public, but economists can calculate their value by determining the consumer’s “willingness-to-pay” for the same experience in the private marketplace. In other words, if these public amenities were not made available, how much would similar experiences cost at commercial facilities? Rather than income, the recreational use value represents the amount of money that residents save by not having to pay market rates to indulge in the activities they enjoy. The value from nonresident use was excluded from this analysis since it is accounted for in the tourism section (see page 18 ).
To calculate the recreational use value to residents of Beaufort County, The Trust for Public Land first determined the number of visits to the parks, trails, and publicly accessible conserved open spaces in Beaufort County through a professionally conducted telephone survey of county residents.43 The survey, which can be found in Appendix A, was conducted in July 2017. Respondents provided information about the frequency and duration of their visits to parks, trails, and conserved open spaces in Beaufort County, as well as detailed information about the types of activities in which they participated.
The survey results indicated that 65.8 percent of adults and 81.7 percent of children have visited the parks, trails, and publicly accessible conserved open spaces in Beaufort County in the last 12 months.44 The results also indicated that the most popular activity for adults was walking or hiking, followed by enjoying nature and observing birds and wildlife, going to the beach, biking, and general
43 The survey was conducted of a statistically representative sample of 400 residents of Beaufort County with an accuracy level of plus or minus 4.9 percent. The professional survey firm conducted the survey in English and Spanish, surveying 50 percent of respondents via wireless telephones and 50 percent via landline telephones.
44 Adults with children under the age of 18 provided information about the visitation and participation of one of their children in order to account for this age group.
participation (annual visits)
activity adults children total
Walk or hike 547,000 96,600 644,000
Enjoy nature or observe birds and wildlife 426,000 102,000 528,000
Visit a publicly accessible beach for swimming, relaxing, picnicking, or visiting with friends and family
277,000 63,400 340,000
Visit a park or playground to visit with friends or family, relax, picnic, or read 199,000 129,000 327,000
Bike 218,000 69,300 288,000
TABLE 10. TOP FIVE ACTIVITIES IN THE PARKS, TRAILS, AND PUBLICLY ACCESSIBLE
CONSERVED OPEN SPACES IN BEAUFORT COUNTY ESTIMATED USING SURVEY DATA (2017)

the economic benefits of parks, trails, and conserved open spaces in beaufort county, south carolina22
park activities.45 The most popular activity for children was general park use followed by enjoying nature and observing birds and wildlife, walking and hiking, playing sports, and biking. See Table 10 for a listing of the five most popular activities overall. These results are generally consistent with previous research, including the most recent survey by the South Carolina Department of Parks, Recreation and Tourism, which indicated the most popular recreational activities for South Carolinians age 12 and older were birdwatching, wildlife watching, beach swimming or sunbathing, motor boating, freshwater fishing, and lake or river swimming.46
To be conservative for the purposes of the recreational use analysis, The Trust for Public Land adjusted the self-reported participation data in three ways. First, The Trust for Public Land adjusted the data to account for individuals’ participation in multiple activities during a single visit, such as walking and wildlife watching, or visiting a beach and fishing. Second, The Trust for Public Land addressed the tendency of individuals to overreport park visitation because they perceive such a response to be socially desirable.47 Third, The Trust for Public Land considered fluctuations in usage by season.48 This resulted in an estimated 3.66 million person visits annually (see Table 11 ).
Once participation was determined, The Trust for Public Land assigned dollar values to each use by each participant in each activity. The Trust for Public Land applied a methodology developed using the framework of the Unit Day Value method, which is employed by the U.S. Army Corps of
45 General park activities include visiting parks and playgrounds to visit with friends or family, relax, picnic, or read.46 South Carolina Department of Parks, Recreatio, and Tourism, 2005 Recreation Participation and Preference Study, Columbia, SC.
2005; University of South Carolina, Moore School of Business, Underappreciated Assets: The Economic Impact of South Carolina’s Natural Resources, 2009.
47 Adjusting for the overreporting of park use that occurs due to social desirability bias is consistent with the literature. B. Wyker et al., Self-Reported and Accelerometer-Measured Physical Activity: A Comparison in New York City (New York: New York City Depart-ment of Health and Mental Hygiene, 2013).
48 Residents use the parks, trails, and open space in Beaufort County year-round but these amenities experience fluctuations in us-age throughout of the year. Visitation was adjusted based on seasonal participation information provided about the Spanish Moss Trail and Hunting Island State Park. Sissy Perryman, Friends of Spanish Moss Trail, e-mail message to author, March 23, 2017; Matt Elswick, South Carolina Department of Parks, Recreation and Tourism, e-mail message to author, July 20, 2017.
deb
bie
qui
nn

23the economic benefits of parks, trails, and conserved open spaces in beaufort county, south carolina
TABLE 11. ANNUAL ECONOMIC VALUE OF RECREATIONAL USE IN PARKS, TRAILS,
AND PUBLICLY ACCESSIBLE CONSERVED OPEN SPACES IN BEAUFORT COUNTY BY RESIDENTS
Engineers to count visits by specific activity, assigning each activity a dollar value.49 The Trust for Public Land determined the value of recreation activities in Beaufort County utilizing estimates of outdoor recreation value from Oregon State University’s Recreation Use Values Database as well as market rates, when available. Oregon State University’s database contains values for more than 20 activities and comprises over 420 economic studies that estimated the use value of recreation activities in the United States and Canada from 1958 to 2015.50 In determining which values to use, The Trust for Public Land’s economists applied the values most conservative and relevant to Beaufort County.
In quantifying the benefits of resident use, The Trust for Public Land also recognized that not every visit within a given period has the same value for the visitor. In fact, additional uses of a park are less valuable than the first use. For example, an individual’s first visit of the year is worth more than that same individual’s tenth visit of the year.51 The Trust for Public Land also took into account any fees charged to participate in an activity, such as an entrance fee to a public beach. The per-person fee is subtracted from the imputed value and only the “extra” value is assigned. For example, if a visit to the beach is worth approximately $10.00 and it costs $2.00 for a day pass, the value of the resident’s first time visiting the beach would be $8.00.
The average value per visit of $4.60 is a unique calculation for Beaufort County residents across all activities engaged in for all visitors (Table 11 ). The Trust for Public Land calculated the value based on the frequency and type of activities engaged in by residents of Beaufort County in the past year. The calculation takes into account the diverse types of activities available to Beaufort County residents, seasonality of use, individual demand curves for each person for each activity, and varying values by activity. This analysis finds the recreational use value for Beaufort County is $16.8 million for 2017 (Table 11 ).
49 The unit day values for recreation used by the U.S. Army Corps of Engineers range from $3.96 to $11.89 for general use such as hiking on trails, and from $16.10 to $47.05 for specialized activities that require specialized equipment and expertise. Wilbert V. Paynes, Memorandum for Planning Community of Practice: Economic Guidance Memorandum, 17-03, Unit Day Values for Recre-ation for Fiscal Year 2017, U.S. Army Corps of Engineers, 2016.
50 Oregon State University, “Recreation Use Values Database,” accessed July 6, 2017, http://recvaluation.forestry.oregonstate.edu/database.
51 This is consistent with the economic law of diminishing marginal utility, which recognizes that the more of a good one consumes, within a given time and holding all else constant, the smaller the gain in the total utility derived from each additional amount. Util-ity, in this case, is the amount of satisfaction derived from the consumption of park and trail amenities.
person visits average value per visit value (2017$)
Total 3,660,000 $4.60 $16,800,000

the economic benefits of parks, trails, and conserved open spaces in beaufort county, south carolina24
Health care cost savingsACCESS TO PARKS, TRAILS, AND PUBLICLY ACCESSIBLE CONSERVED OPEN SPACES CAN HELP a community meet health goals and reduce medical costs. The physical benefits of public open spaces are well documented. There are many potential ways by which nature has been empirically tied to specific physical and mental health outcomes.52 It is well established that increased access to public outdoor spaces encourages people to exercise more, reducing overall health care expenditures.53 Public health can be improved by making cities more friendly to bikers and walkers.54 Physical exercise can reduce the likelihood of illnesses such as obesity, cardiovascular disease, diabetes, or arthritis, and consequently, it can reduce the associated medical costs.55 Similarly, studies have found that physical inactivity and poor diet are the second leading cause of death in the United States.56 Investment in public open space encourages behavioral changes that not only reduce chronic diseases and health care costs, but also improve quality of life.57
In addition to physical benefits, research indicates that people who have increased exposure to the outdoors show long-term mental health improvements. Several studies have demonstrated that access to public outdoor spaces can decrease stress, aid in mental fatigue recovery, and reduce levels of depression and anxiety.58 Exposure to natural environments or more green areas provides further benefits. Researchers have found that leisurely walks in natural environments lead to a 12 percent decrease in the stress hormone cortisol and are linked to fewer cases of depression and lower perceived stress.59 In addition, women living with a higher amount of greenness around their homes had a 12 percent lower rate of death from non-accidental causes compared to women living with the least amount of greenness.60
The Robert Wood Johnson Foundation recently ranked Beaufort the healthiest of South Carolina’s 46 counties, taking into consideration length of life, quality of life, health behavior (including physical inactivity and access to exercise opportunities), clinical care, social and economic factors, and the physical environment. For example, Beaufort County residents are more physically active on average. That is, only 15 percent of Beaufort County’s population is physically inactive, compared to 24 percent of the state’s residents. Beaufort County residents also have more access to exercise opportunities. That is, 80 percent of the county’s residents have access to exercise opportunities, compared to 71 percent of the state’s population.61
52 Ming Kuo, “How Might Contact with Nature Promote Human Health? Promising Mechanisms and a Possible Central Pathway,” Frontiers in Psychology 6 (2015): 1-8.
53 A. T. Kaczynski and K. A. Henderson, “Parks and Recreation Settings and Active Living: A Review of Associations with Physical Activity Function and Intensity,” Journal of Physical Activity and Health 5, no. 4 (2008): 619–632; Chenoweth and Associates, The Economic Costs of Overweight, Obesity, and Physical Inactivity Among California Adults—2006, California Center for Public Health Advocacy, 2009.
54 Janette Sadik-Khan and Seth Solomonow, “Improving Public Health by Making Cities Friendly to Walking and Biking,” Health Care Policy and Law 177, no. 5 (2017): 613-614.
55 Kaczynski and Henderson, “Parks and Recreation Settings and Active Living.”56 A. H. Mokdad et al., “Actual Causes of Death in the United States, 2000,” Journal of the American Medical Association 291 (2004):
1238–1245; Centers for Disease Control and Prevention, The Burden of Chronic Diseases and Their Risk Factors: National and State Perspectives, 2002, National Center for Chronic Disease Prevention and Health Promotion, 2003.
57 P. Veugelers, F. Sithole, and S. Zhang, “Neighborhood Characteristics in Relation to Diet, Physical Activity and Overweight of Cana-dian Children,” International Journal of Pediatric Obesity 3 (2008): 152–159.
58 Ibid. Ian Alcock et al., “Longitudinal Effects on Mental Health of Moving to Greener and Less Green Urban Areas,” Environmental Science and Technology 48, no. 2 (2014): 1247–1255.
59 M. R. Marselle, K. N. Irvine, and S. L. Warber, “Examining Group Walks in Nature and Multiple Aspects of Well-Being: A Large-Scale Study,” Ecopsychology 6, no. 3 (2014): 134–147; Claude Bouchard, Steven N. Blair, and William Haskell, Physical Activity and Health (Human Kinetics, 2012); Ronald Sturm and Deborah Cohen, “Proximity to Urban Parks and Mental Health,” Journal of Mental Health Policy and Economics 17, no. 1 (2014): 19–24.
60 Peter James et al., “Exposure to Greenness and Mortality in a Nationwide Prospective Cohort Study of Women,” Environmental Health Perspectives 124, no. 9 (2016): 1344-1352.
61 Beaufort Memorial Hospital, Community Health Needs Assessment September 2016, 2016; Robert Wood Johnson Foundation, “County Health Rankings and Roadmap: Beaufort County, SC,” accessed July 6, 2017, http://www.countyhealthrankings.org/app/south-carolina/2017/rankings/beaufort/county/outcomes/overall/snapshot.

25the economic benefits of parks, trails, and conserved open spaces in beaufort county, south carolina
Despite Beaufort County’s health rankings relative to other counties in the state, physical inactivity and obesity are challenging health problems and have significant impacts on the resident population. Beaufort County ranked the third-lowest overweight county in the state in 2010; however, a majority of adults, 56.9 percent, were overweight or obese.62 In 2013, Beaufort County’s total estimated cost due to physical inactivity was $161 million, or $1,180 per adult.63 In fact, in Beaufort Memorial Hospital’s 2016 Community Health Needs Assessment, the hospital assessed its efforts in responding to the needs of its community. In the assessment, the hospital identified three strategies to that end: continuing to build capacity to prevent and address obesity, continuing to address chronic disease management, and supporting programs to address social determinants of health.64
In this analysis, The Trust for Public Land measured the collective economic savings realized on an annual basis by residents of Beaufort County who use the parks, trails, and conserved open spaces in the county to exercise. The Centers for Disease Control and Prevention (CDC) recognizes that physical activity helps improve overall health and reduces the risk for chronic diseases. As such, the CDC promotes physical activity guidelines, defining sufficient activity as at least 150 minutes of moderate-intensity activity per week or at least 75 minutes of vigorous-intensity activity per week, along with muscle-strengthening activities at least two days per week. For seniors, the thresholds for moderate-intensity and vigorous-intensity physical activity are higher: 300 and 150 minutes, respectively.65
Having access to places to walk can help individuals meet recommendations for regular physical activity.66 Parks are some of the most commonly reported convenient places to improve physical and
62 South Carolina Department of Parks, Recreation and Tourism, SCORP.63 South Carolina Department of Health and Environmental Control, 2013 Beaufort County Obesity Fact Sheet, 2013.64 Beaufort Memorial Hospital, Community Health Needs Assessment.65 Centers for Disease Control and Prevention, “How Much Physical Activity Do Adults Need?,” accessed October 5, 2017, http://
www.cdc.gov/physicalactivity/everyone/guidelines/adults.html.66 B. Giles-Corti and R. J. Donovan, “The Relative Influence of Individual, Social, and Physical Environment Determinants of Physical
Activity,” Social Science and Medicine 54 (2002): 1793–1812.
aj p
ierr
o p
ho
tog
raph
y

the economic benefits of parks, trails, and conserved open spaces in beaufort county, south carolina26
mental health, especially if the space is well maintained, safe, and accessible.67 From a public health perspective, parks provide low-cost, high-yield wellness opportunities.68
Based on the CDC’s guidelines for physical activity, The Trust for Public Land used the results of the professionally conducted telephone survey (see Appendix A ) to determine how many adults were using the parks, trails, and publicly accessible conserved open spaces at a frequency and intensity that would result in medical care cost savings.69 The Trust for Public Land conservatively defines vigorous- and moderate-intensity physical activity according to the guidelines developed by the CDC and assumed the lowest level of intensity possible for each activity.70 That is, if the respondent reported bicycling, The Trust for Public Land assumed he or she did so at a leisurely pace on level terrain, which qualifies as a moderate activity, rather than bicycling at a brisk pace or on steep uphill terrain, which qualifies as a vigorous activity. The Trust for Public Land limited vigorous-intensity activity to running or jogging. Moderate-intensity activities included walking, hiking, biking, swimming, exercising in a pool, water sports, skateboarding, playing sports, using recreation center amenities, and other types of physical activity or exercise in parks, trails, and conserved open spaces. The health analysis does not include sedentary or low-heart-rate activities, such as picnicking, wildlife watching, fishing, or photography. In addition, individuals must use the parks, trails, and conserved open spaces exclusively to an extent that is sufficient to meet the CDC’s physical activity guidelines. This analysis does not include individuals who use private facilities in conjunction with public facilities to meet the CDC’s physical activity thresholds.
This analysis finds that 5,790 adult residents of Beaufort County improve their health to a degree that meets the CDC’s physical activity guidelines by using the parks, trails, and publicly accessible conserved open spaces in Beaufort County exclusively.71
Based on previous work in health care economics, The Trust for Public Land assigned a value of $1,200 as the annual medical cost savings between those in Beaufort County who exercise regularly and those who do not. The Trust for Public Land chose this value based on a careful review of health care economics literature that focuses on the cost difference between physically active and inactive persons. The cost savings was based on the National Medical Expenditures Survey and has been widely cited in similar studies.72 The Trust for Public Land adjusted the medical care cost savings for inflation and converted the value to 2017 dollars.73 The Trust for Public Land doubled the health care cost savings for persons over age 65 because seniors typically incur two or more times the medical care costs of younger adults.74 This doubling of health care cost savings is conservative. For example, one study found that average health care expenses for adults over 65 were over three times those of working-age people.75
In 2017, the combined health savings gained by residents of Beaufort County who were physically active in the parks, trails, and conserved open spaces of Beaufort was $7.91 million (see Table 12 ).
67 K. E. Powell, L. M. Martin, and P. P. Chowdhury, “Places to Walk: Convenience and Regular Physical Activity,” American Journal of Public Health 93, no. 9 (2003): 1519–1521.
68 M. A. Barrett and Daphne Miller, “Parks and Health: Aligning Incentives to Create Innovations in Chronic Disease Prevention,” Preventing Chronic Disease (2014).
69 See Appendix A for more information about the survey questionnaire that was used to estimate the health care cost savings.70 Centers for Disease Control and Prevention, General Physical Activities Defined by Level of Intensity, accessed October 5, 2017,
http://www.cdc.gov/nccdphp/dnpa/physical/pdf/pa_intensity_table_2_1.pdf.71 This analysis does not include individuals who use the park system fewer than two times per week or 104 times per year.72 M. Pratt, C. A. Macera, and G. Wang, “Higher Direct Medical Costs Associated with Physical Inactivity,” Physician and Sports Medi-
cine 28, no. 10 (2000): 63–70.73 The Trust for Public Land used the unadjusted medical cost consumer price index to account for inflation. U.S. Department of
Labor, Bureau of Labor Statistics, Consumer Price Index for All Urban Consumers, Not Seasonally Adjusted, U.S. City Average for Medical Care, accessed August 10, 2017, www.data.bls.gov.
74 Roland D. McDevitt and Sylvester J. Schieber, From Baby Boom to Elder Boom: Providing Health Care for an Aging Population (Washington, DC: Watson Wyatt Worldwide, 1996).
75 U.S. Department of Health and Human Services, Agency for Healthcare Research and Quality, “The High Concentration of U.S. Health Care Expenditures,” accessed October 5, 2017, http://www.ahrq.gov/research/findings/factsheets/costs/expriach/index.html#HowAre.

27the economic benefits of parks, trails, and conserved open spaces in beaufort county, south carolina
This estimate is conservative because it does not include health care cost savings that result when children use these resources to an extent that makes them healthier. It has been shown that public outdoor spaces also provide important benefits to children and childhood development.76 Multidisciplinary research has consistently shown that children’s play, playgrounds, and parks are linked to positive development of neural pathways for large and small motor skills, and social skills.77
Parks and the outdoors can provide additional benefits to children with developmental disorders. For example, one study on the effects of outdoor playtime on children with attention-deficit/ hyperactivity disorder (ADHD) showed that a 20-minute exposure to the outdoors, such as walking in the park, improved concentration just as effectively as common prescription medications.78 Similarly, other studies have found that limited or no access to nature leads to higher rates of ADHD and other mental disorders.79
76 J. Eccles and J. Gootman, Community Programs to Promote Youth Development (Washington, DC: National Academy Press, 2002).77 S. Hudson and D. Thompson, “Are Playgrounds Still Viable in the 21st Century?,” Parks & Recreation 36 (2001); L. Palmer, Develop-
mental Brain Stimulation in School and Day Care Settings: SMART Overview (Winona, MN: Office of Accelerated Learning, Winona State University, 2003); Mary S. Rivkin, Outdoor Experiences for Young Children, ERIC Digest, 2000; Bruce Perry, Lea Hogan, and Sarah J. Marlin, “Curiosity, Pleasure and Play: A Neurodevelopmental Perspective,” Haaeyc Advocate 20 (2000): 9-12.
78 A. F. Taylor and F. E. Kuo, “Children with Attention Deficits Concentrate Better After Walk in the Park,” Journal of Attention Disorder 12, no. 5 (2009): 402–409.
79 A. F. Taylor, F. E. Kuo, and W. Sullivan, “Coping with ADD: The Surprising Connection to Green Play Settings,” Environment and Behavior 33 (2001): 54–77.
category value (2017$)
Adults 18–64 years of age
Number of adults (18–64) physically active in parks* 4,980
Average annual medical care cost difference between active and inactive persons between 18 and 64 years old $1,200
Subtotal of health care benefits (18–64) $5,990,000
Adults 65 years of age and older
Number of adults (65+) physically active in parks* 801
Average annual medical care cost difference between active and inactive persons over 65 years old $2,400
Subtotal of health care benefits (65+) $1,930,000
Total adults physically active in parks* 5,790
Total annual value of health benefits from parks $7,910,000
*Calculations are based on persons using the parks, trails, and conserved open spaces in Beaufort County exclusively to engage in sufficient levels of moderate- and/or vigorous-intensity activity that meets the CDC’s physical activity guidelines.
TABLE 12. ESTIMATED HEALTH BENEFITS OF PHYSICAL ACTIVITY IN THE PARKS, TRAILS,
AND CONSERVED OPEN SPACES IN BEAUFORT COUNTY
the economic benefits of parks, trails, and conserved open spaces in beaufort county, south carolina28
Economic developmentParks, trails, and conserved open spaces support Beaufort County’s economic development in two important ways. First, they are scenic amenities that provide diverse leisure opportunities for residents and visitors and enhance quality of life in Beaufort County. The high quality of life, in turn, attracts talent, employers, and investment to the community. Second, residents take advantage of the county’s plentiful outdoor recreation opportunities. By purchasing equipment and gear to use while participating in those activities, residents boost local recreation businesses and contribute to Beaufort County’s recreation economy.
This section explores economic development in Beaufort County as related to parks, trails, and conserved open spaces by examining how these amenities enhance quality of life, boost the recreation economy, and support local businesses. The expanded economic development section in Appendix B includes in-depth statistics on participation in recreation and annual household spending on sports and recreation equipment, indices of market and spending potential, and a comparison of Beaufort County with the national average and five comparison communities. The section also explores common household types using Esri Tapestry Segmentation to shed light on residents’ recreation and purchasing habits.
Enhancing quality of lifeBeaufort County is an attractive area for businesses and employees. The county is home to three military installations, the historic city of Beaufort, and the Hilton Head Island resort community. The county has a robust business community fueled by tourism, the military, the retirement industry, residential development, education, and health care. Quality of life in the county is recognized for its importance in continuing to attract these industries and the businesses and talented employees on which they depend. The top industries in terms of employment are accommodation and food services, retail trade, health care and social assistance, and construction.
According to the University of South Carolina, opportunities for recreation and tourism are key for economic development.80 Parks in southern Beaufort County are integral to the region’s quality of life and economy and are essential to providing access to residents and tourists.81 Although the business environment plays a large role in attracting and retaining businesses and encouraging redevelopment, parks, recreation opportunities, and other community assets play into the equation as well. This is especially important as the County seeks to include more skilled and knowledge-based jobs, such as those in manufacturing, finance, and technology.82 According to Shellie West, the CEO and founder of the Greater Bluffton Chamber of Commerce, “When companies consider moving to this area they are looking at the big picture. They’re considering amenities that will keep people here and draw new people to live in the community —things like infrastructure, parks and recreation, affordable housing, affordable childcare and good schools. Investments in parks and trails, and other community assets, like pools, tennis courts, playgrounds, and other outside recreation help stimulate the overall well-being of the working community and make it more desirable for new and relocating businesses.”83 In fact, the Don Ryan Center for Innovation, which specializes in helping startups and recruiting companies to the South Carolina Lowcountry, highlights the area’s parks and opportunities for watersports, outdoor recreation, and organized sports programming.84
80 University of South Carolina, Underappreciated Assets.81 Town of Bluffton, Town of Hilton Head Island, and Beaufort County, Southern Beaufort County Regional Plan, 2006.82 Beaufort County, “Chapter 7—Economic Development,” in Beaufort County Comprehensive Plan, 2010.83 Shellie West, Greater Bluffton Chamber of Commerce, e-mail message to author, July 13, 2017.84 Don Ryan Center for Innovation, “Culture and Recreation,” accessed July 7, 2017, https://www.donryancenter.com/culture-recre-
ation.

29the economic benefits of parks, trails, and conserved open spaces in beaufort county, south carolina
Parks, trails, and conserved open spaces influence decisions of people’s decisions to live, visit, and operate businesses in the county. Matthew McAlhaney, owner of City Loft Hotel, says “In my hometown of Beaufort, SC, it is not lost on me, my colleagues or competitors that the open spaces, parks and preserved vistas are in and of themselves a key component to the economic engine that drives our small island town. A seven acre passive waterfront park, preserved vistas along the bluff overlooking the Beaufort River, open spaces at the termination of nearly every street in our most historic neighborhood and an abundance of public boat landings are in large part the reason people chose to visit and live here.”85
Several municipalities in the county have received accolades for their quality of life. In 2015, Bluffton was named the third best town in which to raise a family in South Carolina by Niche.com, a company that ranks communities based on their overall livability. Bluffton was also included in lists of the best places to retire by Forbes in 2014 and Money in 2015. Bluffton was also considered the best place for waterfront living by Money in 2015 and a southern dream town by Garden & Gun.86 Beaufort was included in Smithsonian Magazine’s 2014 list of best small towns in the United States and was named America’s happiest seaside town in 2013 by Coastal Living.87
Boosting the recreation economyResidents use Beaufort County’s parks, trails, and conserved open spaces for many types of activities. These activities generate economic activity and support businesses, including those that sell recreation-related equipment. The Trust for Public Land used Esri Business Analyst to examine and better understand the recreation-related economic activity occurring in Beaufort County, which is fueled by the recreation opportunities provided by public and private amenities. Golf courses provide an example of private amenities that support the recreation economy. In Beaufort County, 50 golf courses generate $132 million in sales and support 2,800 employees. The presence of the
85 Matthew McAlhaney, owner, City Loft Hotel, e-mail message to author, July 20, 2017.86 Don Ryan Center for Innovation, “Accolades,” accessed July 7, 2017, https://www.donryancenter.com/accolades.87 City of Beaufort, “Awards and Items of Note,” accessed July 7, 2017, http://www.beaufortsc.org/media/images/Awards.pdf.
beau
fort
co
unty
ope
n l
and
tru
st

the economic benefits of parks, trails, and conserved open spaces in beaufort county, south carolina30
private market, and the willingness of residents to pay for access to these private resources, clearly demonstrate that residents value recreational amenities. Both public and private amenities support the recreation-related business, sales, and employment figures that are summarized in this section of the report. Data are not available to differentiate where consumers plan to use the sporting goods they purchase. In addition, it would not be appropriate to separate sporting goods sales that are supported by public and private recreation amenities since both are essential components of the recreation economy and the private amenities are complementary to, not a substitute for, the available public amenities.
Recreation activities are important to the residents of Beaufort County. According to Esri Business Analyst, residents of many households in Beaufort County recreate in parks, trails, and conserved open spaces. In the last 12 months, 29.2 percent of households reported walking for exercise, the highest-reported activity. In addition, greater than 10 percent of households reported swimming, jogging or running, golfing, freshwater fishing, and weight lifting. Individuals who participate in these recreation activities purchase products to enhance their experience, such as exercise clothing, footwear, and fishing equipment, and thereby contribute to the local economy.
For more information on Beaufort County households’ participation in recreation activities, see Table B1 in Appendix B . Also, see Appendix B for an exploration of top Beaufort County household types through Esri Tapestry Segmentation, including the relationship of these groups to fitness, recreation, and sports activities.
There is a strong market for recreation goods and services in Beaufort County. The market potential index (MPI) measures the likely demand for a good or service in an area compared to the U.S. average. Business Analyst estimates that for recreation activities in Beaufort County, the MPI is higher than the national average for many activities, including (in descending order) golfing, saltwater fishing, downhill skiing, power boating, walking for exercise, swimming, weight lifting, mountain bicycling, motorcycling, canoeing and kayaking, and target shooting (see Table B1 in Appendix B ). The MPI is calculated for a host of recreational activities, including those that may be of limited availability in Beaufort County (e.g., skiing) or unrelated to parks, trails, and conserved open space (e.g., golfing). However, considering the MPI across all recreational opportunities can provide a sense of the state of the recreation economy in Beaufort County. These data demonstrate that residents of Beaufort County are significantly more likely to spend money on gear and equipment related to recreational activities when compared to households nationally. Beaufort County residents who spend money on sports and recreation equipment are likely to spend a significant amount. Of the 20.1 percent of Beaufort County households that purchased sports and recreation equipment in the last 12 months, 7.7 percent spent $250 or more on sports and recreation equipment; 6.1 percent spent $100–$249; and 6.3 percent spent $1–$99 (see Table B2 in Appendix B ). Spending levels and market potential for parks and recreation spending are slightly higher in Beaufort County when compared with the averages of five comparison counties: Charleston County, South Carolina; Chatham County, Georgia; Glynn County, Georgia; Greenville County, South Carolina; and Horry County, South Carolina (see Table B4 in Appendix B ).88
Beaufort County households spend a total of $12.8 million annually on sports, recreation, and exercise equipment, or an average of $179 per year. For example, this includes average household spending of $52.70 on hunting and fishing equipment per year. For a complete listing of the sports, recreation, and exercise equipment spending categories, see Table B3 in Appendix B . Esri Business Analyst compiles estimates of recreation expenditures and calculates a spending potential index (SPI) that represents the amount spent for a product or service relative to the national average. The SPI for sports, recreation, and exercise equipment and the categories within is higher in Beaufort
88 Average annual household spending is higher than all five other counties, as is spending potential. Market potential is higher than the average of the five other counties, with the exception of spending between $100 and $249.
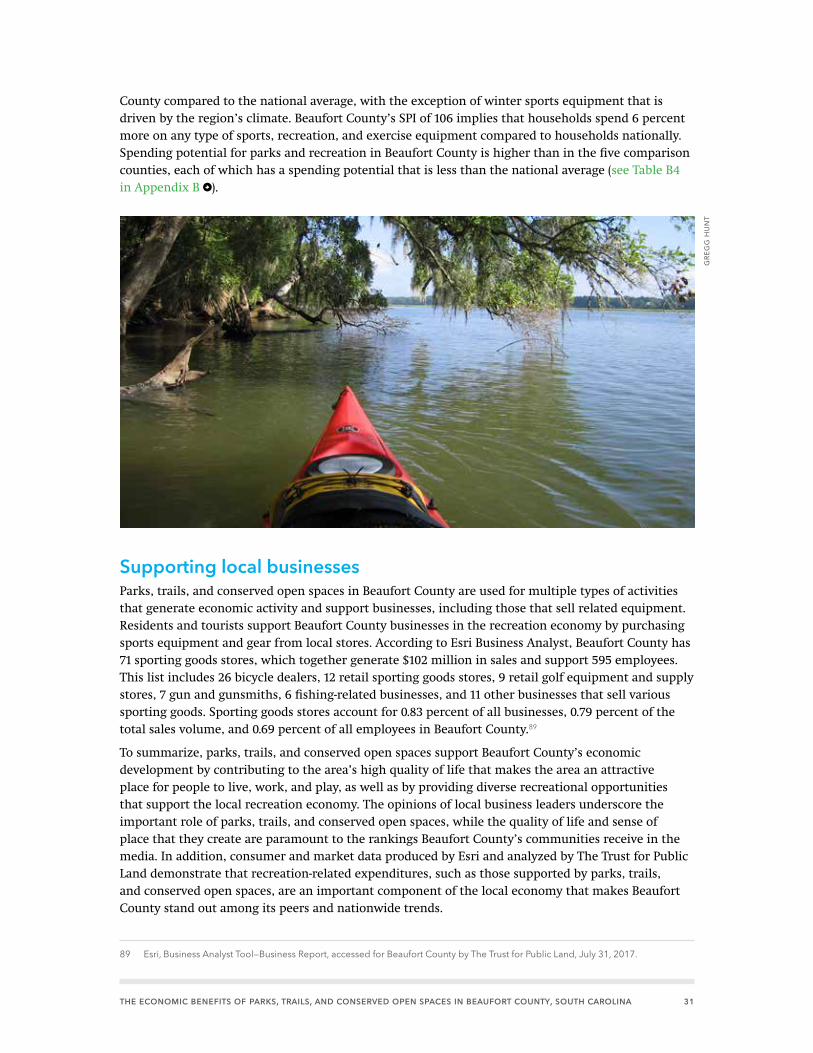
31the economic benefits of parks, trails, and conserved open spaces in beaufort county, south carolina
County compared to the national average, with the exception of winter sports equipment that is driven by the region’s climate. Beaufort County’s SPI of 106 implies that households spend 6 percent more on any type of sports, recreation, and exercise equipment compared to households nationally. Spending potential for parks and recreation in Beaufort County is higher than in the five comparison counties, each of which has a spending potential that is less than the national average (see Table B4 in Appendix B ).
Supporting local businessesParks, trails, and conserved open spaces in Beaufort County are used for multiple types of activities that generate economic activity and support businesses, including those that sell related equipment. Residents and tourists support Beaufort County businesses in the recreation economy by purchasing sports equipment and gear from local stores. According to Esri Business Analyst, Beaufort County has 71 sporting goods stores, which together generate $102 million in sales and support 595 employees. This list includes 26 bicycle dealers, 12 retail sporting goods stores, 9 retail golf equipment and supply stores, 7 gun and gunsmiths, 6 fishing-related businesses, and 11 other businesses that sell various sporting goods. Sporting goods stores account for 0.83 percent of all businesses, 0.79 percent of the total sales volume, and 0.69 percent of all employees in Beaufort County.89
To summarize, parks, trails, and conserved open spaces support Beaufort County’s economic development by contributing to the area’s high quality of life that makes the area an attractive place for people to live, work, and play, as well as by providing diverse recreational opportunities that support the local recreation economy. The opinions of local business leaders underscore the important role of parks, trails, and conserved open spaces, while the quality of life and sense of place that they create are paramount to the rankings Beaufort County’s communities receive in the media. In addition, consumer and market data produced by Esri and analyzed by The Trust for Public Land demonstrate that recreation-related expenditures, such as those supported by parks, trails, and conserved open spaces, are an important component of the local economy that makes Beaufort County stand out among its peers and nationwide trends.
89 Esri, Business Analyst Tool—Business Report, accessed for Beaufort County by The Trust for Public Land, July 31, 2017.
gre
gg
hun
t

the economic benefits of parks, trails, and conserved open spaces in beaufort county, south carolina32
FarmingWORKING FARMS DIVERSIFY BEAUFORT COUNTY’S ECONOMY AND PRESERVE A WAY OF LIFE that has a long history in the region. Beaufort County’s working farms supply jobs, provide locally sourced produce, and support the quality-of-life factors such as sense of place and cultural identity that make the area a draw for residents and visitors alike. As recently as 2016, for example, a feature in Vogue highlighted several Beaufort County farms as top attractions for the county.90 These same quality of life factors have led to tremendous population growth in the county over the last decade, which has further fueled economic activity in the region. At the same time, this growth pressures remaining agricultural lands by driving up property values and incentivizing the development of farmland. Conserved open spaces, including agricultural easements, allow Beaufort County’s farms to continue creating benefits throughout the community for generations to come.
Beaufort County has a long and robust history of agricultural production. It is one of the largest producers of tomatoes, melons, and vegetables in the state (Table 13 ). According to the 2012 Census of Agriculture, there are 137 farms in Beaufort County, comprising 42,200 acres of land. To protect the financial information of individual farms, the Census withheld sales information for Beaufort County in 2012; however, data from 2007 indicate that farms in the county sold $28.3 million in agricultural products.91 There are large operations across the county, such as Seaside Farm on St. Helena Island. Established in the early 1900s, the family-owned Seaside Farm is one of the earliest commercial tomato farms on the East Coast, producing up to 20 million pounds of tomatoes each year.92 Alongside these are places such as Dempsey Farms, a family-operated farm that grows a variety of fruits and vegetables throughout the year, which residents can purchase locally as well as pick themselves directly at the farm.93 Working lands contribute to Beaufort County’s historical identity but also to its present-day economy.
TABLE 13. TOP CROPS IN BEAUFORT COUNTY BY ACREAGE (2012)94
Beaufort County’s growing reputation as a quality place to live has caused land value to increase, resulting in development pressure on agricultural lands. Farmland in the county is among the most expensive in the state,95 and the result is that agricultural lands in the county are shrinking rapidly.
90 Daniel Scheffler, “Beaufort: One of South Carolina’s Most Charming Small Towns,” Vogue, March 3, 2016, accessed September 7, 2017, https://www.vogue.com/article/beaufort-travel-guide-south-carolina-small-town.
91 U.S. Department of Agriculture, 2012 Census of Agriculture, County Profile: Beaufort County, South Carolina, 2014. 92 Seaside Farm, Inc., “Heritage,” accessed September 7, 2017, http://seasidefarm.com/heritage/.93 Josh Mitelman, “Dempsey Farms, Popular Strawberry Grower, Open Again for Picking,” Island Packet, March 22, 2017, accessed
September 9, 2017, http://www.islandpacket.com/news/local/community/beaufort-news/article140049818.html. 94 U.S. Department of Agriculture, 2012 County Profile: Beaufort.95 Based on estimated market value of land and buildings. The average cost per acre of farmland in South Carolina is $2,981. In
Beaufort County, the average value per acre of farmland is $3,382. This ranks 15th out of the state’s 46 counties. U.S. Department of Agriculture, 2012 Census of Agriculture, South Carolina, State and County Data: County Summary Highlights, 2014.
crop acres under production state rank
Vegetables harvested, all 2,280 3
Tomatoes in the open Data not publicly available* 1
Soybeans for beans 804 36
Corn for grain 795 31
Watermelon 674 3* 2012 Census of Agriculture acreage totals for open tomato crops were withheld for Beaufort County to protect the financial information of individual farms. U.S. Department of Agriculture, 2012 County Profile: Beaufort.

33the economic benefits of parks, trails, and conserved open spaces in beaufort county, south carolina
From 2007 to 2012, while the number of active farms in Beaufort County actually increased slightly from 125 to 137, the acreage of farmland in Beaufort County decreased 14.6 percent from 49,400 acres to 42,200 acres over the same period.96 These trends are not unique to Beaufort County but rather are found in the entire region of the South Carolina Lowcountry. Looking at the nearby Tri-County Area of Berkeley, Charleston, and Dorchester Counties, a 2000 report by Clemson University found that more than half of the remaining cultivated land in the region could be developed by 2030.97
These trends seem to suggest that farmland loss may be an inevitable product of population growth and development in the Lowcountry; however, growth and farmland loss do not have to be synonymous. The same analysis by Clemson University goes on to note that “economic growth is not the problem”; rather the problem is how “the region accommodates the growth, [and] how the different communities physically develop.”98 That is, balanced land use can be a key tool to ensure that both the economic benefits of a robust farming industry and the benefits of continued growth are realized in Beaufort County.
Conservation easements are among the most effective planning tools for supporting the continued success of farming in Beaufort County.99 By removing development rights from farm properties, conservation easements help relieve development pressure on farms, keep working farms intact, and may provide tax savings to farmers. Used as part of a balanced land use planning strategy at the county level, conservation easements can also leverage outside investment to bring new funding to the county. An early example in the county was Sanders Farm on St. Helena Island. An easement was purchased on this 160-acre farm in 2007, protecting farmland that has been farmed by the same family for over 100 years while also helping to protect the surrounding Gullah-Geechee community. Because of the significance of this project, the RCLPP was able to leverage federal investment from
96 U.S. Department of Agriculture, 2012 County Profile: Beaufort.97 South Carolina Water Resources Center and Strom Thurmond Institute at Clemson University, Cultivated Agriculture Lands at Risk
from Potential Urbanization in the Tri-County Area, 2000.98 Ibid.99 Ibid.
nur
nbe
rg p
ho
tog
raph
y, l
lc

the economic benefits of parks, trails, and conserved open spaces in beaufort county, south carolina34
the U.S. Department of Agriculture’s former Farm and Ranch Lands Protection Program (currently the Agricultural Conservation Easement Program) as well as state investment from South Carolina’s Conservation Bank to make the purchase possible.100 The RCLPP has been a particularly useful tool for attracting state and federal land protection funding because of its ability to meet the matching funding requirements for these programs. In 2010, for example, 100 percent of the Farm and Ranch Lands Protection Program funds awarded in South Carolina went to Beaufort County.101
Beyond attracting state and federal investment, conservation easements are supporting farms across Beaufort County by keeping working lands active. This includes the 149 acres under conservation easement on St. Helena Island that are a part of Coosaw Farms. The blueberry fields were acquired as part of the family’s sustainability plan for good crop diversity.102 The conservation easement on these lands, held by Beaufort County Open Land Trust,103 ensured that the market price of the land reflected the agricultural value of production when the land was acquired by Coosaw Farms. Agricultural easements have been, and will continue to be, an important means of ensuring the continued success Beaufort County’s farming industry.
Even farms without agricultural easements benefit from nearby easements because those easements provide stability and ensure the permanence of farming and supporting industries in an area. Farm supply stores know they will have enough customers each season to remain open. Meanwhile, nearby farmers without easements can continue to invest in their properties because they know the industry will remain intact. In this way, easement benefits spill over across the entire agricultural sector.
Beaufort County’s agricultural lands are significant economic producers in the county. They also contribute to the quality-of-life and sense-of-place factors that have driven population growth in the region over the last 20 years. At the same time, this growth is increasing pressure to convert remaining agricultural lands to other forms of development. This long-term trend is threatening the continued viability of the industry as a whole, as well as its many and varied contributions to the county’s economy and sense of place. Recognizing the importance of these working lands, conservation efforts, such as agricultural easements, are a key tool for the continued viability of this important piece of Beaufort County’s economy.
100 The Trust for Public Land, “Sanders Farm, St. Helena Island,” accessed September 9, 2017, https://www.tpl.org/our-work/sanders-farm-st-helena-island#sm.0001jzm2lqcsefeyrav2bzqfriti4.
101 Beaufort County Rural and Critical Land Preservation Program, “Get to Know the Rural and Critical Land Preservation Program,” accessed September 11, 2017, http://ruralandcritical.org/land-preservation-program/.
102 Coosaw Farms, “Farm and Family,” accessed September 9, 2017, http://www.coosawfarms.com/about-our-farm/farm-and-family/.103 Beaufort County Open Land Trust, Annual Report 2016, 2016.

35the economic benefits of parks, trails, and conserved open spaces in beaufort county, south carolina
DefenseTHE DEFENSE INDUSTRY IS AN INTEGRAL PART OF THE COMMUNITY, CULTURE, AND ECONOMY OF BEAUFORT
COUNTY. The successful operation of defense installations requires integrative land use planning that includes buffers around installations made up of open and working lands. These spaces allow defense training, testing, and operations to take place while minimizing encroachments from land uses that would negatively affect both citizens and the military. As Beaufort County continues to grow at a rapid rate, its open spaces are playing an increasingly valuable role in supplying the buffer zones between military and civilian land. This section will document the economic importance of the military community in Beaufort County and highlight the importance of conserved open spaces as a component of this industry.
Beaufort County’s military community is significant. Three installations—Marine Corps Air Station (MCAS) Beaufort, the Marine Corps Recruit Depot (MCRD) Parris Island, and the Naval Hospital Beaufort—are located in the county, as well as the South Carolina National Guard, numerous military contractors, veterans, and military retirees. A 2017 study by the University of South Carolina looked at the economic impacts of the military community across South Carolina. It found the annual economic impact in the Beaufort region to be the fourth largest in the state, totaling $2.3 billion annually, supporting 19,500 jobs and $1.0 billion in labor income.104 Looking just at the three military installations located in Beaufort County, the study found the total economic impact to be $1.74 billion, with approximately 14,900 jobs and $822 million in labor income. Beaufort’s military presence not only contributes to the nation’s defense; it also is a critical driver of the county’s robust economy.
Defense installations and conserved lands were not historically thought of as related concepts. However, starting in the late 1990s the Department of Defense (DoD) became alarmed by growing populations and development on areas adjacent to installations. These developments posed a risk to successful and safe operations. DoD termed the problem “encroachment” and began searching for means of mitigation.105
One market-based solution that has proved very successful has been purchasing conservation easements on civilian property surrounding installations. These easements create buffer lands and allow for safe use and operations on installations while preventing conflicting land uses. For instance, land adjacent to an installation might be suitable for forestry, farming, and housing developments. A purchased easement by DoD would allow for forestry and farming while limiting other development. Such an arrangement allows land to remain productive and in private hands and enables DoD to maximize the impact of its budget by not having to purchase buffer lands outright.
The federal government has recognized the importance of such approaches, as well as the mutually beneficial relationship that can exist between defense lands and conservation lands, through the establishment of such programs as the Readiness and Environmental Protection Integration (REPI) Program, and more recently through the Sentinel Landscapes Partnership between the U.S. Departments of Agriculture, Defense, and the Interior. These initiatives foster partnerships between military installations, landowners, conservation groups, farmland interests, and other stakeholders.
104 The economic impact analysis report analyzed South Carolina’s military community based on geographic regions. Data were not available at the county level; however, the Beaufort region highlighted in the report includes Marine Corps Air Station in Beaufort, Marine Corps Recruit Depot in Parris Island, and Naval Hospital Beaufort in Beaufort County, as well as Department of Defense contracting firms, military retirees and veterans, and the South Carolina National Guard and U.S. Army Reserves located in Beau-fort County and the surrounding counties. Joseph C. Von Nessen, The Economic Impact of South Carolina’s Military Community—A statewide and Regional Analysis, May 2017, accessed September 11, 2017, https://www.scmilitarybases.com/wp-content/up-loads/2017/08/2017_SCMBTF_Economic_Impact_Study_R1.pdf.
105 U.S. Department of Defense, REPI 11th Annual Report to Congress—2017 Readiness and Environmental Protection Integration Program, 2017.

the economic benefits of parks, trails, and conserved open spaces in beaufort county, south carolina36
They also provide funding to create compatible land uses surrounding defense installations. From its inception in 2002, the REPI program has generated more than $1.32 billion in funding for land protection surrounding military installations around the country. More locally, this includes $56 million of funding toward 19 land transactions to protect more than 3,700 acres surrounding MCAS Beaufort in Beaufort County.106 Growing federal support and spending on these programs signify the national importance of conserved buffer lands for defense readiness.
Open spaces, including easements, represent compatible land use in buffer zones between military and civilian lands. They provide mutual economic benefit for both DoD installations and civilian populations in Beaufort County. As Beaufort County’s growth continues, conserved open spaces will increasingly support the continued viability and economic impact of the defense industry.
106 Ibid.
Purchased easements provide a “win-win” for Marine Corps Air Station Beaufort and private landownersThe 150 acres of mature pineland in rural Burton had been in William Harvey III’s family for 30 years when he received a call from a local land trust. “Would you be interested in selling your land to the Navy?” the land trust’s attorney asked Harvey. The Navy had not mistaken the pineland for oceanfront property, and they were not interested in buying his land outright. What they were interested in was a conservation easement on the property that would limit its use and development. This was because the land was near MCAS Beaufort and was in the station’s air compatibility zone. The air compatibility zone is designated to protect the health, safety, and welfare of residents and reduce the noise and accident potential. At the time, Harvey and his family were managing the pine stand for timber production and occasional hunting leases. An easement on the land would allow these activities to continue, while preventing developments that might interfere with successful installation operations, such as a residential subdivision. “My family has been in Beaufort for four generations,” notes Harvey, who operates a law practice in Beaufort. “I felt that the air station was important to the community, and there was a local feeling of pride and protection. So I said sure.” MCAS can now expect the land to remain in compatible uses, and according to Harvey, since the easement allows his family the continued use of their land for pine production and hunting, the deal was a “win-win.”
barb
ara
g. h
olm
es

37the economic benefits of parks, trails, and conserved open spaces in beaufort county, south carolina
ConclusionTHIS IS THE FIRST TIME THAT THE ECONOMIC CONTRIBUTIONS OF THE PARKS, TRAILS, AND CONSERVED
OPEN SPACES in Beaufort County have been measured. This study illustrates that these amenities are key economic drivers that contribute millions annually in economic benefits. As explained above, parks, trails, and conserved open spaces in Beaufort County increase the value of nearby residential properties by $127 million and increase property tax revenues by $1.12 million per year. Of those totals, RCL increase property values by $22.5 million and boost tax revenues by $174,000.
In addition, these park, trail, and open space amenities provide natural goods and services. Specifically, by reducing the amount of stormwater, they provide a value of $27.4 million each year, $8.10 million of which is due to RCL. By removing air pollutants that cause damage to structures and endanger human health, the trees and shrubs within parks, trails, and conserved open spaces reduce health care costs and lower pollution control costs by $317,000 per year, $72,900 of which is due to RCL.
Parks, trails, and conserved open space also contribute to the tourism economy. Approximately 9 percent of visitors to Beaufort County come for the primary purpose of visiting these amenities. These visitors spend an estimated $116 million annually in Beaufort County and generate $3.46 million in local tax revenues.
People who live in Beaufort County also benefit from their parks, trails, and conserved open spaces. Each year residents of Beaufort County receive a benefit of $16.8 million for the recreational use of these amenities. Approximately 5,790 adult residents of Beaufort County engage in physical activity at a level sufficient to generate measurable health benefits, yielding annual medical cost savings of $7.91 million.
Parks, trails, and conserved open spaces in the county contribute to the high quality of life, which plays an important role in attracting business and employees to the county and supporting a robust recreation economy. By providing opportunities for recreation, these amenities support $12.8 million in resident spending on sports, recreation, and exercise equipment annually, or an average of $179 per household. Resident and tourist expenditures support 71 sporting goods stores that generate $102 million in sales and provide 595 jobs, further demonstrating that parks, trails, and conserved open spaces are significant contributors to the Beaufort County economy.
Land conservation supports the farming industry in Beaufort County by helping to maintain the working landscape on which this industry depends. The 137 farms in Beaufort County generate approximately $28.3 million in agricultural products annually.
Finally, land conservation helps the U.S. military create safe buffer zones around installations, separating growing communities from defense operations and providing the land needed for vital training missions. Defense is a key industry in Beaufort County, with its three major installations supporting 14,900 jobs.

the economic benefits of parks, trails, and conserved open spaces in beaufort county, south carolina38
BibliographyAlcock, Ian, Mathew P. White, Benedict W. Wheeler, Lora E. Fleming, and Michael H. Depledge. “Longitudinal Effects on Mental Health of Moving to Greener and Less Green Urban Areas.” Environmental Science and Technology 48, no. 2 (2014): 1247–1255.
American Lung Association. “Health Effects of Ozone and Particle Pollution.” Accessed October 4, 2017. http://www.lung.org/our-initiatives/healthy-air/sota/health-risks/.
American Lung Association. State of the Air 2017. 2017. Accessed September 6, 2017. http://www.lung.org/assets/documents/healthy-air/state-of-the-air/state-of-the-air-2017.pdf.
Angst, Maggie. “Report: You Can Breathe Easily in the Southeast… Literally.” The Island Packet. April 19, 2017. Accessed September 6, 2017. http://www.islandpacket.com/news/local/article145519869.html.
Barrett, M. A. and Daphne Miller. “Parks and Health: Aligning Incentives to Create Innovations in Chronic Disease Prevention.” Preventing Chronic Disease. Centers for Disease Control and Prevention (2014). doi: http://dx.doi.org/10.5888/pcd11.130407.
Beaufort County. “Chapter 7—Economic Development.” In Beaufort County Comprehensive Plan. 2010. Accessed October 5, 2017. http://www.bcgov.net/departments/administrative/beaufort-county-council/comprehensive-plan/2010-comprehensive-plan.php.
Beaufort County. “Chapter 99—Stormwater Management.” In Beaufort County, SC Code of Ordinances. Accessed August 24, 2017. https://library.municode.com/SC/Beaufort_County/codes/code_of_ordinances.
Beaufort County Open Land Trust. Annual Report 2016. 2016. Accessed October 5, 2017. https://openlandtrust.org/wp-content/uploads/2017/06/OLT-Annual-Report-2016-FINAL-compressed.pdf.
Beaufort County Rural and Critical Land Preservation Program. “Get to Know the Rural and Critical Land Preservation Program.” Accessed September 11, 2017. http://ruralandcritical.org/land-preservation-program/.
Beaufort Memorial Hospital. Community Health Needs Assessment September 2016. 2016. Accessed October 4, 2017. http://www.bmhsc.org/Resources/15194/FileRepository/Beaufort%20Memorial%20Hospital%20CHNA%202016%20Final%2010%203%2016.pdf.
Bouchard, Claude Steven N. Blair, and William Haskell. Physical Activity and Health. Human Kinetics. 2012.
Broberg, Brad. Everybody Loves a Park: Green Space Is a Premium When Building, Buying, or Selling. National Association of Realtors. On Common Ground (2009): 20–25.
Brunson, Kelly. Research & Digital Marketing Coordinator. Hilton Head Island Chamber of Commerce. E-mail message to the author. August 14, 2017.
Butlin, R. N. “Effects of Air Pollutants on Buildings and Materials.” Proceedings of the Royal Society of Edinburgh. Section B. Biological Sciences 97 (1990): 255–272.
Cebula, Richard J. “The Hedonic Pricing Model Applied to the Housing Market of the City of Savannah and Its Savannah Historic Landmark District.” The Review of Regional Studies 39 (2009): 9-22.
Centers for Disease Control and Prevention. The Burden of Chronic Diseases and Their Risk Factors: National and State Perspectives, 2002. National Center for Chronic Disease Prevention and Health Promotion. 2003.
Centers for Disease Control and Prevention. “General Physical Activities Defined by Level of Intensity.” Accessed October 5, 2017. http://www.cdc.gov/nccdphp/dnpa/physical/pdf/pa_intensity_table_2_1.pdf.
Centers for Disease Control and Prevention. “How Much Physical Activity Do Adults Need?” Accessed October 5, 2017. http://www.cdc.gov/physicalactivity/everyone/guidelines/adults.html.
Chenoweth and Associates. The Economic Costs of Overweight, Obesity, and Physical Inactivity Among California Adults—2006. California Center for Public Health Advocacy. 2009.
Chesapeake Research Consortium. The Economics of Stormwater BMPs in the Mid-Atlantic Region. 1997.
City of Beaufort. “Awards and Items of Note.” Accessed July 7, 2017. http://www.beaufortsc.org/media/images/Awards.pdf.
City of Overland Park, Kansas. “Overland Park Site BMP Cost Analysis.” Olsson Associates. 2007.
Coosaw Farms. “Farm and Family.” Accessed September 9, 2017. http://www.coosawfarms.com/about-our-farm/farm-and-family/.
Crompton, John L. “The Impact of Parks on Property Values: Empirical Evidence from the Past Two Decades in the United States.” Managing Leisure 10 (2005): 203–218.

39the economic benefits of parks, trails, and conserved open spaces in beaufort county, south carolina
Crompton, John L. The Proximate Principle: The Impact of Parks, Open Space and Water Features on Residential Property Values and the Property Tax Base. Ashburn, VA: National Recreation and Park Association, 2004.
Currie, Janet. “Pollution and Infant Health.” Child Development Perspectives 7 (2013): 237–242.
Dawson-House, Dawn. “Tourism Is Now a $19.1 Billion Industry in South Carolina.” South Carolina Department of Parks, Recreation and Tourism. February 17, 2016. Accessed August 4, 2017. https://www.scprt.com/articles/tourism-is-now-a-19-billion-industry-in-south-carolina.
Don Ryan Center for Innovation. “Accolades.” Accessed July 7, 2017. https://www.donryancenter.com/accolades.
Don Ryan Center for Innovation. “Culture and Recreation.” Accessed July 7, 2017. https://www.donryancenter.com/culture-recreation.
Duerr Evaluation Resources. The Benefits of Playgrounds for Children Aged 0–5. Shasta Children and Families First Commission.
Eccles, J. and J. Gootman. Community Programs to Promote Youth Development. Washington, DC: National Academy Press. 2002.
Elswick, Matt. South Carolina Department of Parks, Recreation and Tourism. E-mail message to author. July 20, 2017.
Espey, Molly and Kwame Owusu-Edusei. “Neighborhood Parks and Residential Property Values in Greenville, South Carolina.” Journal of Agricultural & Applied Economics 33 (2001): 487-492.
Esri, Business Analyst Tool—Business Report. Accessed for Beaufort County by The Trust for Public Land. July 31, 2017.
Esri. Business Analyst Tool—Tapestry Segmentation Area Profile. Accessed for Beaufort County by The Trust for Public Land. August 17, 2017.
Esri. Esri Consumer Spending Methodology 2016. 2016. Accessed October 5, 2017. http://downloads.esri.com/esri_content_doc/dbl/us/J9945_2016_US_Consumer_Spending_Data.pdf.
Esri. In Style. 2014. Accessed August 18, 2017. http://downloads.esri.com/esri_content_doc/dbl/us/tapestry/segment17.pdf.
Esri. Methodology Statement: Esri US—Market Potential Database. 2015. Accessed October 5, 2017. http://downloads.esri.com/esri_content_doc/dbl/us/J9672_2015_Market_Potential_DB_Methodology_Statement.pdf.
Esri. Middleburg. Accessed August 18, 2017. http://downloads.esri.com/esri_content_doc/dbl/us/tapestry/segment15.pdf.
Esri. Silver and Gold. 2014. Accessed August 18, 2017. http://downloads.esri.com/esri_content_doc/dbl/us/tapestry/segment40.pdf.
Esri. The Elders. 2014. Accessed August 18, 2017. http://downloads.esri.com/esri_content_doc/dbl/us/tapestry/segment42.pdf.
Esri. Up and Coming Families. 2014. Accessed August 18, 2017. http://downloads.esri.com/esri_content_doc/dbl/us/tapestry/segment27.pdf.
Giles-Corti, B. and R. J. Donovan. “The Relative Influence of Individual, Social, and Physical Environment Determinants of Physical Activity.” Social Science and Medicine 54 (2002): 1793–1812.
Heaney, James P. Costs of Urban Stormwater Control. U.S. Environmental Protection Agency. 2002.
Heaney, James P. and Joong G. Lee. Methods for Optimizing Urban Wet-Weather Control Systems. U.S. Environmental Protection Agency. 2006.
Heffernan, Erin. “Beaufort Count Among Fastest Growing in South Carolina.” The Island Packet. March 23, 2017. Accessed September 6, 2017. http://www.islandpacket.com/news/local/community/beaufort-news/article140294078.html.
Hilton Head Island Chamber of Commerce. “It’s Always the Best of Fun & Sun at Hilton Head Island.” Accessed August 14, 2017. https://www.hiltonheadisland.org/.
Hudson, S. and D. Thompson. “Are Playgrounds Still Viable in the 21st Century?” Parks & Recreation 36 (2001).
James, Peter, Jaime E. Hart, Rachel F. Banay, and Francine Laden. “Exposure to Greenness and Mortality in a Nationwide Prospective Cohort Study of Women.” Environmental Health Perspectives 124, no. 9 (2016): 1344-1352.
Kaczynski, A. T. and K. A. Henderson. “Parks and Recreation Settings and Active Living: A Review of Associations with Physical Activity Function and Intensity.” Journal of Physical Activity and Health 5, no. 4 (2008): 619–632.
Kampa, Marilena and Elias Castanas. “Human Health Effects of Air Pollution, Environmental Pollution.” Environmental Pollution 151 (2007): 362–367.

the economic benefits of parks, trails, and conserved open spaces in beaufort county, south carolina40
Kuo, Ming. “How Might Contact with Nature Promote Human Health? Promising Mechanisms and a Possible Central Pathway.” Frontiers in Psychology 6 (2015): 1-8.
Larson, Eric W. Manager. Beaufort County Stormwater Utility. E-mail message to the author. May 31, 2017.
Luesse, Valerie Fraser. “The South’s Best Small Towns 2017.” Southern Living. Accessed September 9, 2017. http://www.southernliving.com/souths-best/small-towns#beaufort-south-carolina-marsh-view.
Marselle, M. R., K. N. Irvine, and S. L. Warber. “Examining Group Walks in Nature and Multiple Aspects of Well-Being: A Large-Scale Study.” Ecopsychology 6, no. 3 (2014): 134–147.
Matney, Mandy. “Hooray, Hilton Head: Named ‘Best Island’ in the US, No. 2 in the World. Here’s Why.” The Island Packet. July 11, 2017. Accessed August 14, 2017. http://www.islandpacket.com/news/local/article160695859.html.
McAlhaney, Matthew. Owner. City Loft Hotel. E-mail message to author. July 20, 2017.
McConnell, Virginia and Margaret Walls. The Value of Open Space: Evidence from Studies of Nonmarket Benefits. Resources for the Future. 2005.
McDevitt, Roland D. and Sylvester J. Schieber. From Baby Boom to Elder Boom: Providing Health Care for an Aging Population. Washington, DC: Watson Wyatt Worldwide. 1996.
Mitelman, Josh. “Dempsey Farms, Popular Strawberry Grower, Open Again for Picking.” Island Packet. March 22, 2017. Accessed September 9, 2017. http://www.islandpacket.com/news/local/community/beaufort-news/article140049818.html.
Mokdad, A. H., J. S. Marks, D. F. Stroup, and J. L. Gerberding. “Actual Causes of Death in the United States, 2000.” Journal of the American Medical Association 291 (2004): 1238–1245.
Moody, Erin. “Hunting Island tops list of most visited SC state parks in 2014.” The Beaufort Gazette. February 3, 2015. Accessed August 16, 2017. http://www.islandpacket.com/news/local/community/beaufort-news/article33630105.html.
Murray, F. J., L. Marsh, and P. A. Bradford. New York State Energy Plan, Vol. II: Issue Reports. New York State Energy Office. 1994.
Nicholls, Sarah and John Crompton. “The Impact of Greenways on Property Values: Evidence from Austin, Texas.” Journal of Leisure Research 37 (2005): 321–341.
Nowak, David J., Satoshi Hirabayashi, Allison Bodine, and Eric Greenfield. “Tree and Forest Effects on Air Quality and Human Health in the United States.” Environmental Pollution 193 (2014): 119–129.
Nowak, David J., Satoshi Hirabayashi, Allison Bodine, and Robert Hoehn. “Modeled PM2.5 Removal by Trees in Ten U.S. Cities and Associated Health Effects.” Environmental Pollution 178 (2013): 395–402.
Oregon State University. “Recreation Use Values Database.” Accessed July 6, 2017. http://recvaluation.forestry.oregonstate.edu/database.
Palmer, L. Developmental Brain Stimulation in School and Day Care Settings: SMART Overview. Winona, MN: Office of Accelerated Learning, Winona State University. 2003.
Paynes, Wilbert V. Memorandum for Planning Community of Practice: Economic Guidance Memorandum, 17-03, Unit Day Values for Recreation for Fiscal Year 2017. U.S. Army Corps of Engineers. 2016. Accessed October 4, 2017. https://planning.erdc.dren.mil/toolbox/library/EGMs/EGM17-03.pdf.
Perry, Bruce, Lea Hogan, and Sarah J. Marlin. “Curiosity, Pleasure and Play: A Neurodevelopmental Perspective.” Haaeyc Advocate 20 (2000): 9-12.
Perryman, Sissy. Friends of Spanish Moss Trail. E-mail message to author. March 23, 2017.
Powell, K. E., L. M. Martin, and P. P. Chowdhury. “Places to Walk: Convenience and Regular Physical Activity.” American Journal of Public Health 93 (2003): 1519–1521.
Pratt, M., C. A. Macera, and G. Wang. “Higher Direct Medical Costs Associated with Physical Inactivity.” Physician and Sportsmedicine 28 (2000): 63–70.
Rivkin, Mary S. Outdoor Experiences for Young Children. ERIC Digest. 2000.
Robert Wood Johnson Foundation. “County Health Rankings and Roadmap: Beaufort County, SC.” Accessed July 6, 2017. http://www.countyhealthrankings.org/app/south-carolina/2017/rankings/beaufort/county/outcomes/overall/snapshot.
Sadik-Khan, Janette and Seth Solomonow. “Improving Public Health by Making Cities Friendly to Walking and Biking.” Health Care Policy and Law 177, no. 5 (2017): 613-614.
Scheffler, Daniel. “Beaufort: One of South Carolina’s Most Charming Small Towns.” Vogue. March 3, 2016. Accessed September 7, 2017. https://www.vogue.com/article/beaufort-travel-guide-south-carolina-small-town.

41the economic benefits of parks, trails, and conserved open spaces in beaufort county, south carolina
Seaside Farm, Inc. “Heritage.” Accessed September 7, 2017. http://seasidefarm.com/heritage/.
South Carolina Department of Health and Environmental Control. 2013 Beaufort County Obesity Fact Sheet. Accessed July 12, 2017. https://www.scdhec.gov/Health/docs/Epi/obesity/Beaufort.pdf.
South Carolina Department of Parks, Recreation and Tourism. 2005 Recreation Participation and Preference Study. Columbia, SC. 2005.
South Carolina Department of Parks, Recreation and Tourism. South Carolina State Comprehensive Outdoor Recreation Plan (SCORP). 2014.
South Carolina Department of Parks, Recreation and Tourism and U.S. Travel Association. Domestic Leisure Travel to South Carolina from Out-of-State. 2017.
South Carolina Department of Parks, Recreation and Tourism and U.S. Travel Association. In-State Leisure Travel in South Carolina. 2017.
South Carolina Department of Parks, Recreation and Tourism and U.S. Travel Association. Total Domestic Travel to South Carolina. 2017.
South Carolina Water Resources Center and Storm Thurmond Institute at Clemson University. Cultivated Agriculture Lands at Risk from Potential Urbanization in the Tri-County Area. 2000. Accessed September 11, 2017. http://www.scdhec.gov/HomeandEnvironment/docs/ModelOrdinances/SCExamples/AgAtRisk-StromThurmondInstitute.pdf.
Sturm, Ronald and Deborah Cohen. “Proximity to Urban Parks and Mental Health.” Journal of Mental Health Policy and Economics 17, no. 1 (2014): 19–24.
Taylor, A. F. and F. E. Kuo. “Children with Attention Deficits Concentrate Better After Walk in the Park.” Journal of Attention Disorder 12, no. 5 (2009): 402–409.
Taylor, A. F., F. E. Kuo, and W. Sullivan. “Coping with ADD: The Surprising Connection to Green Play Settings.” Environment and Behavior 33 (2001): 54–77.
Taylor, Laura O., Xiangping Liu, and Timothy Hamilton. Amenity Values of Proximity to National Wildlife Refuges. 2012. Accessed September 13, 2017. https://www.fws.gov/economics/Discussion%20Papers/2012.4.NWRSAmenityReportApril2012withCovers8.pdf.
The Trust for Public Land. “Sanders Farm, St. Helena Island.” Accessed September 9, 2017. https://www.tpl.org/our-work/sanders-farm-st-helena-island#sm.0001jzm2lqcsefeyrav2bzqfriti4.
Town of Bluffton, Town of Hilton Head Island, and Beaufort County. Southern Beaufort County Regional Plan. 2006. Accessed October 5, 2017. https://www.townofbluffton.sc.gov/pdfs/southern-beaufort-county-regional-plan.pdf.
U.S. Department of Agriculture. 2012 Census of Agriculture, County Profile: Beaufort County, South Carolina. 2014.
U.S. Department of Agriculture. 2012 Census of Agriculture, South Carolina, State and County Data: County Summary Highlights. 2014.
U.S. Department of Defense. REPI 11th Annual Report to Congress—2017 Readiness and Environmental Protection Integration Program. 2017.
U.S. Department of Health and Human Services, Agency for Healthcare Research and Quality. “The High Concentration of U.S. Health Care Expenditures.” Accessed October 5, 2017. http://www.ahrq.gov/research/findings/factsheets/costs/expriach/index.html#HowAre.
U.S. Department of Labor, Bureau of Labor Statistics. Consumer Price Index. Accessed September 11, 2017. http://www.bls.gov/cpi/data.htm.
U.S. Department of Labor, Bureau of Labor Statistics. Consumer Price Index for All Urban Consumers, Not Seasonally Adjusted, U.S. City Average for Medical Care. Accessed August 10, 2017. http://data.bls.gov/.
U.S. Department of Labor, Bureau of Labor Statistics. Producer Price Index. Accessed September 6, 2017. http://www.bls.gov/data.
U.S. Environmental Protection Agency. “Particle Pollution (PM).” Air Now. Accessed October 4, 2017. http://www.airnow.gov/index.cfm?action=aqibasics.particle.
U.S. Environmental Protection Agency. The Plain English Guide to the Clean Air Act. EPA-456/K-07-001. Office of Air Quality Planning and Statistics, 2007. Accessed October 5, 2017. https://www.epa.gov/sites/production/files/2015-08/documents/peg.pdf.
U.S. Environmental Protection Agency. Preliminary Data Summary of Stormwater Best Management Practices. 1999.
U.S. Travel Association. The Economic Contribution of Tourism in South Carolina—2015 Tourism Satellite Account Results. 2017. Accessed August 4, 2017. https://embed.widencdn.net/pdf/plus/scprt/nbq2fr5smf/SC%20TSA%202015%20Report.pdf?u=kceaj9.

the economic benefits of parks, trails, and conserved open spaces in beaufort county, south carolina42
U.S. Travel Association. The Economic Impact of Travel on South Carolina Counties 2015. Washington, DC 2016. Accessed August 4, 2017. https://embed.widencdn.net/pdf/plus/scprt/cszxc8etr0/SC%202015%20TEIM%20Report.pdf?u=kceaj9.
University of South Carolina, Moore School of Business. Underappreciated Assets: The Economic Impact of South Carolina’s Natural Resources. 2009.
Veugelers, P., F. Sithole, and S. Zhang. “Neighborhood Characteristics in Relation to Diet, Physical Activity and Overweight of Canadian Children.” International Journal of Pediatric Obesity 3 (2008): 152–159.
Von Nessen, Joseph C. The Economic Impact of South Carolina’s Military Community—A Statewide and Regional Analysis. 2017. Accessed September 11, 2017. https://www.scmilitarybases.com/wp-content/uploads/2017/08/2017_SCMBTF_Economic_Impact_Study_R1.pdf.
West, Shellie. Greater Bluffton Chamber of Commerce. E-mail message to author. July 13, 2017.
Wossink, Ada and Bill Hunt. The Economics of Structural Stormwater BMPs in North Carolina. Water Resources Research Institute of the University of North Carolina. May 2003.
Wyker, B., K. Bartley, E. Holder-Hayes, S. Immerwahr, D. Eisenhower, and T. G. Harris. Self-Reported and Accelerometer-Measured Physical Activity: A Comparison in New York City. New York: New York City Department of Health and Mental Hygiene: Epi Research Report, 2013. Accessed October 4, 2017. http://www1.nyc.gov/assets/doh/downloads/pdf/epi/epiresearch-pa_measures.pdf.

43the economic benefits of parks, trails, and conserved open spaces in beaufort county, south carolina
Appendix A. Recreational use and health care cost savings questionnaireThe analyses of recreational use and health care cost savings were conducted using the results of a professionally conducted telephone survey. The survey of 400 Beaufort County residents was conducted in July 2017 and was statistically representative with an accuracy level of plus or minus 4.9 percent. The survey instrument was conducted in English and Spanish, surveying 50 percent of respondents by cellular telephone and 50 percent by landline telephone.
The following pages contain the survey instrument that was implemented in the field.
For the purposes of our study, please ONLY consider publicly accessible parks, trails, and open spaces in Beaufort County. This includes places like Hunting Island State Park, Beaufort’s Henry C. Chambers Waterfront Park, the Spanish Moss Trail, Oyster Factory Park, and Chaplin Community Park—places that are open unless significantly damaged by storms. It does not include private golf courses, clubs or gyms, school properties or regular streets.
1. Do you use parks, trails, or open spaces in Beaufort County?
2. Do you have any children 18 years or under living at home?
3. Does your child use parks, trails, and open spaces in Beaufort County?
4. In the last 12 months, how many times have YOU used the parks, trails, and open spaces in Beaufort County?
5. In the last 12 months, how many times has YOUR CHILD used the parks, trails, and open spaces in Beaufort County?
6. Approximately how much time do you spend during a typical visit to the parks, trails, and open spaces in Beaufort County?
The following series of questions will ask you about YOUR use of the parks, trails, and open spaces in Beaufort County. Please do NOT include your participation in these activities outside of parks, trails, and open spaces in Beaufort County.
7. During a typical week’s time, on how many days do you:
a. Walk or hike, including dog walking?
b. Run or jog?
c. Bike?
d. Exercise in a public pool, including swimming lessons, lap swimming, or water aerobics?
e. Participate in water sports such as kayaking, rowing, kite surfing, paddle boarding, or wind surfing?
f. Use recreation centers or fitness trails for exercise, including cardio equipment, resistance machines, weights, or racquetball courts?
g. Play sports like Pickleball, soccer, tennis, or softball?
h. Skateboard?
i. Participate in any other types of physical activity not mentioned above?

the economic benefits of parks, trails, and conserved open spaces in beaufort county, south carolina44
8. In the past twelve (12) months, on how many days did you:
a. Go boating via a public access point?
b. Visit a publicly accessible beach for swimming, relaxing, picnicking, or visiting with friends and family?
c. Visit parks or playgrounds to visit with friends or family, relax, picnic, or read?
d. Enjoy nature or observe birds and wildlife?
e. Go fishing?
f. Photograph or paint?
g. Visit a public dog park?
h. Attend special park events, such as the Gullah Festival, the Beaufort Water Festival, or a seasonal concert?
The following series of questions will ask you about YOUR CHILD’S use of the parks, trails, and open spaces in Beaufort County. Please do NOT include your child’s participation in these activities outside of parks, trails, and open spaces in Beaufort County.
9. During a typical week’s time, on how many days does your child:
a. Walk or hike, including dog walking?
b. Run or jog?
c. Bike?
d. Exercise in a public pool, including swimming lessons, lap swimming, or water aerobics?
e. Participate in water sports such as kayaking, rowing, kite surfing, paddle boarding, or wind surfing?
f. Use recreation centers or fitness trails for exercise, including cardio equipment, resistance machines, weights, or racquetball courts?
g. Play sports like basketball, lacrosse, flag football, baseball, or softball?
h. Skateboard?
i. Participate in any other types of physical activity not mentioned above?
10. In the past twelve (12) months, on how many days did your child:
a. Go boating via a public access point?
b. Visit a publicly accessible beach for swimming, relaxing, picnicking, or visiting with friends and family?
c. Visit parks or playgrounds to visit with friends or family, relax, picnic, or read?
d. Enjoy nature or observe birds and wildlife?
e. Go fishing?
f. Photograph or paint?
g. Visit a public dog park?
h. Attend special park events, such as the Gullah Festival, the Beaufort Water Festival, or a seasonal concert?
D1. Record gender based on observation.
D2. In what year were you born?
D3. For statistical purposes only, which of these categories best describes your total household

45the economic benefits of parks, trails, and conserved open spaces in beaufort county, south carolina
income last year:
a. Less than $10,000 b. $10,000 to less than $15,000 c. $15,000 to less than $25,000 d. $25,000 to less than $35,000 e. $35,000 to less than $50,000 f. $50,000 to less than $75,000 g. $75,000 to less than $100,000 h. $100,000 to less than $150,000 i. $150,000 to less than $200,000 j. $200,000 or more
D4. What is the last year of schooling that you have completed?
D5. And finally, what is your race?
D6. Are you of Hispanic, Latino, or Spanish origin or descent?

the economic benefits of parks, trails, and conserved open spaces in beaufort county, south carolina46
Appendix B. Expanded economic development analysisThe economic development section of this report, beginning on page 28 , describes the multiple ways that parks, trails, and conserved open spaces support economic development in Beaufort County. The text explains how, by providing diverse leisure and recreation opportunities, these amenities enhance quality of life for visitors and residents, help generate economic activity, and support local businesses.
Read more about how parks, trails, and conserved open spaces enhance quality of life on page 28 and support local businesses on page 31 .
Parks and recreation amenities also help to boost the recreation economy in Beaufort County. The section that follows provides more details on Beaufort County households’ participation in recreation activities. It also uses Esri Business Analyst and Tapestry Segmentation to explore top Beaufort County household types and the relationship of these groups to fitness, recreation, and sports activities.107
Boosting the recreation economyThe parks, trails, and conserved open spaces in Beaufort County are used for many types of activities that generate economic activity and support businesses, including those that sell recreation-related equipment.
Beaufort County households
It is important to understand the preferences and consumer behavior of Beaufort County residents because the activities in which residents participate, and the associated purchases they make, determine the impact on the local economy. Esri Tapestry Segmentation allows us to understand the lifestyle choices of households in Beaufort County, how they spend their free time, and how they behave as consumers. Tapestry Segmentation classifies U.S. residential neighborhoods into 67 unique segments based on demographic and socioeconomic characteristics and characterizes these households according to their preferences.
In Beaufort County, the top five Tapestry segments include Silver & Gold (21.2 percent), Up and Coming Families (10.8 percent), The Elders (9.0 percent), Middleburg (7.3 percent), and In Style (6.1 percent). Cumulatively, these market segments account for 54.4 percent of Beaufort County households. Each of these top market segments is significantly more prevalent in Beaufort County than in the United States as a whole: cumulatively these five segments make up only 8.9 percent of U.S. households.108
Digging further into the characteristics of these Tapestry segments shows us how the majority of households in Beaufort County engage with the parks, trails, and conserved open spaces. Beaufort County’s top five tapestry segments include two of the oldest senior markets, members of which are home-owning households with moderate to high wealth and are socially active. The Silver & Gold segment accounts for over 20 percent of households in Beaufort County and is the most affluent senior market, with the time and resources to enjoy travel, hobbies, and sports, especially golf and boating. Park and open space amenities that provide access to the water are useful for supporting
107 Esri Business Analyst is a tool that allows users to perform detailed geospatial analyses of customer and sales information in combination with demographic, consumer spending, market segmentation, and business data. Typically used to support and rec-ommend business decisions, Business Analyst also provides valuable insight into consumer spending for activities and equipment related to recreation and parks, and enables comparison among peer communities as in this report.
108 Esri, Business Analyst Tool—Tapestry Segmentation Area Profile, accessed for Beaufort County by The Trust for Public Land, August 17, 2017.

47the economic benefits of parks, trails, and conserved open spaces in beaufort county, south carolina
the boating interests of this group. The Elders are the oldest Tapestry Segmentation market, with lower income and wealth; however, members of this market frequently shop for apparel and exercise equipment.
In addition to the two older markets that account for 30.2 percent of the population, there are three younger markets that round out the top five. These three groups have higher incomes and net worth than national averages. Two of these market groups also depend on the parks, trails, and conserved open spaces for recreational opportunities. Up and Coming Families enjoy “family activities, movies at home, trips to theme parks or the zoo, and sports, from backpacking and baseball to weight lifting and yoga.” Parks, trails, and conserved open space amenities provide important opportunities for this market’s recreation. The Middleburg market segment households participate in sports including hunting, target shooting, bowling, and baseball as well as family-oriented entertainment.109
Participation in recreation
According to Esri Business Analyst, recreation is important to many households in Beaufort County. In the last 12 months, 29.2 percent of households reported walking for exercise, the highest-reported activity. See Table B1 for a detailed breakdown of participation in recreation activities. Individuals who participate in recreation activities purchase products to enhance their experience, such as exercise clothing, footwear, bicycles, and fishing equipment and thereby contribute to the local economy.
Market potential
There is a strong market for recreation goods and services in Beaufort County. Esri uses information from Tapestry Segmentation profiles to estimate the likely demand for recreation goods and services in the area. Esri Business Analyst estimates the expected number of local consumers, then calculates the local consumption rate and market potential index (MPI), which measures the likely demand for a good or service in an area compared to the U.S. average.110 This enables research into the strength of the sports and recreation market in Beaufort County compared to the national average and five comparison communities: Charleston County, South Carolina; Chatham County, Georgia; Glynn County, Georgia; Greenville County, South Carolina; and Horry County, South Carolina.111
Comparing Beaufort County to other communities allows us to understand the relative demand for recreation services and related products. Business Analyst estimates that for recreation activities in Beaufort County, the market potential index is higher than the national average (MPI >100) for many activities (see Table B1 ). Beaufort County households participate in these activities on a level consistent with households in the comparison counties. Again, these figures include recreational activity by households occurring inside and outside Beaufort County. These data demonstrate how residents of Beaufort County are significantly more likely to spend money on gear and equipment related to recreational activities when compared to households nationally.
109 Esri, Silver and Gold, 2014; Esri, Up and Coming Families, 2014; Esri, The Elders, 2014; Esri, Middleburg, 2014; Esri, In Style, 2014.110 The MPI is tabulated to represent a value of 100 as the overall demand for the United States. An MPI of more than 100 represents
high demand; a value of less than 100 represents low demand. For example, a MPI of 120 implies that demand is likely to be 20 percent higher than the national average. MPI is computed by Esri, using tapestry segmentation data with consumer survey data compiled by GfK MRI. Each respondent is identified by a tapestry segment, so a rate of consumption by tapestry segment can be determined for a product or service for any area. The consumption rate is then multiplied by the number of households belonging to a tapestry segment in an area and summed across all segments. This expected number of consumers is then divided by the total households in an area to obtain the local consumption rate. The MPI is the ratio of local consumption rate divided by national consumption rate, multiplied by 100. Esri, Methodology Statement: Esri US—Market Potential Database, 2015.
111 The Trust for Public Land, in consultation with the working group, chose these counties as comparisons based on their similarity to Beaufort County in terms of geography, size, and character.

the economic benefits of parks, trails, and conserved open spaces in beaufort county, south carolina48
Looking more in-depth into the spending habits of Beaufort County residents helps us understand how much households are spending annually for sports and recreation equipment. Table B2 shows that 20.1 percent of Beaufort County households purchased sports and recreation equipment in the last 12 months. It also breaks spending into categories by amount and shows the percent of Beaufort County households that spent that amount over the last 12 months. Beaufort County households are 10 percent more likely than households nationally to spend between $1 and $99 dollars on sporting goods, and are 6 percent more likely than national households to spend over $250. The fact that
recreation activitypercent of households that
participated in the last 12 months
market potential index
Walking for exercise 29.2% 109
Swimming 16.7% 108
Jogging/running 12.6% 95
Golf 12.1% 132
Fishing (fresh water) 12.0% 97
Weight lifting 10.6% 107
Bicycling (road) 9.8% 99
Hiking 9.8% 99
Bowling 9.1% 96
Aerobics 8.5% 100
Basketball 7.3% 88
Yoga 6.9% 97
Boating (power) 6.0% 113
Canoeing/kayaking 5.7% 103
Target shooting 4.8% 101
Fishing (salt water) 4.7% 119
Football 4.4% 94
Baseball 4.4% 95
Frisbee 4.3% 100
Hunting with rifle 4.1% 90
Bicycling (mountain) 4.1% 105
Hunting with shotgun 3.7% 94
Tennis 3.6% 92
Soccer 3.4% 88
Softball 3.3% 97
Skiing (downhill) 3.1% 115
Volleyball 3.1% 94
Motorcycling 3.0% 104
Backpacking 3.0% 98
Pilates 2.6% 94
Archery 2.5% 91
Horseback riding 2.4% 97
Ice skating 2.1% 87
TABLE B1. 2016 PARTICIPATION IN RECREATION AND MARKET POTENTIAL
IN BEAUFORT COUNTY

49the economic benefits of parks, trails, and conserved open spaces in beaufort county, south carolina
the highest spending category is the most common suggests that Beaufort County households may purchase expensive sports and recreation equipment, such as bicycles, or a high number of lower-priced items.
Recreation expenditures and spending potential
Beaufort County residents spend money on sports and recreation equipment. Table B3 shows the average amount per year spent by Beaufort County households on sports, recreation, and exercise equipment ($179), then breaks total spending out by category (e.g., exercise equipment and gear, bicycles).112 It also includes the spending potential index (SPI) for each spending category. SPI is compiled using Esri Business Analyst estimates of recreation expenditures and represents the amount spent for a product or service relative to the national average.113
The SPI for sports, recreation, and exercise equipment and most of the categories within is high in Beaufort County compared to the national average, ranging from 103 for the rental and repair of sports, recreation, and exercise equipment to 109 for hunting and fishing equipment. Overall, Beaufort County households have the potential to spend 6 percent more on sports, recreation, and exercise equipment compared to households nationally.
The average household spending in Beaufort County of $179 per year is higher than the average spending by household in comparison counties (see Table B3 ). Interestingly though, Beaufort County’s total spending of $12.8 million per year is low compared with the comparison counties that have an average total spending of $18.5 million. Beaufort County also has comparatively low levels of total spending for each category of sports and recreation equipment despite having the highest median household income among comparison communities. For Beaufort County, the SPI is above the national average for all categories of recreation equipment spending, with the exception of winter sports equipment; however, interestingly, the spending potential is lower than the national average for all categories of recreation equipment spending in all of the comparison counties. Esri also calculates the MPI for categories of spending, $1–$99, $100–$249, and $250 or more per year, and reports the percent of households that spent these amounts over the preceding 12 months. Market potential for Beaufort County is above the U.S. average as well as the averages across the
112 This spending includes some categories with purchases unrelated to the parks, trails, and conserved open space (e.g., game tables) or includes purchases of outdoor-recreation related equipment for activities of limited availability in Beaufort County (e.g., skiing). That is, all skiing activity by residents occurs outside the county. Additionally, some of these activities likely take place in private facilities, such as private retirement communities (e.g., swimming and golf). Bike sales, however, make up a substantial por-tion of total spending on sports, recreation, and exercise equipment, and the park, trails, and conserved open spaces in Beaufort County offer numerous opportunities for bicycle riding.
113 The SPI is an indicator of what level of discretionary income consumers are willing to devote to a particular good or service. SPI is tabulated to represent a value of 100 as the overall spending for the United States; therefore, when the SPI is equal to 100 for a specific type of merchandise, consumers are spending at a rate equal to the national average. To calculate the SPI, Esri combines information from the latest Bureau of Labor Statistics Consumer Expenditure Surveys, which include a diary survey for daily purchases and an interview survey for general purposes. Consumer spending is influenced by market conditions and trends and reflects economic and demographic change. Source: Esri, Esri Consumer Spending Methodology 2016, 2016.
type of spendingpercent of households that
spent in last 12 monthsmarket potential index
Sports and recreation equipment, $1–$99 6.3% 110
Sports and recreation equipment, $100–$249 6.1% 99
Sports and recreation equipment, $250+ 7.7% 106
TABLE B2. 2016 ANNUAL HOUSEHOLD SPENDING ON SPORTS AND
RECREATION EQUIPMENT IN BEAUFORT COUNTY

the economic benefits of parks, trails, and conserved open spaces in beaufort county, south carolina50
five comparison counties for the highest and lowest spending tiers. Remarkably, for each of the six counties, the highest spending tier, $250 or more, also had the highest MPI and the greatest percent of households that spent in the last 12 months. This indicates that households in each of these counties are more likely to spend a significant amount on recreation and sports equipment than they are likely to spend a modest amount on these items.
spending categoryaverage amount
spent per householdtotal spending
spending potential index
Sports, recreation, and exercise equipment $179.00 $12,800,000 106
Exercise equipment and gear, game tables $ 7.40 $4,110,000 104
Bicycles $28.30 $2,030,000 108
Camping equipment $16.00 $1,150,000 106
Hunting and fishing equipment $52.70 $3,770,000 109
Winter sports equipment $4.86 $348,000 95
Water sports equipment $5.76 $412,000 107
Other sports equipment $10.50 $749,000 108
Rental and repair of sports, recreation, and exercise equipment $3.06 $219,000 103
TABLE B3. 2016 ANNUAL HOUSEHOLD SPENDING ON SPORTS, RECREATION,
AND EXERCISE EQUIPMENT IN BEAUFORT COUNTY (2017$)

51the economic benefits of parks, trails, and conserved open spaces in beaufort county, south carolina
B
eau
fort
C
ou
nty
, SC
Ch
arl
esto
n
Co
un
ty, S
CC
hat
ha
m
Co
un
ty, G
AG
lyn
n
Co
un
ty, G
AG
reen
vill
e C
ou
nty
, SC
Ho
rry
Co
un
ty, S
C
aver
ag
e o
f co
mpa
riso
n
cou
nti
es
Ave
rag
e an
nual
ho
useh
old
sp
end
ing
on
spo
rts,
recr
eatio
n,
and
exe
rcis
e eq
uip
men
t (20
16)
$179
$163
$139
$152
$151
$133
$147
Tota
l sp
end
ing
on
spo
rts,
recr
e-at
ion,
and
exe
rcis
e eq
uip
men
t (2
016)
$12,
800,
000
$26,
200,
000
$15,
300,
000
$4,9
80,0
00$2
8,80
0,00
0$1
7,20
0,00
0$1
8,50
0,00
0
Spen
din
g p
ote
ntia
l ind
ex10
697
8390
9079
88
Med
ian
hous
eho
ld in
com
e (a
dju
sted
to 2
017$
) $
57,9
00
$52
,100
$
47,0
00
$51
,300
$
51,1
00
$43
,700
$
49,0
00
Mar
ket p
ote
ntia
l ind
ex fo
r sp
ort
s an
d re
crea
tion
equi
p-
men
t sp
end
ing
($1–
$99)
110
101
101
102
105
103
102
Perc
ent o
f ho
useh
old
s th
at
spen
t in
last
12
mo
nths
6.32
%5.
79%
5.84
%5.
85%
6.03
%5.
91%
5.88
%
Mar
ket p
ote
ntia
l ind
ex fo
r sp
ort
s an
d re
crea
tion
equi
p-
men
t sp
end
ing
($10
0–$2
49)
9910
210
010
810
598
103
Perc
ent o
f ho
useh
old
s th
at
spen
t in
last
12
mo
nths
6.12
%6.
28%
6.17
%6.
65%
6.43
%6.
01%
6.31
%
Mar
ket p
ote
ntia
l ind
ex fo
r sp
ort
s an
d re
crea
tion
equi
p-
men
t sp
end
ing
($25
0+)
106
107
102
102
109
104
105
Perc
ent o
f ho
useh
old
s th
at
spen
t in
last
12
mo
nths
7.68
%7.
78%
7.44
%7.
43%
7.91
%7.
56%
7.63
%
TAB
LE B
4. 2
01
6 A
NN
UA
L H
OU
SE
HO
LD S
PE
ND
ING
ON
SP
OR
TS
AN
D R
EC
RE
AT
ION
EQ
UIP
ME
NT
IN B
EA
UF
OR
T C
OU
NT
Y A
ND
CO
MP
AR
ISO
N C
OM
MU
NIT
IES
(2
01
7$
)

DR
AF
TNotes


DR
AF
T
The Trust for Public Land
306 North Monroe Street
Tallahassee, FL 32301
850.222.7911
tpl.org
photos: front top: aj pierro photography; bottom: captured moments photographyback: beaufort county open land trust