the distribution of the warm and dense molecular gas around cepheus a hw 2
TRANSCRIPT
q 1999 RAS
The distribution of the warm and dense molecular gas around Cepheus AHW 2
J. M. Torrelles,1,2 J. F. GoÂmez,3 G. Garay,4 L. F. RodrõÂguez,5 L. F. Miranda,2 S. Curiel5
and P. T. P. Ho6
1Institut d'Estudis Espacials de Catalunya (IEEC/CSIC), Edifici Nexus, C/ Gran CapitaÁ 2-4, E-08034 Barcelona, Spain2Instituto de AstrofõÂsica de AndalucuÂa, CSIC, Apdo. Correos 3004, E-18080 Granada, Spain3Laboratorio de AstrofõÂsica Espacial y FõÂsica Fundamental, INTA, Apdo. Correos 50727, E-28080 Madrid, Spain4Departamento de AstronomõÂa, Universidad de Chile, Casilla 36-D, Santiago, Chile5Instituto de AstronomõÂa, Universidad Nacional AutoÂnoma de MeÂxico, Apdo. Postal 70-264, DF 04510, MeÂxico6Harvard±Smithsonian Center for Astrophysics, 60 Garden Street, Cambridge, MA 02138, USA
Accepted 1999 February 22. Received 1999 February 19; in original form 1999 January 25
A B S T R A C T
We present VLA observations of the �J;K� � �1; 1�, (2, 2), (3, 3) and (4, 4) inversion
transitions of NH3 toward the HW 2 object in Cepheus A, with 1-arcsec angular resolution.
Emission is detected in the main hyperfine line of the first three transitions. The NH3(2, 2)
emission shows a non-uniform `ring' structure, which is more extended (3 arcsec) and
intense than the emission seen in the (1, 1) and (3, 3) lines. A rotational temperature of
, 30±50 K and a lower limit to the mass of , 1 (XNH3/1028)21 M( are derived for the ring
structure. The spatio-kinematical distribution of the NH3 emission does not seem to be
consistent with a simple circumstellar disc around the HW 2 thermal biconical radio jet. We
suggest that it represents the remnant of the parental core from which both the inner 300-au
(0.4 arcsec) disc, traced by the water maser spots previously found in the region, and the
central object have formed. The complex velocity field of this core is probably produced
from bound motions (similar to those of the inner disc) and from interaction with outflowing
material.
Key words: stars: pre-main-sequence ± ISM: individual: Cepheus A ± ISM: jets and
outflows ± ISM: molecules ± radio lines: ISM.
1 I N T R O D U C T I O N
The search for circumstellar discs around young stellar objects
(YSOs) is one of the major subjects of current star formation
studies. There is now considerable evidence that such discs
(protoplanetary discs) are present around low-mass young stars
(e.g. Shu, Adams & Lizano 1987; Lizano & Torrelles 1995;
RodrõÂguez et al. 1998; Torrelles et al. 1998). However, there is
very little evidence that these discs are also present around high-
mass young stars (Plambeck, Wright & Carlstrom 1990;
Nakamura et al. 1991; Lada & Adams 1992; Planesas, MartõÂn-
Pintado & Serabyn 1992).
The HW 2 (Hughes & Wouterloot 1984) thermal biconical radio
jet (RodrõÂguez et al. 1994), located in the high-mass star
formation region Cepheus A East (Sargent 1977; at 725-pc
distance: Johnson 1957), is one of the few known objects
associated with a massive YSO (e.g., Cohen, Rowland & Blair
1984; Garay et al. 1996) where the presence of a circumstellar disc
has been inferred (Torrelles et al. 1996, hereafter T96). Water
maser observations show a band of maser spots with their spatial
and velocity distribution tracing a disc of , 300-au radius
(, 0.4 arcsec) (hereafter the `water maser disc'). This disc,
simultaneously undergoing rotation and contraction, is oriented
perpendicular to the biconical radio jet and probably constitutes
the smallest circumstellar disc observed around a massive YSO
(T96). Observations of the NH3(1, 1) line with , 2.3-arcsec
angular resolution show the presence of a dense molecular core,
centred on the HW 2 object, with a deconvolved size of 3:3 �2:3 arcsec2 (. 2400 � 1700 au: Torrelles et al. 1993a, hereafter
T93). Although this NH3 dense core was originally interpreted as a
circumstellar molecular disc (T93), its orientation at PA .308±408 precludes a clear relationship with the water maser disc
of 300-au radius, which is oriented at PA . 2488 (T96). On the
other hand, the SiO molecule (GoÂmez et al. 1999) traces a
structure that is consistent with an outer (750-au radius) disc with
a similar orientation to the water maser disc.
In this paper we report NH3(1, 1), (2, 2), (3, 3) and (4, 4) line
observations toward HW 2, carried out with the Very Large Array
Mon. Not. R. Astron. Soc. 307, 58±66 (1999)
Warm and dense molecular gas around Cep A HW 2 59
q 1999 RAS, MNRAS 307, 58±66
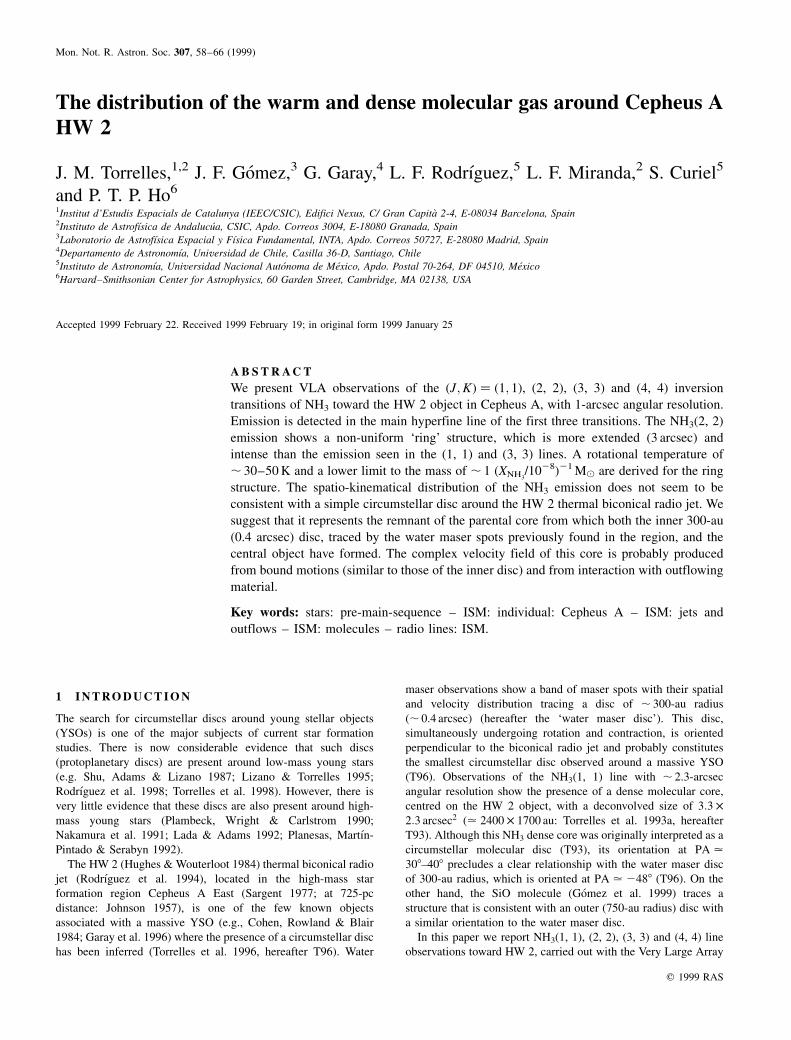
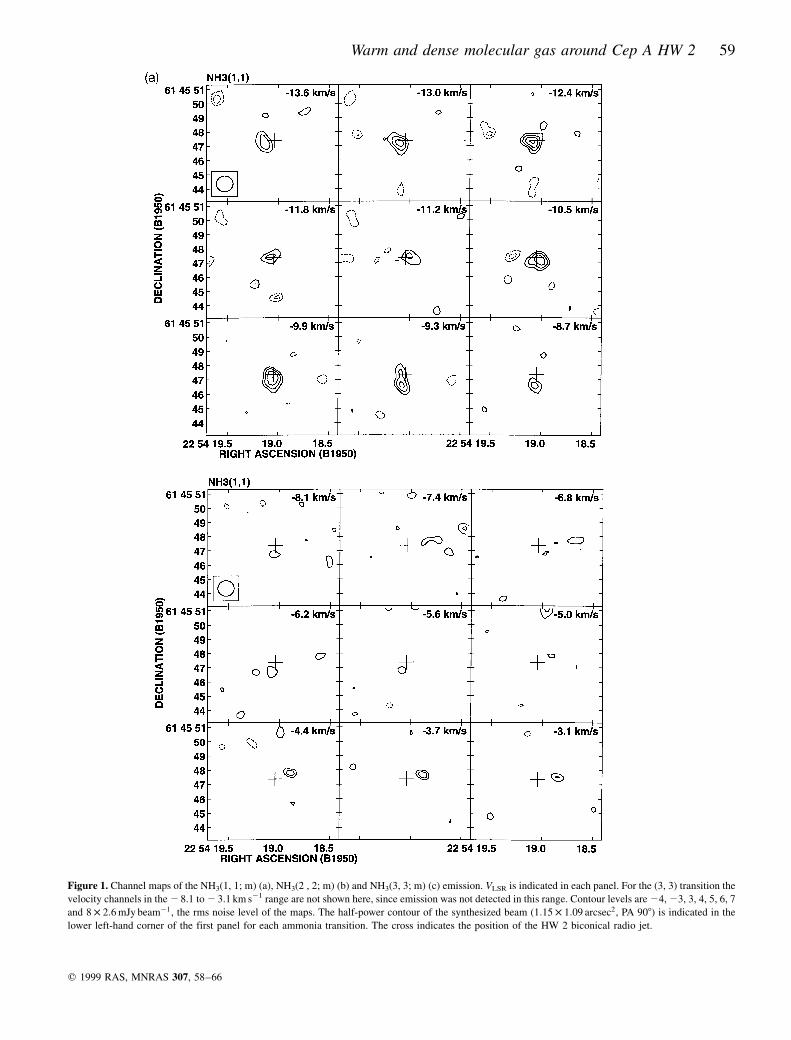
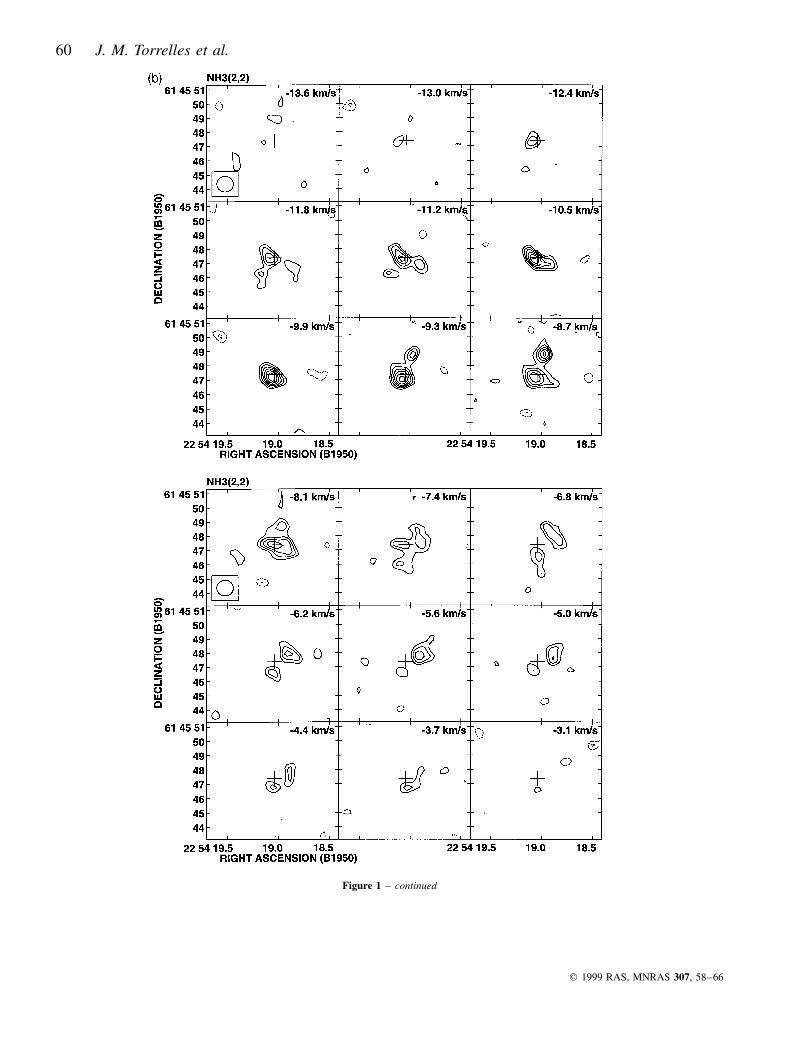
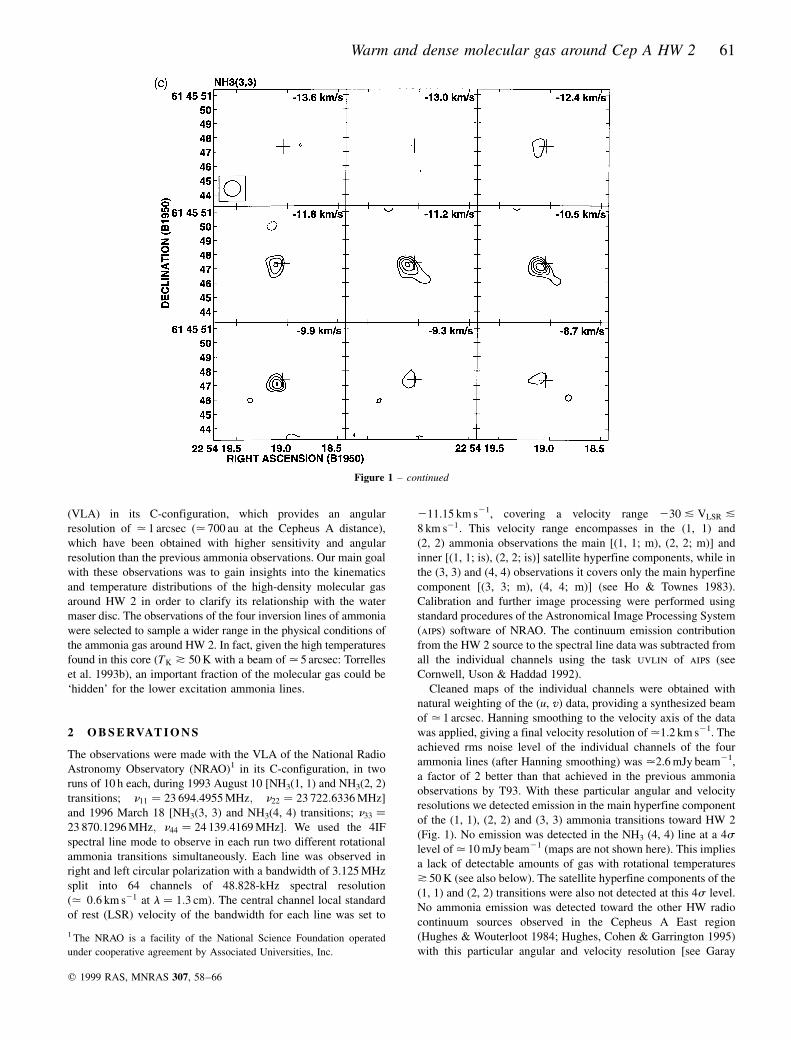
Figure 1. Channel maps of the NH3(1, 1; m) (a), NH3(2 , 2; m) (b) and NH3(3, 3; m) (c) emission. VLSR is indicated in each panel. For the (3, 3) transition the
velocity channels in the 2 8.1 to 2 3.1 km s21 range are not shown here, since emission was not detected in this range. Contour levels are 24, 23, 3, 4, 5, 6, 7
and 8 � 2:6 mJy beam21, the rms noise level of the maps. The half-power contour of the synthesized beam (1:15 � 1:09 arcsec2, PA 908) is indicated in the
lower left-hand corner of the first panel for each ammonia transition. The cross indicates the position of the HW 2 biconical radio jet.
60 J. M. Torrelles et al.
q 1999 RAS, MNRAS 307, 58±66
Figure 1 ± continued
Warm and dense molecular gas around Cep A HW 2 61
(VLA) in its C-configuration, which provides an angular
resolution of . 1 arcsec (. 700 au at the Cepheus A distance),
which have been obtained with higher sensitivity and angular
resolution than the previous ammonia observations. Our main goal
with these observations was to gain insights into the kinematics
and temperature distributions of the high-density molecular gas
around HW 2 in order to clarify its relationship with the water
maser disc. The observations of the four inversion lines of ammonia
were selected to sample a wider range in the physical conditions of
the ammonia gas around HW 2. In fact, given the high temperatures
found in this core (TK * 50 K with a beam of . 5 arcsec: Torrelles
et al. 1993b), an important fraction of the molecular gas could be
`hidden' for the lower excitation ammonia lines.
2 O B S E RVAT I O N S
The observations were made with the VLA of the National Radio
Astronomy Observatory (NRAO)1 in its C-configuration, in two
runs of 10 h each, during 1993 August 10 [NH3(1, 1) and NH3(2, 2)
transitions; n11 � 23 694:4955 MHz; n22 � 23 722:6336 MHz�and 1996 March 18 [NH3(3, 3) and NH3(4, 4) transitions; n33 �23 870:1296 MHz; n44 � 24 139:4169 MHz�. We used the 4IF
spectral line mode to observe in each run two different rotational
ammonia transitions simultaneously. Each line was observed in
right and left circular polarization with a bandwidth of 3.125 MHz
split into 64 channels of 48.828-kHz spectral resolution
�. 0:6 km s21 at l � 1:3 cm�: The central channel local standard
of rest (LSR) velocity of the bandwidth for each line was set to
211.15 km s21, covering a velocity range 230 & VLSR &8 km s21. This velocity range encompasses in the (1, 1) and
(2, 2) ammonia observations the main [(1, 1; m), (2, 2; m)] and
inner [(1, 1; is), (2, 2; is)] satellite hyperfine components, while in
the (3, 3) and (4, 4) observations it covers only the main hyperfine
component [(3, 3; m), (4, 4; m)] (see Ho & Townes 1983).
Calibration and further image processing were performed using
standard procedures of the Astronomical Image Processing System
(aips) software of NRAO. The continuum emission contribution
from the HW 2 source to the spectral line data was subtracted from
all the individual channels using the task uvlin of aips (see
Cornwell, Uson & Haddad 1992).
Cleaned maps of the individual channels were obtained with
natural weighting of the (u, v) data, providing a synthesized beam
of . 1 arcsec. Hanning smoothing to the velocity axis of the data
was applied, giving a final velocity resolution of .1.2 km s21. The
achieved rms noise level of the individual channels of the four
ammonia lines (after Hanning smoothing) was .2.6 mJy beam21,
a factor of 2 better than that achieved in the previous ammonia
observations by T93. With these particular angular and velocity
resolutions we detected emission in the main hyperfine component
of the (1, 1), (2, 2) and (3, 3) ammonia transitions toward HW 2
(Fig. 1). No emission was detected in the NH3 (4, 4) line at a 4slevel of . 10 mJy beam21 (maps are not shown here). This implies
a lack of detectable amounts of gas with rotational temperatures
* 50 K (see also below). The satellite hyperfine components of the
(1, 1) and (2, 2) transitions were also not detected at this 4s level.
No ammonia emission was detected toward the other HW radio
continuum sources observed in the Cepheus A East region
(Hughes & Wouterloot 1984; Hughes, Cohen & Garrington 1995)
with this particular angular and velocity resolution [see Garay
q 1999 RAS, MNRAS 307, 58±66
Figure 1 ± continued
1 The NRAO is a facility of the National Science Foundation operated
under cooperative agreement by Associated Universities, Inc.
62 J. M. Torrelles et al.
et al. (1996) for a discussion on the nature of the radio objects in
the Cepheus A East region].
3 R E S U LT S A N D D I S C U S S I O N
3.1 Spatial distribution of the (1, 1), (2, 2) and (3, 3) ammonia
emission
Fig. 1 shows the individual channel contour maps of the (1, 1; m)
(a), (2, 2; m) (b) and (3, 3; m) (c) line emission, made with the
same synthesized beam (1:15 � 1:09 arcsec2; PA908) (uv coverage
was similar for all the ammonia lines). Emission in the (1, 1; m)
and (3, 3; m) transitions is detected roughly over the same velocity
range (213 & VLSR & 29 km s21), showing similar intensities
(Figs 1a and c). On the other hand, the NH3(2, 2; m) line emission
is, on average, a factor of , 1.5 more intense than the (1, 1; m)
and (3, 3; m) emissions, is detected over a broader velocity range
(213 & VLSR & 24 km s21), and shows a more extended and
complex spatial structure (Fig. 1b).
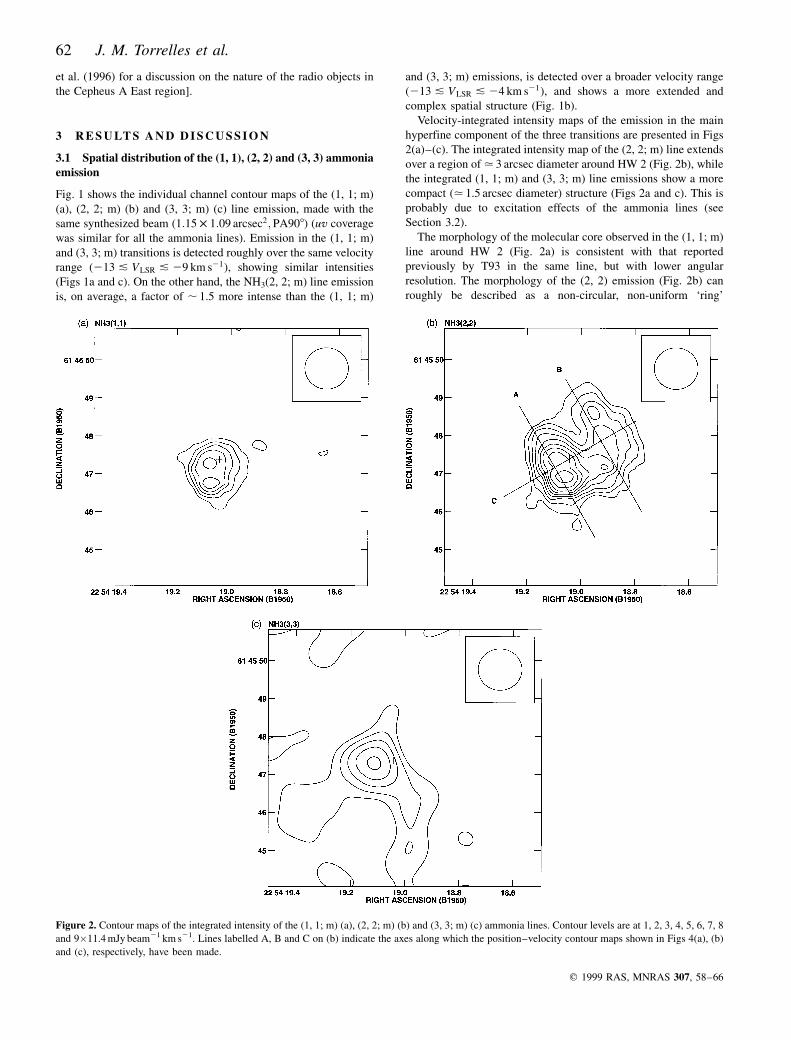
Velocity-integrated intensity maps of the emission in the main
hyperfine component of the three transitions are presented in Figs
2(a)±(c). The integrated intensity map of the (2, 2; m) line extends
over a region of . 3 arcsec diameter around HW 2 (Fig. 2b), while
the integrated (1, 1; m) and (3, 3; m) line emissions show a more
compact (. 1.5 arcsec diameter) structure (Figs 2a and c). This is
probably due to excitation effects of the ammonia lines (see
Section 3.2).
The morphology of the molecular core observed in the (1, 1; m)
line around HW 2 (Fig. 2a) is consistent with that reported
previously by T93 in the same line, but with lower angular
resolution. The morphology of the (2, 2) emission (Fig. 2b) can
roughly be described as a non-circular, non-uniform `ring'
q 1999 RAS, MNRAS 307, 58±66
Figure 2. Contour maps of the integrated intensity of the (1, 1; m) (a), (2, 2; m) (b) and (3, 3; m) (c) ammonia lines. Contour levels are at 1, 2, 3, 4, 5, 6, 7, 8
and 9�11.4 mJy beam21 km s21. Lines labelled A, B and C on (b) indicate the axes along which the position±velocity contour maps shown in Figs 4(a), (b)
and (c), respectively, have been made.
Warm and dense molecular gas around Cep A HW 2 63
structure of , 3-arcsec diameter. The locations of the (1, 1; m) and
(3, 3; m) emission (Figs 2a and c) coincide with the more intense
south-eastern half of the (2, 2) ammonia `ring' structure, which is
closer to HW 2 than is the north-western, weaker half.
The north-western region of the (2, 2; m) structure was not
detected previously by T93, who only detected the south-eastern
part of the ammonia `ring'. This was probably due to a
combination of both lower angular resolution and lower sensitivity
of their data (. 6 mJy beam21 per 1.2 km s21). Note that the
emission from the components in the individual velocity channels
(Fig. 1b) contributing to the north-western half of the (2, 2)
ammonia `ring' is at a maximum level of . 15 mJy beam21.
3.2 Physical parameters
From the (2, 2; m) to (1, 1; m) velocity integrated line intensity
ratio, an estimate of the rotational temperature describing the
population of the (2, 2) and (1, 1) ammonia rotational states,
TR(22±11), can be obtained (TR # TK, with TK the kinetic
temperature: see Ho & Townes 1983). For the region where both
(1, 1) and (2, 2) emission is detected, we find a mean value of
,1.5 for the (2, 2; m)/(1, 1; m) ratio, which, assuming optically
thin emission, implies a mean rotational temperature
TR�22±11� . 50 K. On the other hand, for the weaker north-
western half of the (2, 2) ammonia `ring', where the (1, 1; m)
emission was not detected, adopting for this line an upper limit
value (4s ) of . 10 mJy beam21, we obtain a lower limit of . 1.3
for the (2, 2; m)/(1, 1; m) ratio, which implies a rotational
temperature TR�22±11� * 40 K. This result suggests that probably
the bulk of the structure detected in the (2, 2) ammonia line has a
similar temperature. The small size of the region where the (1, 1;
m) emission is detected (. 1.5 arcsec diameter), as compared with
the synthesized beam (. 1 arcsec diameter), precludes a realistic
map of the (2, 2; m)/(1, 1; m) ratio and a study of the possible
temperature gradients around HW 2. Finally, from the ratio of the
(3, 3; m) and (2, 2; m) components (. 0.5), a rotational
temperature TR(33±22) . 30 K is derived. It is also important to
note that opacity effects could affect these estimates of the
rotational temperatures (see Ho & Townes 1983).
From the integrated flux density of the (2, 2; m) line over a
region of 3-arcsec diameter around HW 2 (. 400 mJy km s21),
assuming optically thin emission, a single rotational temperature
describing the population of all the rotational levels of the
ammonia molecule, TR � Tex � 50 K; and an abundance ratio
NH3=H2 � 1028 (Herbst & Klemperer 1973), we estimate an
average column density N�H2� . 5 � 1023�XNH3=1028�21 cm22, a
volume density n�H2� . 2 � 107�XNH3=1028�21cm23, and a mass
M(H2) . 1(XNH3/1028)21 M( within this region. This is a lower
limit to the mass, given the assumption of optically thin emission.
In particular, if an opacity t�1; 1;m� � 1 were adopted [such as
that derived by Torrelles et al. (1993b) for the extended ammonia
emission in the region], the estimated mass value would increase
by a factor of , 1.6 [t (1, 1; m)/(12e2t (1,1;m))].
3.3 Kinematics of the ammonia emission
In order to study the kinematics of the high-density molecular gas
around HW 2, we have produced first-order moments of the three
ammonia lines. From the (1, 1; m) moment (not shown here) we
find that there are velocity differences of . 4 km s21 from north to
south of the core, with blueshifted velocities
(VLSR . 213 km s21) toward the north and north-eastern regions,
and redshifted velocities (VLSR . 29 km s21) toward the southern
ones. These velocity shifts are consistent with those found by T93
in the (1, 1; m) transition.
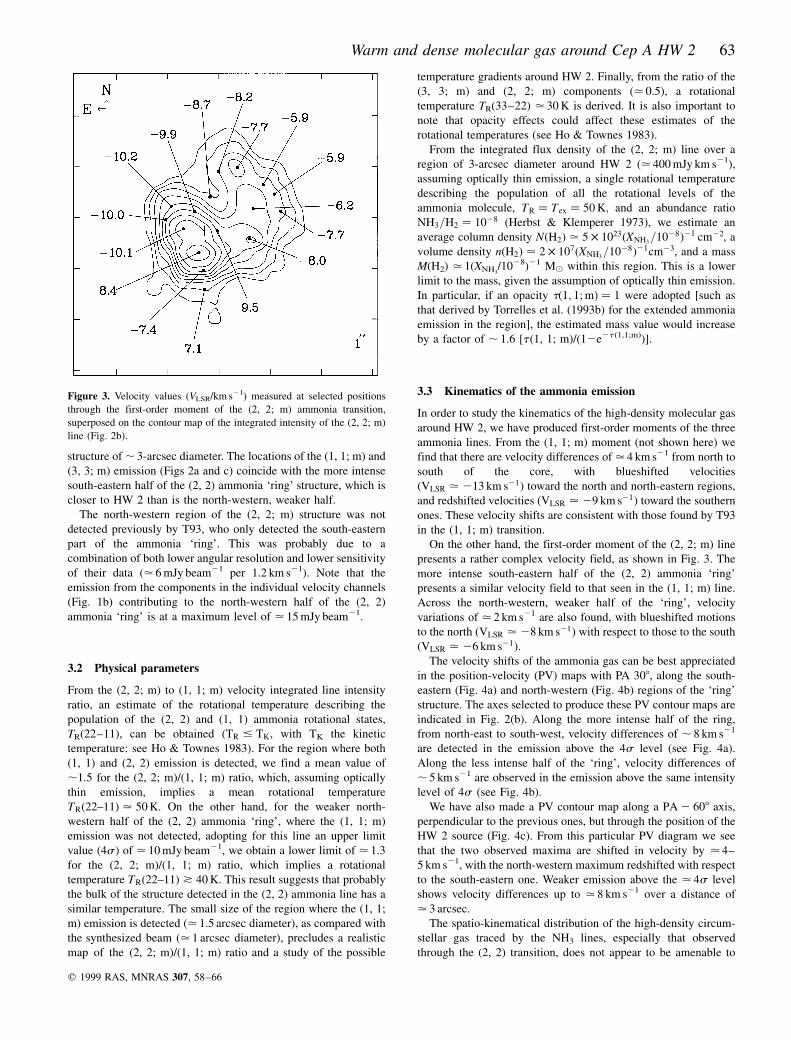
On the other hand, the first-order moment of the (2, 2; m) line
presents a rather complex velocity field, as shown in Fig. 3. The
more intense south-eastern half of the (2, 2) ammonia `ring'
presents a similar velocity field to that seen in the (1, 1; m) line.
Across the north-western, weaker half of the `ring', velocity
variations of . 2 km s21 are also found, with blueshifted motions
to the north (VLSR . 28 km s21) with respect to those to the south
(VLSR . 26 km s21).
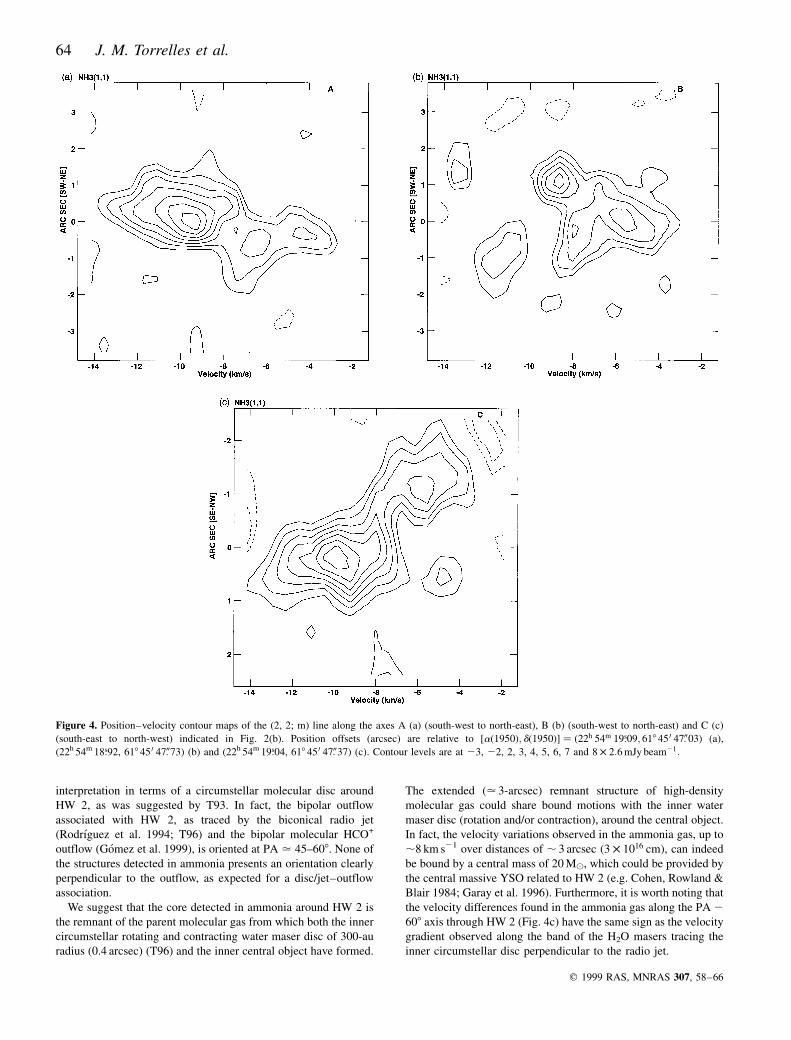
The velocity shifts of the ammonia gas can be best appreciated
in the position-velocity (PV) maps with PA 308, along the south-
eastern (Fig. 4a) and north-western (Fig. 4b) regions of the `ring'
structure. The axes selected to produce these PV contour maps are
indicated in Fig. 2(b). Along the more intense half of the ring,
from north-east to south-west, velocity differences of , 8 km s21
are detected in the emission above the 4s level (see Fig. 4a).
Along the less intense half of the `ring', velocity differences of
, 5 km s21 are observed in the emission above the same intensity
level of 4s (see Fig. 4b).
We have also made a PV contour map along a PA 2 608 axis,
perpendicular to the previous ones, but through the position of the
HW 2 source (Fig. 4c). From this particular PV diagram we see
that the two observed maxima are shifted in velocity by . 4±
5 km s21, with the north-western maximum redshifted with respect
to the south-eastern one. Weaker emission above the . 4s level
shows velocity differences up to . 8 km s21 over a distance of
. 3 arcsec.
The spatio-kinematical distribution of the high-density circum-
stellar gas traced by the NH3 lines, especially that observed
through the (2, 2) transition, does not appear to be amenable to
q 1999 RAS, MNRAS 307, 58±66
Figure 3. Velocity values (VLSR/km s21) measured at selected positions
through the first-order moment of the (2, 2; m) ammonia transition,
superposed on the contour map of the integrated intensity of the (2, 2; m)
line (Fig. 2b).
64 J. M. Torrelles et al.
interpretation in terms of a circumstellar molecular disc around
HW 2, as was suggested by T93. In fact, the bipolar outflow
associated with HW 2, as traced by the biconical radio jet
(RodrõÂguez et al. 1994; T96) and the bipolar molecular HCO+
outflow (GoÂmez et al. 1999), is oriented at PA . 45±608. None of
the structures detected in ammonia presents an orientation clearly
perpendicular to the outflow, as expected for a disc/jet±outflow
association.
We suggest that the core detected in ammonia around HW 2 is
the remnant of the parent molecular gas from which both the inner
circumstellar rotating and contracting water maser disc of 300-au
radius (0.4 arcsec) (T96) and the inner central object have formed.
The extended (. 3-arcsec) remnant structure of high-density
molecular gas could share bound motions with the inner water
maser disc (rotation and/or contraction), around the central object.
In fact, the velocity variations observed in the ammonia gas, up to
,8 km s21 over distances of , 3 arcsec (3 � 1016 cm), can indeed
be bound by a central mass of 20 M(, which could be provided by
the central massive YSO related to HW 2 (e.g. Cohen, Rowland &
Blair 1984; Garay et al. 1996). Furthermore, it is worth noting that
the velocity differences found in the ammonia gas along the PA 2608 axis through HW 2 (Fig. 4c) have the same sign as the velocity
gradient observed along the band of the H2O masers tracing the
inner circumstellar disc perpendicular to the radio jet.
q 1999 RAS, MNRAS 307, 58±66
Figure 4. Position±velocity contour maps of the (2, 2; m) line along the axes A (a) (south-west to north-east), B (b) (south-west to north-east) and C (c)
(south-east to north-west) indicated in Fig. 2(b). Position offsets (arcsec) are relative to �a�1950�; d�1950�� � �22h 54m 19:s09; 618 45 0 470: 03� (a),
(22h 54m 18:s92, 618 45 0 470: 73) (b) and (22h 54m 19:s04, 618 45 0 470: 37) (c). Contour levels are at 23, 22, 2, 3, 4, 5, 6, 7 and 8 � 2:6 mJy beam21:
Warm and dense molecular gas around Cep A HW 2 65
We cannot discard, however, the possibility that the observed
motions in the ammonia gas could have been affected by the
strong outflow of the central object, disturbing both the
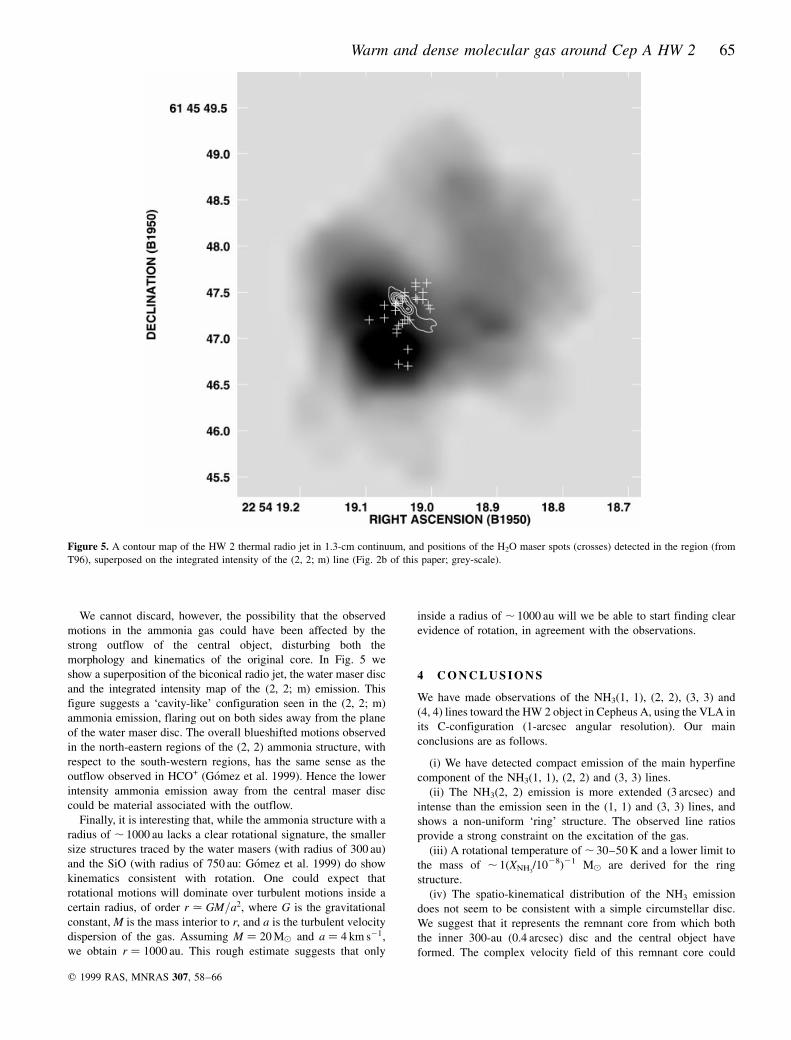
morphology and kinematics of the original core. In Fig. 5 we
show a superposition of the biconical radio jet, the water maser disc
and the integrated intensity map of the (2, 2; m) emission. This
figure suggests a `cavity-like' configuration seen in the (2, 2; m)
ammonia emission, flaring out on both sides away from the plane
of the water maser disc. The overall blueshifted motions observed
in the north-eastern regions of the (2, 2) ammonia structure, with
respect to the south-western regions, has the same sense as the
outflow observed in HCO+ (GoÂmez et al. 1999). Hence the lower
intensity ammonia emission away from the central maser disc
could be material associated with the outflow.
Finally, it is interesting that, while the ammonia structure with a
radius of , 1000 au lacks a clear rotational signature, the smaller
size structures traced by the water masers (with radius of 300 au)
and the SiO (with radius of 750 au: GoÂmez et al. 1999) do show
kinematics consistent with rotation. One could expect that
rotational motions will dominate over turbulent motions inside a
certain radius, of order r . GM=a2, where G is the gravitational
constant, M is the mass interior to r, and a is the turbulent velocity
dispersion of the gas. Assuming M � 20 M( and a � 4 km s21,
we obtain r � 1000 au. This rough estimate suggests that only
inside a radius of , 1000 au will we be able to start finding clear
evidence of rotation, in agreement with the observations.
4 C O N C L U S I O N S
We have made observations of the NH3(1, 1), (2, 2), (3, 3) and
(4, 4) lines toward the HW 2 object in Cepheus A, using the VLA in
its C-configuration (1-arcsec angular resolution). Our main
conclusions are as follows.
(i) We have detected compact emission of the main hyperfine
component of the NH3(1, 1), (2, 2) and (3, 3) lines.
(ii) The NH3(2, 2) emission is more extended (3 arcsec) and
intense than the emission seen in the (1, 1) and (3, 3) lines, and
shows a non-uniform `ring' structure. The observed line ratios
provide a strong constraint on the excitation of the gas.
(iii) A rotational temperature of , 30±50 K and a lower limit to
the mass of , 1(XNH3/1028)21 M( are derived for the ring
structure.
(iv) The spatio-kinematical distribution of the NH3 emission
does not seem to be consistent with a simple circumstellar disc.
We suggest that it represents the remnant core from which both
the inner 300-au (0.4 arcsec) disc and the central object have
formed. The complex velocity field of this remnant core could
q 1999 RAS, MNRAS 307, 58±66
Figure 5. A contour map of the HW 2 thermal radio jet in 1.3-cm continuum, and positions of the H2O maser spots (crosses) detected in the region (from
T96), superposed on the integrated intensity of the (2, 2; m) line (Fig. 2b of this paper; grey-scale).
66 J. M. Torrelles et al.
have contributions from bound motions (similar to those of the
inner disc), and from interaction with outflow material.
AC K N OW L E D G M E N T S
We thank an anonymous referee for useful and valuable
comments. GG acknowledges support from a Chilean Presidential
Science Fellowship and from Fondecyt project 1980660. JFG,
LFM and JMT are supported in part by DGICYT grant PB95-0066
and by Junta de AndalucõÂa (Spain). JFG is also supported by INTA
grant IGE 4900506. LFR and SC acknowledge the support of
DGAPA, UNAM and CONACyT (MeÂxico). This work has been
partially supported by the Programa de CooperacioÂn CientõÂfica
con IberoameÂrica. The National Radio Astronomy Observatory is
a facility of the National Science Foundation, operated under
cooperative agreement by Associated Universities, Inc.
R E F E R E N C E S
Cohen R. J., Rowland P. R., Blair M. M., 1984, MNRAS, 210, 425
Cornwell T. J., Uson J., Haddad N., 1992, A&A, 258, 583
Garay G., RamõÂrez S., RodrõÂguez L. F., Curiel S., Torrelles J. M., 1996,
ApJ, 459, 193
GoÂmez J. F., Sargent A. I., Torrelles J. M., Ho P. T. P., RodrõÂguez L. F.,
Canto J., Garay G., 1999, ApJ, 514, 287
Herbst E., Klemperer W., 1973, ApJ, 185, 505
Ho P. T. P., Townes C. H., 1983, ARA&A, 21, 239
Hughes V. A., Wouterloot J. G. A., 1984, ApJ, 276, 204
Hughes V. A., Cohen R. J., Garrington S., 1995, MNRAS, 272, 469
Johnson H. L., 1957, ApJ, 126, 121
Lada C. J., Adams F. C., 1992, ApJ, 393, L728
Lizano S., Torrelles J. M., eds, 1995, Rev. Mex. Astron. Astrofis. Ser.
Conf. 1, Circumstellar Disks, Outflows and Star Formation
Nakamura A., Kawabe R., Kitamura Y., Ishiguro M., Murata Y., Ohashi N.,
1991, ApJ, 383, L81
Plambeck R. L., Wright M. C. H., Carlstrom J. E., 1990, ApJ, 348, L65
Planesas P., MartõÂn-Pintado J., Serabyn E., 1992, ApJ, 386, L23
RodrõÂguez L. F., Garay G., Curiel S., RamõÂrez S., Torrelles J. M., GoÂmez
Y., VelaÂzquez A., 1994, ApJ, 430, 713
RodrõÂguez L. F., 1998, et al., Nat, 395, 355
Sargent A. I., 1977, ApJ, 218, 736
Shu F. H., Adams F. C., Lizano S., 1987, ARA&A, 25, 23
Torrelles J. M., RodrõÂguez L. F., Canto J., Ho P. T. P., 1993a, ApJ, 404, L75
(T93)
Torrelles J. M., Verdes-Montenegro L., Ho P. T. P., RodrõÂguez L. F., CantoÂ
J., 1993b, ApJ, 410, 202
Torrelles J. M., GoÂmez J. F., RodrõÂguez L. F., Curiel S., Ho P. T. P., Garay
G., 1996, ApJ, 457, L107 (T96)
Torrelles J. M., GoÂmez J. F., RodrõÂguez L. F., Curiel S., Anglada G., Ho P.
T. P., 1998, ApJ, 505, 756
This paper has been typeset from a TEX/LATEX file prepared by the author.
q 1999 RAS, MNRAS 307, 58±66