the dissociation of metalloporphyrin anions · the dissociation of metalloporphyrin anions...
TRANSCRIPT
The Dissociation of Metalloporphyrin Anions
Guangliang Chen
Thesis submitted to the
Faculty of Graduate & Postdoctoral Studies
in partial fulfillment of the requirements for the
M.Sc. degree in Chemistry
Department of Chemistry and Biomolecular Sciences
Faculty of Science
University of Ottawa
© Guangliang Chen, Ottawa, Canada, 2015
ii
Abstract
ESI-MS spectra of NiII, CoIII, MgIII, and FeII porphyrin solutions in methanol show
porphyrin monomer species with different charge states, such as [NiIITPPS+H]3-,
[CoIIITPPS]3-, [MnIIITPPS]3-, [MnIIITPPS+H]2-, [FeIITPPS+H]3-, and [FeIITPPS+2H]2- ions.
Collision-induced dissociation (CID) of these monomer species produced primarily
losses of neutral SO3 and SO2. The mechanisms, in which these dissociation pathways
took place, were investigated by the means of DFT calculations of the corresponding
dissociation of neutral and ionized benzenesulfonate (B3-LYP/6-31+G(2d, p) level) and
porphyrin monomer (B3-LYP/6-31+G(2d, p)+LANL2DZ//PM7 level). RRKM fitting of the
CID breakdown curves showed that the activation energies of the reactions that
experience a loss of SO2 from [CoIIITPPS]3- and [MnIIITPPS]3- were similar, but of a
lower magnitude than those for a loss of SO3. On the other hand, for [NiIITPPS+H]3- and
[FeIITPPS+2H]2-, the activation energies of the reaction leading to a loss of SO2 were
also similar, but this time were larger than those leading to SO3 loss. These results are
consistent with a mechanism by which the SO2 loss starts with -C6H4SO3-, while the SO3
loss has to begin with -C6H4SO3H. To lose this SO3, extra energy is required for
[CoIIITPPS]3- and [MnIIITPPS]3- in order for them to overcome the barrier of H transfer
from the porphyrin ring to -SO3-, but this is irrelevant when it comes to [NiIITPPS+H]3-
and [FeIITPPS+2H]2- since the C6H4SO3H moiety already exists. In addition, the reaction
of [FeIITPPS+H]3- losing H leads to a unique dissociation mechanism.

iii
Acknowledgements
I would like to thank the John Holmes Mass Spectrometry Centre for giving me
this memorable experience for the past two years.
Thank you Dr. Ameneh Gholami and Shaan Rashid for their valuable time in
helping me with the experiment. I would not able to finish without them.
I would also like to thank Dr. Justin Renaud, and Dr. Barbara Francisco and
Jenna Hamilton for always being there when I was in need. I am grateful to Eduardo
Solano and Alicia Sit for helping me understand RRKM theory, and use RRKM and
GaussView programs. In addition, I would like to acknowledge the other members of the
Mayer research group: Dr. Brandi West, Huayu Xue, Jaleh Halvachizadeh, Jeffery
Butson, Samata Mosammat Khan, Sabria Mohamed, Iden Djavani, Emily Gee, Naomi
Mattli-Lewis, and Anaïs Ryc.
Thank you Dr. Sharon Curtis, Dr. Sander Mommers, and Sean Overton for their
assistance in getting the instrument back to work when the instrument was down.
I am grateful towards Wanying Zhang, André Hughes, Matthew Schwarzkopf,
Rochelle Mathew, Andrea Liu, Roch Boisvert, Liem Whelan, and Mary Morley for
proofreading and editing my thesis.
Most of all, I would like to thank my supervisor Dr. Mayer for patiently guiding me
throughout the entire project. As an international student, there is a culture difference
and language barrier, and his understanding encouraged me a lot. In addition, I learned
many things from him; not only knowledge, but also Canadian culture. His mentorship
will benefit me for a lifetime.
iv
Table of Contents
Abstract ........................................................................................................................... ii
Acknowledgements ......................................................................................................... iii
Table of Contents ............................................................................................................iv
List of Figures ................................................................................................................ viii
List of Tables ................................................................................................................. xiii
Abbreviations ................................................................................................................ xiv
Chapter 1. Introduction .................................................................................................... 1
1.1 Objective ................................................................................................................ 1
1.2 Metalloporphyrins ................................................................................................... 3
1.3 References ............................................................................................................. 8
Chapter 2. Methods of Study ......................................................................................... 11
2.1 Theory of MS and MS/MS .................................................................................... 11
2.2 Experiment techniques ......................................................................................... 12
2.2.1 Electrospray ionization ................................................................................... 13
2.2.2 Quadrupole mass spectrometer ..................................................................... 15
2.2.3 Travelling-wave ion mobility spectrometry ..................................................... 17
2.2.4 Collision-induced dissociation ........................................................................ 19
2.2.5 In-source-CID ................................................................................................ 22
2.2.6 Time of flight mass spectrometry ................................................................... 23
2.3 Understanding CID mass spectra ........................................................................ 25
2.3.1 Obtaining vibrational frequencies of porphyrins. ............................................ 26
2.3.2 Time-scale of dissociation.............................................................................. 27
2.3.3 Microcanonical rate constant ......................................................................... 27
v
2.3.4 Entropy of activation ǂS ............................................................................... 28
2.3.5 The post-collision internal energy distribution ................................................ 29
2.3.6 The fraction of ions dissociating ..................................................................... 30
2.3.7 Theoretical breakdown diagram fitting ........................................................... 30
2.4 Molecular simulation ........................................................................................ 31
2.4.1 Density functional theory .............................................................................. 33
2.4.2 B3-LYP/6-31+G(2d, p)+LANL2DZ//PM7 ....................................................... 35
2.5 References ........................................................................................................... 39
Chapter 3. Experimental Procedures ............................................................................ 45
3.1 Materials .............................................................................................................. 45
3.2 ESI-MS ................................................................................................................. 45
3.3 ESI-MS/MS .......................................................................................................... 46
3.4 In-source-CID-MS/MS .......................................................................................... 48
3.5 Obtaining experimental breakdown diagram ........................................................ 49
Chapter 4. RRKM modeling for the dissociation of [NiIITPPS+H]3- ................................ 50
4.1 ESI-MS of NiIITPPS .............................................................................................. 50
4.2 ESI-MS/MS of [NiIITPPS+H]3- .............................................................................. 51
4.3 Structure of all the fragment ions ......................................................................... 53
4.4 In-source-CID-MS/MS and the map of the fragmentation pathways .................... 55
4.5 Breakdown Diagram ............................................................................................ 58
4.6 RRKM modeling the dissociation of [NiIITPPS+H]3- and other metalloporphyrins 60
4.7 References ........................................................................................................... 63
Chapter 5. Molecular Simulation ................................................................................... 64
5.1 Molecular simulation on the dissociation of negative and neutral
benzenesulfonate at B3-LYP/6-31+G(2d, p) level ...................................................... 64
vi
5.2 Molecular simulation on the energy changes for transferring H on [CoIIITPPS]3-
and [MnIIITPPS]3- at B3-LYP/6-31+G(2d, p)+LANL2DZ//PM7 level ........................... 68
5.3 References ........................................................................................................... 73
Chapter 6. Conclusion ................................................................................................... 74
6.1 Common fragmentation pathways ....................................................................... 74
6.2 The dissociation of [CoIIITPPS]3- and [MnIIITPPS]3- .............................................. 75
6.3 The dissociation of [NiIITPPS+H]3-, [FeIITPPS+2H]2-, [FeIITPPS+H]3- and
[MnIIITPPS+H]2- .......................................................................................................... 76
Statement of Original Research .................................................................................... 80
Appendix 1. RRKM modeling for the dissociation of [CoIIITPPS]3- ................................ 81
A1.1 ESI-MS of CoIIITPPS ......................................................................................... 81
A1.2 ESI-MS/MS of [CoIIITPPS]3- ............................................................................... 82
A1.3 Structure of all the fragment ions ....................................................................... 84
A1.4 In-source-CID-MS/MS and the map of the fragmentation pathways .................. 87
A1.5 Breakdown Diagram .......................................................................................... 90
A1.6 RRKM modeling ................................................................................................ 93
Appendix 2. RRKM modeling for the dissociation of [MnIIITPPS]3- ................................ 96
A2.1 ESI-MS of MnIIITPPS ......................................................................................... 96
A2.2 ESI-MS/MS of [MnIIITPPS]3- .............................................................................. 97
A2.3 Structure of all the fragment ions ....................................................................... 99
A2.4 In-source-CID-MS/MS and the map of the fragmentation pathways ................ 101
A2.5 Breakdown Diagram ........................................................................................ 104
A2.6 RRKM modeling .............................................................................................. 107
Appendix 3. RRKM modeling for the dissociation of [MnIIITPPS+H]2- ......................... 109
A3.1 ESI-MS of MnIIITPPS ....................................................................................... 109
A3.2 ESI-MS/MS of [MnIIITPPS+H]2- ........................................................................ 111
vii
A3.3 Structure of all the fragment ions ..................................................................... 113
A3.4 In-source-CID-MS/MS and the map of the fragmentation pathways ................ 115
A3.5 Breakdown Diagram ........................................................................................ 117
A3.6 RRKM modeling .............................................................................................. 118
Appendix 4. RRKM modeling for the dissociation of [FeIITPPS+H]3- ........................... 120
A4.1 ESI-MS of FeIITPPS ........................................................................................ 120
A4.2 ESI-MS/MS of [FeIITPPS+H]3- ......................................................................... 121
A4.3 Structure of all the fragment ions ..................................................................... 123
A4.4 In-source-CID-MS/MS and the map of the fragmentation pathways ................ 125
A4.5 Breakdown Diagram ........................................................................................ 128
A4.6 RRKM modeling .............................................................................................. 131
Appendix 5. RRKM modeling for the dissociation of [FeIITPPS+2H]2- ......................... 133
A5.1 ESI-MS of FeIITPPS ........................................................................................ 133
A5.2 ESI-MS/MS of [FeIITPPS+2H]2- ....................................................................... 135
A5.3 Structure of parent and fragment ions ............................................................. 137
A5.4 In-source-CID-MS/MS and the map of the fragmentation pathways ................ 141
A5.5 Breakdown Diagram ........................................................................................ 145
A5.6 RRKM modeling .............................................................................................. 147
Appendix 6. Tables...................................................................................................... 149
viii
List of Figures
Figure 1.1 Structures of porphyrin anions ....................................................................... 4
Figure 1.2 Collision-induced dissociation of [(MnIIITPPS)2+H]5- and [(FeIIITPPS)2+H]5- ... 6
Figure 1.3 The proposed dissociation channels of [FeIIITPP]+ ......................................... 7
Figure 1.4 The proposed dissociation channels of [MnIIITPP]+ ........................................ 7
Figure 2.1 Schematic diagram of Waters Synapt G1 .................................................... 13
Figure 2.2 Diagram of positive mode ESI process ........................................................ 14
Figure 2.3 Schematic of the possible pathways for ion formation in a Taylor Cone. ..... 15
Figure 2.4 Schematic diagram of quadrupole ................................................................ 16
Figure 2.5 Schematic diagram of ion mobility spectrometry .......................................... 17
Figure 2.6 Internal energy distributions of benzylpyridinium ions, ester ions and
protonated leucine encephalin ...................................................................................... 20
Figure 2.7 Average of mean internal energies of benzylpyridinium ions, ester ions and
protonated leucine enkephalin as a function of the cone voltage in triple quadrupole
mass spectrometer ........................................................................................................ 24
Figure 2.9 Reaction coordinate for a dissociation with a real barrier ............................. 27
Figure 2.10 Key points on a reaction potential energy surface ...................................... 32
Figure 2.11 Flow chart of the iteration scheme of DFT.................................................. 34
Figure 2.12 Relative accuracies of different level of theories ........................................ 38
Figure 4.1 Mass spectrum of NiIITPPS .......................................................................... 50
Figure 4.2 Mass spectrum of [NiIITPPS+H]3- and its isotope model .............................. 51
Figure 4.3 CID mass spectra of [NiIITPPS+H]3- at different collision voltages ............... 52
Figure 4.4 Breakdown diagram of [NiIITPPS+H]3- with all the fragment ions ................. 52
Figure 4.5 Mass spectrum of [NiIITPPS+H-SO3]3- and its isotope model ....................... 53
Figure 4.6 Possible structures of fragment ions from the dissociation of [NiIITPPS+H]3-
...................................................................................................................................... 55
Figure 4.7 In-source-CID-MS/MS of [NiIITPPS+H-SO3]3- .............................................. 57
Figure 4.8 In-source-CID-MS/MS of [NiIITPPS+H-SO2]3- .............................................. 57
Figure 4.9 Possible dissociation pathways of [M]3- (where M = NiIITPPS+H) ................ 58
ix
Figure 4.10 Total relative abundance of the overlapped fragment ions from both
[NiIITPPS+H-SO3]3- and [NiIITPPS+H-SO2]3- ................................................................. 59
Figure 4.11 Relative abundance % contribution from [NiIITPPS+H-SO3]3- to the
overlapped fragment ions .............................................................................................. 59
Figure 4.12 Final breakdown diagram for the dissociation of [NiIITPPS+H]3- ................ 60
Figure 4.13 RRKM modeling results for the dissociation of [NiIITPPS+H]3- ................... 61
Figure 5.1 Structures of neutral and negative benzenesulfonate .................................. 65
Figure 5.2 Mechanism of losing neutral SO2 and SO3 from neutral benzenesulfonate . 65
Figure 5.3 Mechanism of losing neutral SO2 from negative benzenesulfonate ion (ion a)
...................................................................................................................................... 66
Figure 5.4 Mechanism of losing [SO3]- from negative benzenesulfonate ion (ion a)...... 67
Figure 5.5 H movement on cobalt porphyrin and manganese porphyrin investigated by
molecular simulation at B3-LYP/6-31+G(2d, p)+LANL2DZ//PM7 level ......................... 69
Figure 5.6 Curve-crossing model for a reaction ............................................................ 72
Figure 6.1 Common fragmentation pathways of [NiIITPPS+H]3-, [CoIIITPPS]3- and
[MnIIITPPS]3-, [FeIITPPS+H]3- ........................................................................................ 74
Figure 6.2 Common fragmentation pathways of [MnIIITPPS+H]2- and [FeIITPPS+2H]2-
...................................................................................................................................... 75
Figure 6.3 CID Mass spectra of [FeIITPPS+H]3- at different collision voltages .............. 78
Figure A1.1 Mass spectrum of CoIIITPPS ...................................................................... 81
Figure A1.2 Mass spectrum of [CoIIITPPS]3- and its isotope model ............................... 82
Figure A1.3 CID mass spectra of [CoIIITPPS]3- at different collision voltages (IMS on) . 83
Figure A1.4 Breakdown diagram of [CoIIITPPS]3- with all the fragment ions (IMS on) ... 83
Figure A1.5 Breakdown diagram of [CoIIITPPS]3- with all the fragment ions (IMS off) ... 84
Figure A1.6 Mass spectrum of [CoIIITPPS-SO3]3- and its isotope model ....................... 85
Figure A1.7 Possible structures of fragment ions from the dissociation of [CoIIIITPPS]3-
...................................................................................................................................... 87
Figure A1.8 In-source-CID-MS/MS of [CoIIITPPS-SO3]3- ............................................... 89
Figure A1.9 In-source-CID-MS/MS of [CoIIITPPS-SO2]3- ............................................... 89
Figure A1.10 Possible dissociation pathways of [M]3- (where M = CoIIITPPS) .............. 90
x
Figure A1.11 Total relative abundance of the overlapped fragment ions from [CoIIITPPS-
SO3]3- and [CoIIITPPS-SO2]3- ......................................................................................... 91
Figure A1.12 Relative abundance % contribution from [CoIIITPPS-SO3]3- to the
overlapped fragment ions .............................................................................................. 92
Figure A1.13 Final breakdown diagram for the dissociation of [CoIIITPPS]3- ................. 92
Figure A1.14 RRKM modeling results for the dissociation of [CoIIITPPS]3- with IMS on 93
Figure A1.15 RRKM modeling results for the dissociation of [CoIIITPPS]3- with IMS off
when keeping Tini and α the same with Figure A1.14 .................................................... 94
Figure A1.16 RRKM modeling results for the dissociation of [CoIIITPPS]3- with IMS off
when keeping E0 and ǂS the same with Figure A1.14 ................................................. 94
Figure A2.1 Mass spectrum of MnIIITPPS ..................................................................... 96
Figure A2.2 Mass spectrum of [MnIIITPPS]3- and its isotope model .............................. 97
Figure A2.3 CID mass spectra of [MnIIITPPS]3- at different collision voltages ............... 98
Figure A2.4 Breakdown diagram of [MnIIITPPS]3- with all the fragment ions ................. 98
Figure A2.5 Mass spectrum of [MnIIITPPS-SO3]3- and its isotope model ....................... 99
Figure A2.6 Possible structures of fragment ions from the dissociation of [MnIIITPPS]3-
.................................................................................................................................... 101
Figure A2.7 In-source-CID-MS/MS of [MnIIITPPS-SO3]3- ............................................ 103
Figure A2.8 In-source-CID-MS/MS of [MnIIITPPS-SO2]3- ............................................ 103
Figure A2.9 Possible dissociation pathways of [M]3- (where M = MnIIITPPS) .............. 104
Figure A2.10 Total relative abundance of the overlapped fragment ions from
[MnIIITPPS-SO3]3- and [MnIIITPPS-SO2]3- .................................................................... 105
Figure A2.11 Relative abundance % contribution from [MnIIITPPS-SO3]3- to the
overlapped fragment ions. ........................................................................................... 106
Figure A2.12 Final breakdown diagram for the dissociation of [MnIIITPPS]3- .............. 106
Figure A2.13 RRKM modeling results for the dissociation of [MnIIITPPS]3- ................. 107
Figure A3.1 Mass spectrum at m/z 492.0 of high concentrated MnIIITPPS (2.5 × 10⁻⁴
mol/L). ......................................................................................................................... 110
Figure A3.2 Mass spectrum at m/z 492.0 of low concentrated MnIIITPPS (1 × 10⁻⁵ mol/L)
.................................................................................................................................... 111
Figure A3.3 CID mass spectra of [MnIIITPPS+H]2- at different collision voltages ........ 112
xi
Figure A3.4 Breakdown diagram of [MnIIITPPS+H]2- with all the fragment ions .......... 112
Figure A3.5 Mass spectrum of [MnIIITPPS+H-SO3]2- and its isotope model ................ 113
Figure A3.6 Possible structures of fragment ions from the [MnIIITPPS+H]2- dissociation
.................................................................................................................................... 114
Figure A3.7 In-source-CID-MS/MS of [MnIIITPPS+H-SO3]2- ........................................ 116
Figure A3.8 In-source-CID-MS/MS of [MnIIITPPS+H-SO2]2- ........................................ 116
Figure A3.9 Possible dissociation pathways of [MnIIITPPS+H]2- ................................. 117
Figure A3.10 Final breakdown diagram for the dissociation of [MnIIITPPS+H]2- .......... 117
Figure A3.11 RRKM modeling results for the dissociation of [MnIIITPPS+H]2- ............ 118
Figure A4.1 Mass spectrum of FeIITPPS ..................................................................... 120
Figure A4.2 Mass spectrum of [FeIITPPS+H]3- and its isotope model ......................... 121
Figure A4.3 CID mass spectra of [FeIITPPS+H]3- at different collision voltages .......... 122
Figure A4.4 Breakdown diagram of [FeIITPPS+H]3- with all the fragment ions ............ 122
Figure A4.5 Mass spectrum of [FeIITPPS+H-SO3]3- and its isotope model ................. 123
Figure A4.6 Possible structures of fragment ions from the [FeIITPPS+H]3- dissociation
.................................................................................................................................... 125
Figure A4.7 In-source-CID-MS/MS of [FeIITPPS+H-SO3]3- ......................................... 127
Figure A4.8 In-source-CID-MS/MS of [FeIITPPS+H-SO2]3-. ........................................ 127
Figure A4.9 Possible dissociation pathways of [M]3- (where M = FeIITPPS+H) ........... 128
Figure A4.10 Total Relative abundance of the overlapped fragment ions from both
[FeIITPPS+H-SO3]3- and [FeIITPPS+H-SO2]3- .............................................................. 129
Figure A4.11 Relative abundance % contribution from [FeIITPPS+H-SO3]3- to the
overlapped fragment ions ............................................................................................ 130
Figure A4.12 Final breakdown diagram for the dissociation of [FeIITPPS+H]3- ........... 130
Figure A4.13 RRKM modeling results for the dissociation of [FeIITPPS+H]3- .............. 132
Figure A5.1 Ion mobility spectrometry of FeIITPPS at high (2.5 × 10⁻⁴ mol/L) and low
(0.5 × 10⁻⁵ mol/L) concentration .................................................................................. 134
Figure A5.2 Mass spectrum of monomer [FeIITPPS+2H]2- and its isotope model ....... 134
Figure A5.3 CID mass spectra of [FeIITPPS+2H]2- at different collision voltages ........ 136
Figure A5.4 Breakdown diagram of [FeIITPPS+2H]2- with all the fragment ions .......... 136
Figure A5.5 Possible structures of [FeIITPPS+2H]2-. ................................................... 137
xii
Figure A5.6 Mass spectrum of [FeIITPPS+2H-SO3]2- and its isotope model ............... 138
Figure A5.7 Possible structures of fragment ions from the [FeIITPPS+2H]2- dissociation
.................................................................................................................................... 140
Figure A5.8 In-source-CID-MS of FeTPPS ................................................................. 142
Figure A5.9 In-source-CID-MS/MS of [FeIITPPS+2H-SO3]2- ....................................... 143
Figure A5.10 In-source-CID-MS/MS of [FeIITPPS+2H-SO2]2- ..................................... 144
Figure A5.11 Possible dissociation pathways of [M]2- (where M = FeIITPPS+2H) ....... 144
Figure A5.12 Total relative abundance of the overlapped fragment ions from both
[FeIITPPS+2H-SO3]2- and [FeIITPPS+2H-SO2]2- .......................................................... 145
Figure A5.13 Relative abundance % contribution from [FeIITPPS+2H-SO3]2- to the
overlapped fragment ions ............................................................................................ 146
Figure A5.14 Final breakdown diagram for the dissociation of [FeIITPPS+2H]2- ......... 146
Figure A5.15 RRKM modeling results for the dissociation of [FeIITPPS+2H]2- ............ 147
xiii
List of Tables
Table 1.1 Property of Mn, Fe, Co and Ni ......................................................................... 2
Table 2.1 The general convergence criteria for structure optimization at Gaussian09 .. 35
Table 3.1 Porphyrins studied in the research ................................................................ 45
Table 3.2 Settings for all the in-source-CID-MS/MS experiments ................................. 48
Table 4.1 RKKM modeling results for the dissociation of [NiIITPPS+H]3-, [CoIIITPPS]3-,
[MnIIITPPS]3-, [MnIIITPPS+H]2-, [FeIITPPS+H]3-, and [FeIITPPS+2H]2- ........................... 62
Table 5.1 The relative activation energies for SO2/SO3 loss from neutral and ionized
benzenesulfonate investigated by molecular simulations at B3-LYP/6-31+G(2d, p) level
...................................................................................................................................... 67
Table 5.2 Energy differences between the product and reactant when H moves from the
porphyrin ring to the negative benzenesulfonate functional group on [CoIIITPPS]3- ...... 70
Table 5.3 Energy differences between the product and reactant when H moves from the
porphyrin ring to the negative benzenesulfonate functional group on [MnIIITPPS]3- ...... 71
Table A1.1 RKKM modeling results for the dissociation of [CoIIITPPS]3- ....................... 95
Table A2.1 RKKM modeling results for the dissociation of [MnIIITPPS]3- .................... 108
Table A3.1 RKKM modeling results for the dissociation of [MnIIITPPS+H]2- ................ 119
Table A4.1 RKKM modeling results for the dissociation of [FeIITPPS+H]3- ................. 132
Table A5.1 RKKM modeling results for the dissociation of [FeIITPPS+2H]2- ............... 148
Table A6.1 Harmonic vibrational frequencies of [NiIITPPS+H]3-, [CoIIITPPS]3-,
[MnIIITPPS]3-, [MnIIITPPS+H]2-, [FeIITPPS+H]3-, and [FeIITPPS+2H]2- for modeling their
breakdown diagrams ................................................................................................... 149
Table A6.2 Detail settings for ESI-MS/MS experiments of [NiIIP+H]3-, [CoIIIP]3-, [MnIIIP]3-,
[MnIIIP+H]2-, [FeIIP+H]3-, and [FeIIP+2H]2- (where P represents TPPS) ....................... 153
xiv
Abbreviations
BIRD Blackbody infrared radiative dissociation
BEP Bell-Evans-Polanyi
CID Collision-induced dissociation
CRM Charge residue model
DC Direct current
DFT Density functional theory
DOF Degree of freedom
E0 Activation energy
ECD Electron-capture dissociation
ESI Electrospray ionization
ETD Electron-transfer dissociation
IEM Ion evaporation model
IR Infrared
IRMPD Infrared multiphoton dissociation
KS Kohn-Sham
MAD Mean absolute deviation
MS/MS Tandem mass spectrometry
NDDO Neglect of diatomic differential overlap
NMR Nuclear magnetic resonance
Q-TOF Quadrupole-time-of-flight
RF Radio frequency
RMS Root mean square residuals
RRKM Rice–Ramsperger–Kassel–Marcus
StdDec Standard deviation
TOF Time-of-flight
TPP Tetraphenyl porphyrin
TPPS Meso-tetra(4-sulfonatophenyl) porphine (acid form)
TW-IMS Travelling-wave ion mobility spectrometry
ǂS Entropy of activation
1
Chapter 1. Introduction
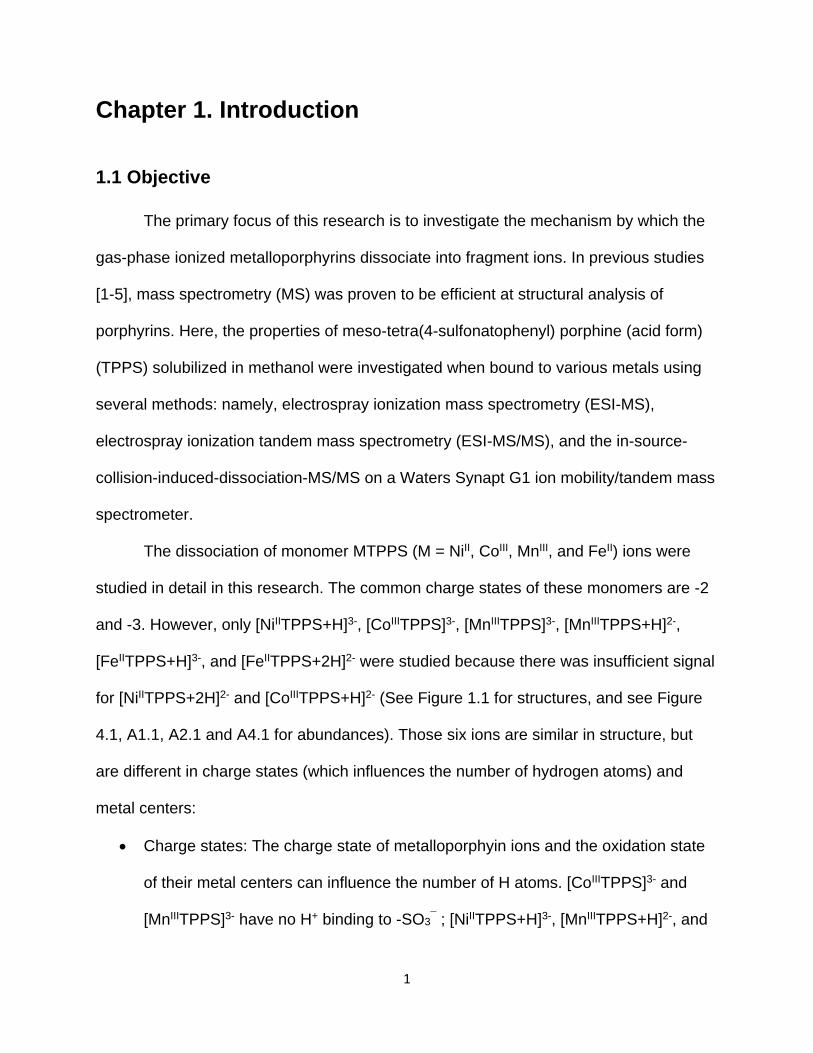
1.1 Objective
The primary focus of this research is to investigate the mechanism by which the
gas-phase ionized metalloporphyrins dissociate into fragment ions. In previous studies
[1-5], mass spectrometry (MS) was proven to be efficient at structural analysis of
porphyrins. Here, the properties of meso-tetra(4-sulfonatophenyl) porphine (acid form)
(TPPS) solubilized in methanol were investigated when bound to various metals using
several methods: namely, electrospray ionization mass spectrometry (ESI-MS),
electrospray ionization tandem mass spectrometry (ESI-MS/MS), and the in-source-
collision-induced-dissociation-MS/MS on a Waters Synapt G1 ion mobility/tandem mass
spectrometer.
The dissociation of monomer MTPPS (M = NiII, CoIII, MnIII, and FeII) ions were
studied in detail in this research. The common charge states of these monomers are -2
and -3. However, only [NiIITPPS+H]3-, [CoIIITPPS]3-, [MnIIITPPS]3-, [MnIIITPPS+H]2-,
[FeIITPPS+H]3-, and [FeIITPPS+2H]2- were studied because there was insufficient signal
for [NiIITPPS+2H]2- and [CoIIITPPS+H]2- (See Figure 1.1 for structures, and see Figure
4.1, A1.1, A2.1 and A4.1 for abundances). Those six ions are similar in structure, but
are different in charge states (which influences the number of hydrogen atoms) and
metal centers:
Charge states: The charge state of metalloporphyin ions and the oxidation state
of their metal centers can influence the number of H atoms. [CoIIITPPS]3- and
[MnIIITPPS]3- have no H+ binding to -SO3¯ ; [NiIITPPS+H]3-, [MnIIITPPS+H]2-, and
2
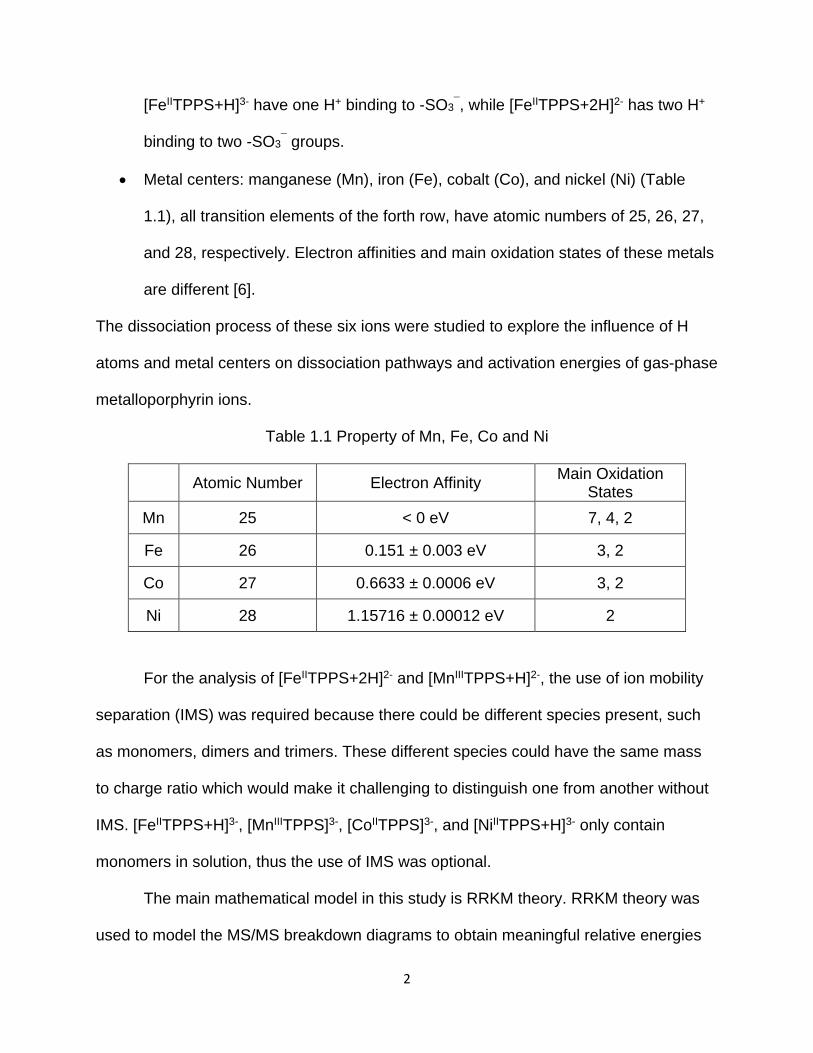
[FeIITPPS+H]3- have one H+ binding to -SO3¯, while [FeIITPPS+2H]2- has two H+
binding to two -SO3¯ groups.
Metal centers: manganese (Mn), iron (Fe), cobalt (Co), and nickel (Ni) (Table
1.1), all transition elements of the forth row, have atomic numbers of 25, 26, 27,
and 28, respectively. Electron affinities and main oxidation states of these metals
are different [6].
The dissociation process of these six ions were studied to explore the influence of H
atoms and metal centers on dissociation pathways and activation energies of gas-phase
metalloporphyrin ions.
Table 1.1 Property of Mn, Fe, Co and Ni
Atomic Number Electron Affinity Main Oxidation
States
Mn 25 < 0 eV 7, 4, 2
Fe 26 0.151 ± 0.003 eV 3, 2
Co 27 0.6633 ± 0.0006 eV 3, 2
Ni 28 1.15716 ± 0.00012 eV 2
For the analysis of [FeIITPPS+2H]2- and [MnIIITPPS+H]2-, the use of ion mobility
separation (IMS) was required because there could be different species present, such
as monomers, dimers and trimers. These different species could have the same mass
to charge ratio which would make it challenging to distinguish one from another without
IMS. [FeIITPPS+H]3-, [MnIIITPPS]3-, [CoIITPPS]3-, and [NiIITPPS+H]3- only contain
monomers in solution, thus the use of IMS was optional.
The main mathematical model in this study is RRKM theory. RRKM theory was
used to model the MS/MS breakdown diagrams to obtain meaningful relative energies
3
for the dissociation of these ions. Molecular simulations were used to help interpret the
RRKM results.
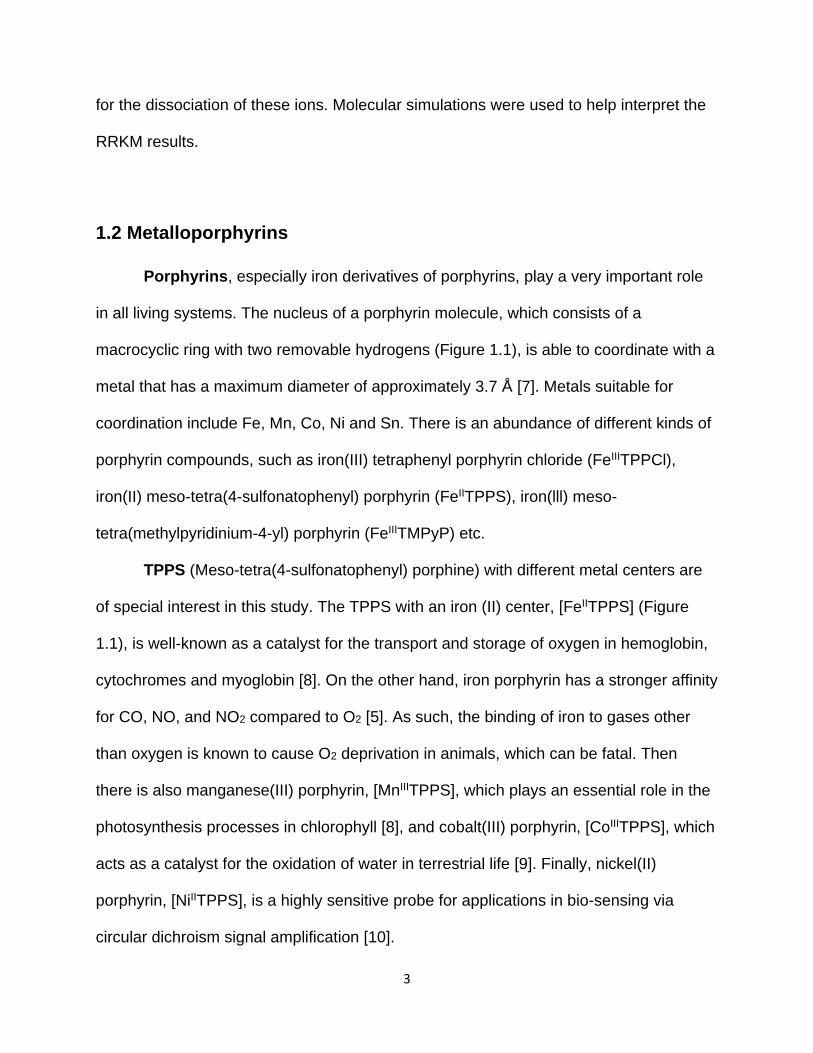
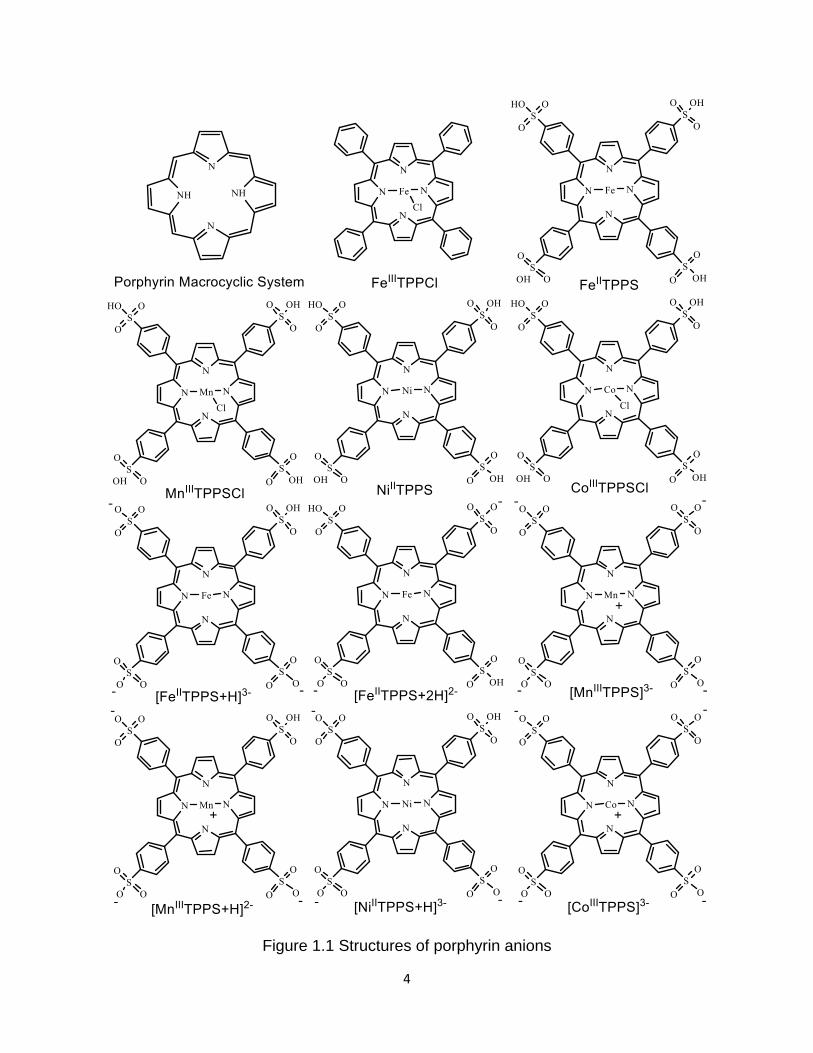
1.2 Metalloporphyrins
Porphyrins, especially iron derivatives of porphyrins, play a very important role
in all living systems. The nucleus of a porphyrin molecule, which consists of a
macrocyclic ring with two removable hydrogens (Figure 1.1), is able to coordinate with a
metal that has a maximum diameter of approximately 3.7 Å [7]. Metals suitable for
coordination include Fe, Mn, Co, Ni and Sn. There is an abundance of different kinds of
porphyrin compounds, such as iron(III) tetraphenyl porphyrin chloride (FeIIITPPCl),
iron(II) meso-tetra(4-sulfonatophenyl) porphyrin (FeIITPPS), iron(lll) meso-
tetra(methylpyridinium-4-yl) porphyrin (FeIIITMPyP) etc.
TPPS (Meso-tetra(4-sulfonatophenyl) porphine) with different metal centers are
of special interest in this study. The TPPS with an iron (II) center, [FeIITPPS] (Figure
1.1), is well-known as a catalyst for the transport and storage of oxygen in hemoglobin,
cytochromes and myoglobin [8]. On the other hand, iron porphyrin has a stronger affinity
for CO, NO, and NO2 compared to O2 [5]. As such, the binding of iron to gases other
than oxygen is known to cause O2 deprivation in animals, which can be fatal. Then
there is also manganese(III) porphyrin, [MnIIITPPS], which plays an essential role in the
photosynthesis processes in chlorophyll [8], and cobalt(III) porphyrin, [CoIIITPPS], which
acts as a catalyst for the oxidation of water in terrestrial life [9]. Finally, nickel(II)
porphyrin, [NiIITPPS], is a highly sensitive probe for applications in bio-sensing via
circular dichroism signal amplification [10].
4
Figure 1.1 Structures of porphyrin anions
5
The chemical properties and reactions of metalloporphyrins have been
extensively studied. Thousands of studies about TPPS were found by a quick look at
SciFinder. A few examples to highlight the range of interest are: Gsponer et al. used
[TPPS]4- to mediate Escherichia coli [11]. Fernandez et al. quantitatively investigated
the reduction process of (FeIIITPPS)(H2O)2 to (FeIITPPS)(NO) in buffer solution [12].
Kadish et al. studied the effects of micelles on the aggregation of [TPPS]4- and
[MTPPS]4- (M = ZnII, CuII, VO2+) [13]. Rahman et al. investigated the interaction of TPPS
with trinitrotoluene (TNT) [14]. Zhang et al. conducted an electrochemical investigation
of the interaction of TPPS with bovine serum albumin [15]. Aggarwal et al. studied the
dynamics of the TPPS aggregation in aqueous solutions [16]. Karpuschkin et al.
reported the binding of O2 and CO to FeIITPPS and MnIITPPS [5].
There has also been research performed about the dissociation of gas-phase
metalloporphyrins. The gas-phase was chosen because it allows the system to be
studied in the absence of solvent effects to highlight the intrinsic properties of the
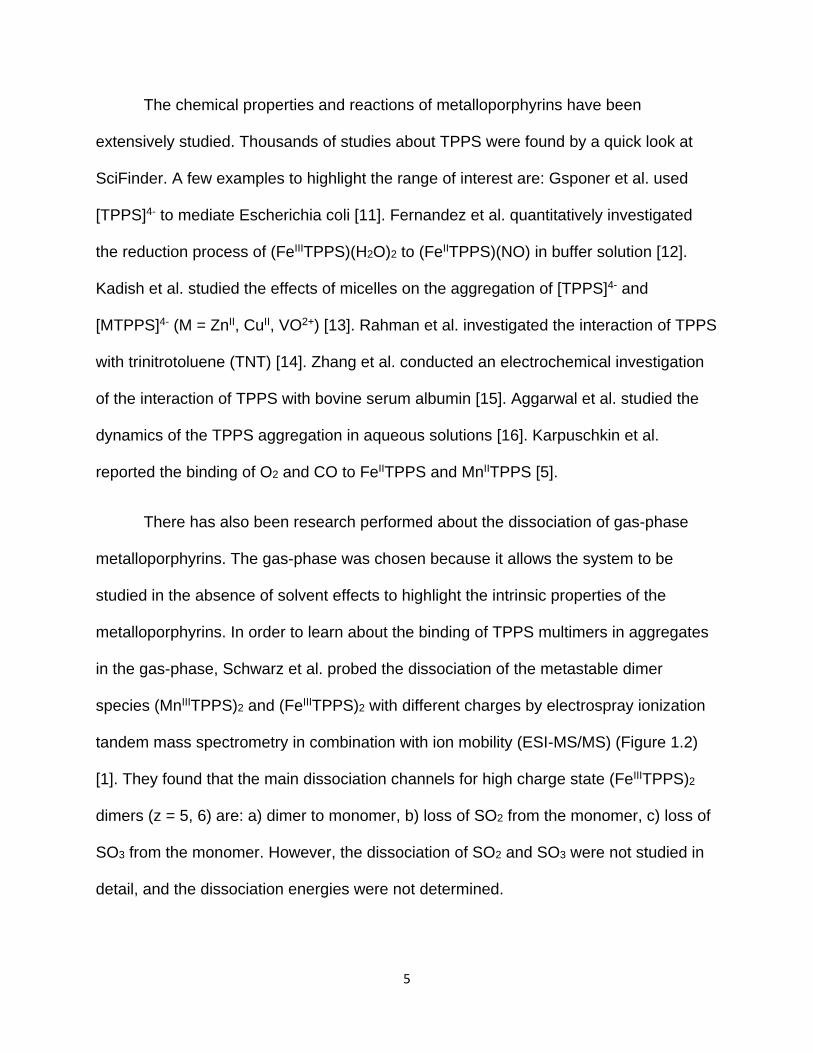
metalloporphyrins. In order to learn about the binding of TPPS multimers in aggregates
in the gas-phase, Schwarz et al. probed the dissociation of the metastable dimer
species (MnIIITPPS)2 and (FeIIITPPS)2 with different charges by electrospray ionization
tandem mass spectrometry in combination with ion mobility (ESI-MS/MS) (Figure 1.2)
[1]. They found that the main dissociation channels for high charge state (FeIIITPPS)2
dimers (z = 5, 6) are: a) dimer to monomer, b) loss of SO2 from the monomer, c) loss of
SO3 from the monomer. However, the dissociation of SO2 and SO3 were not studied in
detail, and the dissociation energies were not determined.
6
Figure 1.2 Collision-induced dissociation of [(MnIIITPPS)2+H]5- and [(FeIIITPPS)2+H]5-
Schwarz et al. found that the main dissociation channels for both of these dimers are
dimer to monomer; however, monomer fragment ions, [FeIIITPPS+H]2- and [FeIIITPPS]3-,
fragment further via SO2 and SO3 loss. (Reprinted from Schwarz et al., 2013 with
permission) [1].
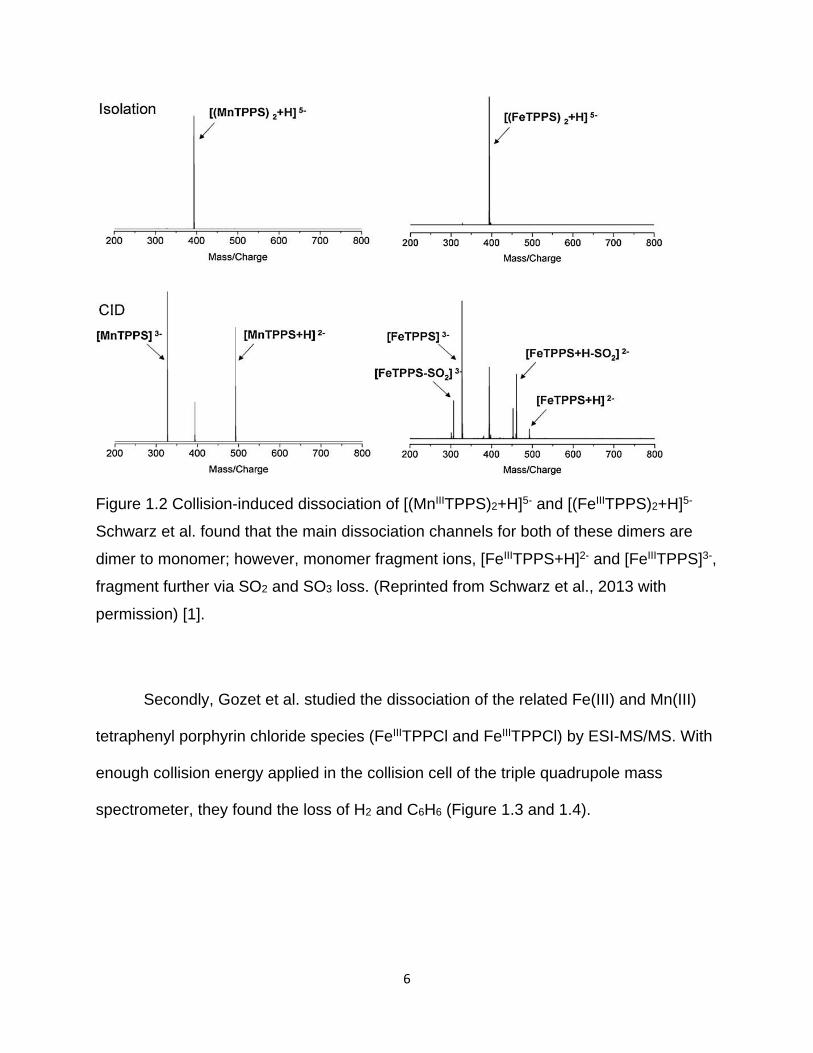
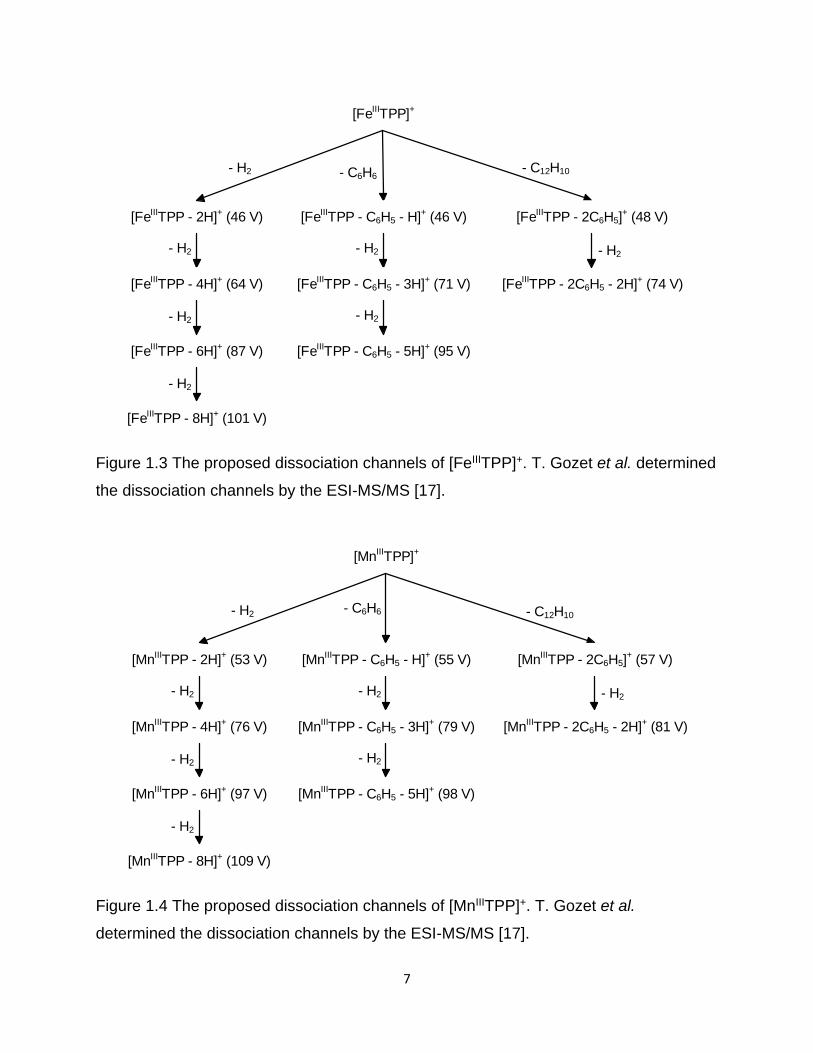
Secondly, Gozet et al. studied the dissociation of the related Fe(III) and Mn(III)
tetraphenyl porphyrin chloride species (FeIIITPPCl and FeIIITPPCl) by ESI-MS/MS. With
enough collision energy applied in the collision cell of the triple quadrupole mass
spectrometer, they found the loss of H2 and C6H6 (Figure 1.3 and 1.4).
7
[FeIIITPP]+
[FeIIITPP - 2H]+ (46 V) [FeIIITPP - C6H5 - H]+ (46 V) [FeIIITPP - 2C6H5]+ (48 V)
- C6H6- C12H10- H2
[FeIIITPP - 4H]+ (64 V) [FeIIITPP - C6H5 - 3H]+ (71 V) [FeIIITPP - 2C6H5 - 2H]+ (74 V)
[FeIIITPP - 6H]+ (87 V) [FeIIITPP - C6H5 - 5H]+ (95 V)
[FeIIITPP - 8H]+ (101 V)
- H2
- H2
- H2
- H2
- H2 - H2
Figure 1.3 The proposed dissociation channels of [FeIIITPP]+. T. Gozet et al. determined
the dissociation channels by the ESI-MS/MS [17].
[MnIIITPP]+
[MnIIITPP - 2H]+ (53 V) [MnIIITPP - C6H5 - H]+ (55 V) [MnIIITPP - 2C6H5]+ (57 V)
- C6H6 - C12H10- H2
[MnIIITPP - 4H]+ (76 V) [MnIIITPP - C6H5 - 3H]+ (79 V) [MnIIITPP - 2C6H5 - 2H]+ (81 V)
[MnIIITPP - 6H]+ (97 V) [MnIIITPP - C6H5 - 5H]+ (98 V)
[MnIIITPP - 8H]+ (109 V)
- H2
- H2
- H2
- H2
- H2 - H2
Figure 1.4 The proposed dissociation channels of [MnIIITPP]+. T. Gozet et al.
determined the dissociation channels by the ESI-MS/MS [17].
8
The dissociation of monomers MTPPS (where M = NiII, CoIII, MnIII, FeII, etc) has
not yet been studied in detail. As mentioned above, metalloporphyrins perform
important roles in all living systems. Thus, a thorough understanding of their
dissociation properties can offer some useful information, especially as they are present
in biological systems as charged species. In this research, the primary focus is to
systematically study the dissociation processes of gas-phase [NiIITPPS+H]3-,
[CoIIITPPS]3-, [MnIIITPPS]3-, [MnIIITPPS+H]2-, [FeIITPPS+H]3-, and [FeIITPPS+2H]2- ions.
Detailed dissociation pathways for each metalloporphyrin were estimated, and the
activation energies for the main pathways were modeled by RRKM theory and
molecular simulations.
1.3 References
[1] Schwarz U, Vonderach M, Kappes M, Kelting R, Brendle K, Weis P. Structural
characterization of metalloporphyrin-oligomer multianions by mass spectrometry and ion
mobility spectrometry-Observation of metastable species. International Journal of Mass
Spectrometry. 2013;339:24-33.
[2] Schwarz U, Vonderach M, Armbruster MK, Fink K, Kappes MM, Weis P. Cu(II)-
and Mn(III)-porphyrin-derived oligomeric multianions: Structures and photoelectron
spectra. Journal of Physical Chemistry a. 2014;118(2):369-79.
[3] Silva EMP, Domingues MRM, Barros C, Faustino MAF, Tome JPC, Neves
MGPMS, et al. Characterization of dinitroporphyrin zinc complexes by electrospray
ionization tandem mass spectrometry. Unusual fragmentations of beta-(1,3-dinitroalkyl)
porphyrins. Journal of Mass Spectrometry. 2005;40(1):117-22.
[4] Silva EMP, Domingues P, Tome JPC, Faustino MAF, Graca M, Neves PMS, et
al. Electrospray tandem mass spectrometry of beta-nitroalkenyl meso-
tetraphenylporphyrins. European Journal of Mass Spectrometry. 2008;14(1):49-59.
9
[5] Karpuschkin T, Kappes MM, Hampe O. Binding of O-2 and CO to metal
porphyrin anions in the gas phase. Angewandte Chemie-International Edition.
2013;52(39):10374-7.
[6] KnowledgeDoor. Elements Handbook. 2014 [cited 2015 May 5th]; Available
from: http://www.knowledgedoor.com/2/elements_handbook/electron_affinity.html
[7] Biesaga M, Pyrzynska K, Trojanowicz M. Porphyrins in analytical chemistry. A
review. Talanta. 2000;51(2):209-24.
[8] Chai Z, Gao H, Ren J, An Y, Shi L. MgTPPS/block copolymers complexes for
enhanced stability and photoactivity. Rsc Advances. 2013;3(40):18351-8.
[9] Nakazono T, Parent A, Sakai K. Cobalt porphyrins as homogeneous catalysts for
water oxidation. Chemical Communications. 2013;49(56):6325-7.
[10] Choi JK, Sargsyan G, Shabbir-Hussain M, Holmes AE, Balaz M. Chiroptical
detection of condensed nickel(II)-Z-DNA in the presence of the B-DNA via porphyrin
exciton coupled circular dichroism. Journal of Physical Chemistry B.
2011;115(33):10182-8.
[11] Gsponer N, Spesia M, Durantini E. Effects of divalent cations, EDTA and
chitosan on the uptake and photoinactivation of Escherichia coli mediated by cationic
and anionic porphyrins. Photodiagnosis and Photodynamic Therapy. 2015;12(1):67-75.
[12] Fernandez B, Lorkovic I, Ford P. Nitrite catalyzes reductive nitrosylation of the
water-soluble ferri-heme model Fe-III(TPPS) to Fe-II(TPPS)(NO). Inorganic Chemistry.
2003;42(1):2-4.
[13] Kadish KM, Maiya GB, Araullo C, Guilard R. Micellar effects on the aggregation
of tetraanionic porphyrins-spectroscopic characterization of free-base meso-tetrakis(4-
sulfonatophenyl) porphyrin, (TPPS)H-2, and (TPPS)Zn(II), (TPPS)Cu(II), (TPPS)VO2+
in aqueous micellar media. Inorganic Chemistry. 1989;28(14):2725-31.
[14] Rahman M, Harmon H. Absorbance change and static quenching of fluorescence
of meso-tetra(4-sulfonatophenyl)porphyrin (TPPS) by trinitrotoluene (TNT).
Spectrochimica Acta Part a-Molecular and Biomolecular Spectroscopy. 2006;65(3-
4):901-6.
10
[15] Zhang H, Zhu Z, Li N. Electrochemical studies of the interaction of
tetraphenylporphyrin tetrasulfonate (TPPS) with albumin. Fresenius Journal of
Analytical Chemistry. 1999;363(4):408-12.
[16] Aggarwal LPF, Borissevitch IE. On the dynamics of the TPPS4 aggregation in
aqueous solutions - Successive formation of H and J aggregates. Spectrochimica Acta
Part a-Molecular and Biomolecular Spectroscopy. 2006;63(1):227-33.
[17] Gozet T, Huynh L, Bohme D. Collision-induced dissociation of tetraphenyl iron
and manganese porphyrin ions by electrospray ionization mass spectrometry.
International Journal of Mass Spectrometry. 2009;279(2-3):113-8.
11
Chapter 2. Methods of Study
2.1 Theory of MS and MS/MS
Mass spectrometry (MS) is an analytical tool that can analyze qualitatively and
quantitatively chemicals present in a sample by measuring the mass-to-charge ratio
(m/z) and abundance of gas-phase ions. MS differs from other common organic spectral
analysis techniques, such as infrared (IR), or nuclear magnetic resonance (NMR)
spectroscopy. While the sample used for IR and NMR can be reused, the sample for
MS is depleted in the process of mass spectral analysis. However, MS is more sensitive
than IR or NMR and thus it requires less sample [1].
Tandem mass spectrometry (MS/MS) is a technique that involves two stages of
mass analysis: the first mass analysis selects the ion of interest with specific m/z, the
second stage is to analyze all the fragment ions from the dissociation of the pre-
selected ions. There are four steps in an MS/MS experiment: a) ion generation, b) ion
selection, c) pre-selected ion dissociation, and d) fragment analysis [2, 3]. These four
steps can be separated “in time”, such as using ion traps; or they can also be separated
“in space”, such as using double focusing instruments, triple quadrupoles and ion
mobility-tandem mass spectrometers.
The essential part of MS/MS is the fragmentation of gas-phase ions. There are
many techniques which can be used to dissociate gas-phase ions, such as collision-
induced dissociation (CID) [4], electron-transfer dissociation (ETD) [5], electron-capture
dissociation (ECD) [6], infrared multiphoton dissociation (IRMPD) [7], and blackbody
infrared radiative dissociation (BIRD) [8]. These methods use different types of
12
fragmentation which provide different information about the composition of parent ions
and their fragment ions.
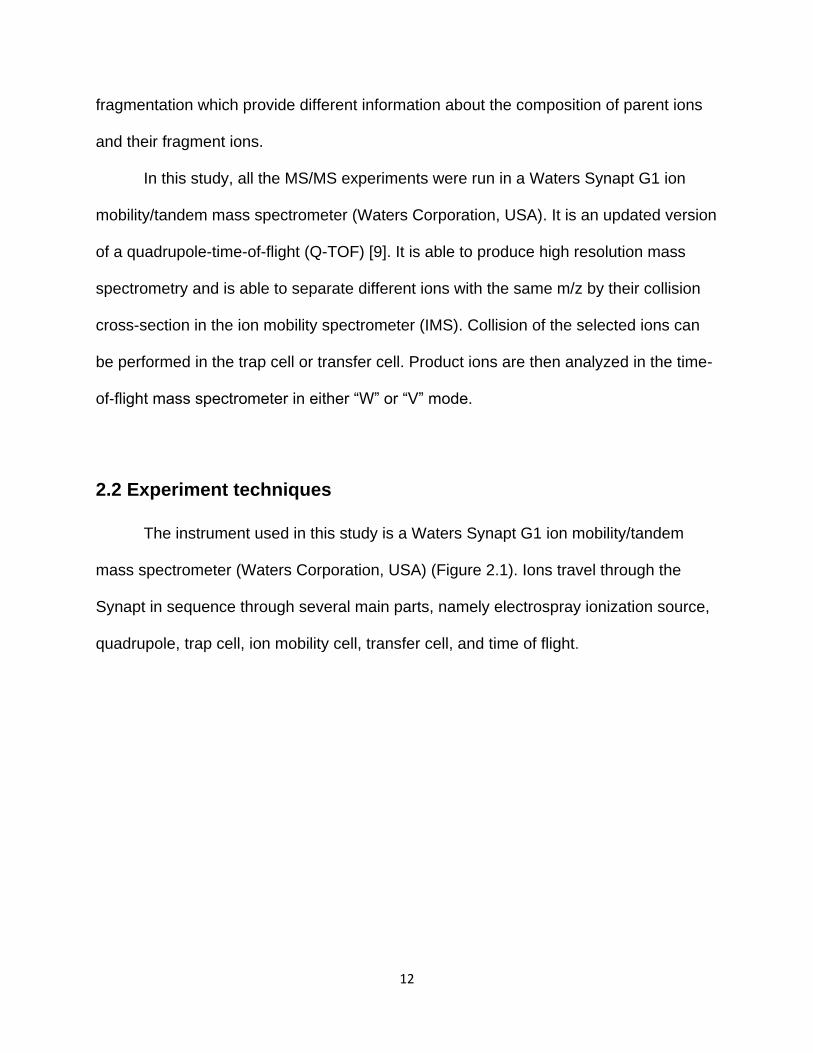
In this study, all the MS/MS experiments were run in a Waters Synapt G1 ion
mobility/tandem mass spectrometer (Waters Corporation, USA). It is an updated version
of a quadrupole-time-of-flight (Q-TOF) [9]. It is able to produce high resolution mass
spectrometry and is able to separate different ions with the same m/z by their collision
cross-section in the ion mobility spectrometer (IMS). Collision of the selected ions can
be performed in the trap cell or transfer cell. Product ions are then analyzed in the time-
of-flight mass spectrometer in either “W” or “V” mode.
2.2 Experiment techniques
The instrument used in this study is a Waters Synapt G1 ion mobility/tandem
mass spectrometer (Waters Corporation, USA) (Figure 2.1). Ions travel through the
Synapt in sequence through several main parts, namely electrospray ionization source,
quadrupole, trap cell, ion mobility cell, transfer cell, and time of flight.
13
Figure 2.1 Schematic diagram of Waters Synapt G1 [9]
2.2.1 Electrospray ionization
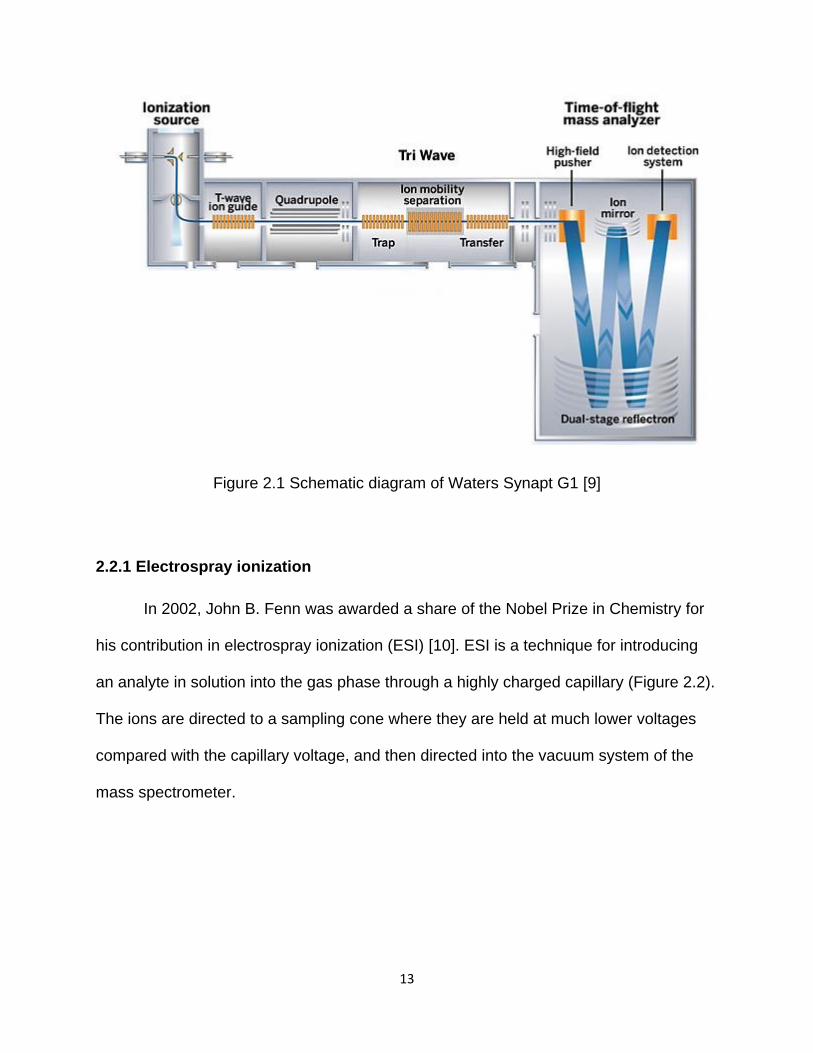
In 2002, John B. Fenn was awarded a share of the Nobel Prize in Chemistry for
his contribution in electrospray ionization (ESI) [10]. ESI is a technique for introducing
an analyte in solution into the gas phase through a highly charged capillary (Figure 2.2).
The ions are directed to a sampling cone where they are held at much lower voltages
compared with the capillary voltage, and then directed into the vacuum system of the
mass spectrometer.
14
Figure 2.2 Diagram of positive mode ESI process [11]
The formation of gas-phase anions in a Taylor Cone is the beginning of the
electrospraying process. The analyte and solvent droplets go through the loop of
evaporation and subdivision in the ESI process undergoing uneven Rayleigh fission.
This step is followed by the desolvation of the shrunken analyte and solvent droplets.
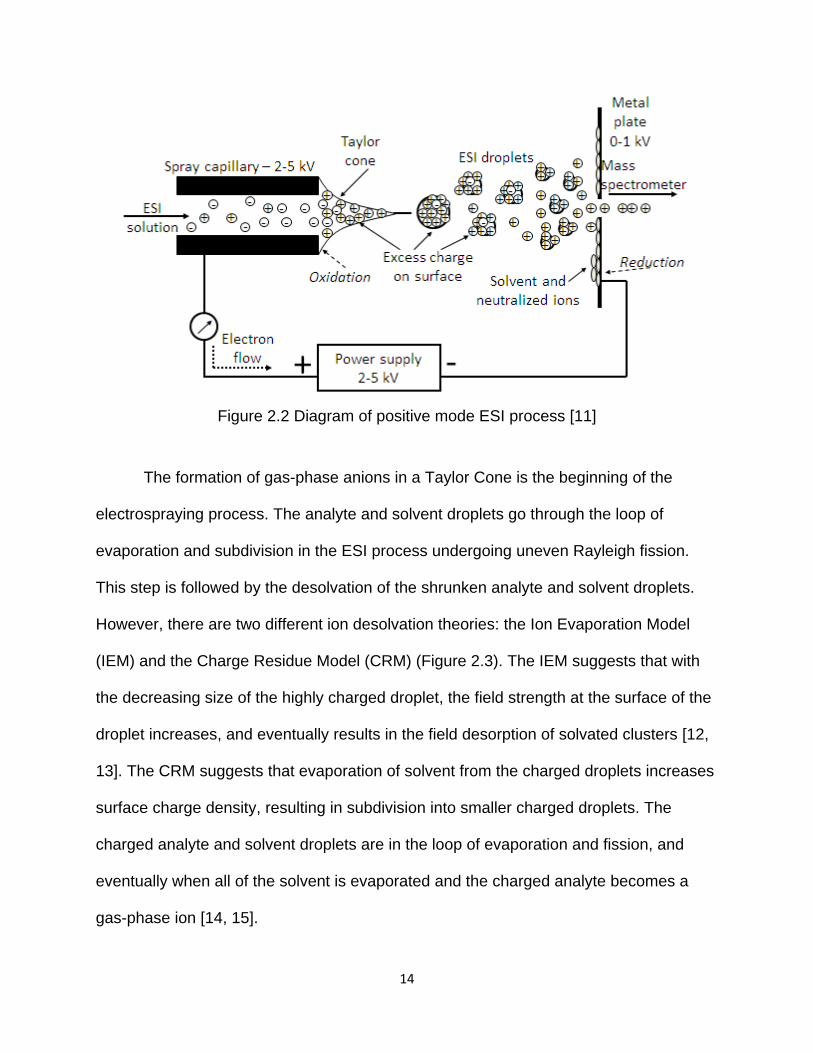
However, there are two different ion desolvation theories: the Ion Evaporation Model
(IEM) and the Charge Residue Model (CRM) (Figure 2.3). The IEM suggests that with
the decreasing size of the highly charged droplet, the field strength at the surface of the
droplet increases, and eventually results in the field desorption of solvated clusters [12,
13]. The CRM suggests that evaporation of solvent from the charged droplets increases
surface charge density, resulting in subdivision into smaller charged droplets. The
charged analyte and solvent droplets are in the loop of evaporation and fission, and
eventually when all of the solvent is evaporated and the charged analyte becomes a
gas-phase ion [14, 15].
15
During the ESI process, high energy ions collide with gas molecules at
atmospheric pressure, which slows down the ions, so ESI can be coupled to other lower
energy instruments, such as quadrupole mass spectrometers [16].
Figure 2.3 Schematic of the possible pathways for ion formation in a Taylor Cone.
“+" represents a desolvated solution ion. The major difference between CRM and IEM:
The final ion in CRM is produced by desorption, whereas the one for IEM is produced
by evaporation of solvent [13].
2.2.2 Quadrupole mass spectrometer
Quadrupole mass spectrometry (Figure 2.4) can be used for scanning all the ions
in the gas phase, and can also be used for selecting specific ions for MS/MS. Detailed
theories and applications of quadrupoles are found in Raymond E. March’s review
about quadrupole ion trap mass spectrometry published in the Journal of Mass
Spectrometry [17]. The quadrupole consists of four cylindrical parallel metal rods with a
90o angle to each other. The two rods that are orthogonal to each other are paired with
the same experiment conditions. A radio frequency (RF) voltage is applied on one pair
of rods and 180o out of phase on the other pair. A direct current (DC) voltage is then
superimposed on the RF voltage. DC is positive on the x pair and negative on the y pair.
16
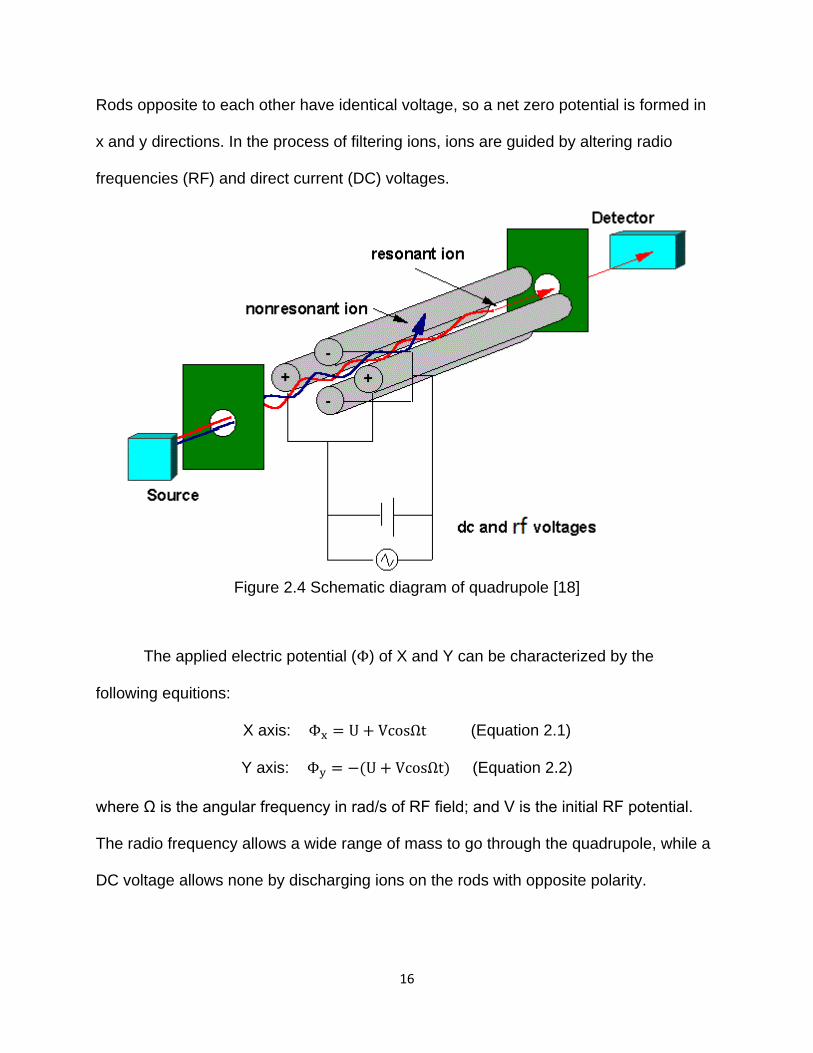
Rods opposite to each other have identical voltage, so a net zero potential is formed in
x and y directions. In the process of filtering ions, ions are guided by altering radio
frequencies (RF) and direct current (DC) voltages.
Figure 2.4 Schematic diagram of quadrupole [18]
The applied electric potential (Φ) of X and Y can be characterized by the
following equitions:
X axis: Φx = U + VcosΩt (Equation 2.1)
Y axis: Φy = −(U + VcosΩt) (Equation 2.2)
where Ω is the angular frequency in rad/s of RF field; and V is the initial RF potential.
The radio frequency allows a wide range of mass to go through the quadrupole, while a
DC voltage allows none by discharging ions on the rods with opposite polarity.
17
Therefore, by altering the ratio of the DC/RF, one can selectively control a specific ion
m/z to transmit through the quadrupole, and discharge all of the other ions.
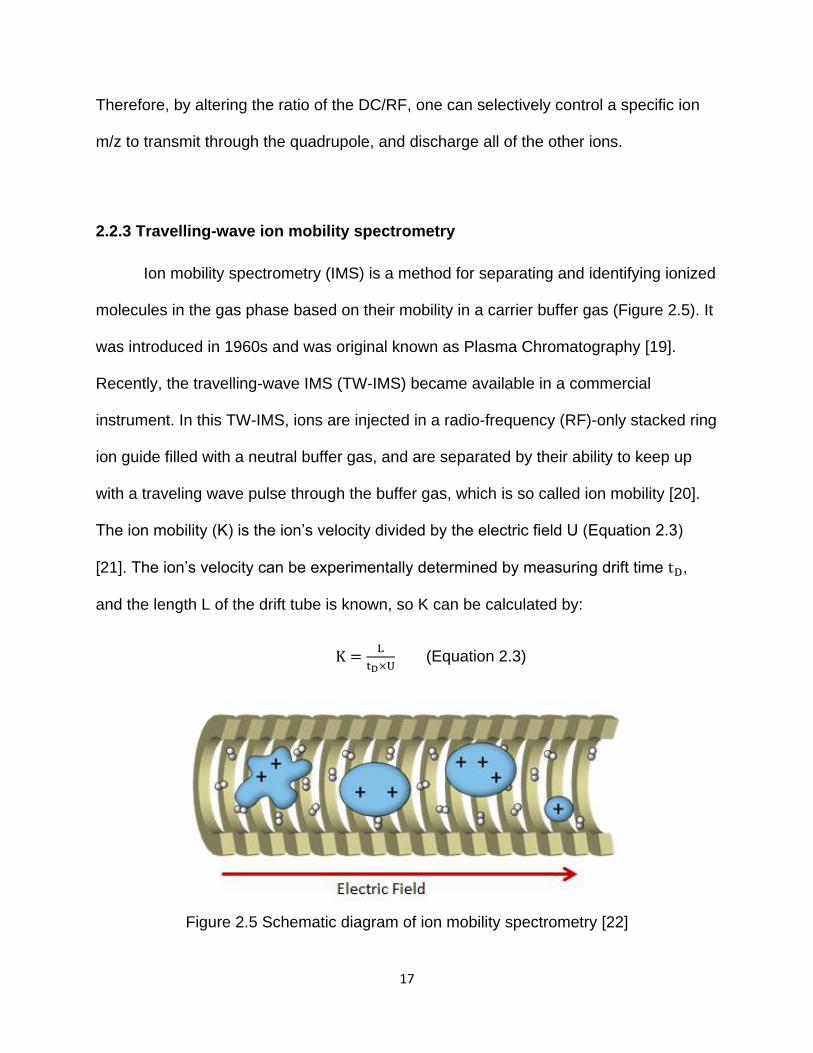
2.2.3 Travelling-wave ion mobility spectrometry
Ion mobility spectrometry (IMS) is a method for separating and identifying ionized
molecules in the gas phase based on their mobility in a carrier buffer gas (Figure 2.5). It
was introduced in 1960s and was original known as Plasma Chromatography [19].
Recently, the travelling-wave IMS (TW-IMS) became available in a commercial
instrument. In this TW-IMS, ions are injected in a radio-frequency (RF)-only stacked ring
ion guide filled with a neutral buffer gas, and are separated by their ability to keep up
with a traveling wave pulse through the buffer gas, which is so called ion mobility [20].
The ion mobility (K) is the ion’s velocity divided by the electric field U (Equation 2.3)
[21]. The ion’s velocity can be experimentally determined by measuring drift time tD,
and the length L of the drift tube is known, so K can be calculated by:
K =L
tD×U (Equation 2.3)
Figure 2.5 Schematic diagram of ion mobility spectrometry [22]
18
As ions travel through the drift tube, the drift gas moves in the opposite direction.
Thus, the drift gas collides with the ions. An ion’s collision cross-section is defined as
the area where the drift gas strikes, so it is directly proportional to the size and shape of
the ion. In other words, the larger the cross-section, the more drift gas colliding with the
ion, and the longer the drift time for the ion travel through the tube. The collision cross-
section Ω is calculated by:
Ω =3ze
16N√
2π
μkBT
1
K (Equation 2.4)
where z is the number of charges on the ion, e (C) is the elementary charge, N (m-3) is
the buffer gas number density, μ is the reduced mass of the ion-neutral pair, kB is the
Boltzmann’s constant, T (K) is the draft gas temperature, and K (m2∙V-1∙s-1) is the
reduced mobility (=measured mobility corrected to 760 Torr and 272.15 K) [23].
As can be seen in Equation 2.4, the mobility of the ion is inversely proportional to
its cross-section, so ions with the same m/z can be separated based on their size and
shape in IMS. However, the above equations are strictly true for a field-free drift tube ion
mobility experiment. Due to the complexity of the ion motion in TW-IMS, it is not
possible to directly relate drift time to cross section without calibration. In the current
study, TW-IMS was only used to separate porphyrin anions with the same m/z ratio and
not to determine their cross-section.
19
2.2.4 Collision-induced dissociation
Collision-induced dissociation (CID) is a method for inducing fragmentation of
gas phase molecular ions in mass spectrometry. In August of 1968, both Jennings [24]
and Haddon et al. [25] reported the first CID mass spectra. In 1973, MaLafferty et al.
detailed valuable additional information of ion reaction mechanisms and structure
determination by CID [4], which led to CID becoming an independent and essential
technique in mass spectrometry. On a Waters Synapt G1 ion mobility/tandem mass
spectrometer, CID can be done in a trap cell or transfer cell. In this study, CID
experiments were done in the transfer cell, with and without IMS.
CID has four experimental conditions: high center-of-mass collision energies
Ecom (> 100 eV), intermediate Ecom (1 – 100 eV), low Ecom (multiple low-energy
collisions such as MS/MS performed in ion traps) and surface-induced dissociation.
Details are found in Mayer and Poon’s review about the mechanism of collision
activation of ions in mass spectrometry [26]. The collision regime in this study is
intermediate Ecom.
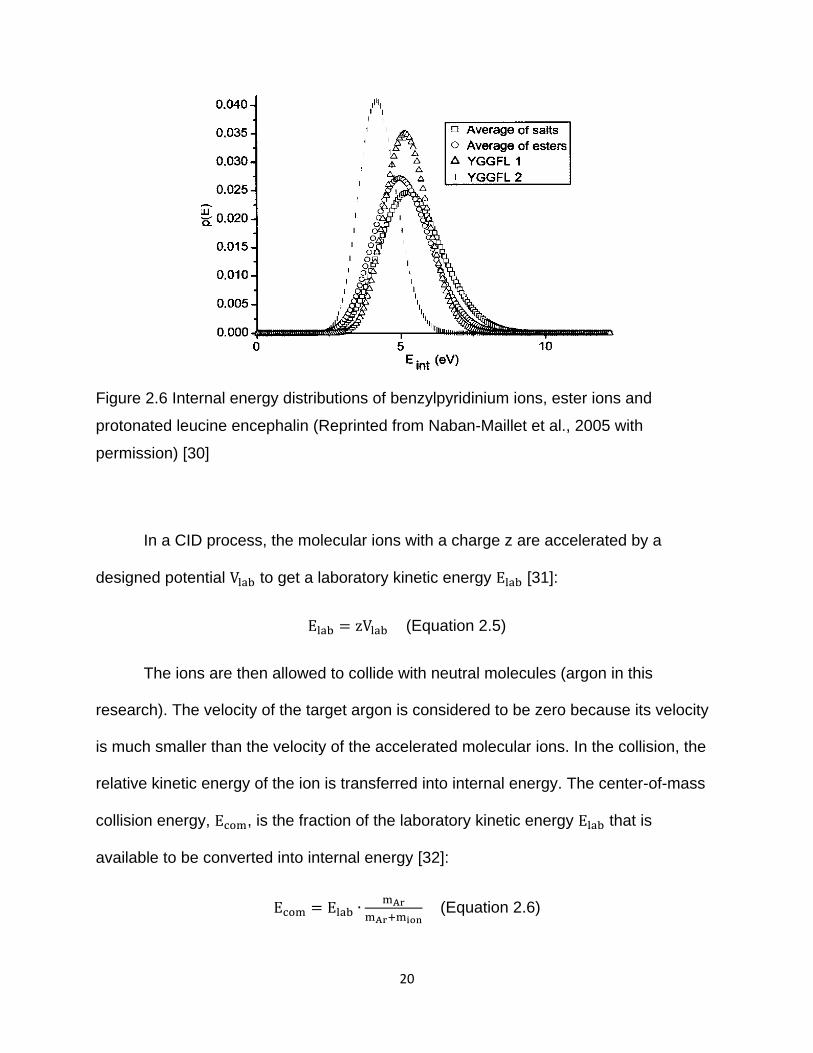
Under the condition of intermediate Ecom, the general shape of the post-collision
internal energy distributions for the dissociation ions, which can be derived from the
relative abundance of the fragment ion peaks, resembles a Boltzmann or related
distribution (Figure 2.6) [27-29]. In Figure 2.6 and 2.7, YGGFL 1 and 2 represent
different experimental parameters.
20
Figure 2.6 Internal energy distributions of benzylpyridinium ions, ester ions and
protonated leucine encephalin (Reprinted from Naban-Maillet et al., 2005 with
permission) [30]
In a CID process, the molecular ions with a charge z are accelerated by a
designed potential Vlab to get a laboratory kinetic energy Elab [31]:
Elab = zVlab (Equation 2.5)
The ions are then allowed to collide with neutral molecules (argon in this
research). The velocity of the target argon is considered to be zero because its velocity
is much smaller than the velocity of the accelerated molecular ions. In the collision, the
relative kinetic energy of the ion is transferred into internal energy. The center-of-mass
collision energy, Ecom, is the fraction of the laboratory kinetic energy Elab that is
available to be converted into internal energy [32]:
Ecom = Elab ∙mAr
mAr+mion (Equation 2.6)
21
where mion and mAr are the molecular weight of the ion and target neutral molecule
argon respectively. Collisions will result in the breakdown of the molecular ion. The
fragment ions can then be analyzed by time of flight.
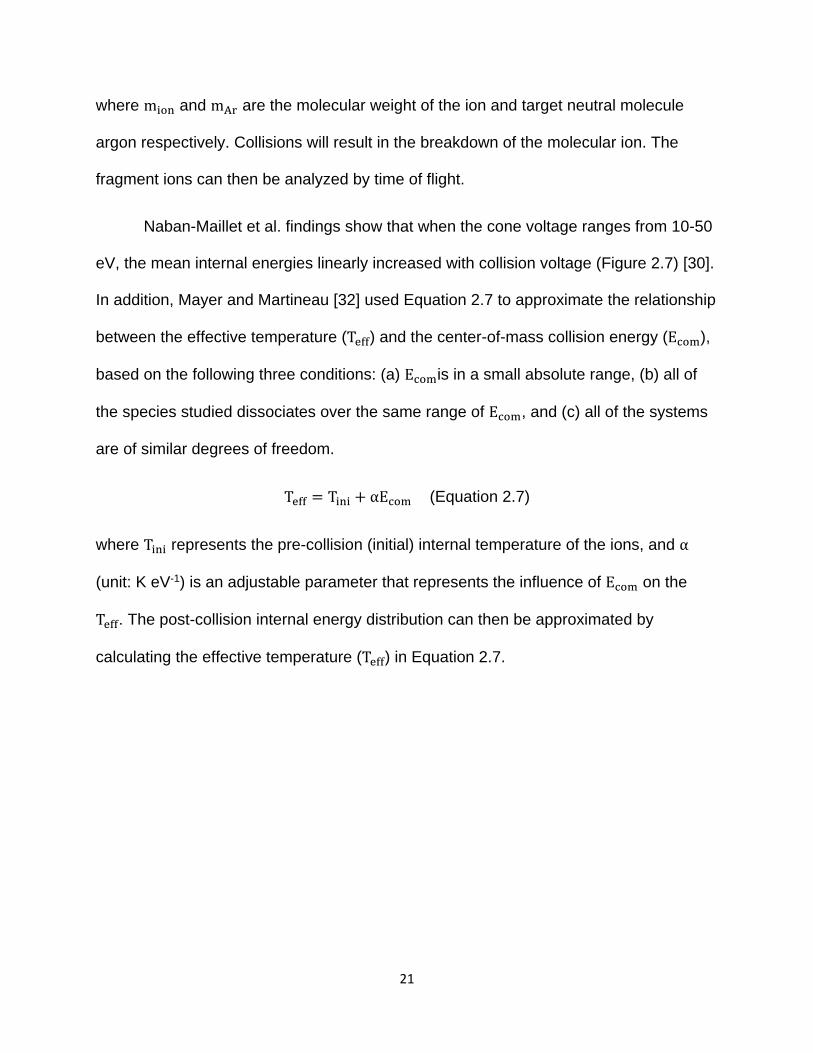
Naban-Maillet et al. findings show that when the cone voltage ranges from 10-50
eV, the mean internal energies linearly increased with collision voltage (Figure 2.7) [30].
In addition, Mayer and Martineau [32] used Equation 2.7 to approximate the relationship
between the effective temperature (Teff) and the center-of-mass collision energy (Ecom),
based on the following three conditions: (a) Ecomis in a small absolute range, (b) all of
the species studied dissociates over the same range of Ecom, and (c) all of the systems
are of similar degrees of freedom.
Teff = Tini + αEcom (Equation 2.7)
where Tini represents the pre-collision (initial) internal temperature of the ions, and α
(unit: K eV-1) is an adjustable parameter that represents the influence of Ecom on the
Teff. The post-collision internal energy distribution can then be approximated by
calculating the effective temperature (Teff) in Equation 2.7.
22
Figure 2.7 Average of mean internal energies of benzylpyridinium ions, ester ions and
protonated leucine enkephalin as a function of the cone voltage in triple quadrupole mass
spectrometer. YGGFL 1 and 2 represent different literature parameters. (Reprinted from
Naban-Maillet et al., 2005 with permission) [30].
2.2.5 In-source-CID
In-source-CID is similar to CID except for the collision location. Molecular ions
are accelerated by a high sample cone voltage in the ion source to gain enough kinetic
energy and collide with neutral molecules in the source (nitrogen in this study). Certain
fragment ions in the source can then be selected by the first quadrupole. In-source-CID
is often used in addition to tandem mass spectrometry to allow for two steps of
fragmentation in a pseudo MS/MS/MS-type of experiment [33].
23
2.2.6 Time of flight mass spectrometry
In this study, time of flight (TOF) mass spectrometry was used as a mass
analyzer in the last part of the Waters Synapt G1 ion mobility/tandem mass
spectrometer. A detailed theory of the TOF analyzer is found in Curt Brunnee’s review
about mass analyzer [34] and Chernushevich et al.’s publication about quadrupole TOF
mass spectrometry [35]. The TOF analyzer separates ions by the time it takes for an ion
to travel a fixed distance. An equation for an ion’s TOF (ttof) can be derived from the
kinetic energy (Ek) of an ion in the drift tube:
Ek =1
2∙ mion ∙ v2 = zU (Equation 2.8)
and the time it takes the ion to travel the effective length Leff of the flight tube:
ttof =Leff
v (Equation 2.9)
Substituting the equation into the kinetic energy equation, the ion’s TOF is given by:
ttof =Leff
√2U√
mion
z (Equation 2.10)
During the analysis, the effective length of the drift tube Leff, and the voltage from the
ion source U are held constant. As a result, time of flight is directly proportional to the
root of mion z⁄ .
In the TOF mass analyzer, the resolution is the observed mass divided by the difference
between two masses that can be separated, mion ∆mion⁄ . Resolution (R) is calculated
by:
24
mion =2Uttof
2
Leff2 ∙ z (Equation 2.11)
R =mion
∆mion=
ttof2
ttof2−(ttof−∆ttof)2 ≈
ttof
2∙∆ttof=
Leff
2(v∙∆ttof) (Equation 2.12)
where mion and ttof are mass ( in Daltons) and flight time of the ion, ∆mion and ∆ttof are
the peak widths measured at the 50% level on the mass and time scales, respectively.
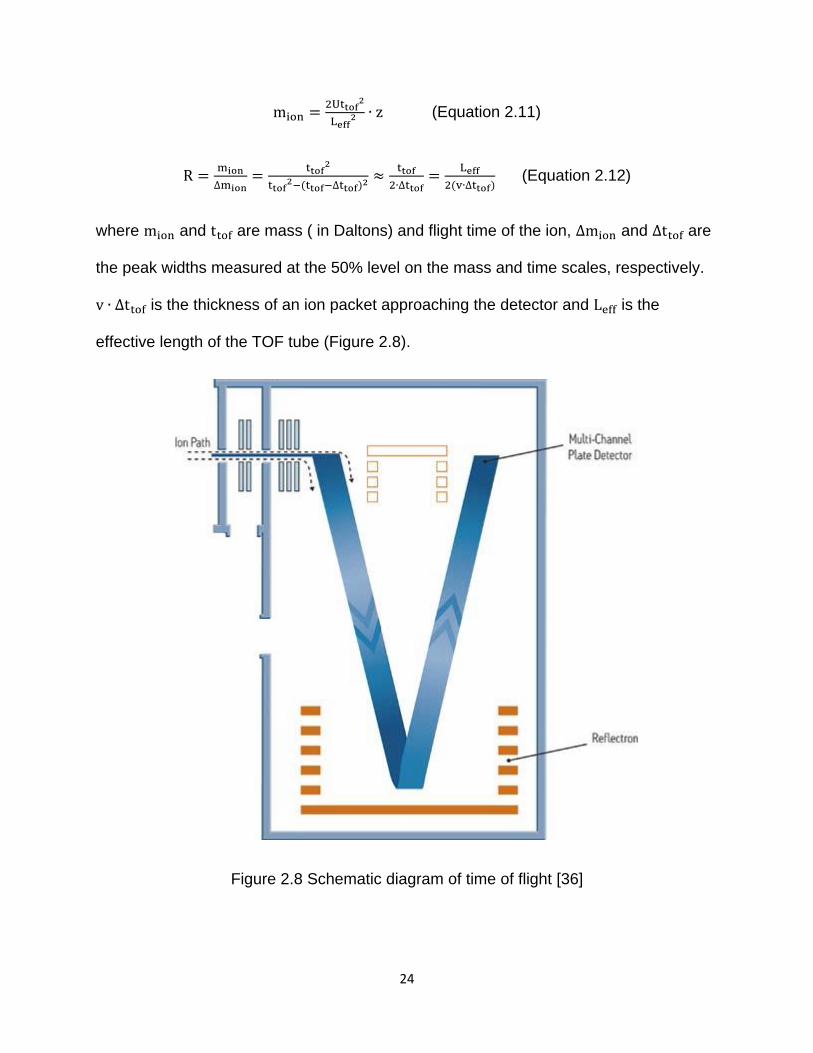
v ∙ ∆ttof is the thickness of an ion packet approaching the detector and Leff is the
effective length of the TOF tube (Figure 2.8).
Figure 2.8 Schematic diagram of time of flight [36]
25
The TOF applied in this study is a reflecting TOF (V-geometry) (Figure 2.8).
However, the Waters Synapt G1 contains a double-reflectron (W, or two Vs), which
increases the resolving power by doubling the effective length (Leff) of the TOF tube if
needed (but not used in this study). The reflectron also provides kinetic energy
focussing of the ion packet.
2.3 Understanding CID mass spectra
To understand CID mass spectra, the CID breakdown diagrams (plots of ion
relative abundance vs centre-of-mass collision energy) are modeled by Rice–
Ramsperger–Kassel–Marcus (RRKM) theory. RRKM theory [37] estimates the
unimolecular dissociation rate constants from a few characteristics of the potential
energy surface. In 1927, Rice and Ramsperger developed a collision theory, named
Theory II, to model the unimolecular gas reaction rate at low pressures by treating a
molecule as a collection of identical harmonic oscillators. Theory II suggests that one
oscillator has only a single degree of freedom, DOF (DOF is the number of variables
required to describe the motion of a particle completely), and the unimolecular
dissociation requires two conditions: a) a minimum total energy E0, and b) some single
DOF to acquire energy of E0 or greater. In 1928, Kassel developed Theory II into Theory
III [38] by proving: it is some particular bond (two DOF), rather than some single DOF,
that acquires energy of E0 or greater for the unimolecular dissociation. To put it simply,
Theory III suggests one oscillator has two DOF, rather than one DOF. Theory III was
named the RRK theory later [37]. From 1951 to 1965, Marcus and others [39-42]
26
developed the RRK theory into the RRKM theory by taking the transition state
theory developed by Eyring [43] into consideration.
There are a few concepts involved in modeling the experimental CID breakdown
curves, including vibrational frequencies, the time-scale of dissociation, the
microcanonical rate constant, k(E), the entropy of activation, the post-collision internal
energy distribution, and the fraction of ions dissociating. Sections 2.3.1 to 2.3.6
introduce the concepts involved in modeling experimental CID data. Section 2.3.7 is the
procedure for fitting breakdown diagrams by two RRKM programs. Details are found in
a publication by Mayer and Martineau [32] and a publication by Baer and Mayer [44].
2.3.1 Obtaining vibrational frequencies of porphyrins.
To apply the RRKM theory, the harmonic vibrational frequencies of all the
porphyrins were calculated by geometry optimizations followed by frequency
calculations at the PM6 theory level using Gaussian 09. All frequencies are listed in
Appendix 6 Table A6.1
The transition state vibrational frequencies were approximated by removing the
last oscillator from the reactant ion in this study, and scaling the first 10 vibrational
frequencies by a common factor. In addition, since the transition state vibrational
frequencies are being adjusted to fit the experimental data, the actual choice of which
oscillator to remove is irrelevant [32].
27
2.3.2 Time-scale of dissociation
In the Waters Synapt instrument, there are two collision cells: a) the trap cell
before the IMS cell, b) the transfer cell after IMS cell. All the collision activities
happened in the transfer cell in this research. The time scale (t) of events in the transfer
cell is the time it takes for the ion to travel through the cell (10 cm) at a certain velocity
(the travelling wave velocity) and arrive at the TOF mass spectrometer [21]:
t =ltransfer
vwave (Equation 2.13)
2.3.3 Microcanonical rate constant
Rice-Ramsperger-Kassel-Marcus (RRKM) calculates rate constants in a unique
way (Figure 2.9), which not only takes into account the number of degrees of freedom
(DOF) but also their different vibrational frequencies
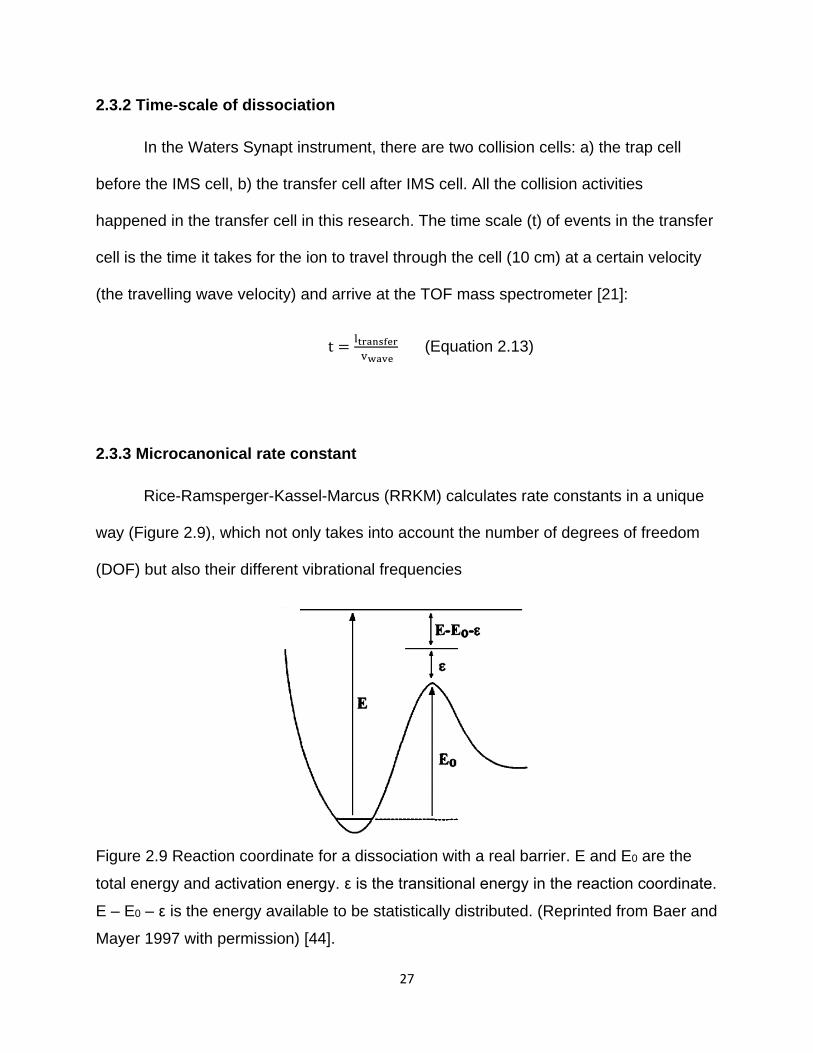
Figure 2.9 Reaction coordinate for a dissociation with a real barrier. E and E0 are the
total energy and activation energy. ε is the transitional energy in the reaction coordinate.
E – E0 – ε is the energy available to be statistically distributed. (Reprinted from Baer and
Mayer 1997 with permission) [44].
28
The rate constant is calculated using this equation:
k(E) =σNǂ(E−E0)
hρ(E) (Equation 2.14)
where σ is the reaction degeneracy or the symmetry of the reactant structure, Nǂ(E −
E0) is the sum-of-states for the transition states at an internal energy from 0 to (E − E0),
h is Planck’s constant, and ρ(E) is the vibrational density of states of the parent ion at
an internal energy E. The sum of states represents the number of ways to pass through
the transition state that has a total energy of (E − E0). The density of states represents
the number of ways to get lost in the molecular ion phase space at an internal energy E.
The transition state sum-of-states and reactant densities of states are calculated from
the vibrational frequencies of the parent ion and the transitional state structure obtained
from section 2.3.1, by using the direct count algorithm of Beyer and Swinehart [45].
2.3.4 Entropy of activation ǂS
In thermodynamics, entropy (S) is a measure of the disorder of a thermodynamic
system. Thus, the entropy ǂS of activation has a negative value if the transition states
are more ordered than the reactant ions, which usually means a rearrangement
process. Conversely, ǂS has a positive value if the transition states are less ordered
than the reactant ions. ǂS can be calculated with the vibrational frequencies and the
transition state:
ǂS = kB lnQ‡
Q+
U‡−U
T= kB ln
∏ qi‡
∏ qi+
U‡−U
T (Equation 2.15)
29
where the average internal energy U and U‡ can be calculated from the usual formulas
by using the vibrational partition functions. Q is the total partition functions qi (Equation
2.16). T is a specified absolute temperature (300 K in this study) for the report of ǂS
values.
qi =1
1−e−h∙vi (kB∙T)⁄ (Equation 2.16)
where h is Planck’s constant, vi is the frequency of oscillator i, kB is the Boltzmann
constant.
2.3.5 The post-collision internal energy distribution
The post-collision internal energy distribution is a function of the center-of-mass
collision energy, Ecom. As mentioned in section 2.2.4, Ecom can be converted from the
laboratory kinetic energy Elab by Equation 2.6. The post-collision internal energy
distribution can be approximated by calculating the effective temperature (Teff) by the
Equation 2.7. The internal energy distribution after collision P(E, Ecom) can then be
calculated:
P(E, Ecom) =ρ(E)e−E (R∙Teff)⁄
Q(Ecom) (Equation 2.17)
where ρ(E) is density of states of the ion at a certain effective temperature Teff, and
Q(Ecom) is the total vibrational partition function at the effective temperature.
30
2.3.6 The fraction of ions dissociating
The fraction of ions dissociating can be calculated as a function of internal
energy by:
F(E) = 1 − e−k(E)t (Equation 2.18)
where t is the maximum time of the observation, i.e., the time required for the ion to
move from the collision region to the analyzer region of the mass spectrometer. The
total observation is then given by multiplying F(E) and P(E, Ecom), and integrating over
the internal energy:
Fi(E) = ∫ F(E) × P(E, Ecom) ×∞
0
ki(E)
k(E)× dE (Equation 2.19)
2.3.7 Theoretical breakdown diagram fitting
A complete theoretical breakdown diagram is obtained automatically by running
two FORTRAN programs written by Dr. Paul Mayer, namely “dcms.exe” and
“quattro.exe”. The theoretical breakdown diagram can be changed by altering the
following four parameters: i) the activation energy E0, ii) the first ten vibrational
frequencies of the transition state (which alters ǂS), iii) initial temperature Tini, iv) α.
These four parameters are changed manually until the best-fitted theoretical breakdown
diagram that matches the experimental breakdown diagram is found. The following two
paragraphs explain how these two FORTRAN programs work:
a) “dcms.exe” is responsible for calculating: (a) microcanonical rate constant k(E),
which can be adjusted by altering the activation energy E0 and the first ten
31
vibrational frequencies of the transition; (b) the entropy of activation ǂS, which
can be adjusted by altering the first ten vibrational frequencies of the transition.
b) “quattro.exe” is responsible for calculating: (a) the pre-collision reactant ion
internal energy, which can be adjusted by altering the initial temperature Tini; (b)
the post-collision internal energy distribution, which can be adjusted by changing
Tini and α; and (c) the fraction of ions dissociating, which will be the theoretical
breakdown diagram.
2.4 Molecular simulation
While RRKM modeling of the CID breakdown curves provides information on the
activation energies and entropies of each process, this data must be interpreted with
respect to the mechanism of the reactions, something that often requires computational
chemistry to elucidate.
There are many reaction pathways from a reactant to a product. However, the
most likely one is that which proceeds with the minimum energy via the saddle point
(transition structure) (Figure 2.10).
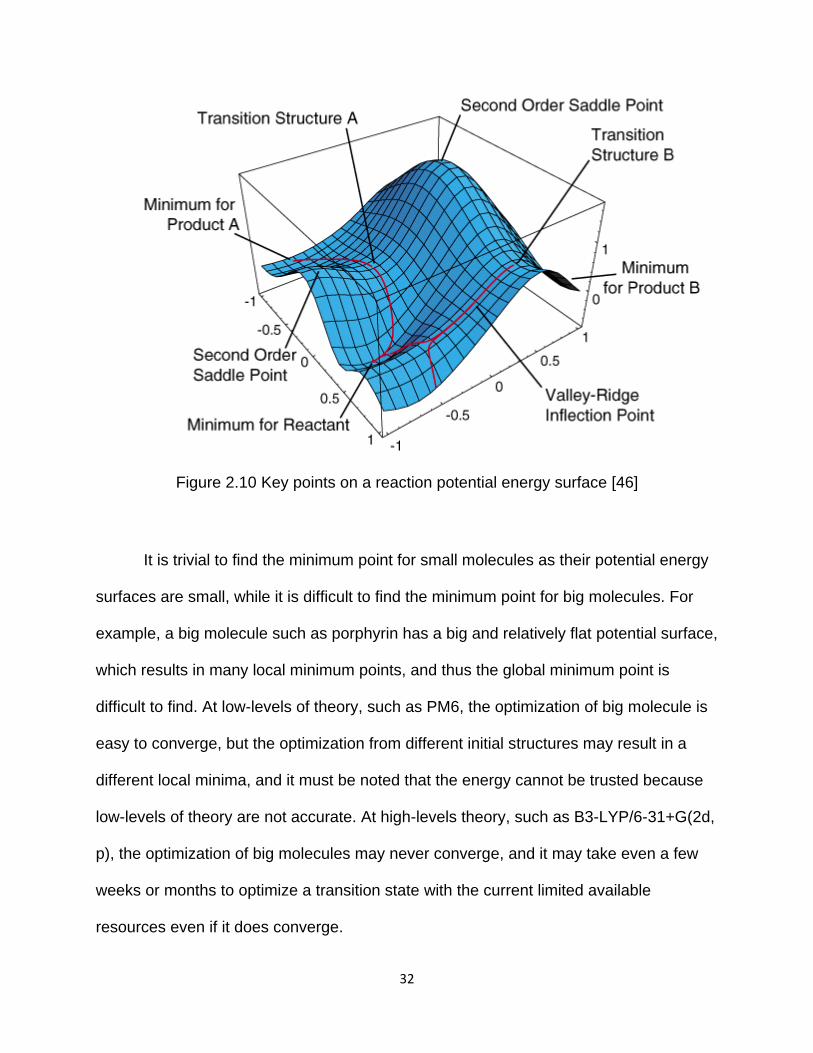
32
Figure 2.10 Key points on a reaction potential energy surface [46]
It is trivial to find the minimum point for small molecules as their potential energy
surfaces are small, while it is difficult to find the minimum point for big molecules. For
example, a big molecule such as porphyrin has a big and relatively flat potential surface,
which results in many local minimum points, and thus the global minimum point is
difficult to find. At low-levels of theory, such as PM6, the optimization of big molecule is
easy to converge, but the optimization from different initial structures may result in a
different local minima, and it must be noted that the energy cannot be trusted because
low-levels of theory are not accurate. At high-levels theory, such as B3-LYP/6-31+G(2d,
p), the optimization of big molecules may never converge, and it may take even a few
weeks or months to optimize a transition state with the current limited available
resources even if it does converge.
33
As a result, large molecules are often not feasible to calculate with high level
quantum computational chemistry methods. A practical approach to rectify this problem
is to perform a thorough molecular simulation of the active functional groups of the big
molecule on a high-level theory, and then do the necessary calculation for the big
molecule at a lower level theory.
2.4.1 Density functional theory
Density functional theory (DFT) is a popular widely used method in quantum
chemistry for the calculation of molecular structures and energies. DFT is based on the
Hoheberg-Kohn (KH) theorems, and became practical after Kohn and Sham devised
the Kohn-Sham (KS) equation [47], for which Kohn won the Nobel Prize in Chemistry in
1998. The details about DFT are found in Gos’s [48] and Yin’s doctoral thesis [49]. The
main idea of DFT is to describe energy of an atomic system based on the ground state
electron density, instead of the electron wavefunction, through the use of functions of
the electron density. The ground state electron density depends on only three spatial
coordinates, while the electron wavefunction depends on 3N (N electrons) spatial
coordinates. The 3N spatial coordinates are rapidly becoming more computationally
demanding as the atomic system gets larger. However, the calculation of three spatial
coordinates is much cheaper, which can even be handled by a personal laptop.
Figure 2.11 represents the iteration scheme of DFT. The DFT optimization of
molecular structure starts with an initial electron density guess, followed by the
calculation of the effective KS potential veff(r). The next step is to solve the KS equation
with single-particle eigenvalues εi and KS orbital ψi. Then a new electron density ρ(r) is
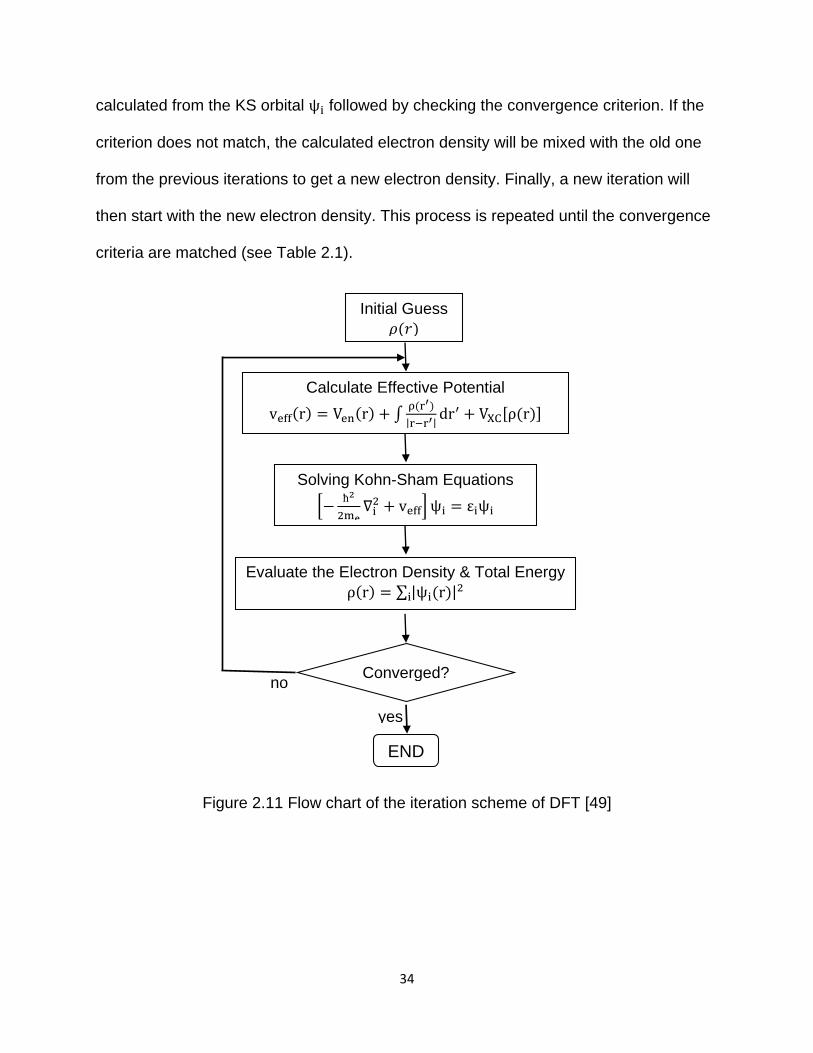
34
calculated from the KS orbital ψi followed by checking the convergence criterion. If the
criterion does not match, the calculated electron density will be mixed with the old one
from the previous iterations to get a new electron density. Finally, a new iteration will
then start with the new electron density. This process is repeated until the convergence
criteria are matched (see Table 2.1).
Figure 2.11 Flow chart of the iteration scheme of DFT [49]
Converged?
Evaluate the Electron Density & Total Energy
ρ(r) = ∑ |ψi(r)|2i
Solving Kohn-Sham Equations
[−ħ2
2me∇i
2 + veff] ψi = εiψi
Calculate Effective Potential
veff(r) = Ven(r) + ∫ρ(r′)
|r−r′|dr′ + VXC[ρ(r)]
Initial Guess
𝜌(𝑟)
no
yes
END
35
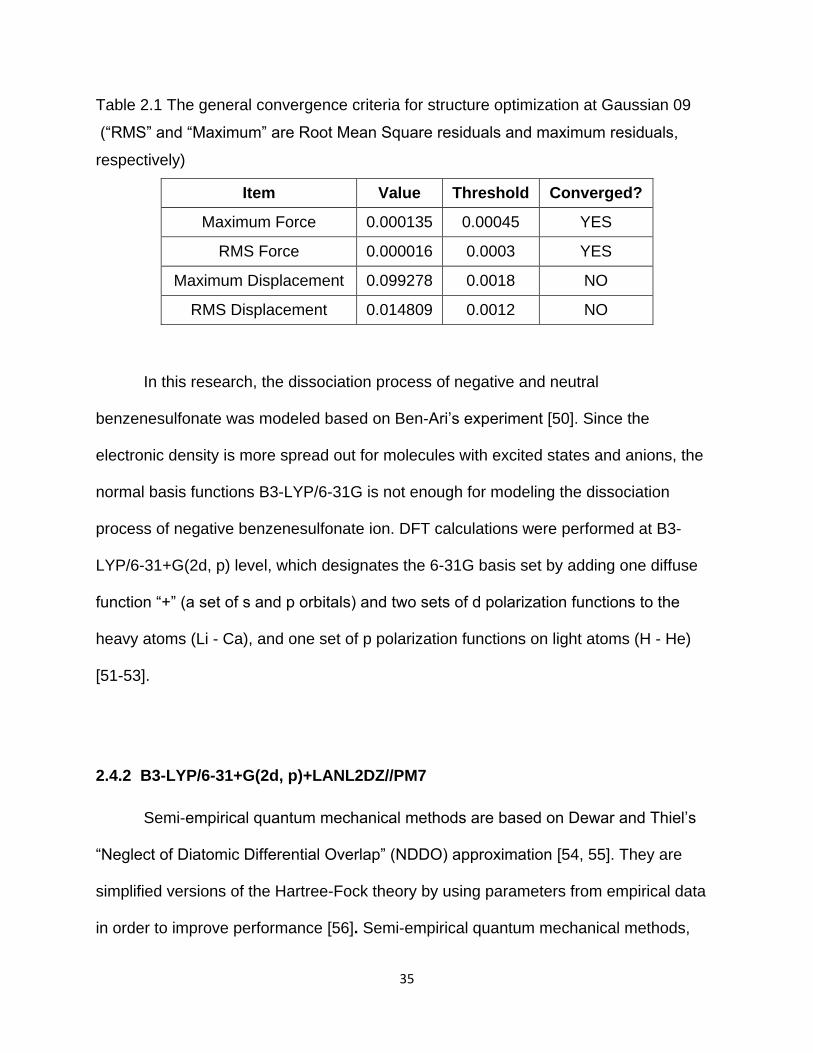
Table 2.1 The general convergence criteria for structure optimization at Gaussian 09
(“RMS” and “Maximum” are Root Mean Square residuals and maximum residuals,
respectively)
Item Value Threshold Converged?
Maximum Force 0.000135 0.00045 YES
RMS Force 0.000016 0.0003 YES
Maximum Displacement 0.099278 0.0018 NO
RMS Displacement 0.014809 0.0012 NO
In this research, the dissociation process of negative and neutral
benzenesulfonate was modeled based on Ben-Ari’s experiment [50]. Since the
electronic density is more spread out for molecules with excited states and anions, the
normal basis functions B3-LYP/6-31G is not enough for modeling the dissociation
process of negative benzenesulfonate ion. DFT calculations were performed at B3-
LYP/6-31+G(2d, p) level, which designates the 6-31G basis set by adding one diffuse
function “+” (a set of s and p orbitals) and two sets of d polarization functions to the
heavy atoms (Li - Ca), and one set of p polarization functions on light atoms (H - He)
[51-53].
2.4.2 B3-LYP/6-31+G(2d, p)+LANL2DZ//PM7
Semi-empirical quantum mechanical methods are based on Dewar and Thiel’s
“Neglect of Diatomic Differential Overlap” (NDDO) approximation [54, 55]. They are
simplified versions of the Hartree-Fock theory by using parameters from empirical data
in order to improve performance [56]. Semi-empirical quantum mechanical methods,
36
which draws a compromise between accuracy and economy, can be applied to systems
with thousands of atoms [57]. The first generation semi-empirical method MNDO [58,
59], firstly appeared in 1977. It initially only had parameters available for C, H, N, and O.
More parameters for other atoms and more semi-empirical methods were developed
shortly after, including AM1 [60] in 1985, PM3 [61] in 1989, MNDO-d [62] in 1996, RM1
[63] in 2006, and PM6 [64] in 2007.
In 2012, a new semi-empirical method, PM7 [65], was released by Dr. Jimmy
Stewart with his updated program “MOPAC2012” [66]. PM7 is an improved version of
PM6. All parameters have been re-optimized. PM7 also removed a few errors in the
NDDO theory that affected large systems. According to Stewart (the author of AM1,
PM3, RM1, PM6 and PM7), PM7 reduces the average errors in organic compounds by
around 10%. PM7 was proven to be the most robust tool among the semi-empirical
methods.
However, semi-empirical is still a low level theory in quantum chemistry. It is fast
but not as accurate when compared with higher level theories, such as DFT. In this
research, there are plenty of calculations for metalloporphyrin, which is such a big
system that it would take 7.5 days to run a single calculation at B3-LYP/6-31G(d, p)
level if the starting structure is the optimal one by chance. A large number of
calculations on metalloporphyrin are almost impossible with the current limited available
resources at a DFT level of theory, especially when most starting structures never
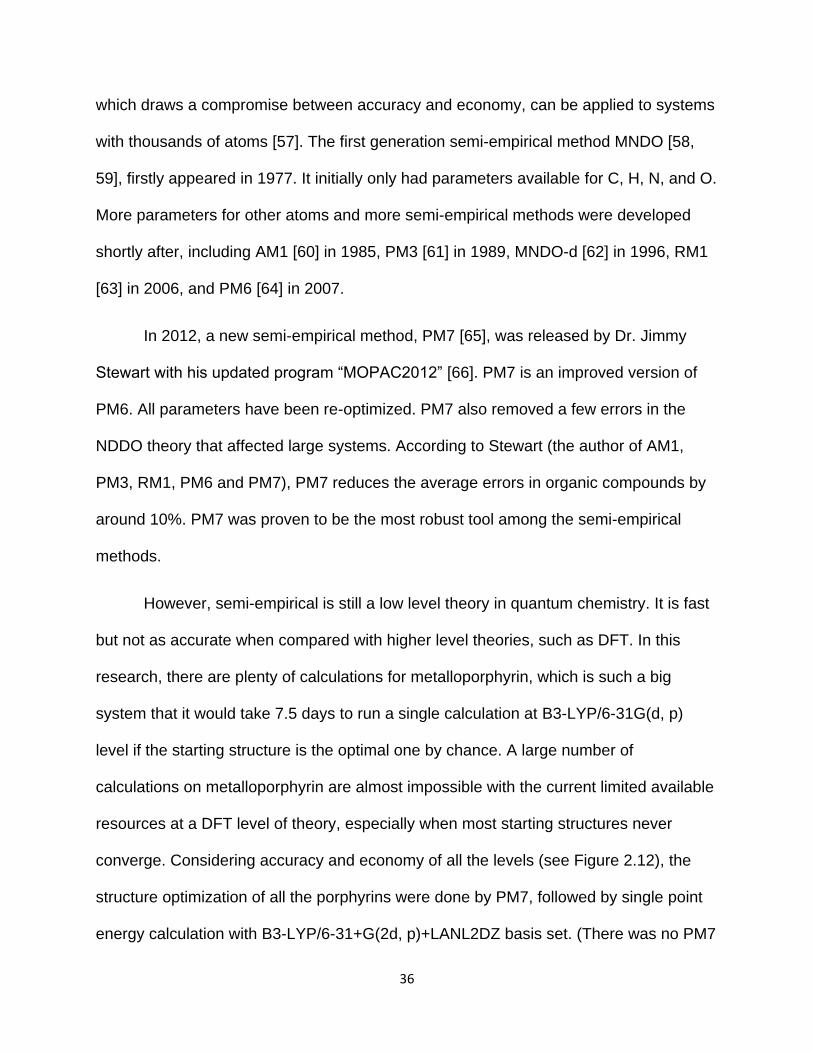
converge. Considering accuracy and economy of all the levels (see Figure 2.12), the
structure optimization of all the porphyrins were done by PM7, followed by single point
energy calculation with B3-LYP/6-31+G(2d, p)+LANL2DZ basis set. (There was no PM7
37
when Figure 2.12 was published in the book “Exploring chemistry with electronic
structure methods” by Gaussian Inc. in 1996)
The B3-LYP/6-31+G(2d, p)+LANL2DZ basis set is a combination of the 6-
31+G(2d, p) basis set and the LANL2DZ effective core basis set. Specifically the atoms
H - Ar are described with the 6-31+G(2d, p) basis set, while heavier atoms are modeled
using the LANL2DZ basis set [51, 67]. The 6-31+G(2d, p) basis set was chosen in order
to keep the same level of theory with the calculation of benzenesulfonate.
38
Figure 2.12 Relative accuracies of different level of theories (Reprinted from Foresman
and Frisch, 1996 with permission from Gaussian Inc.) [68]. MAD is the mean absolute
39
deviation from experiments and StdDec is the standard deviation, and the largest positive
and negative deviations from experiment for each chemistry model.
2.5 References
[1] Smith RM. Understanding mass spectra: a basic approach. 2nd ed. Hoboken,
N.J.: Wiley Interscience; 2004.
[2] Lavagnini I. Quantitative applications of mass spectrometry. Chichester, West
Sussex ; Hoboken, NJ: Wiley; 2006.
[3] Hoffmann Ed, Stroobant V. Mass spectrometry: principles and applications. 3rd
ed. Chichester, West Sussex, England ; Hoboken, NJ: J. Wiley; 2007.
[4] McLafferty FW, Bente PF, Kornfeld R, Tsai SC, Howe I. Collisional activation
spectra of organic ions. Journal of the American Chemical Society. 1973;95(7):2120-9.
[5] Syka JEP, Coon JJ, Schroeder MJ, Shabanowitz J, Hunt DF. Peptide and protein
sequence analysis by electron transfer dissociation mass spectrometry. Proceedings of
the National Academy of Sciences of the United States of America. 2004;101(26):9528-
33.
[6] Zubarev RA, Kelleher NL, McLafferty FW. Electron capture dissociation of
multiply charged protein cations. A nonergodic process. Journal of the American
Chemical Society. 1998;120(13):3265-6.
[7] Little DP, Speir JP, Senko MW, O'Connor PB, McLafferty FW. Infrared
multiphoton dissociation of large multiply charged ions for biomolecule sequencing.
Analytical Chemistry. 1994;66(18):2809-15.
[8] Dunbar RC. BIRD (blackbody infrared radiative dissociation): Evolution,
principles, and applications. Mass Spectrometry Reviews. 2004;23(2):127-58.
[9] Jacoby M. Doubling up on mass analysis. Chemical & Engineering News.
2010;88(13):35-7.
[10] Tabet JC, Rebuffat S. Nobel Prize 2002 for chemistry: mass spectrometry and
nuclear magnetic resonance. M S-Medecine Sciences. 2003;19(8-9):865-72.
[11] Cech N, Enke C. Practical implications of some recent studies in electrospray
ionization fundamentals. Mass Spectrometry Reviews. 2001;20(6):362-87.
40
[12] Iribarne JV, Thomson BA. Evaporation of small ions from charged droplets.
Journal of Chemical Physics. 1976;64(6):2287-94.
[13] Nguyen S, Fenn J. Gas-phase ions of solute species from charged droplets of
solutions. Proceedings of the National Academy of Sciences of the United States of
America. 2007;104(4):1111-7.
[14] Dole M, Mack LL, Hines RL. Molecular beams of macroions. Journal of Chemical
Physics. 1968;49(5):2240-9.
[15] Touboul D, Jecklin MC, Zenobi R. Ion internal energy distributions validate the
charge residue model for small molecule ion formation by spray methods. Rapid
Communications in Mass Spectrometry. 2008;22(7):1062-8.
[16] Fenn J. Electrospray wings for molecular elephants (Nobel lecture). Angewandte
Chemie-International Edition. 2003;42(33):3871-94.
[17] March RE. An introduction to quadrupole ion trap mass spectrometry. Journal of
Mass Spectrometry. 1997;32(4):351-69.
[18] Ramon F-R. The techniques of plasma-mass (ICP-MS). 2004 [cited 2015 April
16th]; Available from: https://www.uam.es/personal_pas/txrf/icpms.html
[19] Kanu AB, Dwivedi P, Tam M, Matz L, Hill HH. Ion mobility-mass spectrometry.
Journal of Mass Spectrometry. 2008;43(1):1-22.
[20] Giles K, Pringle SD, Worthington KR, Little D, Wildgoose JL, Bateman RH.
Applications of a travelling wave-based radio-frequencyonly stacked ring ion guide.
Rapid Communications in Mass Spectrometry. 2004;18(20):2401-14.
[21] Renaud JB. Studying the dissociation behaviour of ionized non-covalent
complexes with a cohesive energetic and structure approach. University of Ottawa,
Doctoral thesis, 2014.
[22] Wysocki V. SID coupled with Ion Mobility. 2015 [cited 2015 April 16th]; Available
from: https://research.cbc.osu.edu/wysocki.11/group-home/projects/sid/sid_im/
[23] Pringle SD, Giles K, Wildgoose JL, Williams JP, Slade SE, Thalassinos K, et al.
An investigation of the mobility separation of some peptide and protein ions using a new
hybrid quadrupole/travelling wave IMS/oa-ToF instrument. International Journal of Mass
Spectrometry. 2007;261(1):1-12.
41
[24] Jennings KR. Collision-induced decompositions of aromatic molecular ions.
International Journal of Mass Spectrometry and Ion Physics. 1968;1:227-35.
[25] Haddon WF, McLafferty FW. Metastable ion characteristics. VII. collision-induced
metastables. Journal of the American Chemical Society. 1968;90(17):4745-6.
[26] Mayer PM, Poon C. The mechanisms of collisional activation of ions in mass
spectrometry. Mass Spectrometry Reviews. 2009;28(4):608-39.
[27] Chen YL, Campbell JM, Collings BA, Konermann L, Douglas DJ. Stability of a
highly charged noncovalent complex in the gas phase: Holomyoglobin. Rapid
Communications in Mass Spectrometry. 1998;12(15):1003-10.
[28] Meroueh O, Hase WL. Collisional activation of small peptides. Journal of
Physical Chemistry A. 1999;103(20):3981-90.
[29] Nesatyy VJ, Laskin J. Dissociation of noncovalent protein complexes by triple
quadrupole tandem mass spectrometry: comparison of Monte Carlo simulation and
experiment. International Journal of Mass Spectrometry. 2002;221(3):245-62.
[30] Naban-Maillet J, Lesage D, Bossee A, Gimbert Y, Sztaray J, Vekey K, et al.
Internal energy distribution in electrospray ionization. Journal of Mass Spectrometry.
2005;40(1):1-8.
[31] Wells J, McLuckey S, Burlingame A. Collision-induced dissociation (CID) of
peptides and proteins. Biological Mass Spectrometry. 2005;402:148-85.
[32] Mayer PM, Martineau E. Gas-phase binding energies for non-covalent A beta-40
peptide/small molecule complexes from CID mass spectrometry and RRKM theory.
Physical Chemistry Chemical Physics. 2011;13(11):5178-86.
[33] Korner R, Wilm M, Morand K, Schubert M, Mann M. Nano electrospray combined
with a quadrupole ion trap for the analysis of peptides and protein digests. Journal of
the American Society For Mass Spectrometry. 1996;7(2):150-6.
[34] Brunnee C. The ideal mass analyzer - fact or fiction. International Journal of
Mass Spectrometry and Ion Processes. 1987;76(2):125-237.
[35] Chernushevich IV, Loboda AV, Thomson BA. An introduction to quadrupole-time-
of-flight mass spectrometry. Journal of Mass Spectrometry. 2001;36(8):849-65.
42
[36] Waters. What types of instruments are used? 2015 [cited 2015 April 19th];
Available from: http://www.waters.com/waters/en_US/What-Types-of-Instruments-Are-
Used%3F/nav.htm?cid=10090937
[37] Green NJB. Unimolecular kinetics. Part 1, The reaction step. 1st ed. Amsterdam ;
Boston: Elsevier; 2003.
[38] Kassel LS. Studies in homogeneous gas reactions I. Journal of Physical
Chemistry. 1928;32(2):225-42.
[39] Marcus RA, Rice OK. The kinetics of the recombination of methyl radicals and
iodine atoms. Journal of Physical and Colloid Chemistry. 1951;55(6):894-908.
[40] Marcus RA. Unimolecular dissociations and free radical recombination reactions.
Journal of Chemical Physics. 1952;20(3):359-64.
[41] Wieder GM, Marcus RA. Dissociation and isomerization of vibrationally excited
species. II. unimolecular reaction rate theory and its application. Journal of Chemical
Physics. 1962;37(8):1835-52.
[42] Marcus RA. Dissociation and isomerization of vibrationally excited species. III.
Journal of Chemical Physics. 1965;43(8):2658-61.
[43] Eyring H. The activated complex in chemical reactions. Journal of Chemical
Physics. 1935;3(2):107-15.
[44] Baer T, Mayer PM. Statistical Rice-Ramsperger-Kassel-Marcus quasiequilibrium
theory calculations in mass spectrometry. Journal of the American Society for Mass
Spectrometry. 1997;8(2):103-15.
[45] Beyer T, Swinehart DF. Number of multiply-restricted partitions. Communications
of the Acm. 1973;16(6):379.
[46] Schlegel HB. Potential energy surfaces. 2008 [cited 2015 May 24th]; Available
from: http://www.chem.wayne.edu/~hbs/chm6440/PES.html
[47] Leeuwen RV. Kohn-Sham potentials in density functional theory; 1994.
[48] Gos W. Hole trapping and the negative bias temperature instability. Technical
University of Vienna, Doctoral thesis, 2011.
[49] Yin Z. Microscopic mechanisms of magnetism and superconductivity studied
from first principle calculations. University Of Califonia Davis, Doctoral dissertation,
2005.
43
[50] Ben-Ari J, Etinger A, Weisz A, Mandelbaum A. Hydrogen-shift isomerism: mass
spectrometry of isomeric benzenesulfonate and 2-, 3- and 4-dehydrobenzenesulfonic
acid anions in the gas phase. Journal of Mass Spectrometry. 2005;40(8):1064-71.
[51] Gaussian 09 user's reference: basis sets. 2014 [cited 2015 April 16th ];
Available from: http://www.gaussian.com/g_tech/g_ur/m_basis_sets.htm
[52] Feller D. The role of databases in support of computational chemistry
calculations. Journal of Computational Chemistry. 1996;17(13):1571-86.
[53] Schuchardt KL, Didier BT, Elsethagen T, Sun LS, Gurumoorthi V, Chase J, et al.
Basis set exchange: A community database for computational sciences. Journal of
Chemical Information and Modeling. 2007;47(3):1045-52.
[54] Pople JA, Santry DP, Segal GA. Approximate self-consistent molecular orbital
theory. I. invariant procedures. Journal of Chemical Physics. 1965;43(10):S129-S35.
[55] Dewar MJS, Thiel W. Semiempirical model for 2-center repulsion integrals in
NDDO approximation. Theoretica Chimica Acta. 1977;46(2):89-104.
[56] Semiempirical Methods. 2005 [cited 2015 May 17th]; Available from:
http://www.cup.uni-muenchen.de/ch/compchem/energy/semi1.html
[57] Hostas J, Rezac J, Hobza P. On the performance of the semiempirical quantum
mechanical PM6 and PM7 methods for noncovalent interactions. Chemical Physics
Letters. 2013;568:161-6.
[58] Dewar MJS, Thiel W. Ground-states of molecules. 38. MNDO method -
approximations and parameters. Journal of the American Chemical Society.
1977;99(15):4899-907.
[59] Dewar MJS, Thiel W. Ground-states of molecules. 39. MNDO results for
molecules containing hydrogen, carbon, nitrogen, and oxygen. Journal of the American
Chemical Society. 1977;99(15):4907-17.
[60] Dewar MJS, Zoebisch EG, Healy EF, Stewart JJP. The development and use of
quantum mechanical molecular models. 76. AM1 - a new general purpose quantum-
mechanical molecular mode. Journal of the American Chemical Society.
1985;107(13):3902-9.
[61] Stewart JJP. Optimization of parameters for semiempirical methods. 1. Method.
Journal of Computational Chemistry. 1989;10(2):209-20.
44
[62] Thiel W, Voityuk AA. Extension of MNDO to d orbitals: Parameters and results
for the second-row elements and for the zinc group. Journal of Physical Chemistry.
1996;100(2):616-26.
[63] Rocha GB, Freire RO, Simas AM, Stewart JJP. RM1: A reparameterization of
AM1 for H, C, N, O, P, S, F, Cl, Br, and I. Journal of Computational Chemistry.
2006;27(10):1101-11.
[64] Stewart JJP. Optimization of parameters for semiempirical methods V:
Modification of NDDO approximations and application to 70 elements. Journal of
Molecular Modeling. 2007;13(12):1173-213.
[65] Stewart JJP. Optimization of parameters for semiempirical methods VI: more
modifications to the NDDO approximations and re-optimization of parameters. Journal
of Molecular Modeling. 2013;19(1):1-32.
[66] Stewart JJP. Stewart Computational Chemistry - MOPAC Home Page. 2015
[cited 2015 May 5th]; Available from: http://OpenMOPAC.net
[67] Klunzinger P. Basis Set FAQ. 2006 [cited 2015 May 7th]; Available from:
https://www.wavefun.com/support/sp_compfaq/Basis_Set_FAQ.html
[68] Foresman JB, Frisch A, Gaussian Inc. Exploring chemistry with electronic
structure methods. 2nd ed. Pittsburgh, PA: Gaussian, Inc.; 1996.
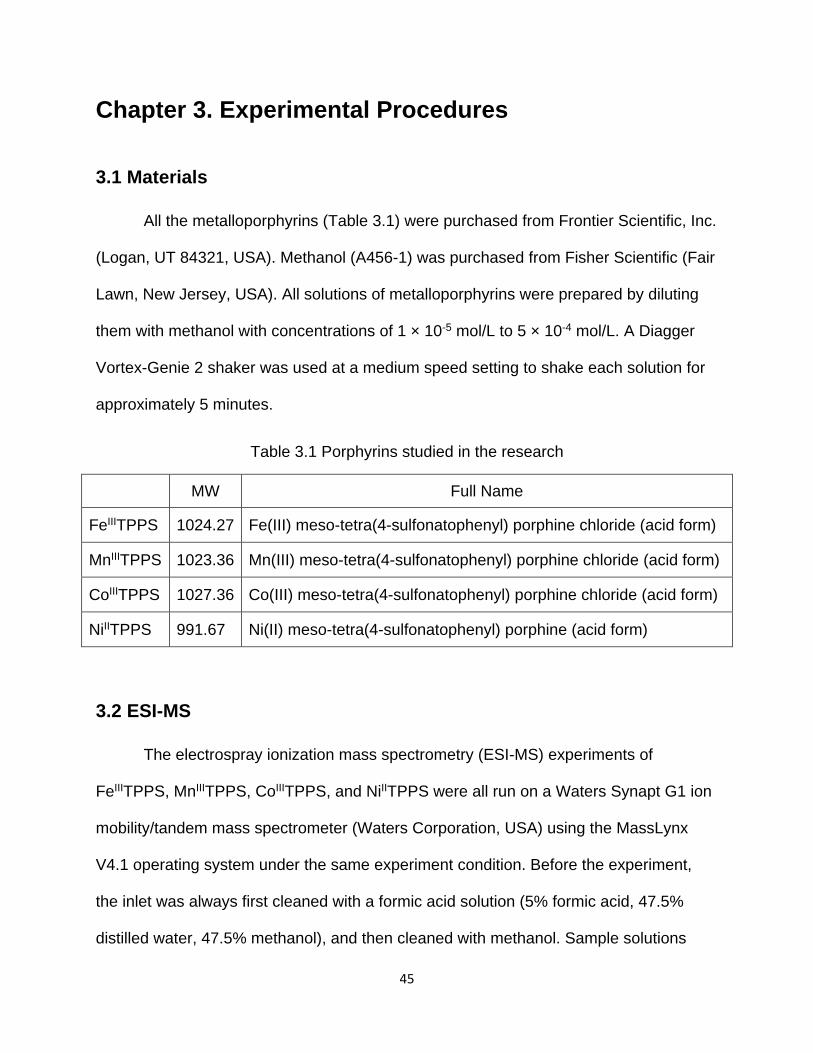
45
Chapter 3. Experimental Procedures
3.1 Materials
All the metalloporphyrins (Table 3.1) were purchased from Frontier Scientific, Inc.
(Logan, UT 84321, USA). Methanol (A456-1) was purchased from Fisher Scientific (Fair
Lawn, New Jersey, USA). All solutions of metalloporphyrins were prepared by diluting
them with methanol with concentrations of 1 × 10⁻⁵ mol/L to 5 × 10⁻⁴ mol/L. A Diagger
Vortex-Genie 2 shaker was used at a medium speed setting to shake each solution for
approximately 5 minutes.
Table 3.1 Porphyrins studied in the research
MW Full Name
FeIIITPPS 1024.27 Fe(III) meso-tetra(4-sulfonatophenyl) porphine chloride (acid form)
MnIIITPPS 1023.36 Mn(III) meso-tetra(4-sulfonatophenyl) porphine chloride (acid form)
CoIIITPPS 1027.36 Co(III) meso-tetra(4-sulfonatophenyl) porphine chloride (acid form)
NiIITPPS 991.67 Ni(II) meso-tetra(4-sulfonatophenyl) porphine (acid form)
3.2 ESI-MS
The electrospray ionization mass spectrometry (ESI-MS) experiments of
FeIIITPPS, MnIIITPPS, CoIIITPPS, and NiIITPPS were all run on a Waters Synapt G1 ion
mobility/tandem mass spectrometer (Waters Corporation, USA) using the MassLynx
V4.1 operating system under the same experiment condition. Before the experiment,
the inlet was always first cleaned with a formic acid solution (5% formic acid, 47.5%
distilled water, 47.5% methanol), and then cleaned with methanol. Sample solutions
46
were introduced via an automatic syringe pump at a flow rate of 20-40 μL∙min-1 in
negative ionization mode. The capillary, cone and extractor voltage were set at 2.50 kV,
34 V and 4 V, respectively. Source block temperature and desolvation temperature
were set to 100 °C and 200 °C to control the desolvation of the porphryins. The
desolvation gas flow was set at 176 L/Hr, and the cone gas flow was set at 40 L/Hr to
help reduce adduct ions (dimers and trimers), and to keep the sample cone clean. The
LM and HM resolution quadruple were both held constant at 10 in the MassLynx
software (unit mass resolution) to resolve the different m/z values. The multiplier was
held constant at 650. The mass-to-charge ratio range was set from 50 to 1000.
3.3 ESI-MS/MS
A Waters Synapt G1 ion mobility/tandem mass spectrometer (Waters
Corporation, USA) was used to carry out the electrospray ionization tandem mass
spectrometry (ESI-MS/MS) in negative ionization mode. The ion mobility spectrometry
(IMS) was on or off. All the CID experiments were run in the transfer cell. There were
seven MS/MS experiments in total for this study:
a) The iron porphyrin with a -2 charge, [FeIITPPS+2H]2-, was selected at m/z 493.0,
and the collision energies for CID ranged from 4 V to 62 V. The IMS was on
because the ESI-MS experiment demonstrated that there were both monomer
and dimer ions for the iron porphyrin at m/z 493.0. The IMS was on to separate
monomers from dimers.
47
b) The iron porphyrin with a -3 charge, [FeIITPPS+H]3-, was selected at m/z 328.3,
with the IMS off, and the collision energies for CID ranged from 4 V to 23 V. The
IMS was off because the ESI-MS experiment demonstrated that there were only
monomer ions for the iron porphyrin at m/z 328.3. Prior to that, approximately
20% of [FeIITPPS+H]3- became fragment ions in the IMS when they collided with
the helium buffer gas.
c) The manganese porphyrin with a -2 charge, [MnIIITPPS+H]2-, was selected at m/z
492.0, and the collision energies for CID ranged from 4 V to 50 V. The IMS was
on to separate monomers from dimers.
d) The manganese porphyrin with a -3 charge, [MnIIITPPS]3-, was selected at m/z
327.6, with the IMS on, and the collision energies for CID ranged from 4 V to 42
V. The IMS was on to keep the experimental setting identical to [MnIIITPPS+H]2-,
even though there were only monomers at m/z 327.6.
e) The cobalt porphyrin with a -3 charge, [CoIIITPPS]3-, was selected at m/z 329.0.
The collision energies for CID ranged from 4 V to 30 V when the IMS was on,
and from 4 V to 20 V when the IMS was off. The ESI-MS experiment showed
there were only monomers for the cobalt porphyrin ions at m/z 329.0. The IMS
was on and off to determine the influence of IMS on the fragmentation process.
f) The nickel porphyrin with a -3 charge, [NiIITPPS+H]3-, was selected at m/z 329.0.
The collision energies for CID ranged from 4 V to 23 V. The IMS was off
because ESI-MS experiments showed there were only monomers for nickel
porphyrin ions at m/z 329.0.
Detail settings for each experiment are included in Table A6.2 in Appendix 6.
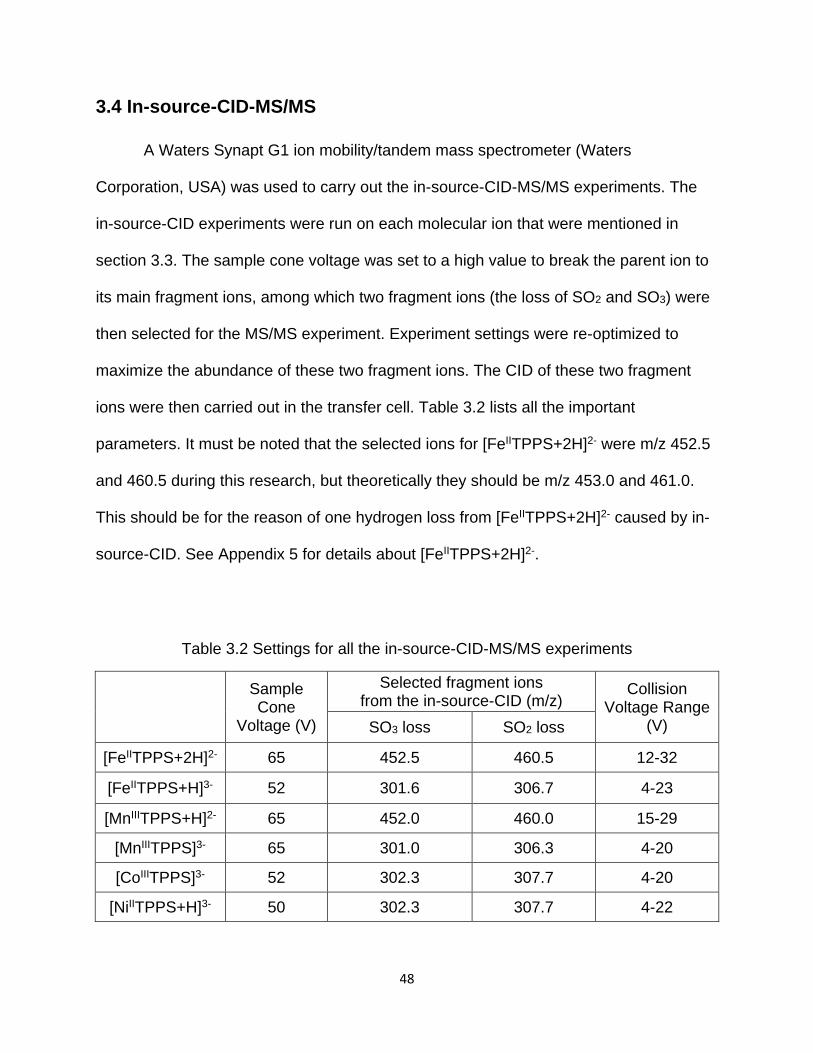
48
3.4 In-source-CID-MS/MS
A Waters Synapt G1 ion mobility/tandem mass spectrometer (Waters
Corporation, USA) was used to carry out the in-source-CID-MS/MS experiments. The
in-source-CID experiments were run on each molecular ion that were mentioned in
section 3.3. The sample cone voltage was set to a high value to break the parent ion to
its main fragment ions, among which two fragment ions (the loss of SO2 and SO3) were
then selected for the MS/MS experiment. Experiment settings were re-optimized to
maximize the abundance of these two fragment ions. The CID of these two fragment
ions were then carried out in the transfer cell. Table 3.2 lists all the important
parameters. It must be noted that the selected ions for [FeIITPPS+2H]2- were m/z 452.5
and 460.5 during this research, but theoretically they should be m/z 453.0 and 461.0.
This should be for the reason of one hydrogen loss from [FeIITPPS+2H]2- caused by in-
source-CID. See Appendix 5 for details about [FeIITPPS+2H]2-.
Table 3.2 Settings for all the in-source-CID-MS/MS experiments
Sample Cone
Voltage (V)
Selected fragment ions from the in-source-CID (m/z)
Collision Voltage Range
(V) SO3 loss SO2 loss
[FeIITPPS+2H]2- 65 452.5 460.5 12-32
[FeIITPPS+H]3- 52 301.6 306.7 4-23
[MnIIITPPS+H]2- 65 452.0 460.0 15-29
[MnIIITPPS]3- 65 301.0 306.3 4-20
[CoIIITPPS]3- 52 302.3 307.7 4-20
[NiIITPPS+H]3- 50 302.3 307.7 4-22
49
3.5 Obtaining experimental breakdown diagram
The fragmentation pathway map is the pathway of all the fragment ions from the
dissociation of the parent ion. To know the pathway of each fragment ion, the first step
is to perform the MS/MS of the parent ion under different collision energies, which is
extracted to obtain the breakdown diagram. The main fragment ions are listed in the
breakdown diagram. With the mass spectrum of each main fragment ion, the possible
structure can be deduced. The possible structure of each fragment ion is then examined
by comparing the theoretical isotope model with the experimental mass spectrum. Once
the structures of all the fragment ions are clear, the assumption about main channels for
those fragment ions is made. In the end, in-source-CID-MS/MS is performed to verify
the assumption, and divide all the channels to the main fragment ions. A breakdown
diagram of the main channels and the parent ion are plotted as a function of the center-
of-mass collision energy, Ecom. (See Chapter 4)
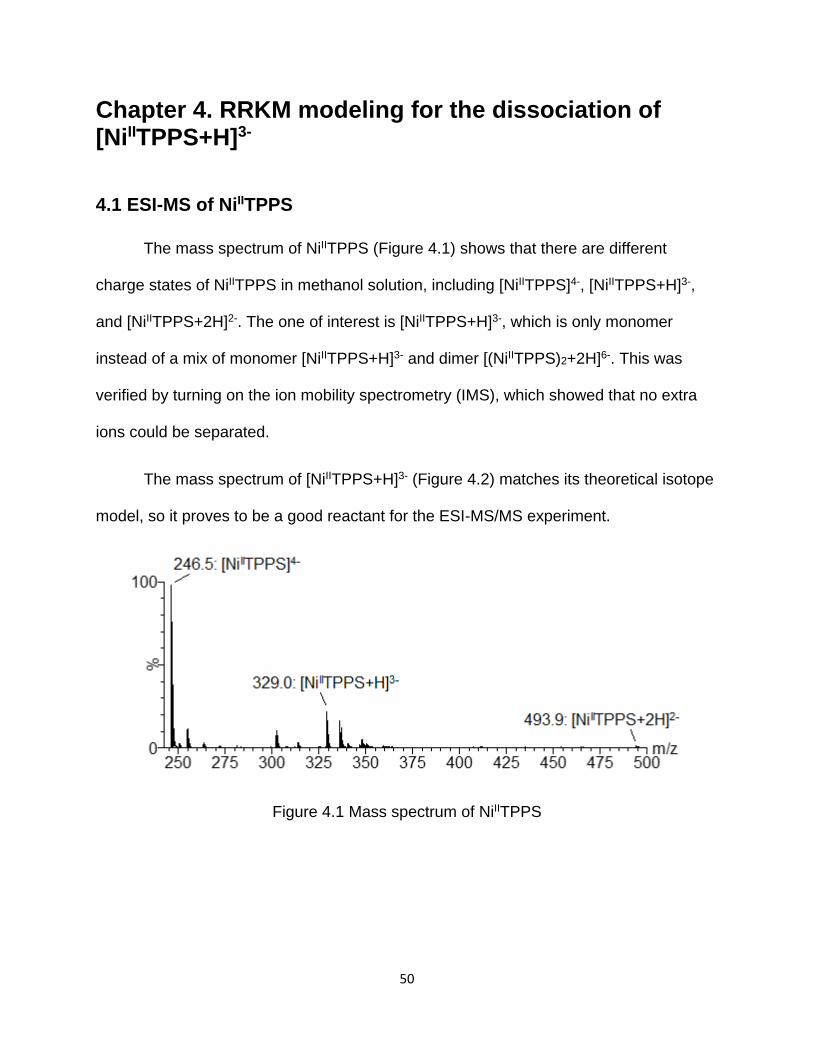
50
Chapter 4. RRKM modeling for the dissociation of [NiIITPPS+H]3-
4.1 ESI-MS of NiIITPPS
The mass spectrum of NiIITPPS (Figure 4.1) shows that there are different
charge states of NiIITPPS in methanol solution, including [NiIITPPS]4-, [NiIITPPS+H]3-,
and [NiIITPPS+2H]2-. The one of interest is [NiIITPPS+H]3-, which is only monomer
instead of a mix of monomer [NiIITPPS+H]3- and dimer [(NiIITPPS)2+2H]6-. This was
verified by turning on the ion mobility spectrometry (IMS), which showed that no extra
ions could be separated.
The mass spectrum of [NiIITPPS+H]3- (Figure 4.2) matches its theoretical isotope
model, so it proves to be a good reactant for the ESI-MS/MS experiment.
Figure 4.1 Mass spectrum of NiIITPPS
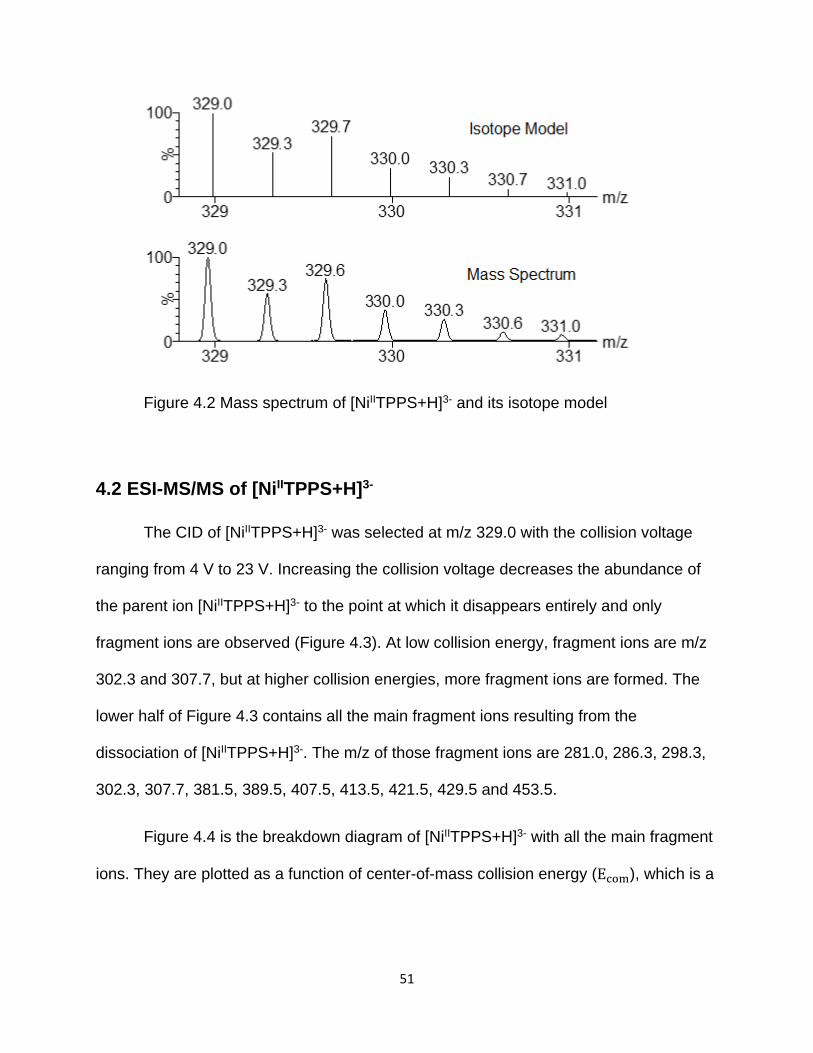
51
Figure 4.2 Mass spectrum of [NiIITPPS+H]3- and its isotope model
4.2 ESI-MS/MS of [NiIITPPS+H]3-
The CID of [NiIITPPS+H]3- was selected at m/z 329.0 with the collision voltage
ranging from 4 V to 23 V. Increasing the collision voltage decreases the abundance of
the parent ion [NiIITPPS+H]3- to the point at which it disappears entirely and only
fragment ions are observed (Figure 4.3). At low collision energy, fragment ions are m/z
302.3 and 307.7, but at higher collision energies, more fragment ions are formed. The
lower half of Figure 4.3 contains all the main fragment ions resulting from the
dissociation of [NiIITPPS+H]3-. The m/z of those fragment ions are 281.0, 286.3, 298.3,
302.3, 307.7, 381.5, 389.5, 407.5, 413.5, 421.5, 429.5 and 453.5.
Figure 4.4 is the breakdown diagram of [NiIITPPS+H]3- with all the main fragment
ions. They are plotted as a function of center-of-mass collision energy (Ecom), which is a
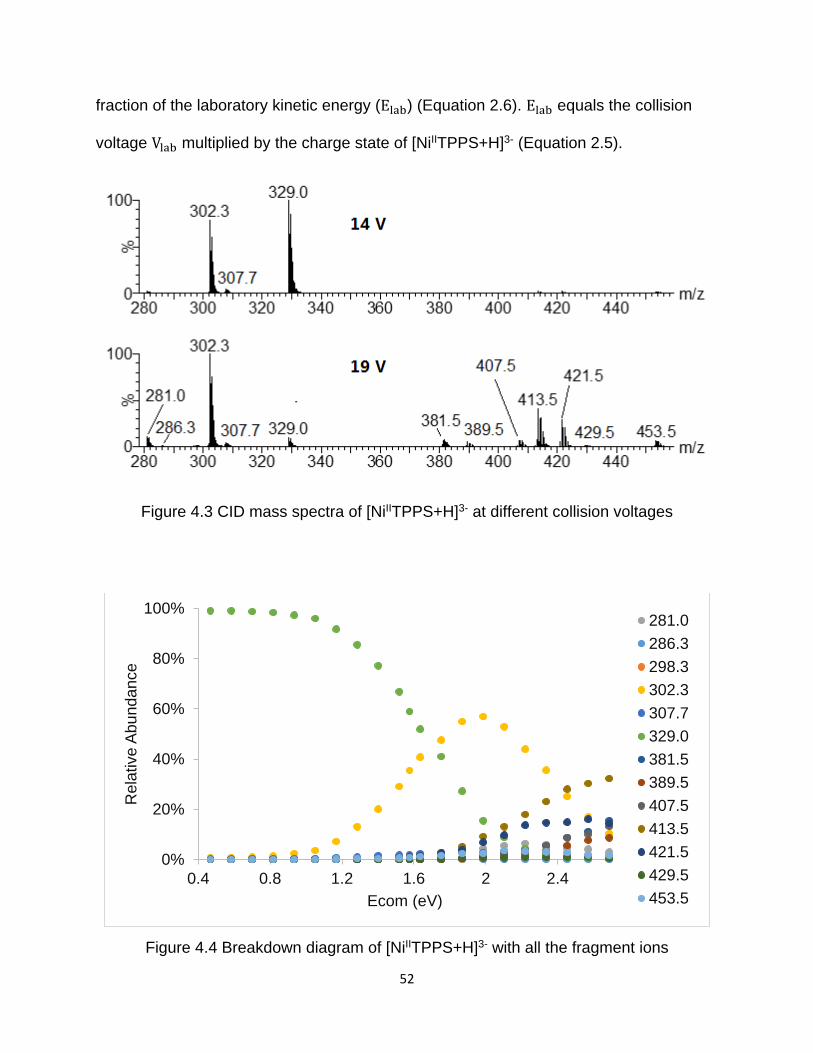
52
fraction of the laboratory kinetic energy (Elab) (Equation 2.6). Elab equals the collision
voltage Vlab multiplied by the charge state of [NiIITPPS+H]3- (Equation 2.5).
Figure 4.3 CID mass spectra of [NiIITPPS+H]3- at different collision voltages
Figure 4.4 Breakdown diagram of [NiIITPPS+H]3- with all the fragment ions
0%
20%
40%
60%
80%
100%
0.4 0.8 1.2 1.6 2 2.4
Rela
tive A
bun
dance
Ecom (eV)
281.0
286.3
298.3
302.3
307.7
329.0
381.5
389.5
407.5
413.5
421.5
429.5
453.5
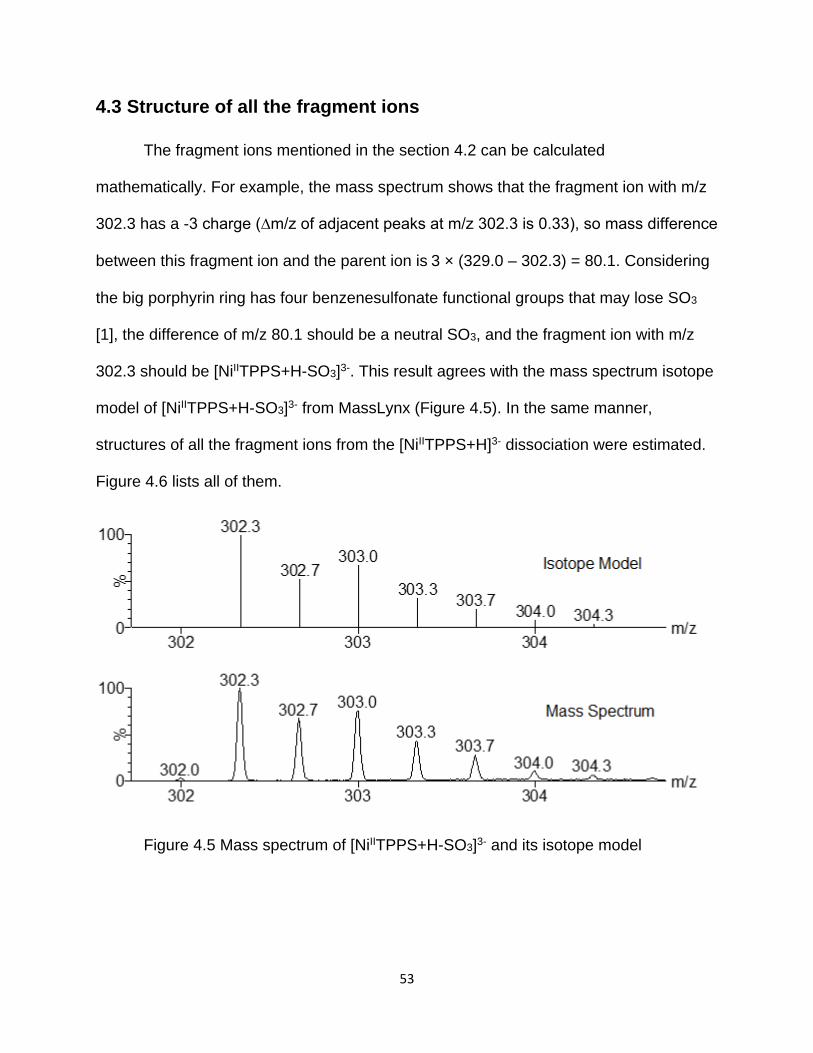
53
4.3 Structure of all the fragment ions
The fragment ions mentioned in the section 4.2 can be calculated
mathematically. For example, the mass spectrum shows that the fragment ion with m/z
302.3 has a -3 charge (∆m/z of adjacent peaks at m/z 302.3 is 0.33), so mass difference
between this fragment ion and the parent ion is 3 × (329.0 – 302.3) = 80.1. Considering
the big porphyrin ring has four benzenesulfonate functional groups that may lose SO3
[1], the difference of m/z 80.1 should be a neutral SO3, and the fragment ion with m/z
302.3 should be [NiIITPPS+H-SO3]3-. This result agrees with the mass spectrum isotope
model of [NiIITPPS+H-SO3]3- from MassLynx (Figure 4.5). In the same manner,
structures of all the fragment ions from the [NiIITPPS+H]3- dissociation were estimated.
Figure 4.6 lists all of them.
Figure 4.5 Mass spectrum of [NiIITPPS+H-SO3]3- and its isotope model
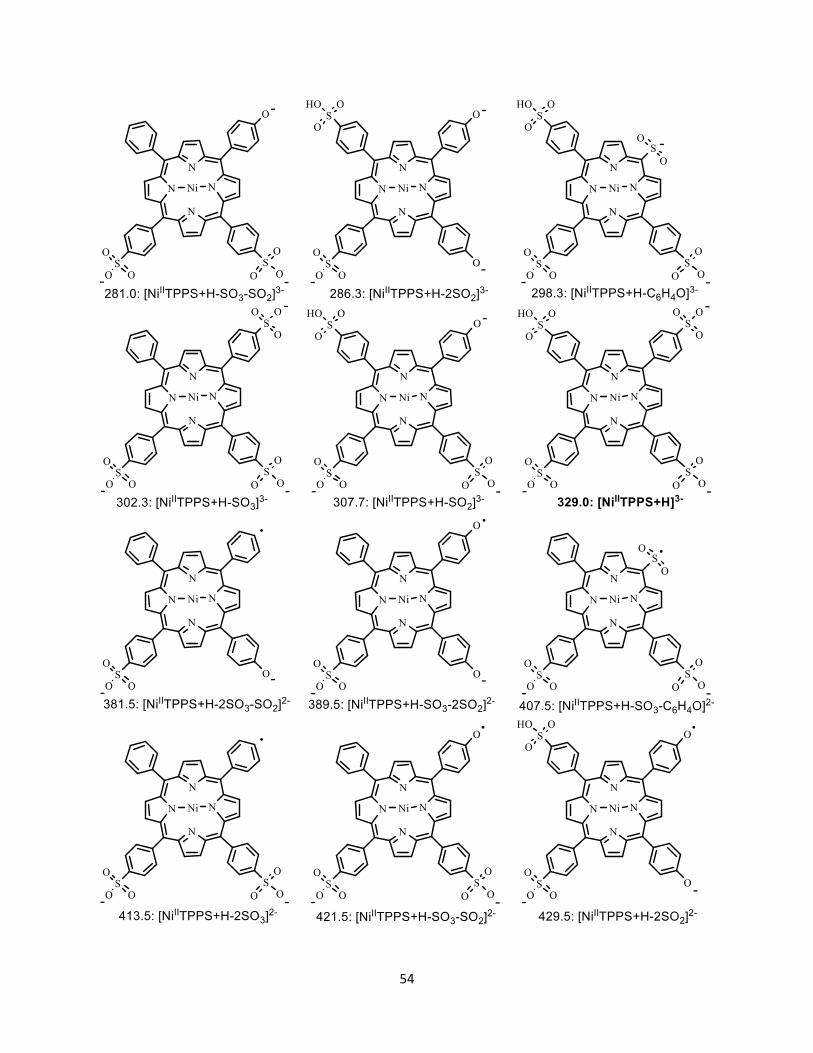
54
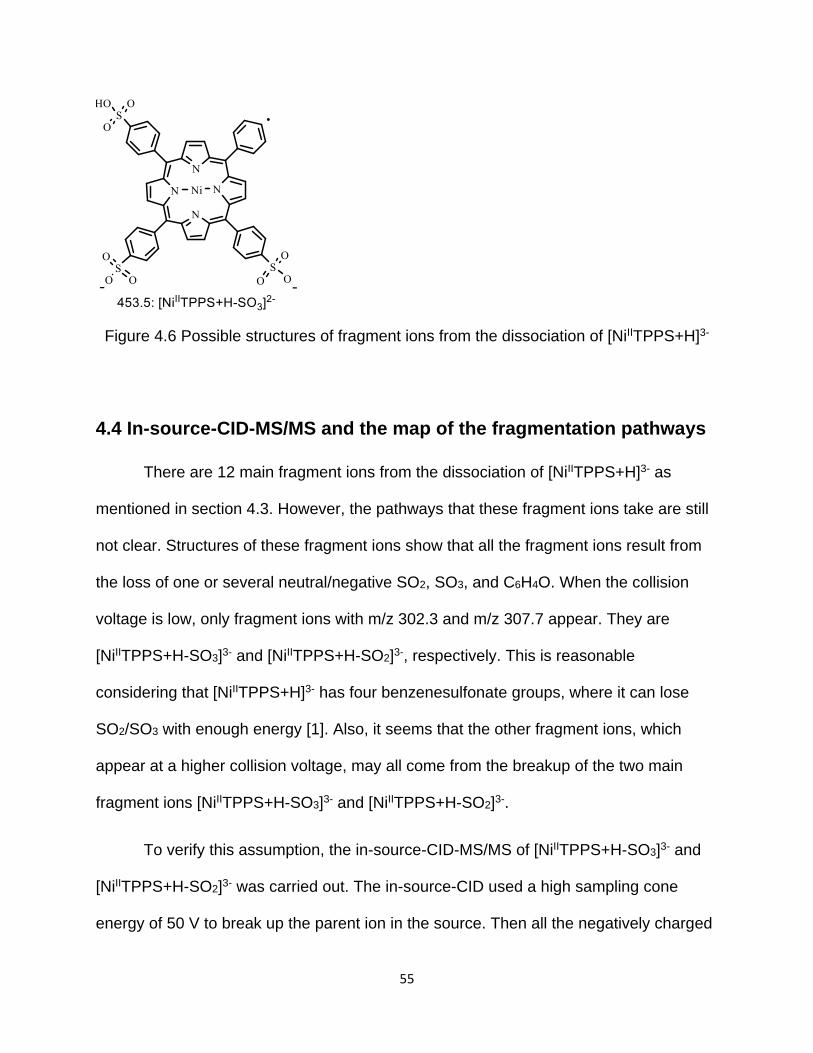
55
Figure 4.6 Possible structures of fragment ions from the dissociation of [NiIITPPS+H]3-
4.4 In-source-CID-MS/MS and the map of the fragmentation pathways
There are 12 main fragment ions from the dissociation of [NiIITPPS+H]3- as
mentioned in section 4.3. However, the pathways that these fragment ions take are still
not clear. Structures of these fragment ions show that all the fragment ions result from
the loss of one or several neutral/negative SO2, SO3, and C6H4O. When the collision
voltage is low, only fragment ions with m/z 302.3 and m/z 307.7 appear. They are
[NiIITPPS+H-SO3]3- and [NiIITPPS+H-SO2]3-, respectively. This is reasonable
considering that [NiIITPPS+H]3- has four benzenesulfonate groups, where it can lose
SO2/SO3 with enough energy [1]. Also, it seems that the other fragment ions, which
appear at a higher collision voltage, may all come from the breakup of the two main
fragment ions [NiIITPPS+H-SO3]3- and [NiIITPPS+H-SO2]3-.
To verify this assumption, the in-source-CID-MS/MS of [NiIITPPS+H-SO3]3- and
[NiIITPPS+H-SO2]3- was carried out. The in-source-CID used a high sampling cone
energy of 50 V to break up the parent ion in the source. Then all the negatively charged
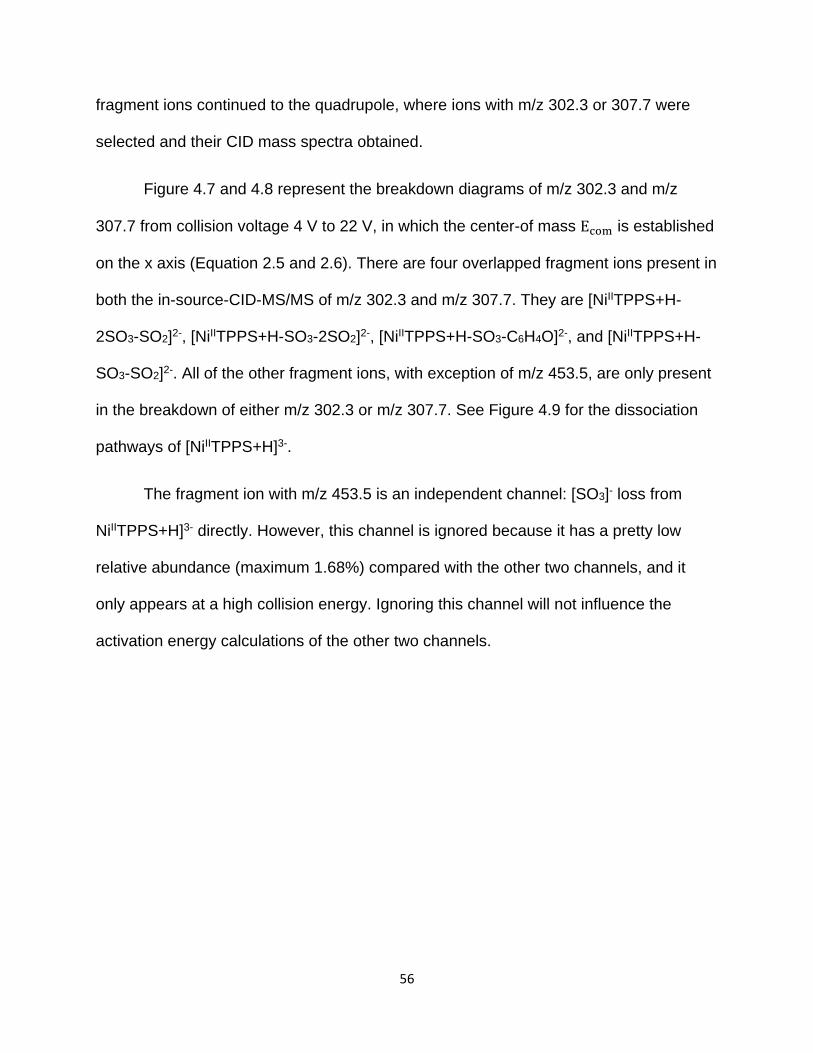
56
fragment ions continued to the quadrupole, where ions with m/z 302.3 or 307.7 were
selected and their CID mass spectra obtained.
Figure 4.7 and 4.8 represent the breakdown diagrams of m/z 302.3 and m/z
307.7 from collision voltage 4 V to 22 V, in which the center-of mass Ecom is established
on the x axis (Equation 2.5 and 2.6). There are four overlapped fragment ions present in
both the in-source-CID-MS/MS of m/z 302.3 and m/z 307.7. They are [NiIITPPS+H-
2SO3-SO2]2-, [NiIITPPS+H-SO3-2SO2]2-, [NiIITPPS+H-SO3-C6H4O]2-, and [NiIITPPS+H-
SO3-SO2]2-. All of the other fragment ions, with exception of m/z 453.5, are only present
in the breakdown of either m/z 302.3 or m/z 307.7. See Figure 4.9 for the dissociation
pathways of [NiIITPPS+H]3-.
The fragment ion with m/z 453.5 is an independent channel: [SO3]- loss from
NiIITPPS+H]3- directly. However, this channel is ignored because it has a pretty low
relative abundance (maximum 1.68%) compared with the other two channels, and it
only appears at a high collision energy. Ignoring this channel will not influence the
activation energy calculations of the other two channels.
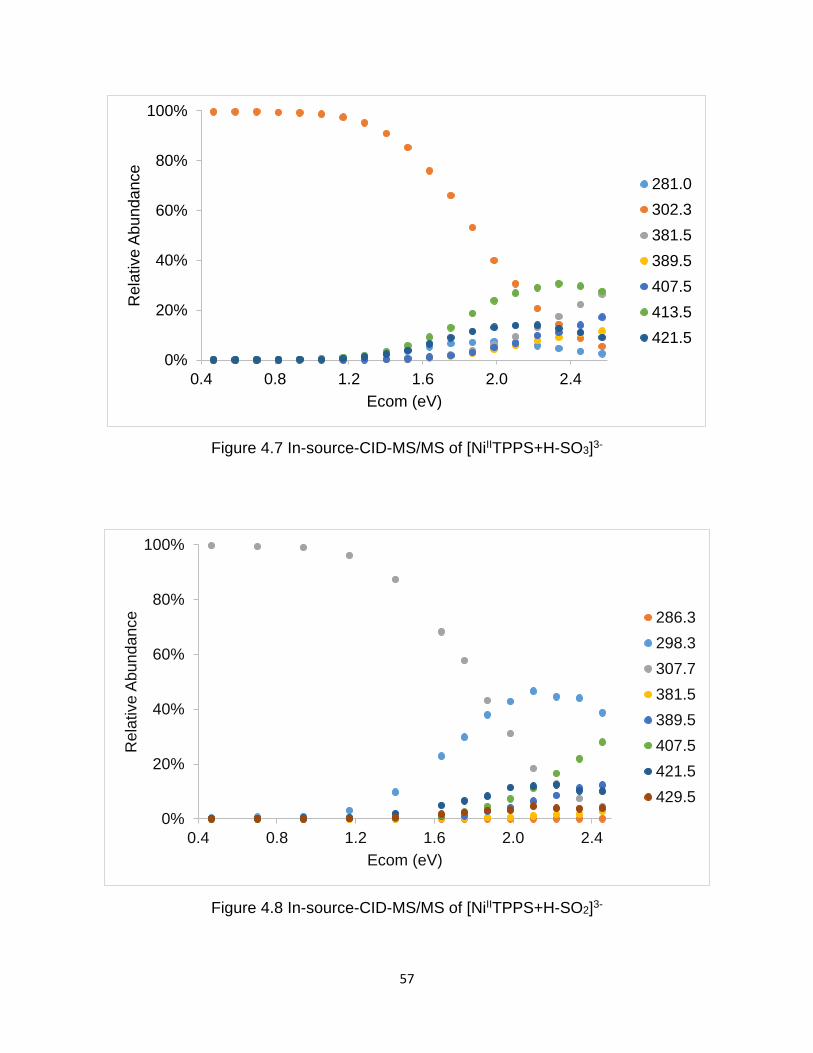
57
Figure 4.7 In-source-CID-MS/MS of [NiIITPPS+H-SO3]3-
Figure 4.8 In-source-CID-MS/MS of [NiIITPPS+H-SO2]3-
0%
20%
40%
60%
80%
100%
0.4 0.8 1.2 1.6 2.0 2.4
Rela
tive A
bundance
Ecom (eV)
281.0
302.3
381.5
389.5
407.5
413.5
421.5
0%
20%
40%
60%
80%
100%
0.4 0.8 1.2 1.6 2.0 2.4
Rela
tive A
bundance
Ecom (eV)
286.3
298.3
307.7
381.5
389.5
407.5
421.5
429.5
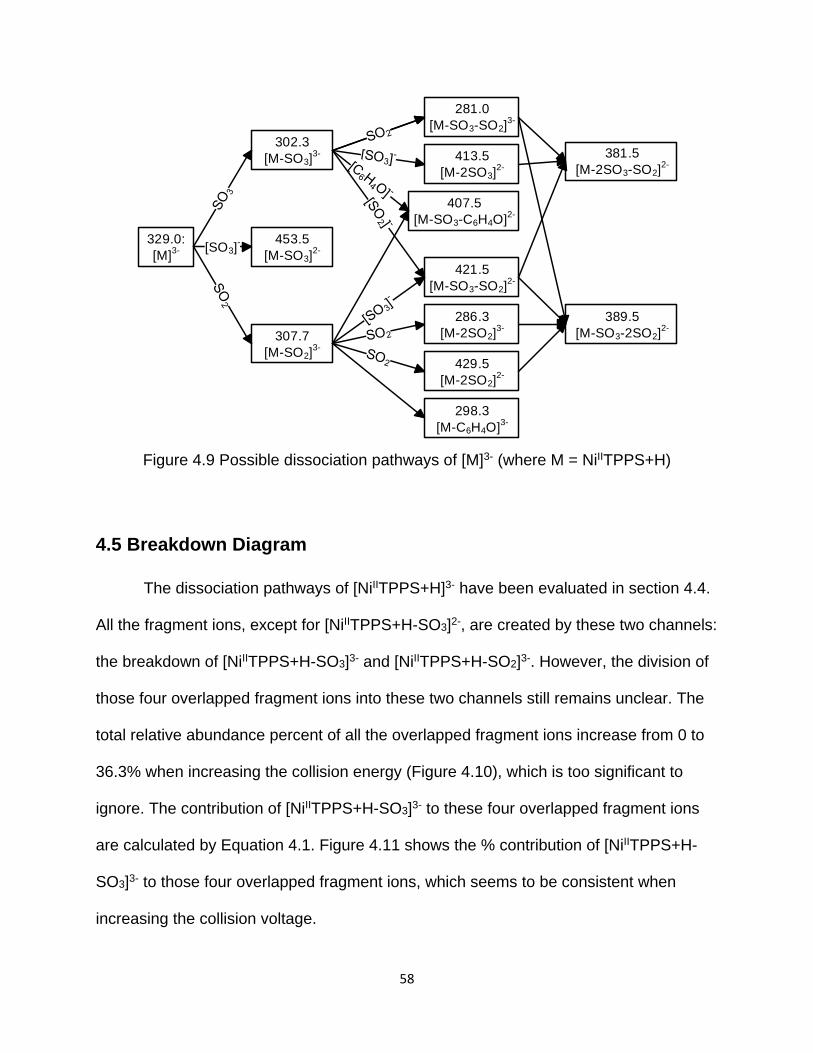
58
329.0:
[M]3-
302.3
[M-SO3]3-
421.5
[M-SO3-SO2]2-
307.7
[M-SO2]3-
429.5
[M-2SO2]2-
298.3
[M-C6H4O]3-
453.5
[M-SO3]2-
407.5
[M-SO3-C6H4O]2-
413.5
[M-2SO3]2-
281.0
[M-SO3-SO2]3-
[SO3]-
389.5
[M-SO3-2SO2]2-
381.5
[M-2SO3-SO2]2-
286.3
[M-2SO2]3-
Figure 4.9 Possible dissociation pathways of [M]3- (where M = NiIITPPS+H)
4.5 Breakdown Diagram
The dissociation pathways of [NiIITPPS+H]3- have been evaluated in section 4.4.
All the fragment ions, except for [NiIITPPS+H-SO3]2-, are created by these two channels:
the breakdown of [NiIITPPS+H-SO3]3- and [NiIITPPS+H-SO2]3-. However, the division of
those four overlapped fragment ions into these two channels still remains unclear. The
total relative abundance percent of all the overlapped fragment ions increase from 0 to
36.3% when increasing the collision energy (Figure 4.10), which is too significant to
ignore. The contribution of [NiIITPPS+H-SO3]3- to these four overlapped fragment ions
are calculated by Equation 4.1. Figure 4.11 shows the % contribution of [NiIITPPS+H-
SO3]3- to those four overlapped fragment ions, which seems to be consistent when
increasing the collision voltage.
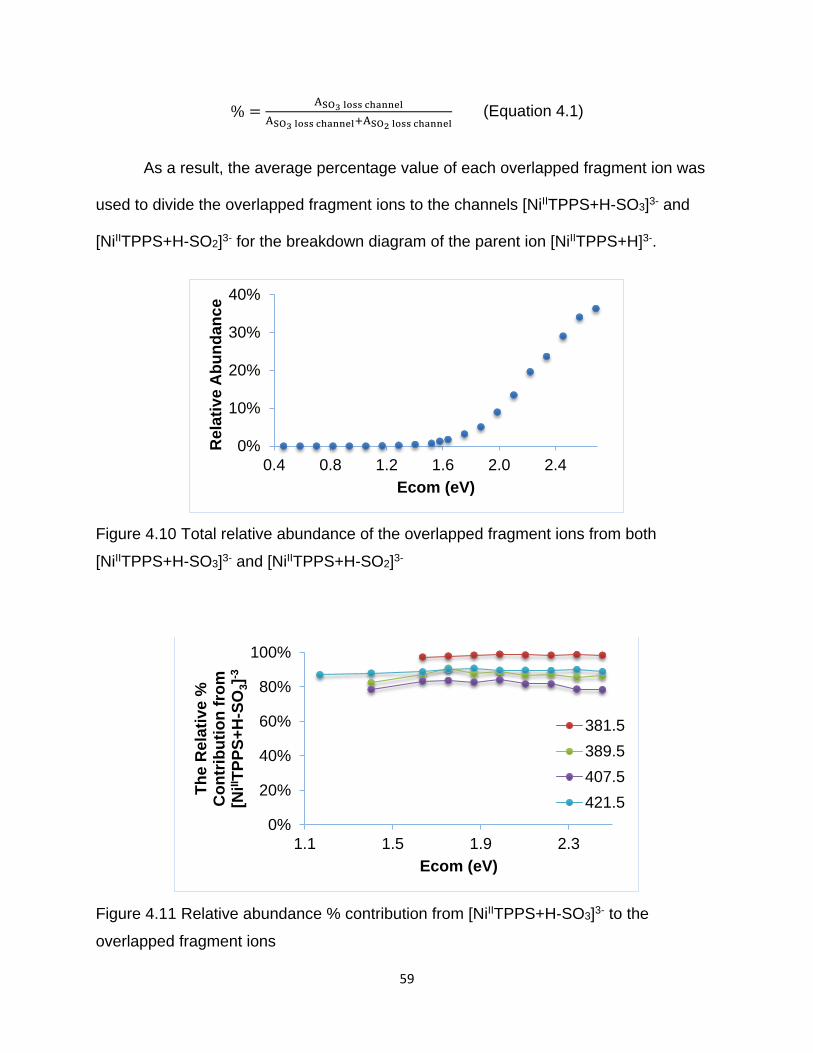
59
% =ASO3 loss channel
ASO3 loss channel+ASO2 loss channel (Equation 4.1)
As a result, the average percentage value of each overlapped fragment ion was
used to divide the overlapped fragment ions to the channels [NiIITPPS+H-SO3]3- and
[NiIITPPS+H-SO2]3- for the breakdown diagram of the parent ion [NiIITPPS+H]3-.
Figure 4.10 Total relative abundance of the overlapped fragment ions from both
[NiIITPPS+H-SO3]3- and [NiIITPPS+H-SO2]3-
Figure 4.11 Relative abundance % contribution from [NiIITPPS+H-SO3]3- to the
overlapped fragment ions
0%
10%
20%
30%
40%
0.4 0.8 1.2 1.6 2.0 2.4
Rela
tive A
bu
nd
an
ce
Ecom (eV)
0%
20%
40%
60%
80%
100%
1.1 1.5 1.9 2.3
Th
e R
ela
tive %
C
on
trib
uti
on
fro
m
[NiII
TP
PS
+H
-SO
3]-
3
Ecom (eV)
381.5
389.5
407.5
421.5
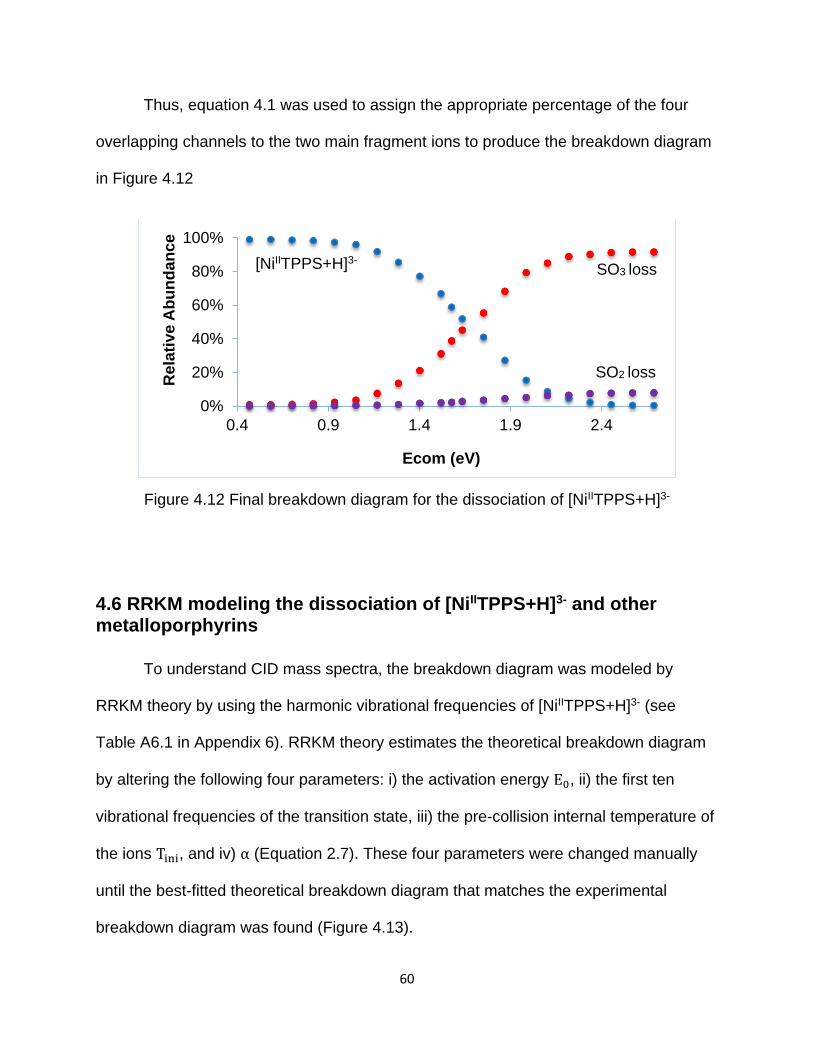
60
Thus, equation 4.1 was used to assign the appropriate percentage of the four
overlapping channels to the two main fragment ions to produce the breakdown diagram
in Figure 4.12
Figure 4.12 Final breakdown diagram for the dissociation of [NiIITPPS+H]3-
4.6 RRKM modeling the dissociation of [NiIITPPS+H]3- and other metalloporphyrins
To understand CID mass spectra, the breakdown diagram was modeled by
RRKM theory by using the harmonic vibrational frequencies of [NiIITPPS+H]3- (see
Table A6.1 in Appendix 6). RRKM theory estimates the theoretical breakdown diagram
by altering the following four parameters: i) the activation energy E0, ii) the first ten
vibrational frequencies of the transition state, iii) the pre-collision internal temperature of
the ions Tini, and iv) α (Equation 2.7). These four parameters were changed manually
until the best-fitted theoretical breakdown diagram that matches the experimental
breakdown diagram was found (Figure 4.13).
0%
20%
40%
60%
80%
100%
0.4 0.9 1.4 1.9 2.4
Rela
tive A
bu
nd
an
ce
Ecom (eV)
SO3 loss
SO2 loss
[NiIITPPS+H]3-
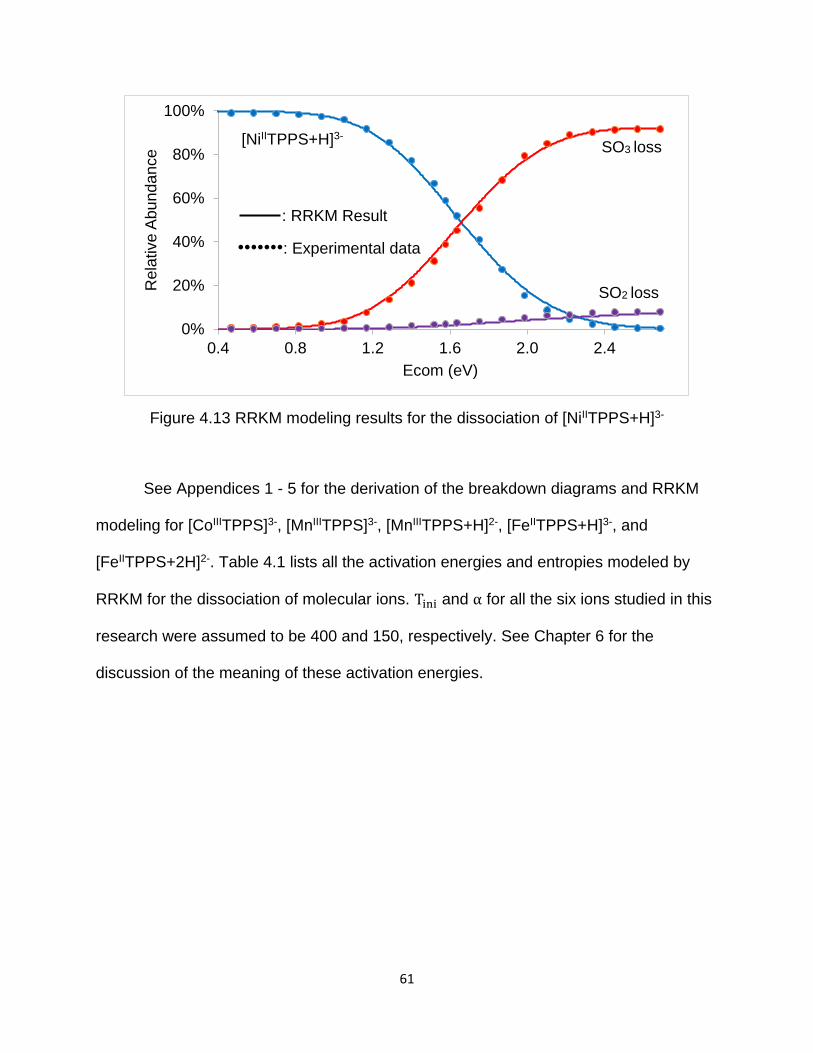
61
Figure 4.13 RRKM modeling results for the dissociation of [NiIITPPS+H]3-
See Appendices 1 - 5 for the derivation of the breakdown diagrams and RRKM
modeling for [CoIIITPPS]3-, [MnIIITPPS]3-, [MnIIITPPS+H]2-, [FeIITPPS+H]3-, and
[FeIITPPS+2H]2-. Table 4.1 lists all the activation energies and entropies modeled by
RRKM for the dissociation of molecular ions. Tini and α for all the six ions studied in this
research were assumed to be 400 and 150, respectively. See Chapter 6 for the
discussion of the meaning of these activation energies.
0%
20%
40%
60%
80%
100%
0.4 0.8 1.2 1.6 2.0 2.4
Rela
tive A
bundance
Ecom (eV)
SO3 loss
SO2 loss
[NiIITPPS+H]3-
: RRKM Result
•••••••: Experimental data
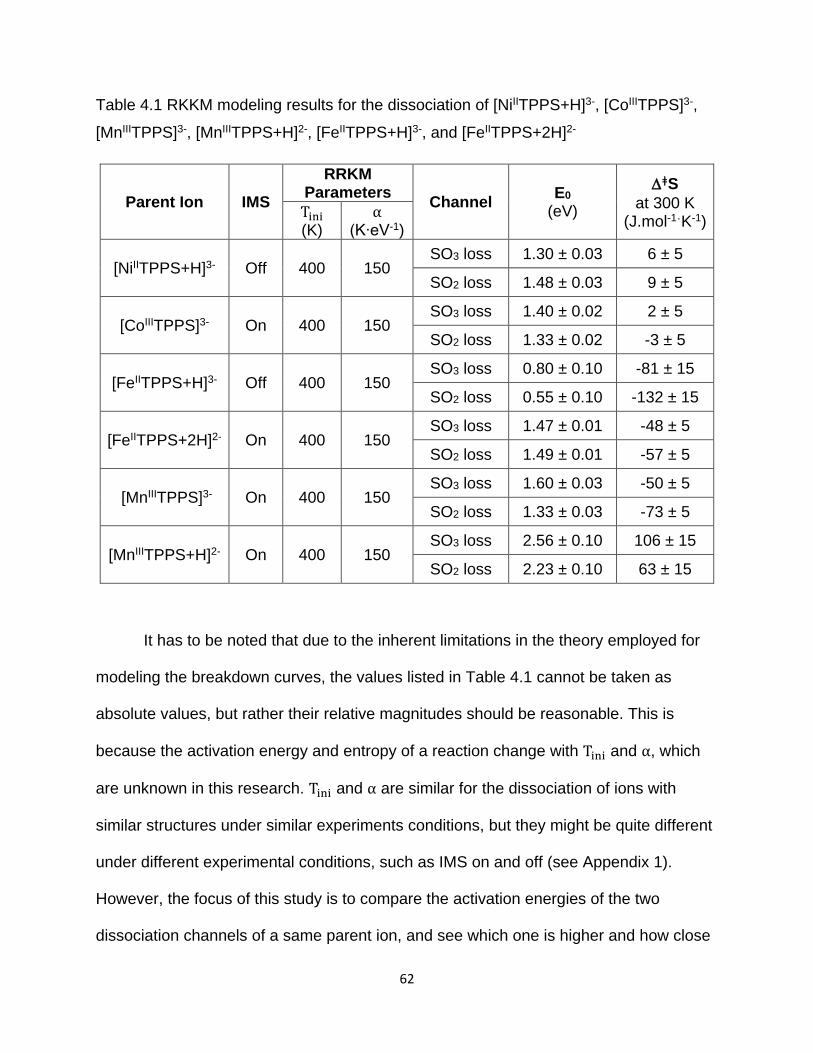
62
Table 4.1 RKKM modeling results for the dissociation of [NiIITPPS+H]3-, [CoIIITPPS]3-,
[MnIIITPPS]3-, [MnIIITPPS+H]2-, [FeIITPPS+H]3-, and [FeIITPPS+2H]2-
Parent Ion IMS
RRKM Parameters
Channel E0
(eV)
ǂS
at 300 K (J.mol-1ˑK-1)
Tini (K)
α (K∙eV-1)
[NiIITPPS+H]3- Off 400 150 SO3 loss 1.30 ± 0.03 6 ± 5
SO2 loss 1.48 ± 0.03 9 ± 5
[CoIIITPPS]3- On 400 150 SO3 loss 1.40 ± 0.02 2 ± 5
SO2 loss 1.33 ± 0.02 -3 ± 5
[FeIITPPS+H]3- Off 400 150 SO3 loss 0.80 ± 0.10 -81 ± 15
SO2 loss 0.55 ± 0.10 -132 ± 15
[FeIITPPS+2H]2- On 400 150 SO3 loss 1.47 ± 0.01 -48 ± 5
SO2 loss 1.49 ± 0.01 -57 ± 5
[MnIIITPPS]3- On 400 150 SO3 loss 1.60 ± 0.03 -50 ± 5
SO2 loss 1.33 ± 0.03 -73 ± 5
[MnIIITPPS+H]2- On 400 150 SO3 loss 2.56 ± 0.10 106 ± 15
SO2 loss 2.23 ± 0.10 63 ± 15
It has to be noted that due to the inherent limitations in the theory employed for
modeling the breakdown curves, the values listed in Table 4.1 cannot be taken as
absolute values, but rather their relative magnitudes should be reasonable. This is
because the activation energy and entropy of a reaction change with Tini and α, which
are unknown in this research. Tini and α are similar for the dissociation of ions with
similar structures under similar experiments conditions, but they might be quite different
under different experimental conditions, such as IMS on and off (see Appendix 1).
However, the focus of this study is to compare the activation energies of the two
dissociation channels of a same parent ion, and see which one is higher and how close
63
they are. RRKM modeling is good at this even when Tini and α are unknown (see
Appendix 1).
4.7 References
[1] Ben-Ari J, Etinger A, Weisz A, Mandelbaum A. Hydrogen-shift isomerism: mass
spectrometry of isomeric benzenesulfonate and 2-, 3- and 4-dehydrobenzenesulfonic
acid anions in the gas phase. Journal of Mass Spectrometry. 2005;40(8):1064-71.
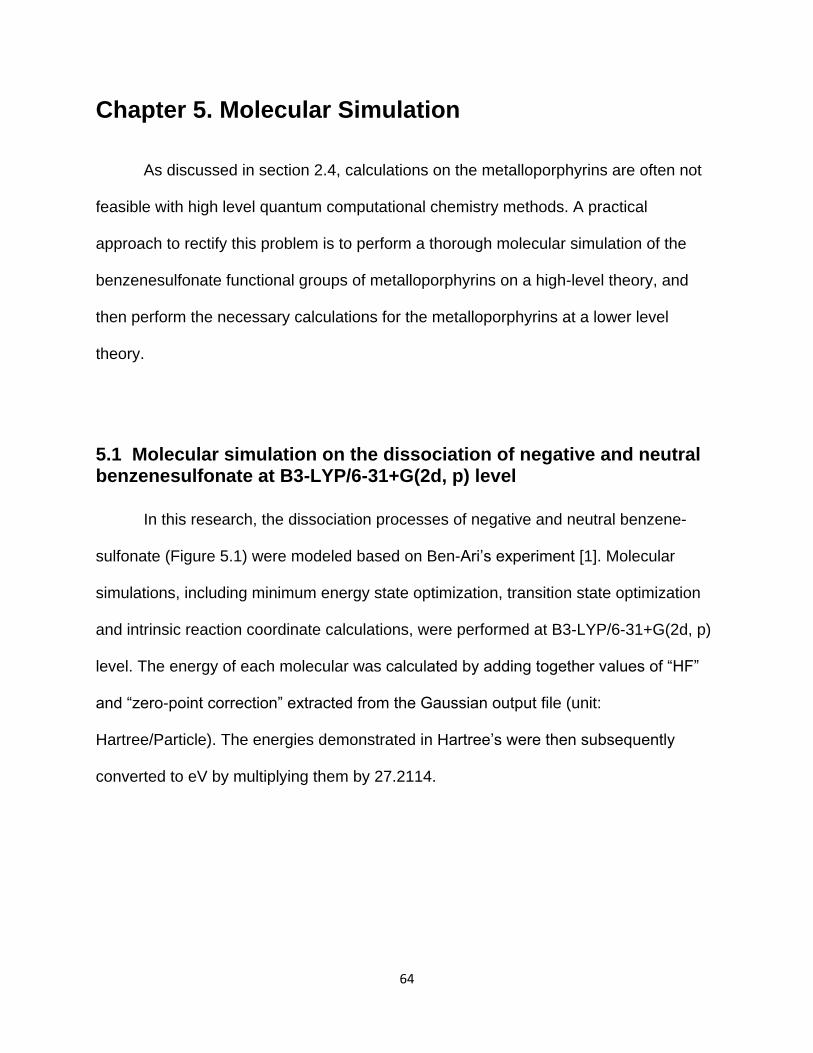
64
Chapter 5. Molecular Simulation
As discussed in section 2.4, calculations on the metalloporphyrins are often not
feasible with high level quantum computational chemistry methods. A practical
approach to rectify this problem is to perform a thorough molecular simulation of the
benzenesulfonate functional groups of metalloporphyrins on a high-level theory, and
then perform the necessary calculations for the metalloporphyrins at a lower level
theory.
5.1 Molecular simulation on the dissociation of negative and neutral benzenesulfonate at B3-LYP/6-31+G(2d, p) level
In this research, the dissociation processes of negative and neutral benzene-
sulfonate (Figure 5.1) were modeled based on Ben-Ari’s experiment [1]. Molecular
simulations, including minimum energy state optimization, transition state optimization
and intrinsic reaction coordinate calculations, were performed at B3-LYP/6-31+G(2d, p)
level. The energy of each molecular was calculated by adding together values of “HF”
and “zero-point correction” extracted from the Gaussian output file (unit:
Hartree/Particle). The energies demonstrated in Hartree’s were then subsequently
converted to eV by multiplying them by 27.2114.
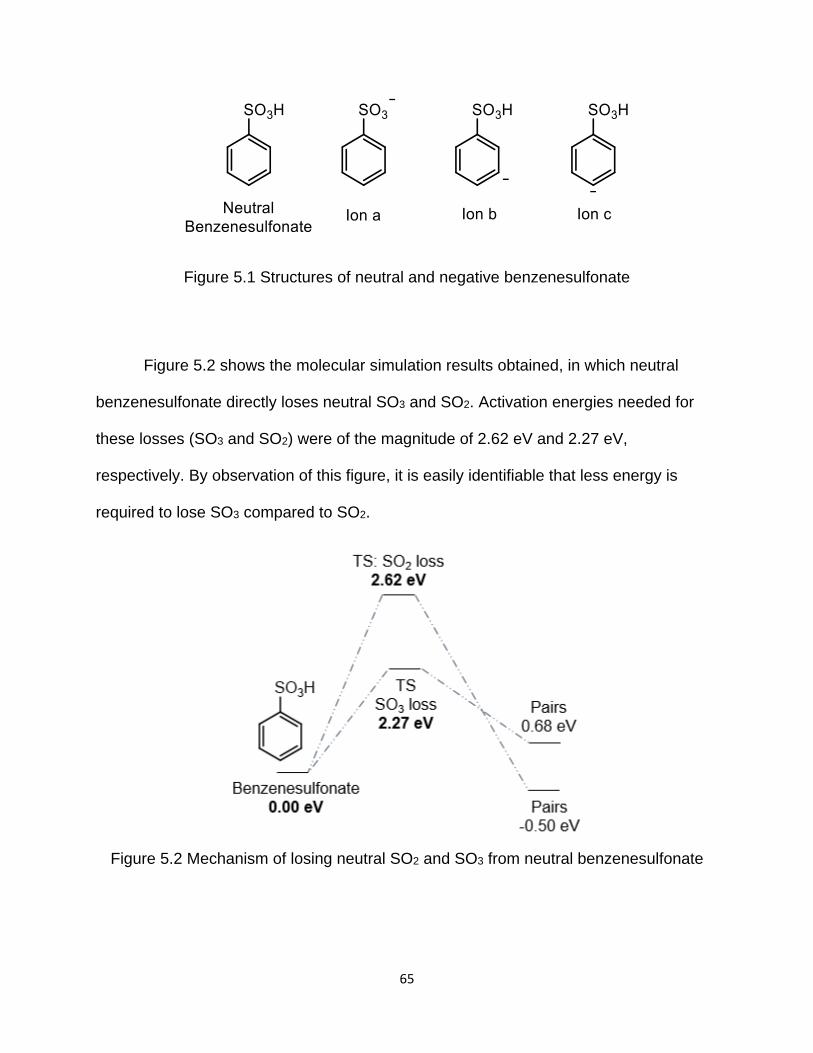
65
Figure 5.1 Structures of neutral and negative benzenesulfonate
Figure 5.2 shows the molecular simulation results obtained, in which neutral
benzenesulfonate directly loses neutral SO3 and SO2. Activation energies needed for
these losses (SO3 and SO2) were of the magnitude of 2.62 eV and 2.27 eV,
respectively. By observation of this figure, it is easily identifiable that less energy is
required to lose SO3 compared to SO2.
Figure 5.2 Mechanism of losing neutral SO2 and SO3 from neutral benzenesulfonate
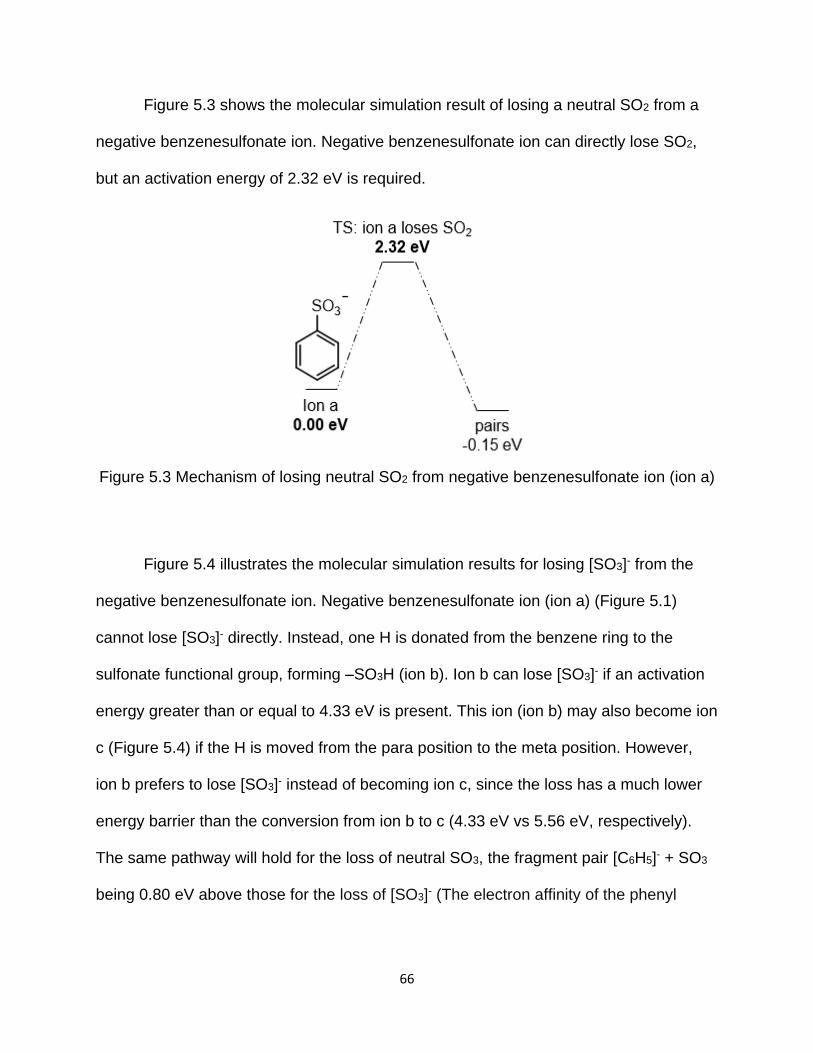
66
Figure 5.3 shows the molecular simulation result of losing a neutral SO2 from a
negative benzenesulfonate ion. Negative benzenesulfonate ion can directly lose SO2,
but an activation energy of 2.32 eV is required.
Figure 5.3 Mechanism of losing neutral SO2 from negative benzenesulfonate ion (ion a)
Figure 5.4 illustrates the molecular simulation results for losing [SO3]- from the
negative benzenesulfonate ion. Negative benzenesulfonate ion (ion a) (Figure 5.1)
cannot lose [SO3]- directly. Instead, one H is donated from the benzene ring to the
sulfonate functional group, forming –SO3H (ion b). Ion b can lose [SO3]- if an activation
energy greater than or equal to 4.33 eV is present. This ion (ion b) may also become ion
c (Figure 5.4) if the H is moved from the para position to the meta position. However,
ion b prefers to lose [SO3]- instead of becoming ion c, since the loss has a much lower
energy barrier than the conversion from ion b to c (4.33 eV vs 5.56 eV, respectively).
The same pathway will hold for the loss of neutral SO3, the fragment pair [C6H5]- + SO3
being 0.80 eV above those for the loss of [SO3]- (The electron affinity of the phenyl
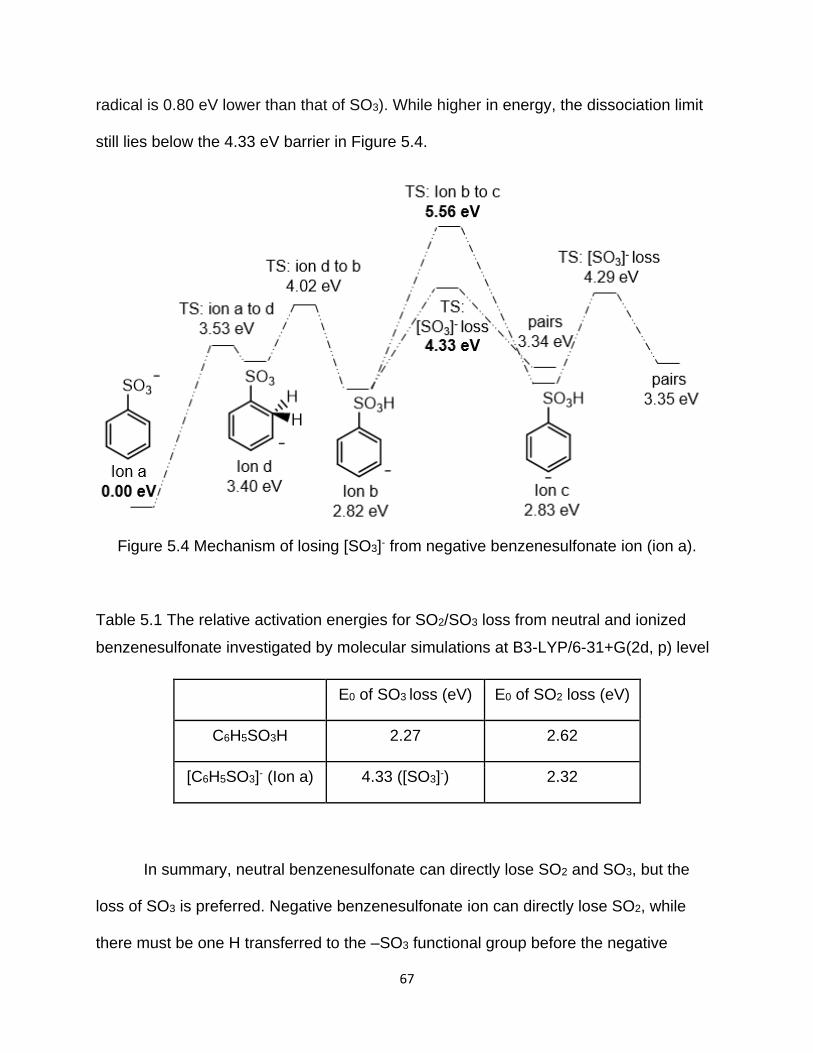
67
radical is 0.80 eV lower than that of SO3). While higher in energy, the dissociation limit
still lies below the 4.33 eV barrier in Figure 5.4.
Figure 5.4 Mechanism of losing [SO3]- from negative benzenesulfonate ion (ion a).
Table 5.1 The relative activation energies for SO2/SO3 loss from neutral and ionized
benzenesulfonate investigated by molecular simulations at B3-LYP/6-31+G(2d, p) level
E0 of SO3 loss (eV) E0 of SO2 loss (eV)
C6H5SO3H 2.27 2.62
[C6H5SO3]- (Ion a) 4.33 ([SO3]-) 2.32
In summary, neutral benzenesulfonate can directly lose SO2 and SO3, but the
loss of SO3 is preferred. Negative benzenesulfonate ion can directly lose SO2, while
there must be one H transferred to the –SO3 functional group before the negative
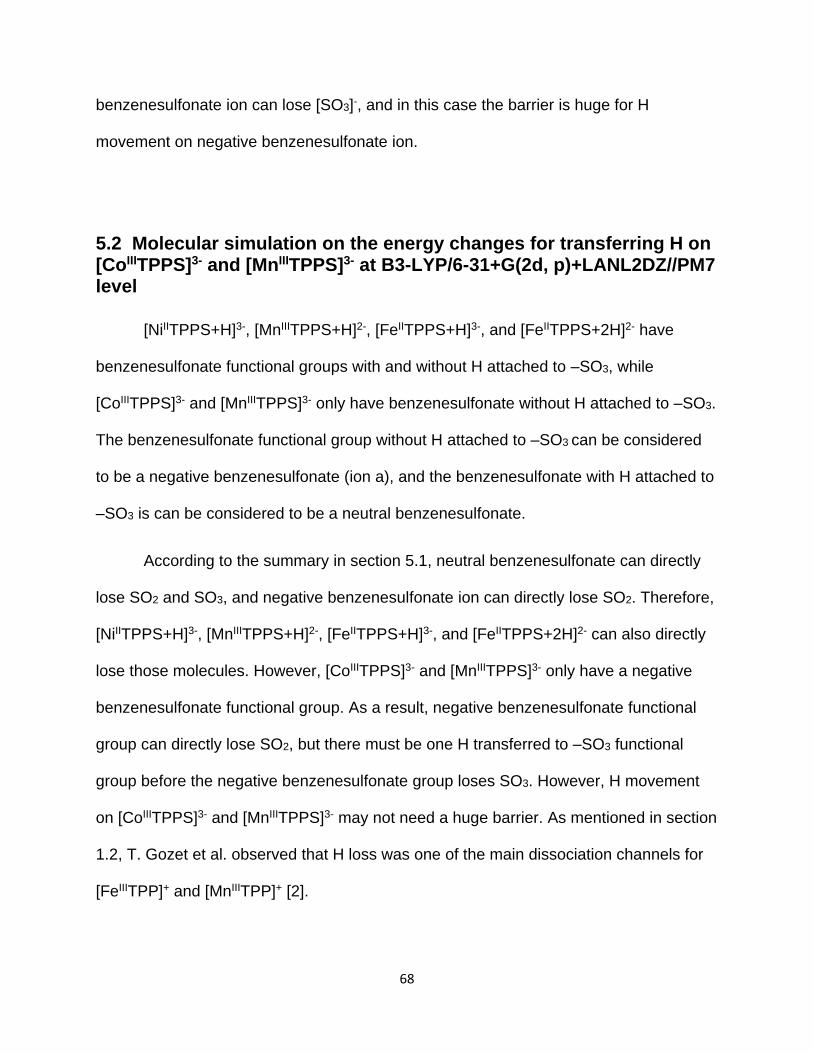
68
benzenesulfonate ion can lose [SO3]-, and in this case the barrier is huge for H
movement on negative benzenesulfonate ion.
5.2 Molecular simulation on the energy changes for transferring H on [CoIIITPPS]3- and [MnIIITPPS]3- at B3-LYP/6-31+G(2d, p)+LANL2DZ//PM7 level
[NiIITPPS+H]3-, [MnIIITPPS+H]2-, [FeIITPPS+H]3-, and [FeIITPPS+2H]2- have
benzenesulfonate functional groups with and without H attached to –SO3, while
[CoIIITPPS]3- and [MnIIITPPS]3- only have benzenesulfonate without H attached to –SO3.
The benzenesulfonate functional group without H attached to –SO3 can be considered
to be a negative benzenesulfonate (ion a), and the benzenesulfonate with H attached to
–SO3 is can be considered to be a neutral benzenesulfonate.
According to the summary in section 5.1, neutral benzenesulfonate can directly
lose SO2 and SO3, and negative benzenesulfonate ion can directly lose SO2. Therefore,
[NiIITPPS+H]3-, [MnIIITPPS+H]2-, [FeIITPPS+H]3-, and [FeIITPPS+2H]2- can also directly
lose those molecules. However, [CoIIITPPS]3- and [MnIIITPPS]3- only have a negative
benzenesulfonate functional group. As a result, negative benzenesulfonate functional
group can directly lose SO2, but there must be one H transferred to –SO3 functional
group before the negative benzenesulfonate group loses SO3. However, H movement
on [CoIIITPPS]3- and [MnIIITPPS]3- may not need a huge barrier. As mentioned in section
1.2, T. Gozet et al. observed that H loss was one of the main dissociation channels for
[FeIIITPP]+ and [MnIIITPP]+ [2].
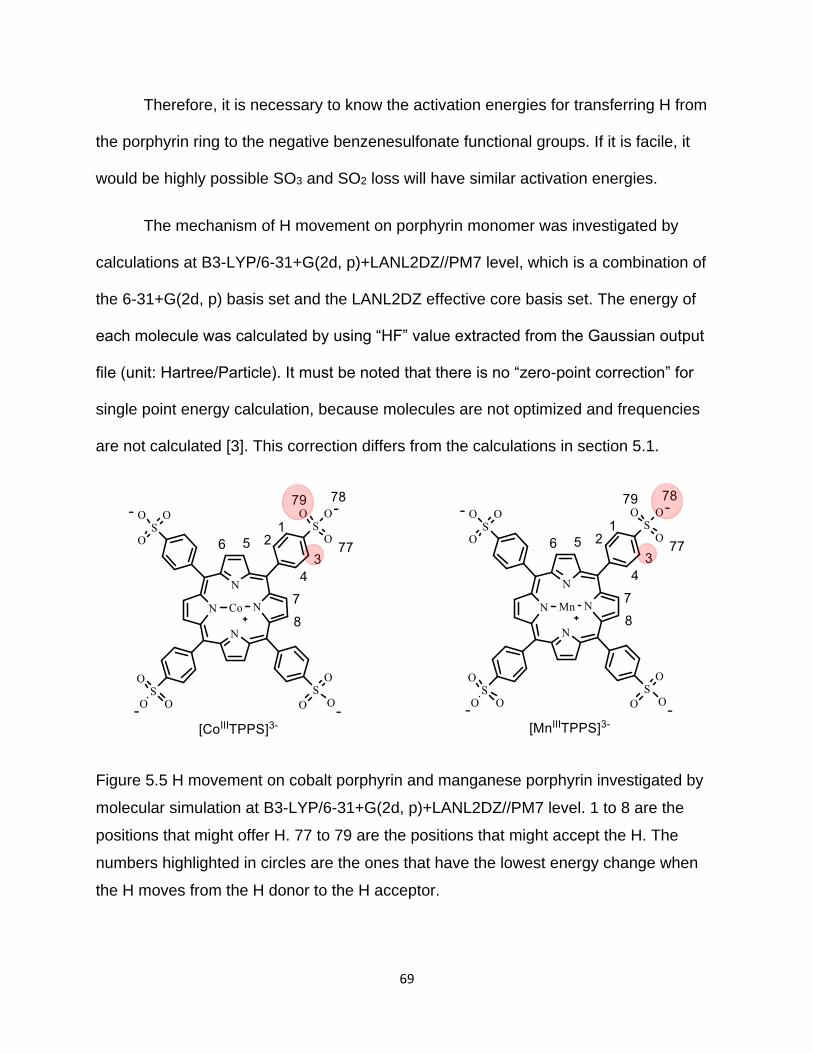
69
Therefore, it is necessary to know the activation energies for transferring H from
the porphyrin ring to the negative benzenesulfonate functional groups. If it is facile, it
would be highly possible SO3 and SO2 loss will have similar activation energies.
The mechanism of H movement on porphyrin monomer was investigated by
calculations at B3-LYP/6-31+G(2d, p)+LANL2DZ//PM7 level, which is a combination of
the 6-31+G(2d, p) basis set and the LANL2DZ effective core basis set. The energy of
each molecule was calculated by using “HF” value extracted from the Gaussian output
file (unit: Hartree/Particle). It must be noted that there is no “zero-point correction” for
single point energy calculation, because molecules are not optimized and frequencies
are not calculated [3]. This correction differs from the calculations in section 5.1.
Figure 5.5 H movement on cobalt porphyrin and manganese porphyrin investigated by
molecular simulation at B3-LYP/6-31+G(2d, p)+LANL2DZ//PM7 level. 1 to 8 are the
positions that might offer H. 77 to 79 are the positions that might accept the H. The
numbers highlighted in circles are the ones that have the lowest energy change when
the H moves from the H donor to the H acceptor.
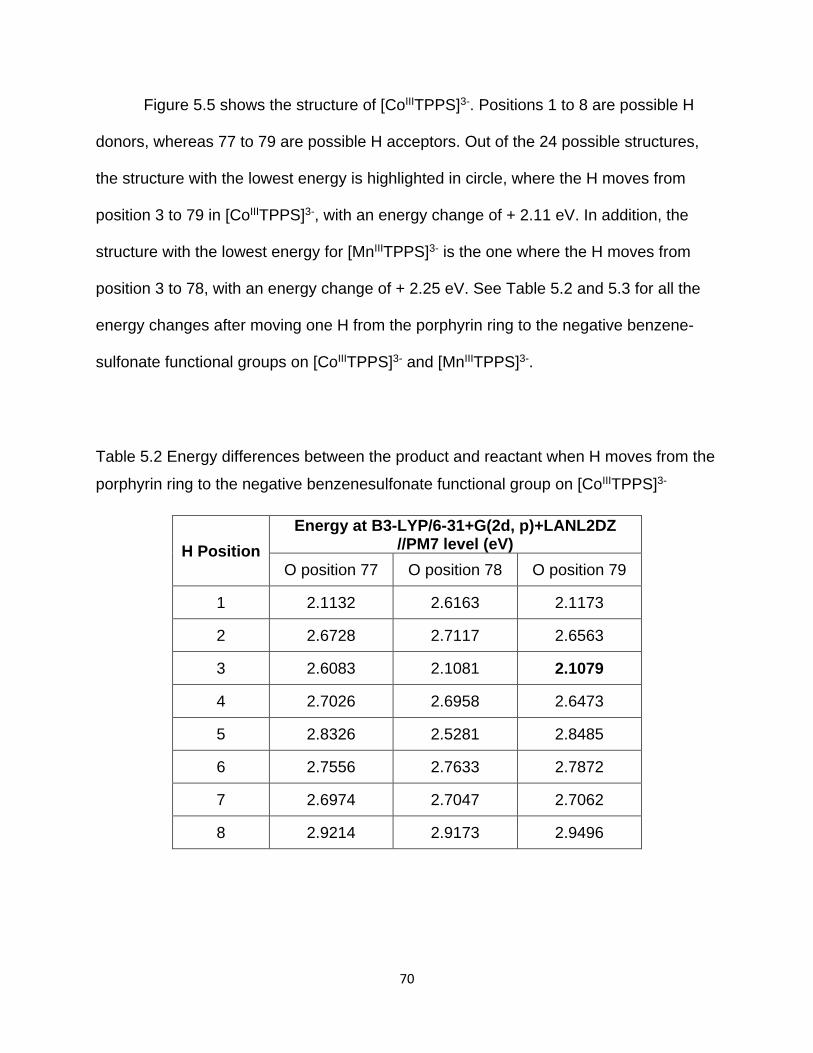
70
Figure 5.5 shows the structure of [CoIIITPPS]3-. Positions 1 to 8 are possible H
donors, whereas 77 to 79 are possible H acceptors. Out of the 24 possible structures,
the structure with the lowest energy is highlighted in circle, where the H moves from
position 3 to 79 in [CoIIITPPS]3-, with an energy change of + 2.11 eV. In addition, the
structure with the lowest energy for [MnIIITPPS]3- is the one where the H moves from
position 3 to 78, with an energy change of + 2.25 eV. See Table 5.2 and 5.3 for all the
energy changes after moving one H from the porphyrin ring to the negative benzene-
sulfonate functional groups on [CoIIITPPS]3- and [MnIIITPPS]3-.
Table 5.2 Energy differences between the product and reactant when H moves from the
porphyrin ring to the negative benzenesulfonate functional group on [CoIIITPPS]3-
H Position
Energy at B3-LYP/6-31+G(2d, p)+LANL2DZ //PM7 level (eV)
O position 77 O position 78 O position 79
1 2.1132 2.6163 2.1173
2 2.6728 2.7117 2.6563
3 2.6083 2.1081 2.1079
4 2.7026 2.6958 2.6473
5 2.8326 2.5281 2.8485
6 2.7556 2.7633 2.7872
7 2.6974 2.7047 2.7062
8 2.9214 2.9173 2.9496
71
Table 5.3 Energy differences between the product and reactant when H moves from the
porphyrin ring to the negative benzenesulfonate functional group on [MnIIITPPS]3-
H Position
Energy at B3-LYP/6-31+G(2d, p)+LANL2DZ //PM7 level (eV)
O position 77 O position 78 O position 79
1 2.2551 2.8286 2.2556
2 2.8828 2.8959 2.9177
3 2.8392 2.2511 2.2512
4 2.9288 2.9188 2.8825
5 2.5025 2.5114 2.5122
6 2.7515 2.7534 2.7670
7 2.5143 2.5144 2.5114
8 2.7680 2.7638 2.7498
The energy changes of H movement on [CoIIITPPS]3- (2.11 eV) and [MnIIITPPS]3-
(2.25 eV) are smaller than those of H movement on negative benzenesulfonate ion
(2.82 eV: ion a to ion b). In addition, energies of [CoIIITPPS]3- and [MnIIITPPS]3- were
calculated at B3-LYP/6-31+G(2d, p)+LANL2DZ//PM7 level, and PM7 is a lower level of
theory compared with the B3-LYP/6-31+G(2d, p)+LANL2DZ, so it is not as accurate as
at B3-LYP/6-31+G(2d, p)+LANL2DZ. The energies of the products after H movement
will be lower if using the B3-LYP/6-31+G(2d, p)+LANL2DZ basis set, and the energy
changes might also be lower than 2.11 eV and 2.25 eV for [CoIIITPPS]3- and
[MnIIITPPS]3-.
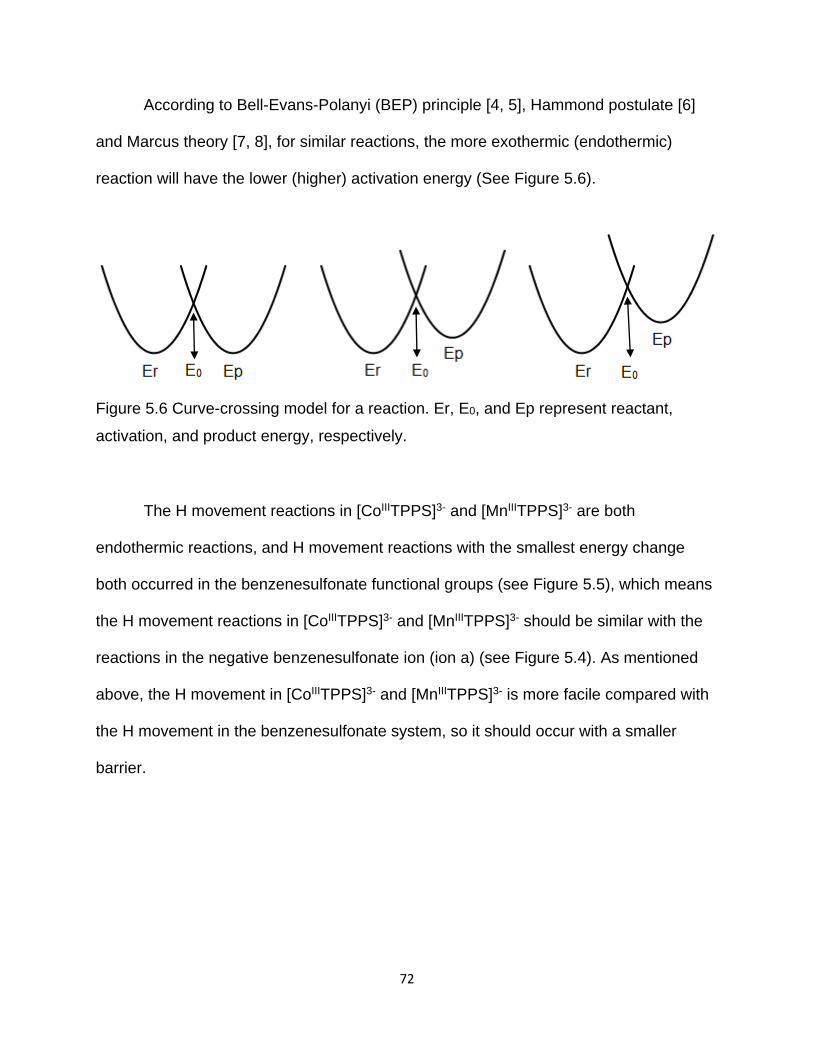
72
According to Bell-Evans-Polanyi (BEP) principle [4, 5], Hammond postulate [6]
and Marcus theory [7, 8], for similar reactions, the more exothermic (endothermic)
reaction will have the lower (higher) activation energy (See Figure 5.6).
Figure 5.6 Curve-crossing model for a reaction. Er, E0, and Ep represent reactant,
activation, and product energy, respectively.
The H movement reactions in [CoIIITPPS]3- and [MnIIITPPS]3- are both
endothermic reactions, and H movement reactions with the smallest energy change
both occurred in the benzenesulfonate functional groups (see Figure 5.5), which means
the H movement reactions in [CoIIITPPS]3- and [MnIIITPPS]3- should be similar with the
reactions in the negative benzenesulfonate ion (ion a) (see Figure 5.4). As mentioned
above, the H movement in [CoIIITPPS]3- and [MnIIITPPS]3- is more facile compared with
the H movement in the benzenesulfonate system, so it should occur with a smaller
barrier.
73
5.3 References
[1] Ben-Ari J, Etinger A, Weisz A, Mandelbaum A. Hydrogen-shift isomerism: mass
spectrometry of isomeric benzenesulfonate and 2-, 3- and 4-dehydrobenzenesulfonic
acid anions in the gas phase. Journal of Mass Spectrometry. 2005;40(8):1064-71.
[2] Gozet T, Huynh L, Bohme D. Collision-induced dissociation of tetraphenyl iron
and manganese porphyrin ions by electrospray ionization mass spectrometry.
International Journal of Mass Spectrometry. 2009;279(2-3):113-8.
[3] Foresman JB, Frisch A. Exploring chemistry with electronic structure methods.
2nd ed. Pittsburgh, PA: Gaussian, Inc.; 1996.
[4] Bell RP. The Theory of Reactions Involving Proton Transfers. Proceedings of the
Royal Society of London A. 1936;154:414-29.
[5] Evans MG, Polanyi M. Further considerations on the thermodynamics of
chemical equilibria and reaction rates. Transactions of the Faraday Society.
1936;32(2):1333-59.
[6] Hammond GS. A correlation of reaction rates. Journal of the American Chemical
Society. 1955;77(2):334-8.
[7] Jensen F. Introduction to computational chemistry. 2nd ed. Chichester, England ;
Hoboken, NJ: John Wiley & Sons; 2007.
[8] Marcus RA. Theoretical relations among rate constants, barriers, and Broensted
slopes of chemical reactions. Journal of Physical Chemistry. 1968;72(3):891-9.
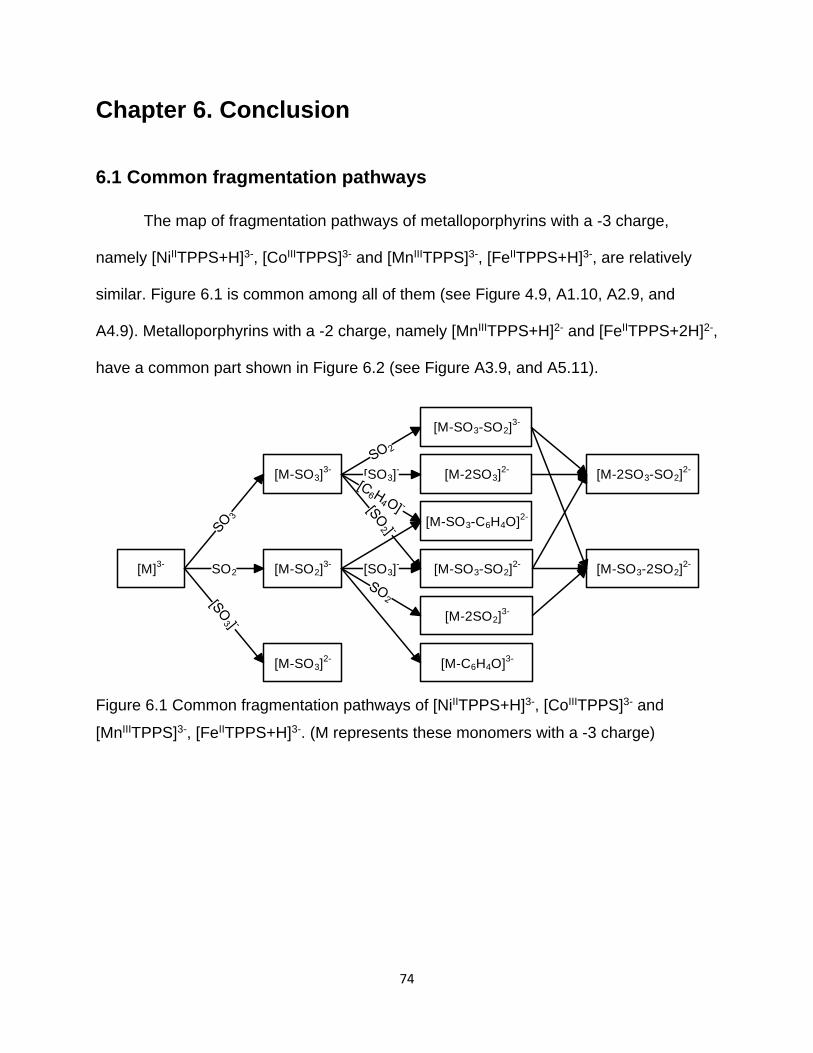
74
Chapter 6. Conclusion
6.1 Common fragmentation pathways
The map of fragmentation pathways of metalloporphyrins with a -3 charge,
namely [NiIITPPS+H]3-, [CoIIITPPS]3- and [MnIIITPPS]3-, [FeIITPPS+H]3-, are relatively
similar. Figure 6.1 is common among all of them (see Figure 4.9, A1.10, A2.9, and
A4.9). Metalloporphyrins with a -2 charge, namely [MnIIITPPS+H]2- and [FeIITPPS+2H]2-,
have a common part shown in Figure 6.2 (see Figure A3.9, and A5.11).
[M]3-
[M-SO3]3-
[M-SO3-SO2]2-
[M-SO2]3-
[M-2SO2]3-
[M-C6H4O]3-
[M-SO3]2-
[M-SO3-C6H4O]2-
[M-2SO3]2-
[M-SO3-SO2]3-
[M-2SO3-SO2]2-
SO2
[SO3]-
[SO3]-
[M-SO3-2SO2]2-
Figure 6.1 Common fragmentation pathways of [NiIITPPS+H]3-, [CoIIITPPS]3- and
[MnIIITPPS]3-, [FeIITPPS+H]3-. (M represents these monomers with a -3 charge)
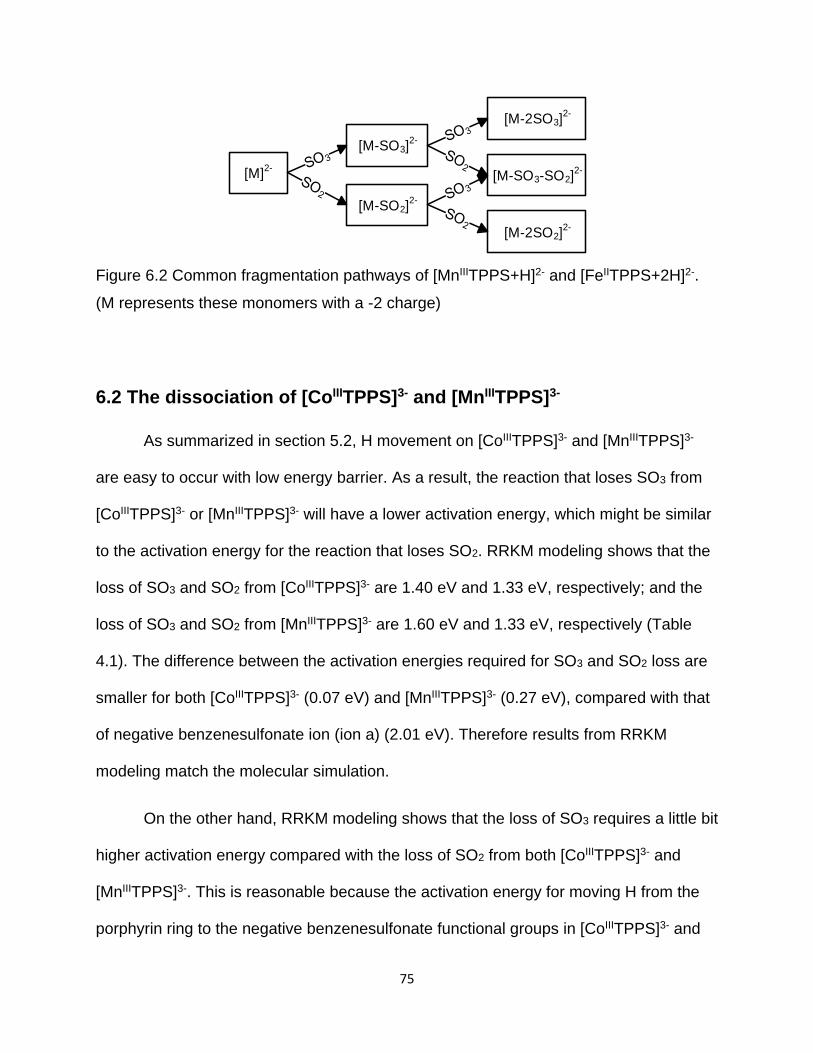
75
[M]2-
[M-SO3]2-
[M-2SO2]2-
[M-SO2]2-
[M-2SO3]2-
[M-SO3-SO2]2-
Figure 6.2 Common fragmentation pathways of [MnIIITPPS+H]2- and [FeIITPPS+2H]2-.
(M represents these monomers with a -2 charge)
6.2 The dissociation of [CoIIITPPS]3- and [MnIIITPPS]3-
As summarized in section 5.2, H movement on [CoIIITPPS]3- and [MnIIITPPS]3-
are easy to occur with low energy barrier. As a result, the reaction that loses SO3 from
[CoIIITPPS]3- or [MnIIITPPS]3- will have a lower activation energy, which might be similar
to the activation energy for the reaction that loses SO2. RRKM modeling shows that the
loss of SO3 and SO2 from [CoIIITPPS]3- are 1.40 eV and 1.33 eV, respectively; and the
loss of SO3 and SO2 from [MnIIITPPS]3- are 1.60 eV and 1.33 eV, respectively (Table
4.1). The difference between the activation energies required for SO3 and SO2 loss are
smaller for both [CoIIITPPS]3- (0.07 eV) and [MnIIITPPS]3- (0.27 eV), compared with that
of negative benzenesulfonate ion (ion a) (2.01 eV). Therefore results from RRKM
modeling match the molecular simulation.
On the other hand, RRKM modeling shows that the loss of SO3 requires a little bit
higher activation energy compared with the loss of SO2 from both [CoIIITPPS]3- and
[MnIIITPPS]3-. This is reasonable because the activation energy for moving H from the
porphyrin ring to the negative benzenesulfonate functional groups in [CoIIITPPS]3- and
76
[MnIIITPPS]3- might be still higher than the activation energy of the loss of SO2 and SO3
from [CoIIITPPS]3- and [MnIIITPPS]3-, even though they are more facile than in the
benzenesulfonate system (Figure 5.4). Therefore, the activation energies for the
reactions of [CoIIITPPS]3- and [MnIIITPPS]3- that lose SO3 should actually be the
activation energies for moving H from the porphyrin ring to the negative
benzenesulfonate functional groups in [CoIIITPPS]3- and [MnIIITPPS]3-.
6.3 The dissociation of [NiIITPPS+H]3-, [FeIITPPS+2H]2-, [FeIITPPS+H]3- and [MnIIITPPS+H]2-
As mentioned in section 5.2, [NiIITPPS+H]3-, [MnIIITPPS+H]2-, [FeIITPPS+H]3-,
and [FeIITPPS+2H]2- can directly lose SO2 and SO3 because they have both neutral and
negative benzenesulfonate functional groups. Neutral benzenesulfonate can directly
lose SO2 and SO3 with activation energies of 2.62 eV and 2.27 eV, respectively; and
negative benzenesulfonate ion (ion a) can directly lose SO2 with an activation energy of
2.32 eV (Table 5.1). As a result, when both -C6H4SO3- and -C6H4SO3H are present in
metalloporphyrins, the following reactions should occur: a) SO3 loss (2.27 eV) directly
from -C6H4SO3H; b) SO2 loss (2.32 eV) will prefer to directly occur on -C6H4SO3-, rather
than on -C6H4SO3H. Since 2.27 and 2.32 eV are similar, the activation energies for
reactions that lose SO2 and SO3 from [NiIITPPS+H]3-, [MnIIITPPS+H]2-, [FeIITPPS+H]3-,
and [FeIITPPS+2H]2- should be very similar, and SO3 loss would requires a little bit
lower activation energy (2.27 eV < 2.32 eV).
When it comes to [NiIITPPS+H]3- and [FeIITPPS+2H]2-, the molecular simulations
above match the RRKM modeling perfectly (see Table 4.1 for activation energies).
77
[NiIITPPS+H]3- needs 1.30 eV to lose SO3, and 1.48 eV to lose SO2. The activation
energies are relatively close and 1.30 eV is a little bit lower than 1.48 eV.
[FeIITPPS+2H]2- needs 1.47 eV for SO3 and 1.49 eV for SO2 loss, which is almost the
same activation energy.
However, the RRKM modeling for [FeIITPPS+H]3- and [MnIIITPPS+H]2- do not
agree with the molecular simulations performed in Chapter 5. [FeIITPPS+H]3- requires
0.80 and 0.55 eV to lose SO3 and SO2, respectively (see Table 4.1). This case is easy
to understand, because the H loss from almost all of its fragments and the parent ion
[FeIITPPS+H]3- disrupt the dissociation process (see Figure 6.3 and Figure A4.9).
Considering there are almost 100% [FeIITPPS-SO2]3- (m/z: 306.7), it might only come
from the fragmentation of [FeIITPPS]3-, instead of [FeIITPPS+H-SO2]3-. The real
dissociation channels might be a mix of the following processes: a) [FeIITPPS+H]3- to
[FeIITPPS]3-, b) SO3 loss from both [FeIITPPS+H]3-, and c) SO3 and SO2 loss from
[FeIITPPS]3-.
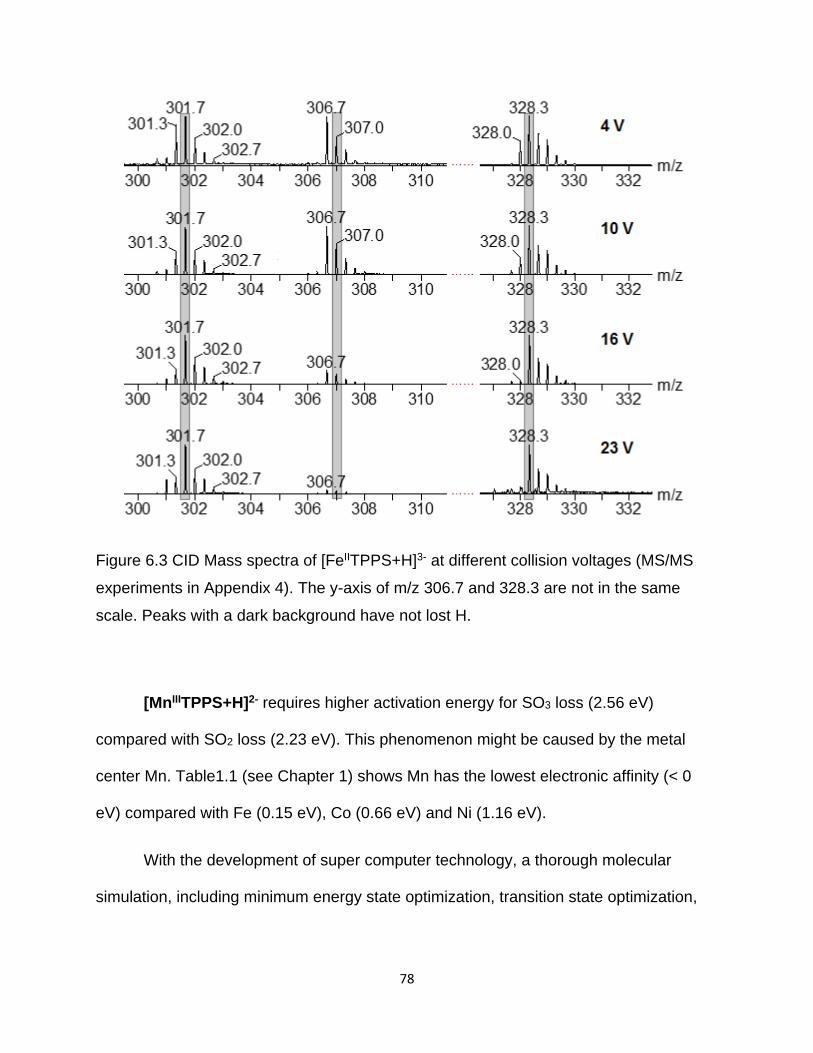
78
Figure 6.3 CID Mass spectra of [FeIITPPS+H]3- at different collision voltages (MS/MS
experiments in Appendix 4). The y-axis of m/z 306.7 and 328.3 are not in the same
scale. Peaks with a dark background have not lost H.
[MnIIITPPS+H]2- requires higher activation energy for SO3 loss (2.56 eV)
compared with SO2 loss (2.23 eV). This phenomenon might be caused by the metal
center Mn. Table1.1 (see Chapter 1) shows Mn has the lowest electronic affinity (< 0
eV) compared with Fe (0.15 eV), Co (0.66 eV) and Ni (1.16 eV).
With the development of super computer technology, a thorough molecular
simulation, including minimum energy state optimization, transition state optimization,

79
and intrinsic reaction coordinate calculation on the dissociation of metalloporphyrins,
should be able to be performed to verify the conclusion of this research in a few years.
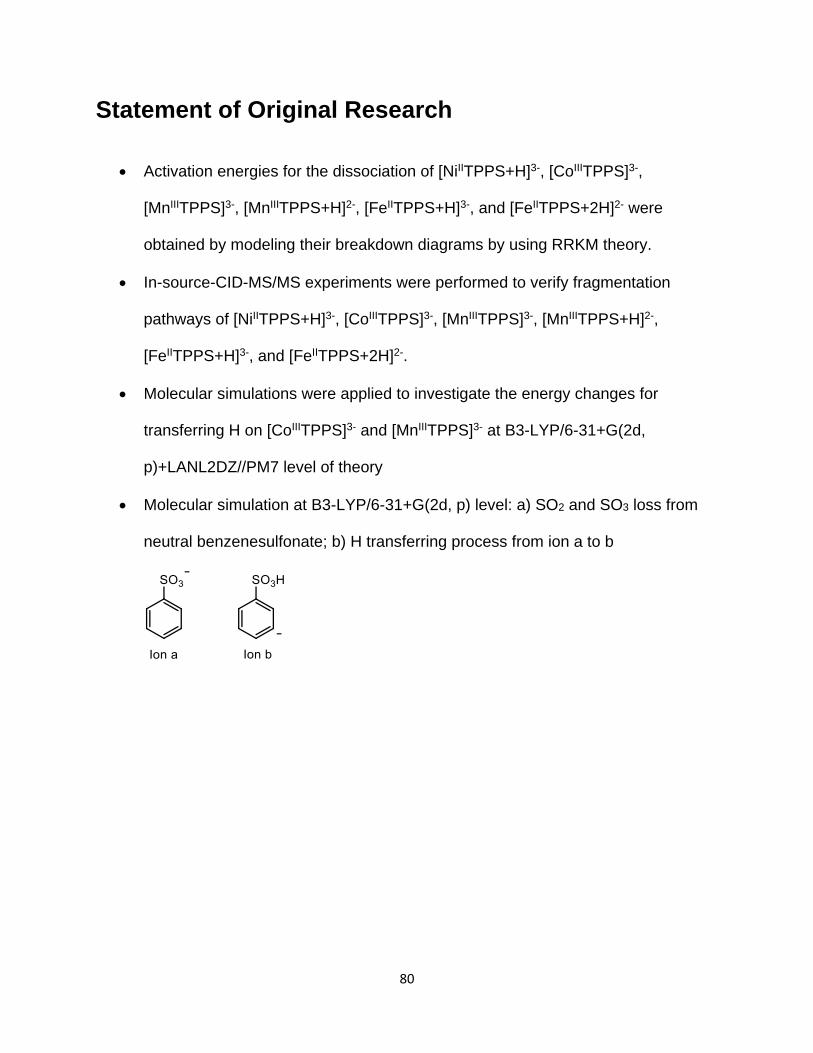
80
Statement of Original Research
Activation energies for the dissociation of [NiIITPPS+H]3-, [CoIIITPPS]3-,
[MnIIITPPS]3-, [MnIIITPPS+H]2-, [FeIITPPS+H]3-, and [FeIITPPS+2H]2- were
obtained by modeling their breakdown diagrams by using RRKM theory.
In-source-CID-MS/MS experiments were performed to verify fragmentation
pathways of [NiIITPPS+H]3-, [CoIIITPPS]3-, [MnIIITPPS]3-, [MnIIITPPS+H]2-,
[FeIITPPS+H]3-, and [FeIITPPS+2H]2-.
Molecular simulations were applied to investigate the energy changes for
transferring H on [CoIIITPPS]3- and [MnIIITPPS]3- at B3-LYP/6-31+G(2d,
p)+LANL2DZ//PM7 level of theory
Molecular simulation at B3-LYP/6-31+G(2d, p) level: a) SO2 and SO3 loss from
neutral benzenesulfonate; b) H transferring process from ion a to b
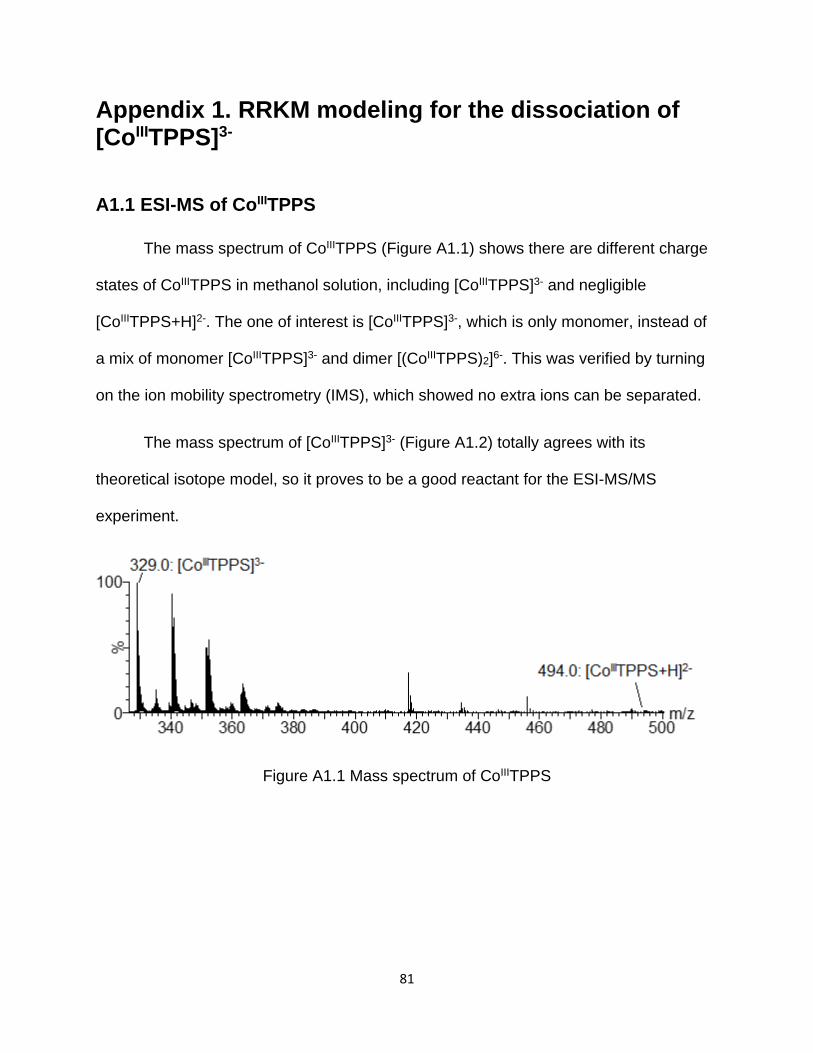
81
Appendix 1. RRKM modeling for the dissociation of [CoIIITPPS]3-
A1.1 ESI-MS of CoIIITPPS
The mass spectrum of CoIIITPPS (Figure A1.1) shows there are different charge
states of CoIIITPPS in methanol solution, including [CoIIITPPS]3- and negligible
[CoIIITPPS+H]2-. The one of interest is [CoIIITPPS]3-, which is only monomer, instead of
a mix of monomer [CoIIITPPS]3- and dimer [(CoIIITPPS)2]6-. This was verified by turning
on the ion mobility spectrometry (IMS), which showed no extra ions can be separated.
The mass spectrum of [CoIIITPPS]3- (Figure A1.2) totally agrees with its
theoretical isotope model, so it proves to be a good reactant for the ESI-MS/MS
experiment.
Figure A1.1 Mass spectrum of CoIIITPPS
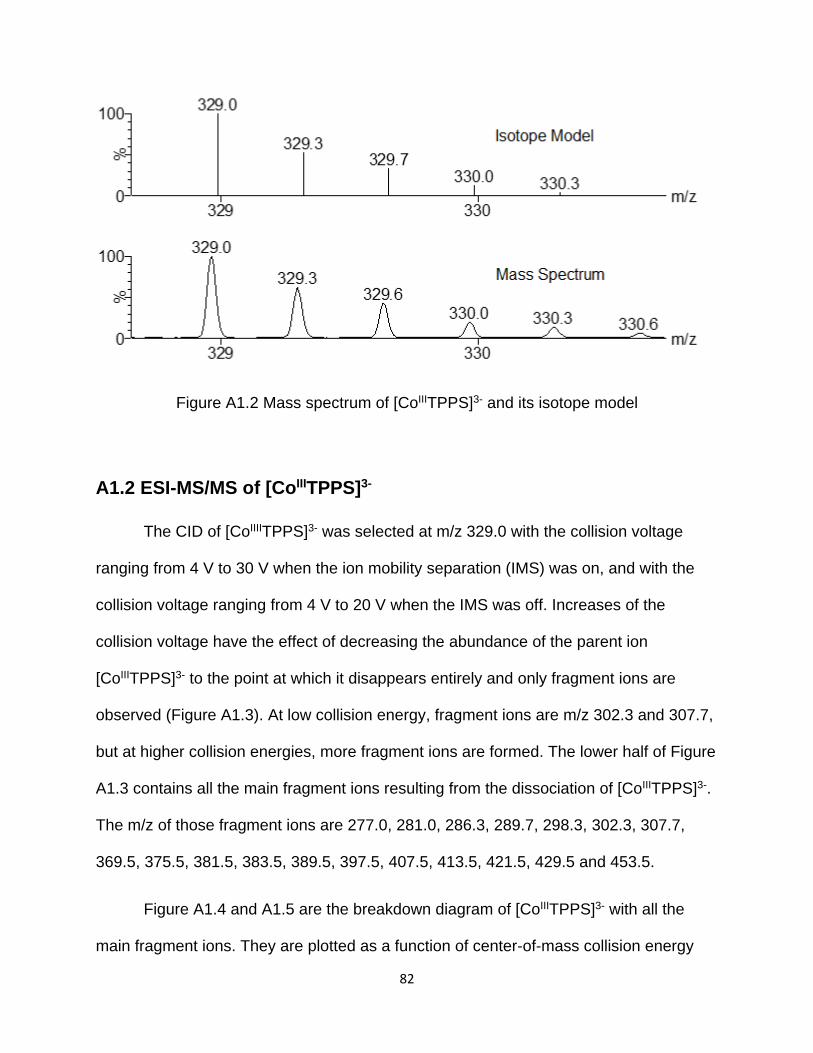
82
Figure A1.2 Mass spectrum of [CoIIITPPS]3- and its isotope model
A1.2 ESI-MS/MS of [CoIIITPPS]3-
The CID of [CoIIIITPPS]3- was selected at m/z 329.0 with the collision voltage
ranging from 4 V to 30 V when the ion mobility separation (IMS) was on, and with the
collision voltage ranging from 4 V to 20 V when the IMS was off. Increases of the
collision voltage have the effect of decreasing the abundance of the parent ion
[CoIIITPPS]3- to the point at which it disappears entirely and only fragment ions are
observed (Figure A1.3). At low collision energy, fragment ions are m/z 302.3 and 307.7,
but at higher collision energies, more fragment ions are formed. The lower half of Figure
A1.3 contains all the main fragment ions resulting from the dissociation of [CoIIITPPS]3-.
The m/z of those fragment ions are 277.0, 281.0, 286.3, 289.7, 298.3, 302.3, 307.7,
369.5, 375.5, 381.5, 383.5, 389.5, 397.5, 407.5, 413.5, 421.5, 429.5 and 453.5.
Figure A1.4 and A1.5 are the breakdown diagram of [CoIIITPPS]3- with all the
main fragment ions. They are plotted as a function of center-of-mass collision energy
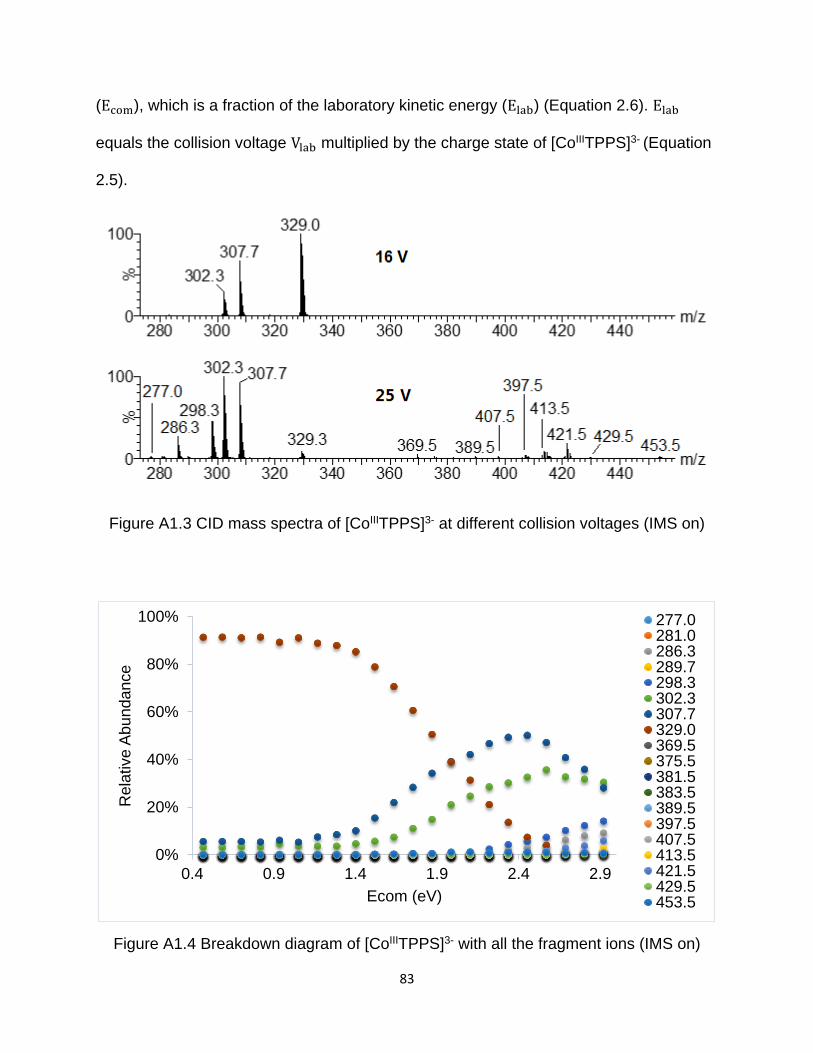
83
(Ecom), which is a fraction of the laboratory kinetic energy (Elab) (Equation 2.6). Elab
equals the collision voltage Vlab multiplied by the charge state of [CoIIITPPS]3- (Equation
2.5).
Figure A1.3 CID mass spectra of [CoIIITPPS]3- at different collision voltages (IMS on)
Figure A1.4 Breakdown diagram of [CoIIITPPS]3- with all the fragment ions (IMS on)
0%
20%
40%
60%
80%
100%
0.4 0.9 1.4 1.9 2.4 2.9
Rela
tive A
bun
dance
Ecom (eV)
277.0281.0286.3289.7298.3302.3307.7329.0369.5375.5381.5383.5389.5397.5407.5413.5421.5429.5453.5
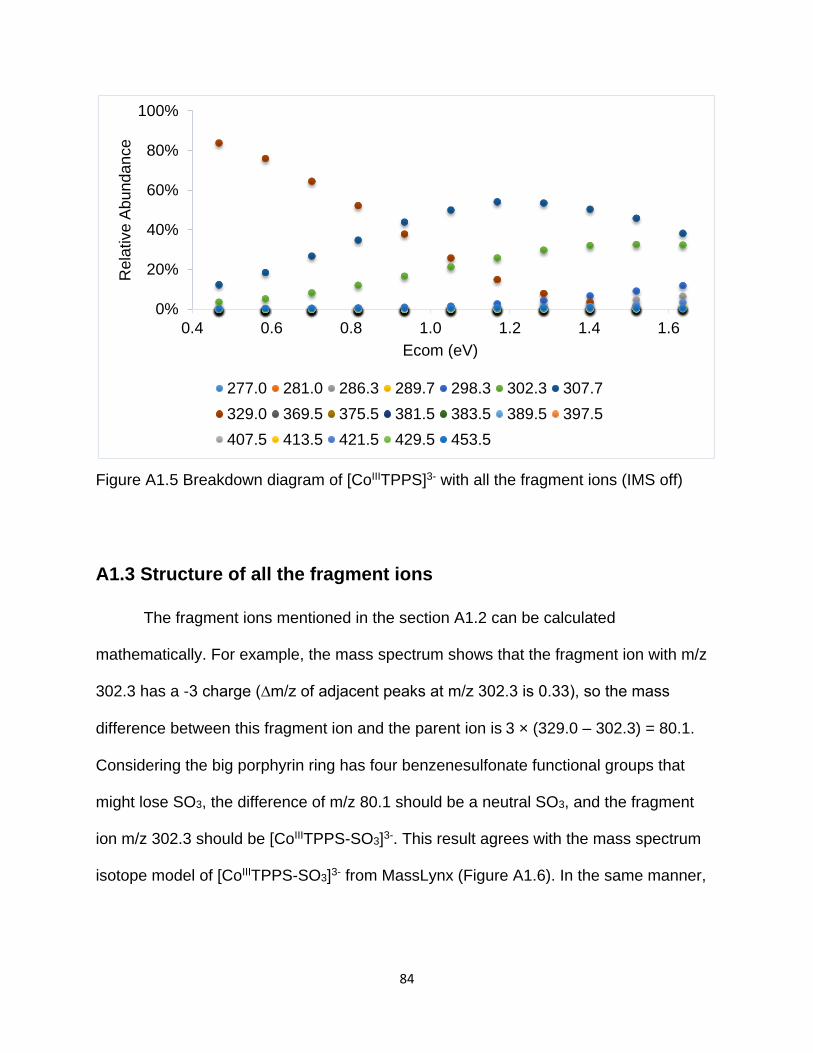
84
Figure A1.5 Breakdown diagram of [CoIIITPPS]3- with all the fragment ions (IMS off)
A1.3 Structure of all the fragment ions
The fragment ions mentioned in the section A1.2 can be calculated
mathematically. For example, the mass spectrum shows that the fragment ion with m/z
302.3 has a -3 charge (∆m/z of adjacent peaks at m/z 302.3 is 0.33), so the mass
difference between this fragment ion and the parent ion is 3 × (329.0 – 302.3) = 80.1.
Considering the big porphyrin ring has four benzenesulfonate functional groups that
might lose SO3, the difference of m/z 80.1 should be a neutral SO3, and the fragment
ion m/z 302.3 should be [CoIIITPPS-SO3]3-. This result agrees with the mass spectrum
isotope model of [CoIIITPPS-SO3]3- from MassLynx (Figure A1.6). In the same manner,
0%
20%
40%
60%
80%
100%
0.4 0.6 0.8 1.0 1.2 1.4 1.6
Rela
tive A
bundance
Ecom (eV)
277.0 281.0 286.3 289.7 298.3 302.3 307.7
329.0 369.5 375.5 381.5 383.5 389.5 397.5
407.5 413.5 421.5 429.5 453.5
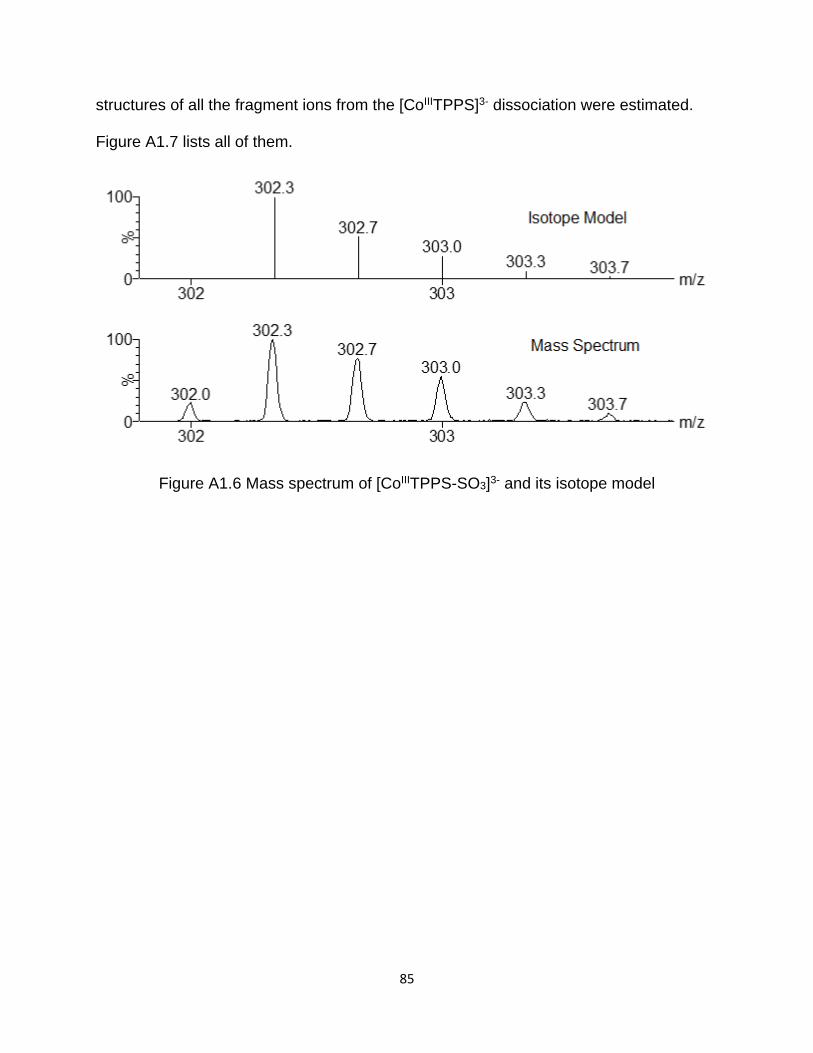
85
structures of all the fragment ions from the [CoIIITPPS]3- dissociation were estimated.
Figure A1.7 lists all of them.
Figure A1.6 Mass spectrum of [CoIIITPPS-SO3]3- and its isotope model
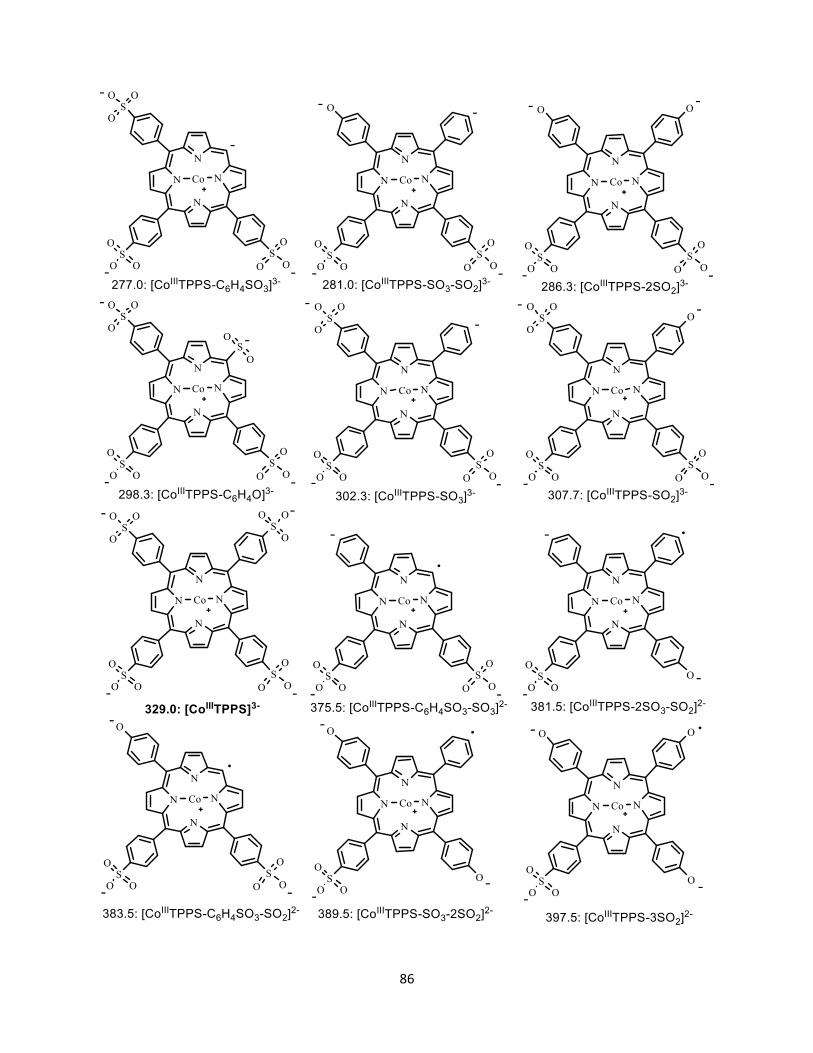
86
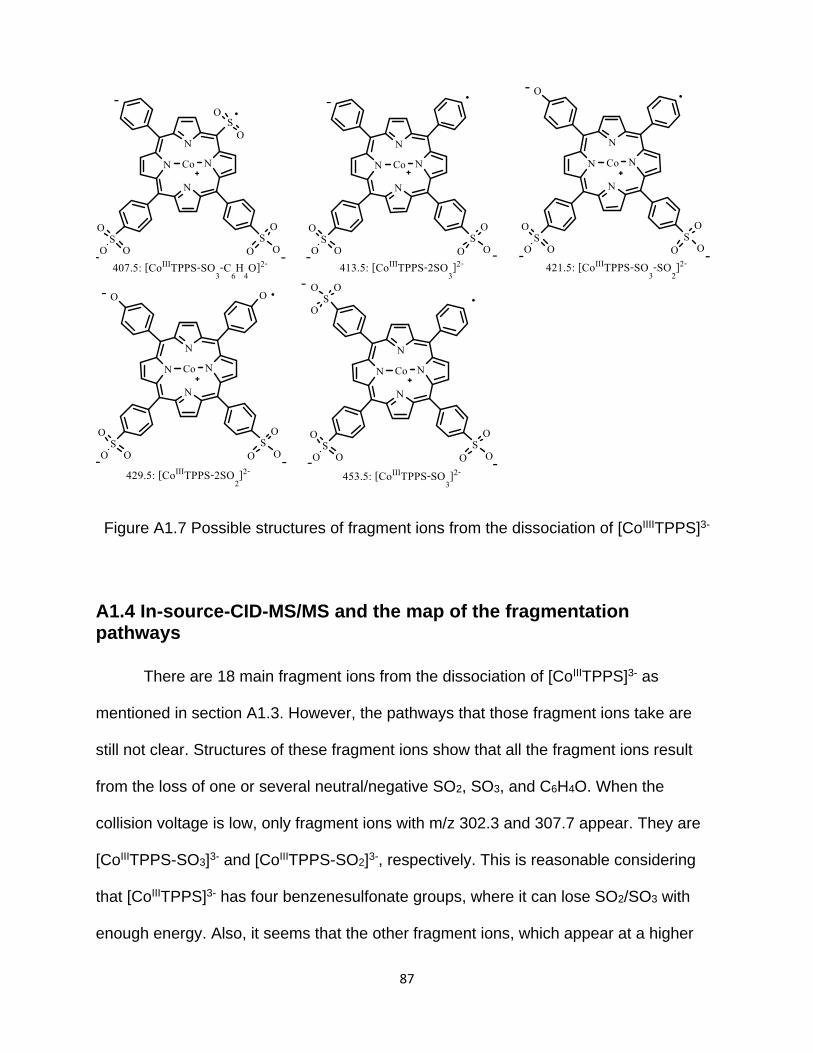
87
Figure A1.7 Possible structures of fragment ions from the dissociation of [CoIIIITPPS]3-
A1.4 In-source-CID-MS/MS and the map of the fragmentation pathways
There are 18 main fragment ions from the dissociation of [CoIIITPPS]3- as
mentioned in section A1.3. However, the pathways that those fragment ions take are
still not clear. Structures of these fragment ions show that all the fragment ions result
from the loss of one or several neutral/negative SO2, SO3, and C6H4O. When the
collision voltage is low, only fragment ions with m/z 302.3 and 307.7 appear. They are
[CoIIITPPS-SO3]3- and [CoIIITPPS-SO2]3-, respectively. This is reasonable considering
that [CoIIITPPS]3- has four benzenesulfonate groups, where it can lose SO2/SO3 with
enough energy. Also, it seems that the other fragment ions, which appear at a higher
88
collision voltage, may all come from the breakup of the two main fragment ions
[CoIIITPPS-SO3]3- and [CoIIITPPS-SO2]3-.
To verify this assumption, the in-source-CID-MS/MS of [CoIIITPPS-SO3]3- and
[CoIIITPPS-SO2]3- was carried out. The in-source-CID used a high sampling cone
energy of 52 V to break up the parent ion in the source. Then all the negatively charged
fragment ions continued to the quadrupole, where ions with m/z 302.3 or 307.7 were
selected and their CID mass spectra obtained.
Figure A1.8 and A1.9 represent the breakdown diagrams of m/z 302.3 and m/z
307.7 from collision voltage 4 V to 20 V, in which the center-of mass Ecom is established
on the x-axis (Equation 2.5 and 2.6). There are six overlapped fragment ions present in
both the in-source-CID-MS/MS of m/z 302.3 and m/z 307.7. They are [CoIIITPPS-
C6H4SO3- SO3]2-, [CoIIITPPS-2SO3-SO2]2-, [CoIIITPPS-C6H4SO3- SO2]2-, [CoIIITPPS-SO3-
2SO2]2-, [CoIIITPPS-C6H4O- SO3]2-, and [CoIIITPPS-SO3-SO2]2-. All of the other fragment
ions, with exception of m/z 453.5, are only present in the breakdown of either m/z 302.3
or m/z 307.7. See Figure A1.10 for the dissociation pathways of [CoIIITPPS]3-.
The fragment ion with m/z 453.5 is an independent channel: [SO3]- loss from
CoIIITPPS]3- directly. However, this channel is ignored because it has a pretty low
relative abundance (maximum: 0.68%) compared with the other two channels, and it
only appear at a high collision energy. Ignoring this channel will not influence the
activation energy calculations of the other two channels.
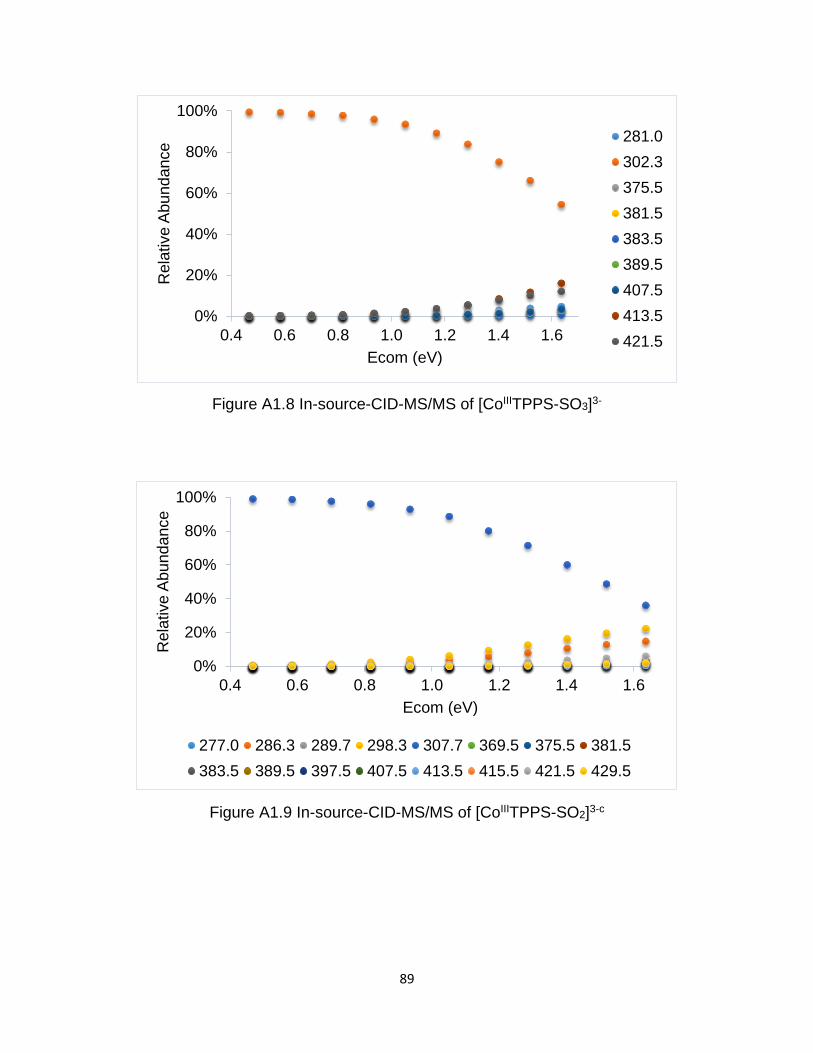
89
Figure A1.8 In-source-CID-MS/MS of [CoIIITPPS-SO3]3-
Figure A1.9 In-source-CID-MS/MS of [CoIIITPPS-SO2]3-c
0%
20%
40%
60%
80%
100%
0.4 0.6 0.8 1.0 1.2 1.4 1.6
Rela
tive A
bundance
Ecom (eV)
281.0
302.3
375.5
381.5
383.5
389.5
407.5
413.5
421.5
0%
20%
40%
60%
80%
100%
0.4 0.6 0.8 1.0 1.2 1.4 1.6
Rela
tive A
bundance
Ecom (eV)
277.0 286.3 289.7 298.3 307.7 369.5 375.5 381.5
383.5 389.5 397.5 407.5 413.5 415.5 421.5 429.5
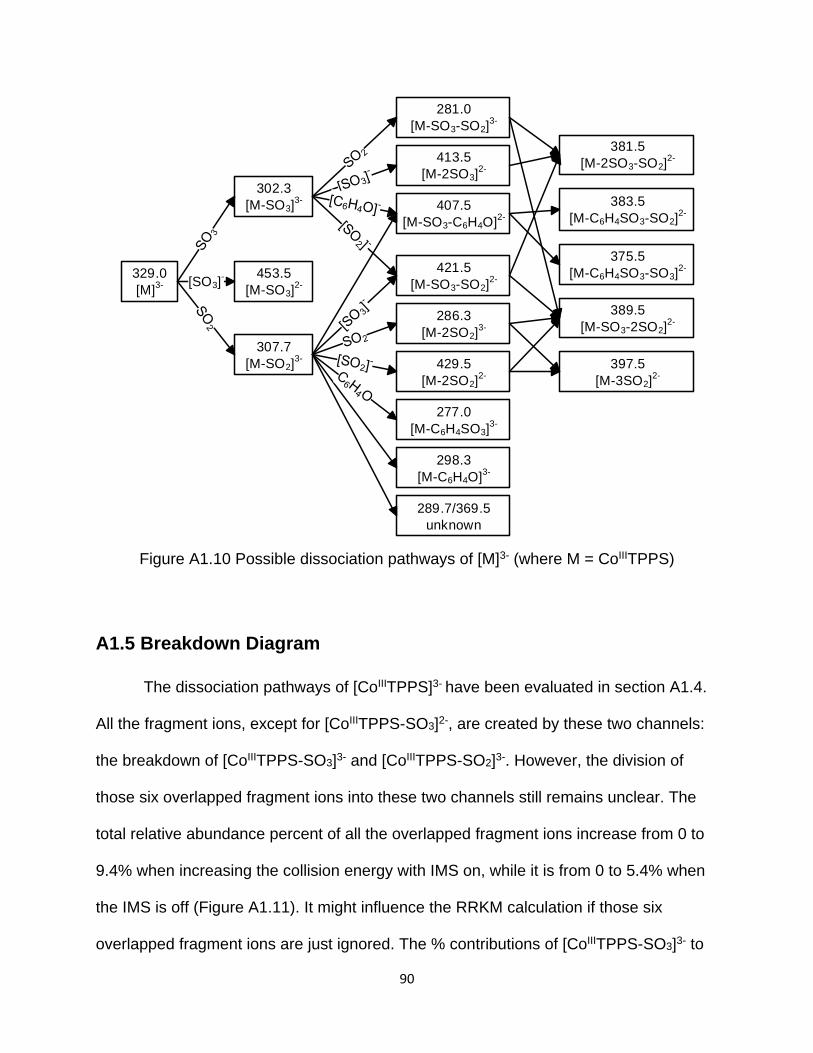
90
329.0
[M]3-
302.3
[M-SO3]3-
421.5
[M-SO3-SO2]2-
307.7
[M-SO2]3-
286.3
[M-2SO2]3-
298.3
[M-C6H4O]3-
453.5
[M-SO3]2-
407.5
[M-SO3-C6H4O]2-
413.5
[M-2SO3]2-
375.5
[M-C6H4SO3-SO3]2-
281.0
[M-SO3-SO2]3-
389.5
[M-SO3-2SO2]2-
[SO3]-
277.0
[M-C6H4SO3]3-
383.5
[M-C6H4SO3-SO2]2-
381.5
[M-2SO3-SO2]2-
397.5
[M-3SO2]2-
289.7/369.5
unknown
429.5
[M-2SO2]2-
Figure A1.10 Possible dissociation pathways of [M]3- (where M = CoIIITPPS)
A1.5 Breakdown Diagram
The dissociation pathways of [CoIIITPPS]3- have been evaluated in section A1.4.
All the fragment ions, except for [CoIIITPPS-SO3]2-, are created by these two channels:
the breakdown of [CoIIITPPS-SO3]3- and [CoIIITPPS-SO2]3-. However, the division of
those six overlapped fragment ions into these two channels still remains unclear. The
total relative abundance percent of all the overlapped fragment ions increase from 0 to
9.4% when increasing the collision energy with IMS on, while it is from 0 to 5.4% when
the IMS is off (Figure A1.11). It might influence the RRKM calculation if those six
overlapped fragment ions are just ignored. The % contributions of [CoIIITPPS-SO3]3- to
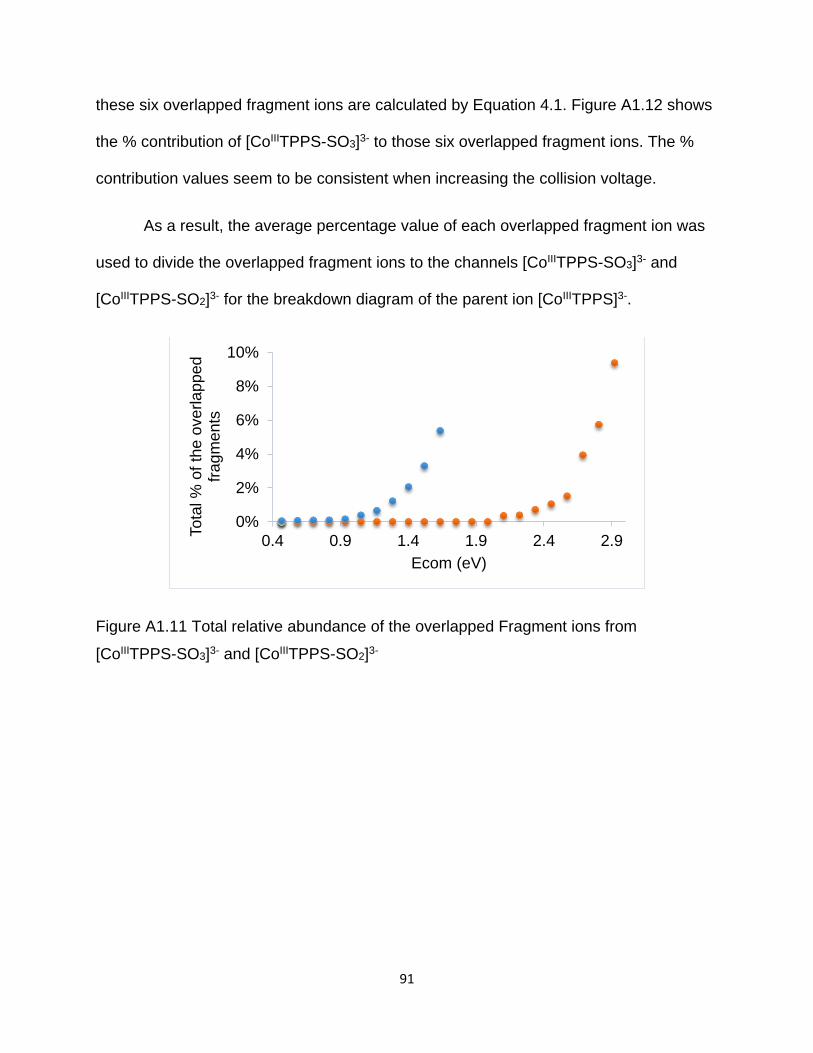
91
these six overlapped fragment ions are calculated by Equation 4.1. Figure A1.12 shows
the % contribution of [CoIIITPPS-SO3]3- to those six overlapped fragment ions. The %
contribution values seem to be consistent when increasing the collision voltage.
As a result, the average percentage value of each overlapped fragment ion was
used to divide the overlapped fragment ions to the channels [CoIIITPPS-SO3]3- and
[CoIIITPPS-SO2]3- for the breakdown diagram of the parent ion [CoIIITPPS]3-.
Figure A1.11 Total relative abundance of the overlapped Fragment ions from
[CoIIITPPS-SO3]3- and [CoIIITPPS-SO2]3-
0%
2%
4%
6%
8%
10%
0.4 0.9 1.4 1.9 2.4 2.9
Tota
l %
of
the o
verlapped
fragm
ents
Ecom (eV)
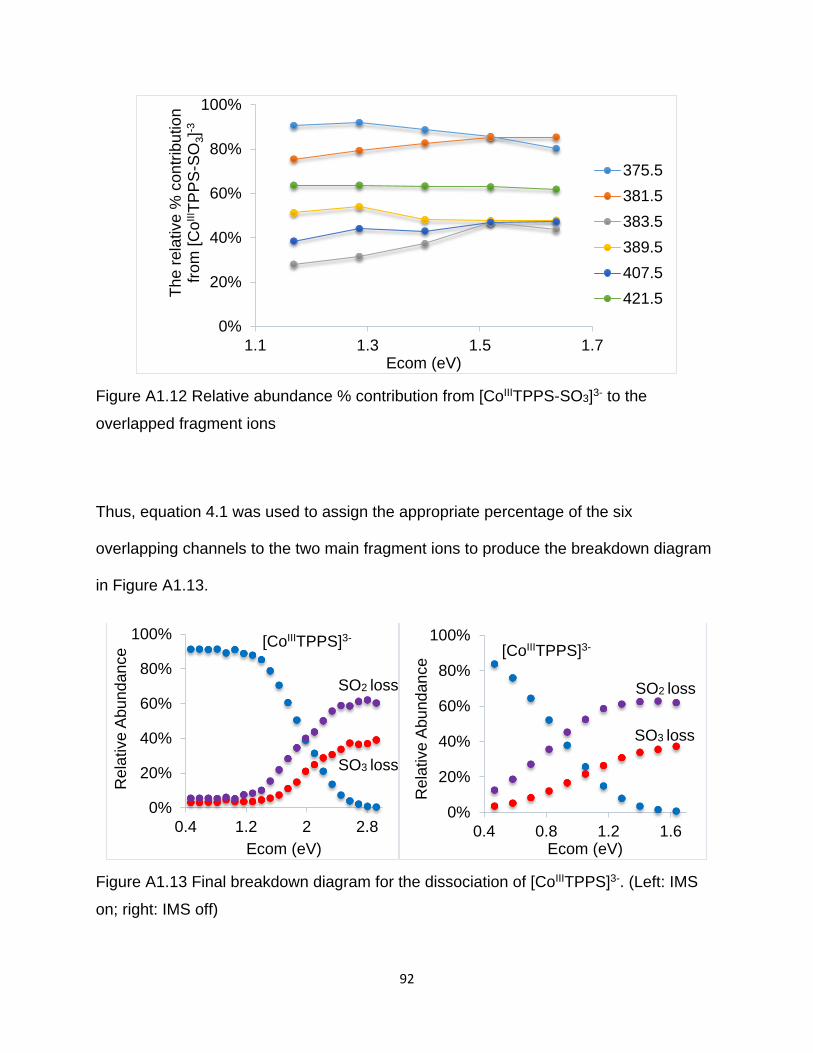
92
Figure A1.12 Relative abundance % contribution from [CoIIITPPS-SO3]3- to the
overlapped fragment ions
Thus, equation 4.1 was used to assign the appropriate percentage of the six
overlapping channels to the two main fragment ions to produce the breakdown diagram
in Figure A1.13.
Figure A1.13 Final breakdown diagram for the dissociation of [CoIIITPPS]3-. (Left: IMS
on; right: IMS off)
0%
20%
40%
60%
80%
100%
1.1 1.3 1.5 1.7
The r
ela
tive %
contr
ibution
from
[C
oII
I TP
PS
-SO
3]-
3
Ecom (eV)
375.5
381.5
383.5
389.5
407.5
421.5
0%
20%
40%
60%
80%
100%
0.4 1.2 2 2.8
Rela
tive A
bundance
Ecom (eV)
0%
20%
40%
60%
80%
100%
0.4 0.8 1.2 1.6
Rela
tive A
bu
ndance
Ecom (eV)
[CoIIITPPS]3-
SO3 loss
SO2 loss
[CoIIITPPS]3-
SO3 loss
SO2 loss
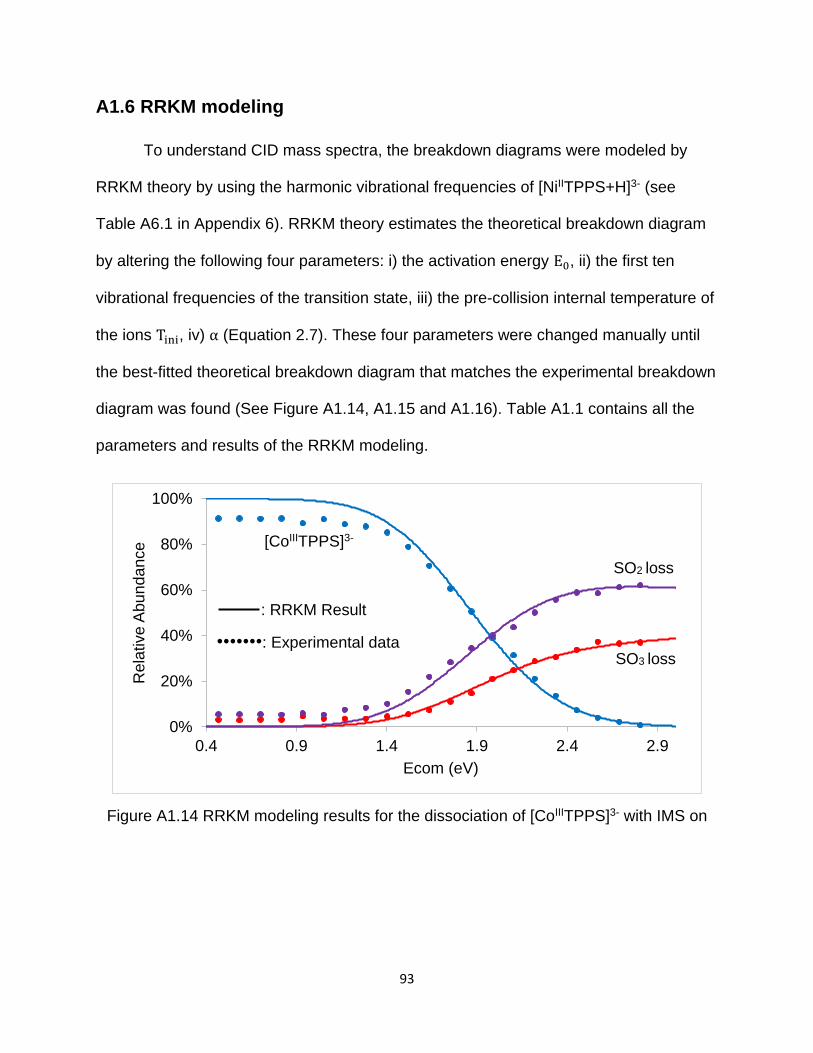
93
A1.6 RRKM modeling
To understand CID mass spectra, the breakdown diagrams were modeled by
RRKM theory by using the harmonic vibrational frequencies of [NiIITPPS+H]3- (see
Table A6.1 in Appendix 6). RRKM theory estimates the theoretical breakdown diagram
by altering the following four parameters: i) the activation energy E0, ii) the first ten
vibrational frequencies of the transition state, iii) the pre-collision internal temperature of
the ions Tini, iv) α (Equation 2.7). These four parameters were changed manually until
the best-fitted theoretical breakdown diagram that matches the experimental breakdown
diagram was found (See Figure A1.14, A1.15 and A1.16). Table A1.1 contains all the
parameters and results of the RRKM modeling.
Figure A1.14 RRKM modeling results for the dissociation of [CoIIITPPS]3- with IMS on
0%
20%
40%
60%
80%
100%
0.4 0.9 1.4 1.9 2.4 2.9
Rela
tive A
bundance
Ecom (eV)
: RRKM Result
•••••••: Experimental data
SO2 loss
SO3 loss
[CoIIITPPS]3-
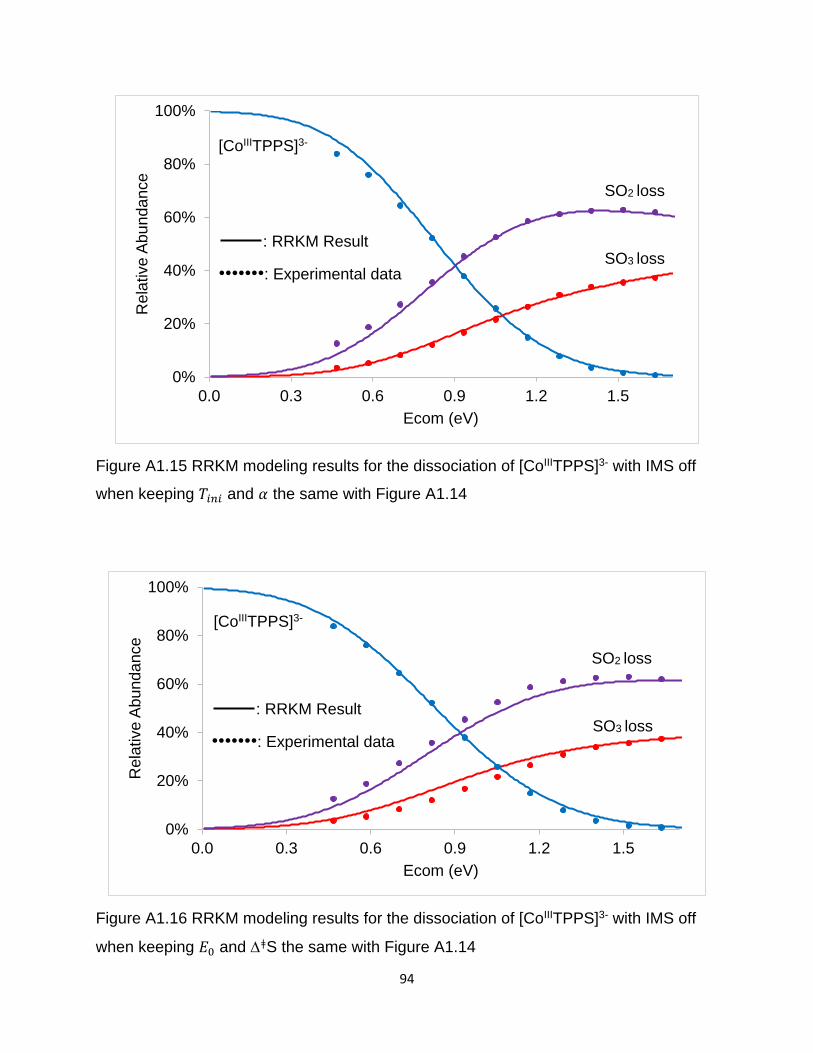
94
Figure A1.15 RRKM modeling results for the dissociation of [CoIIITPPS]3- with IMS off
when keeping 𝑇𝑖𝑛𝑖 and 𝛼 the same with Figure A1.14
Figure A1.16 RRKM modeling results for the dissociation of [CoIIITPPS]3- with IMS off
when keeping 𝐸0 and ǂS the same with Figure A1.14
0%
20%
40%
60%
80%
100%
0.0 0.3 0.6 0.9 1.2 1.5
Rela
tive A
bundance
Ecom (eV)
0%
20%
40%
60%
80%
100%
0.0 0.3 0.6 0.9 1.2 1.5
Rela
tive A
bundance
Ecom (eV)
SO3 loss
SO2 loss
[CoIIITPPS]3-
SO3 loss
SO2 loss
: RRKM Result
•••••••: Experimental data
[CoIIITPPS]3-
: RRKM Result
•••••••: Experimental data
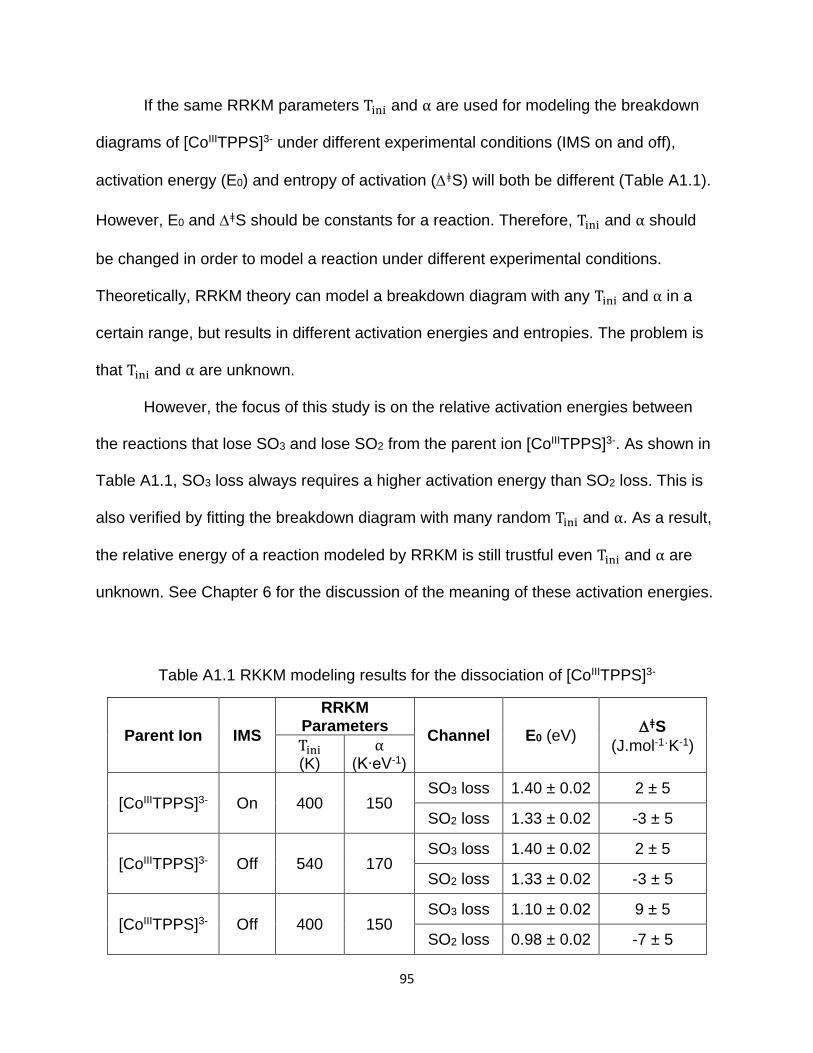
95
If the same RRKM parameters Tini and α are used for modeling the breakdown
diagrams of [CoIIITPPS]3- under different experimental conditions (IMS on and off),
activation energy (E0) and entropy of activation (ǂS) will both be different (Table A1.1).
However, E0 and ǂS should be constants for a reaction. Therefore, Tini and α should
be changed in order to model a reaction under different experimental conditions.
Theoretically, RRKM theory can model a breakdown diagram with any Tini and α in a
certain range, but results in different activation energies and entropies. The problem is
that Tini and α are unknown.
However, the focus of this study is on the relative activation energies between
the reactions that lose SO3 and lose SO2 from the parent ion [CoIIITPPS]3-. As shown in
Table A1.1, SO3 loss always requires a higher activation energy than SO2 loss. This is
also verified by fitting the breakdown diagram with many random Tini and α. As a result,
the relative energy of a reaction modeled by RRKM is still trustful even Tini and α are
unknown. See Chapter 6 for the discussion of the meaning of these activation energies.
Table A1.1 RKKM modeling results for the dissociation of [CoIIITPPS]3-
Parent Ion IMS
RRKM Parameters
Channel E0 (eV) ǂS
(J.mol-1ˑK-1) Tini (K)
α (K∙eV-1)
[CoIIITPPS]3- On 400 150 SO3 loss 1.40 ± 0.02 2 ± 5
SO2 loss 1.33 ± 0.02 -3 ± 5
[CoIIITPPS]3- Off 540 170 SO3 loss 1.40 ± 0.02 2 ± 5
SO2 loss 1.33 ± 0.02 -3 ± 5
[CoIIITPPS]3- Off 400 150 SO3 loss 1.10 ± 0.02 9 ± 5
SO2 loss 0.98 ± 0.02 -7 ± 5

96
Appendix 2. RRKM modeling for the dissociation of [MnIIITPPS]3-
A2.1 ESI-MS of MnIIITPPS
The mass spectrum of MnIIITPPS (Figure A2.1) shows there are different charge
states of MnIIITPPS in methanol solution, including [MnIIITPPS]3- and [MnIIITPPS+H]2-. In
this chapter, the primary focus is to study [MnIIITPPS]3-. The peak m/z 327.7 is only
monomer instead of a mix of monomer [MnIIITPPS]3- and dimer [(MnIIITPPS)2]6-. This
was verified by turning on the ion mobility spectrometry (IMS), which shows no extra
ions could be separated.
The mass spectrum of [MnIIITPPS]3- (Figure A2.2) matches its theoretical isotope
model, so it proves to be a good reactant for ESI-MS/MS experiment.
Figure A2.1 Mass spectrum of MnIIITPPS
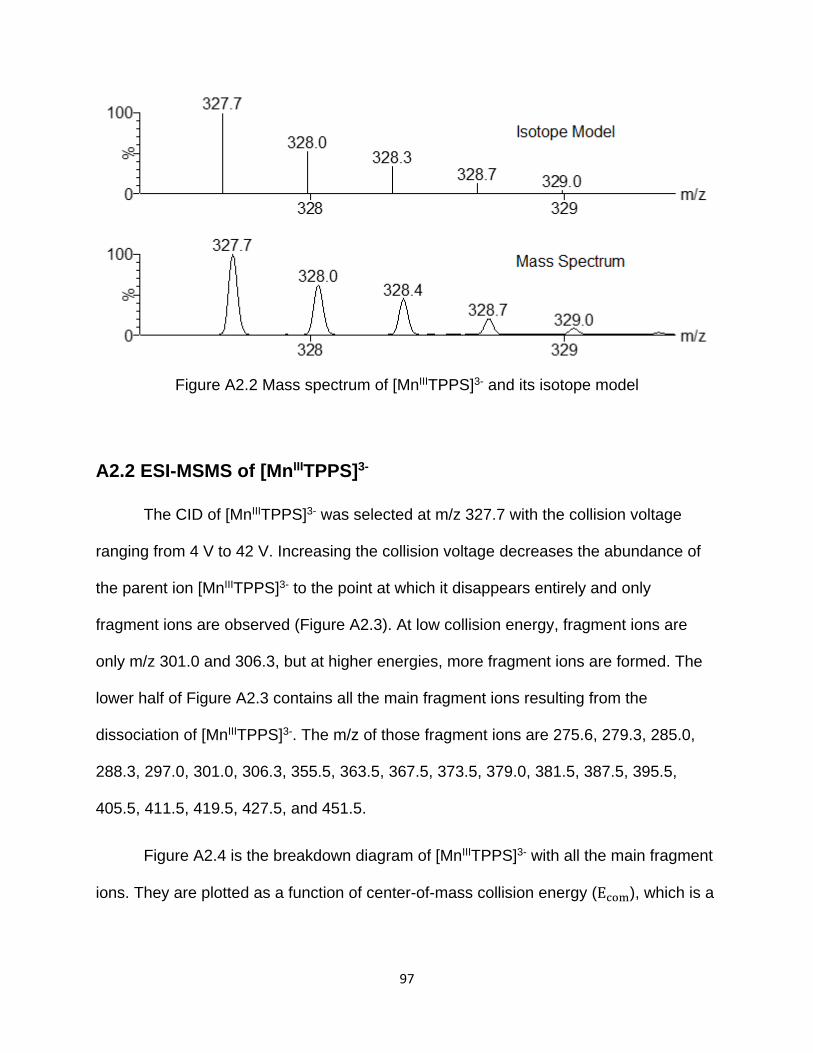
97
Figure A2.2 Mass spectrum of [MnIIITPPS]3- and its isotope model
A2.2 ESI-MSMS of [MnIIITPPS]3-
The CID of [MnIIITPPS]3- was selected at m/z 327.7 with the collision voltage
ranging from 4 V to 42 V. Increasing the collision voltage decreases the abundance of
the parent ion [MnIIITPPS]3- to the point at which it disappears entirely and only
fragment ions are observed (Figure A2.3). At low collision energy, fragment ions are
only m/z 301.0 and 306.3, but at higher energies, more fragment ions are formed. The
lower half of Figure A2.3 contains all the main fragment ions resulting from the
dissociation of [MnIIITPPS]3-. The m/z of those fragment ions are 275.6, 279.3, 285.0,
288.3, 297.0, 301.0, 306.3, 355.5, 363.5, 367.5, 373.5, 379.0, 381.5, 387.5, 395.5,
405.5, 411.5, 419.5, 427.5, and 451.5.
Figure A2.4 is the breakdown diagram of [MnIIITPPS]3- with all the main fragment
ions. They are plotted as a function of center-of-mass collision energy (Ecom), which is a
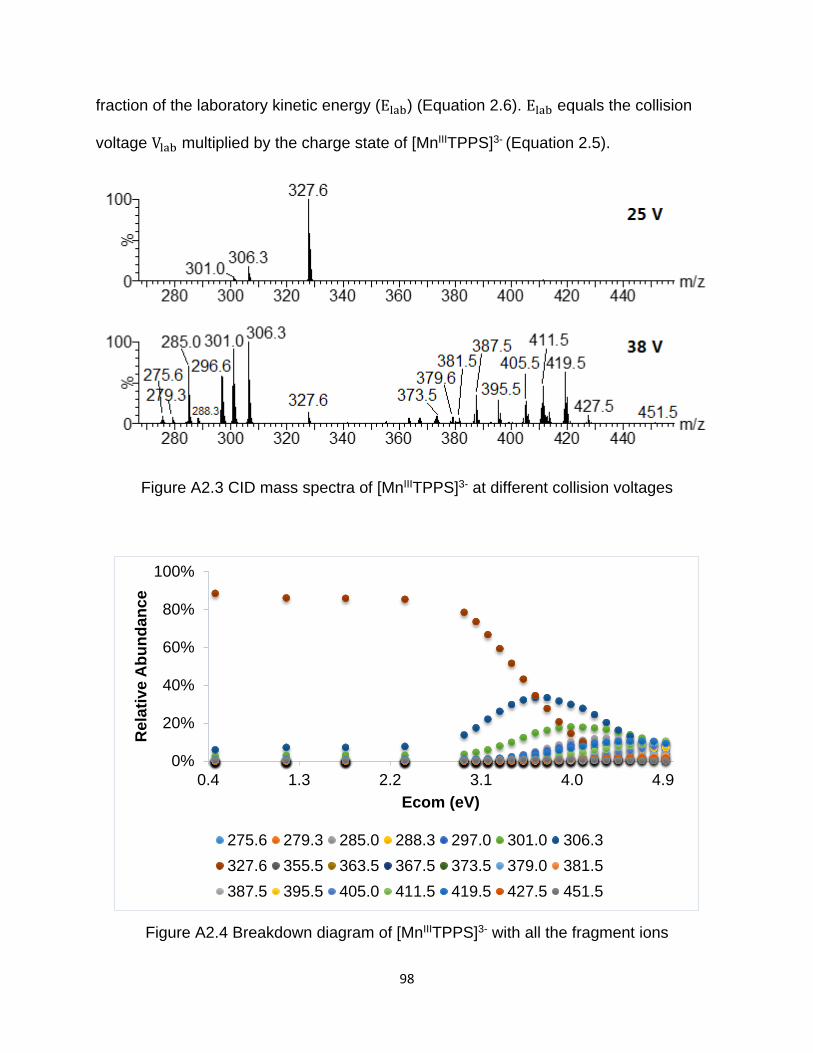
98
fraction of the laboratory kinetic energy (Elab) (Equation 2.6). Elab equals the collision
voltage Vlab multiplied by the charge state of [MnIIITPPS]3- (Equation 2.5).
Figure A2.3 CID mass spectra of [MnIIITPPS]3- at different collision voltages
Figure A2.4 Breakdown diagram of [MnIIITPPS]3- with all the fragment ions
0%
20%
40%
60%
80%
100%
0.4 1.3 2.2 3.1 4.0 4.9
Rela
tive A
bu
nd
an
ce
Ecom (eV)
275.6 279.3 285.0 288.3 297.0 301.0 306.3
327.6 355.5 363.5 367.5 373.5 379.0 381.5
387.5 395.5 405.0 411.5 419.5 427.5 451.5
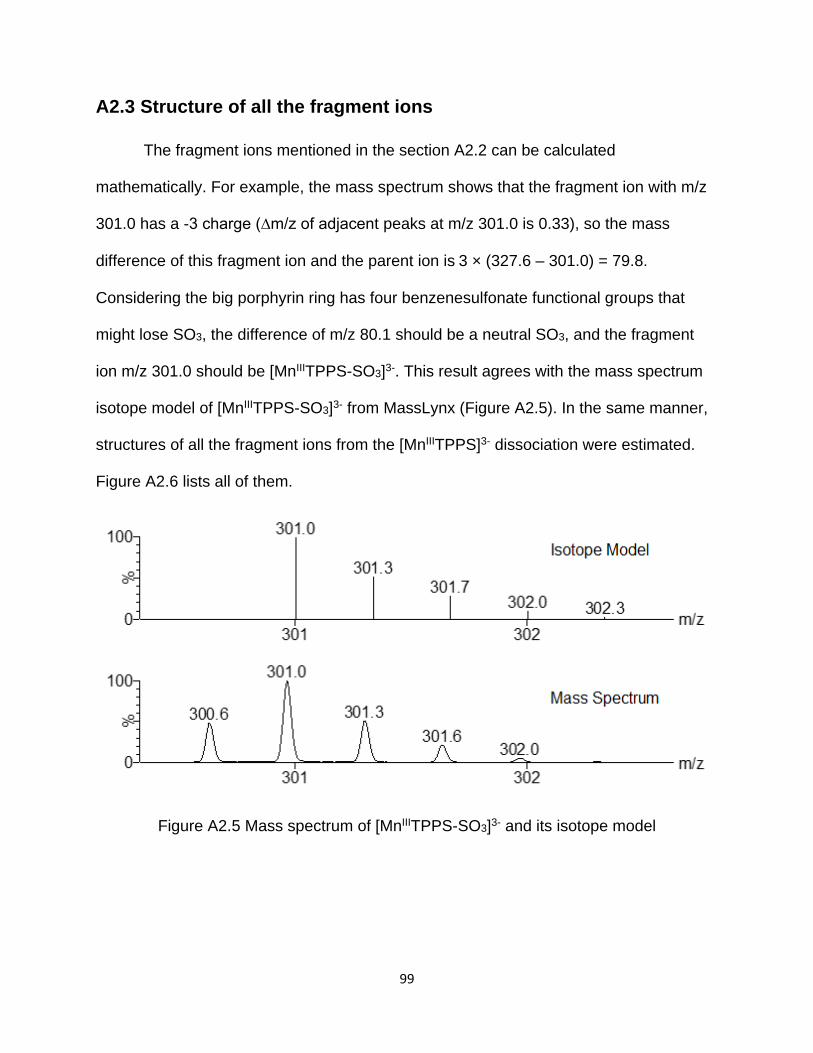
99
A2.3 Structure of all the fragment ions
The fragment ions mentioned in the section A2.2 can be calculated
mathematically. For example, the mass spectrum shows that the fragment ion with m/z
301.0 has a -3 charge (∆m/z of adjacent peaks at m/z 301.0 is 0.33), so the mass
difference of this fragment ion and the parent ion is 3 × (327.6 – 301.0) = 79.8.
Considering the big porphyrin ring has four benzenesulfonate functional groups that
might lose SO3, the difference of m/z 80.1 should be a neutral SO3, and the fragment
ion m/z 301.0 should be [MnIIITPPS-SO3]3-. This result agrees with the mass spectrum
isotope model of [MnIIITPPS-SO3]3- from MassLynx (Figure A2.5). In the same manner,
structures of all the fragment ions from the [MnIIITPPS]3- dissociation were estimated.
Figure A2.6 lists all of them.
Figure A2.5 Mass spectrum of [MnIIITPPS-SO3]3- and its isotope model
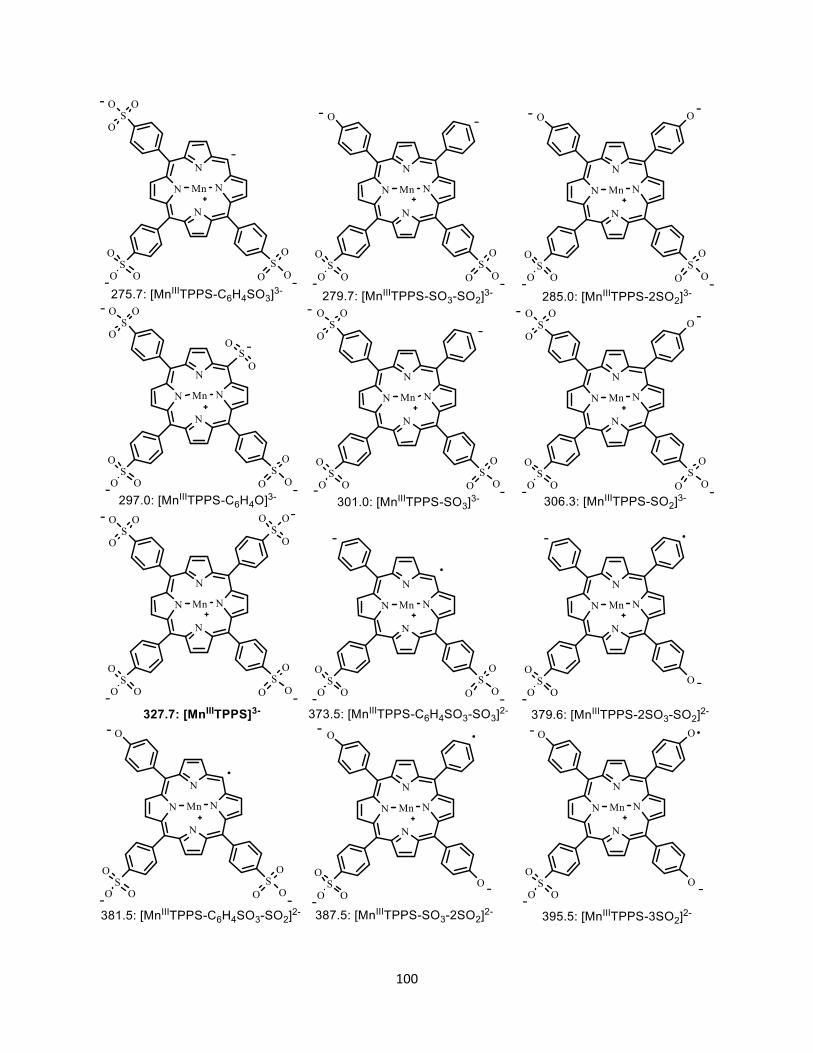
100
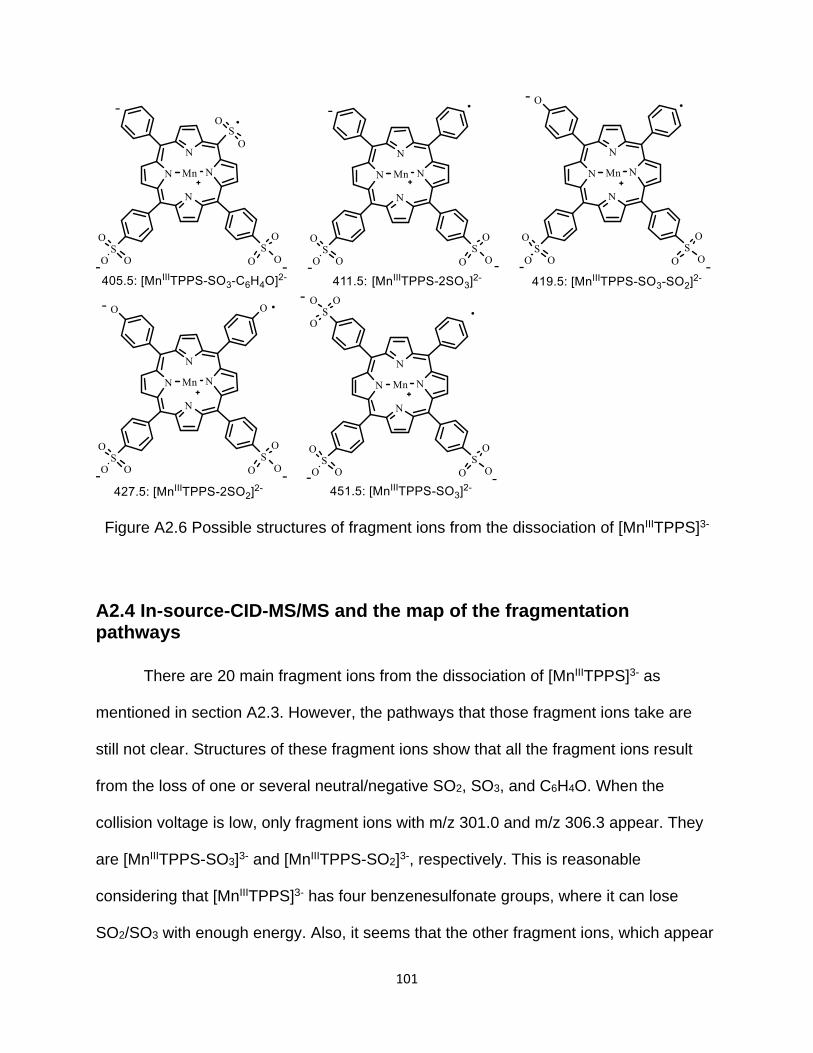
101
Figure A2.6 Possible structures of fragment ions from the dissociation of [MnIIITPPS]3-
A2.4 In-source-CID-MS/MS and the map of the fragmentation pathways
There are 20 main fragment ions from the dissociation of [MnIIITPPS]3- as
mentioned in section A2.3. However, the pathways that those fragment ions take are
still not clear. Structures of these fragment ions show that all the fragment ions result
from the loss of one or several neutral/negative SO2, SO3, and C6H4O. When the
collision voltage is low, only fragment ions with m/z 301.0 and m/z 306.3 appear. They
are [MnIIITPPS-SO3]3- and [MnIIITPPS-SO2]3-, respectively. This is reasonable
considering that [MnIIITPPS]3- has four benzenesulfonate groups, where it can lose
SO2/SO3 with enough energy. Also, it seems that the other fragment ions, which appear
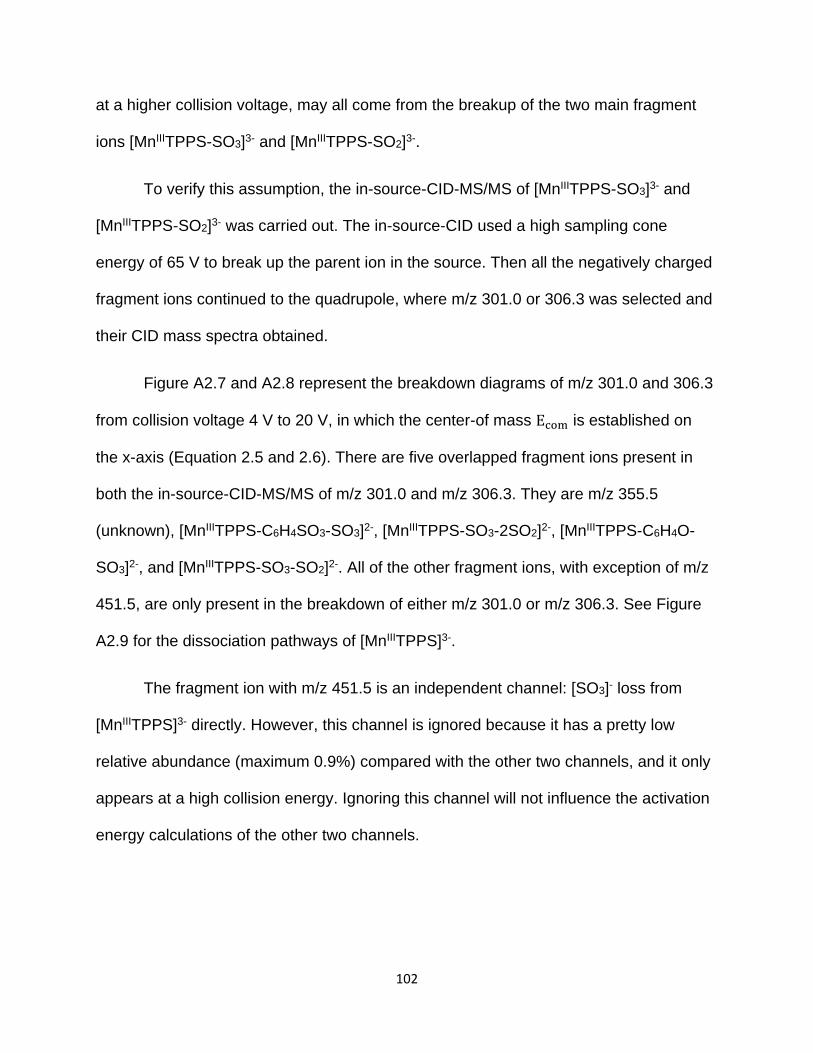
102
at a higher collision voltage, may all come from the breakup of the two main fragment
ions [MnIIITPPS-SO3]3- and [MnIIITPPS-SO2]3-.
To verify this assumption, the in-source-CID-MS/MS of [MnIIITPPS-SO3]3- and
[MnIIITPPS-SO2]3- was carried out. The in-source-CID used a high sampling cone
energy of 65 V to break up the parent ion in the source. Then all the negatively charged
fragment ions continued to the quadrupole, where m/z 301.0 or 306.3 was selected and
their CID mass spectra obtained.
Figure A2.7 and A2.8 represent the breakdown diagrams of m/z 301.0 and 306.3
from collision voltage 4 V to 20 V, in which the center-of mass Ecom is established on
the x-axis (Equation 2.5 and 2.6). There are five overlapped fragment ions present in
both the in-source-CID-MS/MS of m/z 301.0 and m/z 306.3. They are m/z 355.5
(unknown), [MnIIITPPS-C6H4SO3-SO3]2-, [MnIIITPPS-SO3-2SO2]2-, [MnIIITPPS-C6H4O-
SO3]2-, and [MnIIITPPS-SO3-SO2]2-. All of the other fragment ions, with exception of m/z
451.5, are only present in the breakdown of either m/z 301.0 or m/z 306.3. See Figure
A2.9 for the dissociation pathways of [MnIIITPPS]3-.
The fragment ion with m/z 451.5 is an independent channel: [SO3]- loss from
[MnIIITPPS]3- directly. However, this channel is ignored because it has a pretty low
relative abundance (maximum 0.9%) compared with the other two channels, and it only
appears at a high collision energy. Ignoring this channel will not influence the activation
energy calculations of the other two channels.
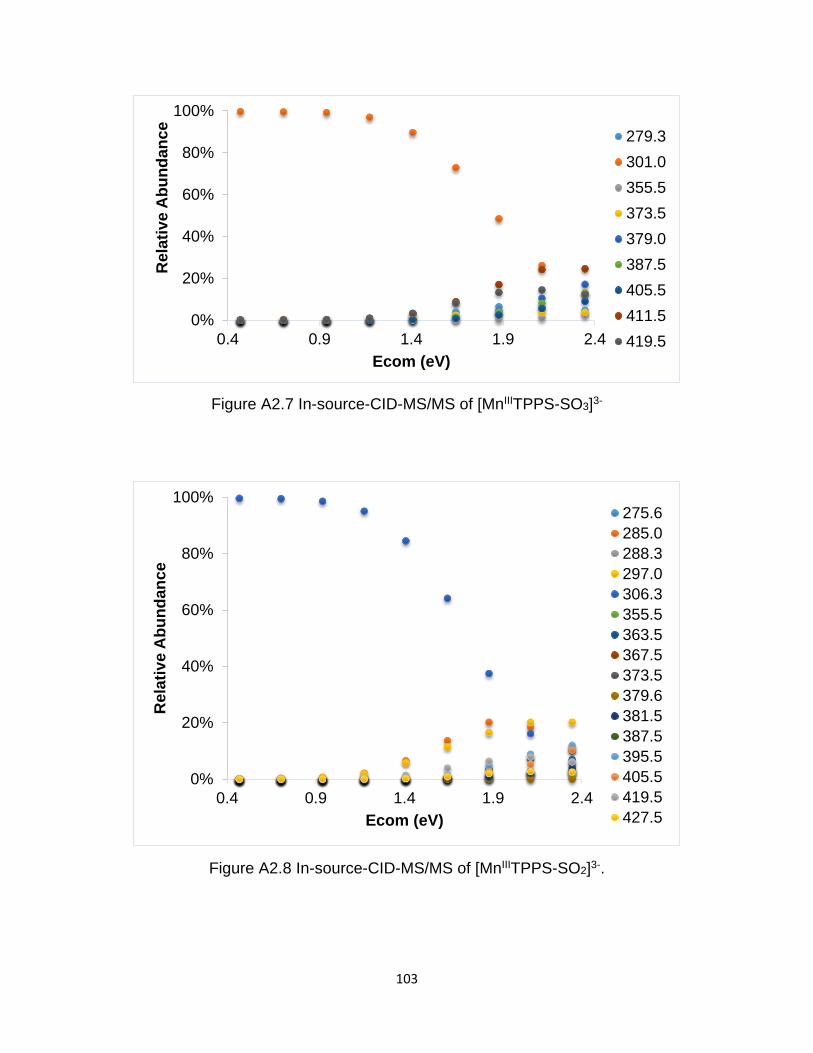
103
Figure A2.7 In-source-CID-MS/MS of [MnIIITPPS-SO3]3-
Figure A2.8 In-source-CID-MS/MS of [MnIIITPPS-SO2]3-.
0%
20%
40%
60%
80%
100%
0.4 0.9 1.4 1.9 2.4
Rela
tive A
bu
nd
an
ce
Ecom (eV)
279.3
301.0
355.5
373.5
379.0
387.5
405.5
411.5
419.5
0%
20%
40%
60%
80%
100%
0.4 0.9 1.4 1.9 2.4
Rela
tive A
bu
nd
an
ce
Ecom (eV)
275.6
285.0
288.3
297.0
306.3
355.5
363.5
367.5
373.5
379.6
381.5
387.5
395.5
405.5
419.5
427.5
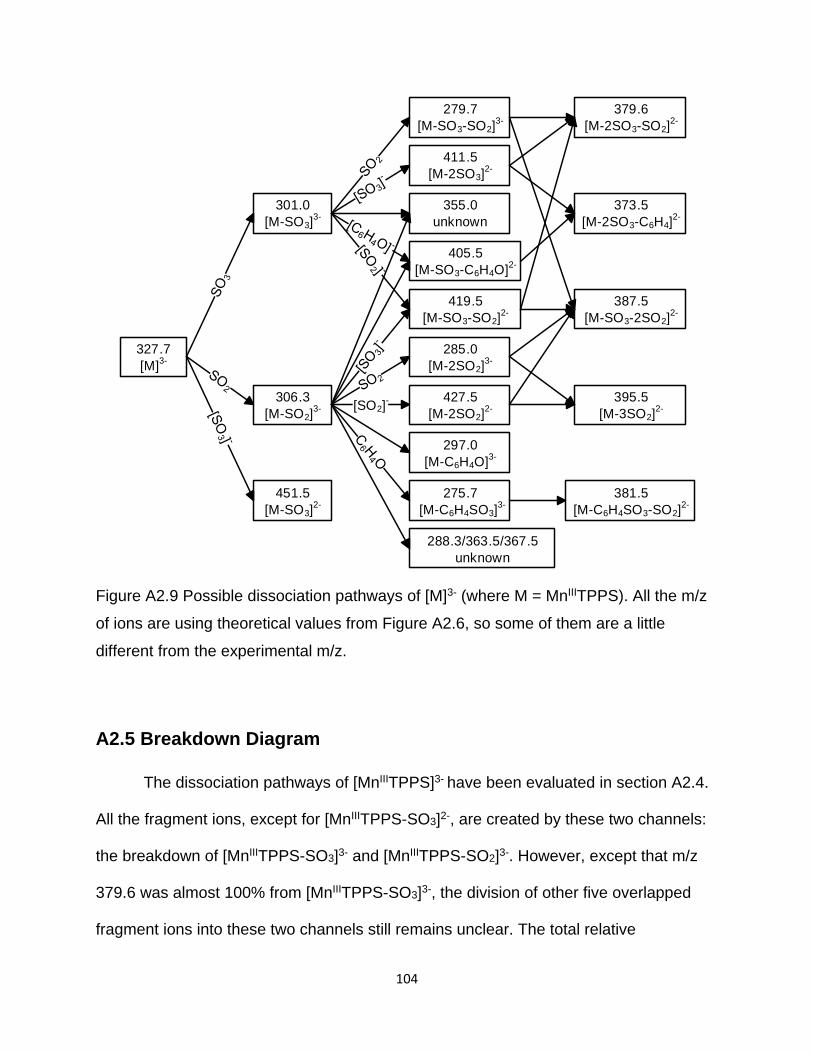
104
327.7
[M]3-
301.0
[M-SO3]3-
419.5
[M-SO3-SO2]2-
306.3
[M-SO2]3-
285.0
[M-2SO2]3-
297.0
[M-C6H4O]3-
451.5
[M-SO3]2-
405.5
[M-SO3-C6H4O]2-
411.5
[M-2SO3]2-
373.5
[M-2SO3-C6H4]2-
279.7
[M-SO3-SO2]3-
379.6
[M-2SO3-SO2]2-
355.0
unknown
275.7
[M-C6H4SO3]3-
381.5
[M-C6H4SO3-SO2]2-
387.5
[M-SO3-2SO2]2-
395.5
[M-3SO2]2-
288.3/363.5/367.5
unknown
[SO2]- 427.5
[M-2SO2]2-
Figure A2.9 Possible dissociation pathways of [M]3- (where M = MnIIITPPS). All the m/z
of ions are using theoretical values from Figure A2.6, so some of them are a little
different from the experimental m/z.
A2.5 Breakdown Diagram
The dissociation pathways of [MnIIITPPS]3- have been evaluated in section A2.4.
All the fragment ions, except for [MnIIITPPS-SO3]2-, are created by these two channels:
the breakdown of [MnIIITPPS-SO3]3- and [MnIIITPPS-SO2]3-. However, except that m/z
379.6 was almost 100% from [MnIIITPPS-SO3]3-, the division of other five overlapped
fragment ions into these two channels still remains unclear. The total relative
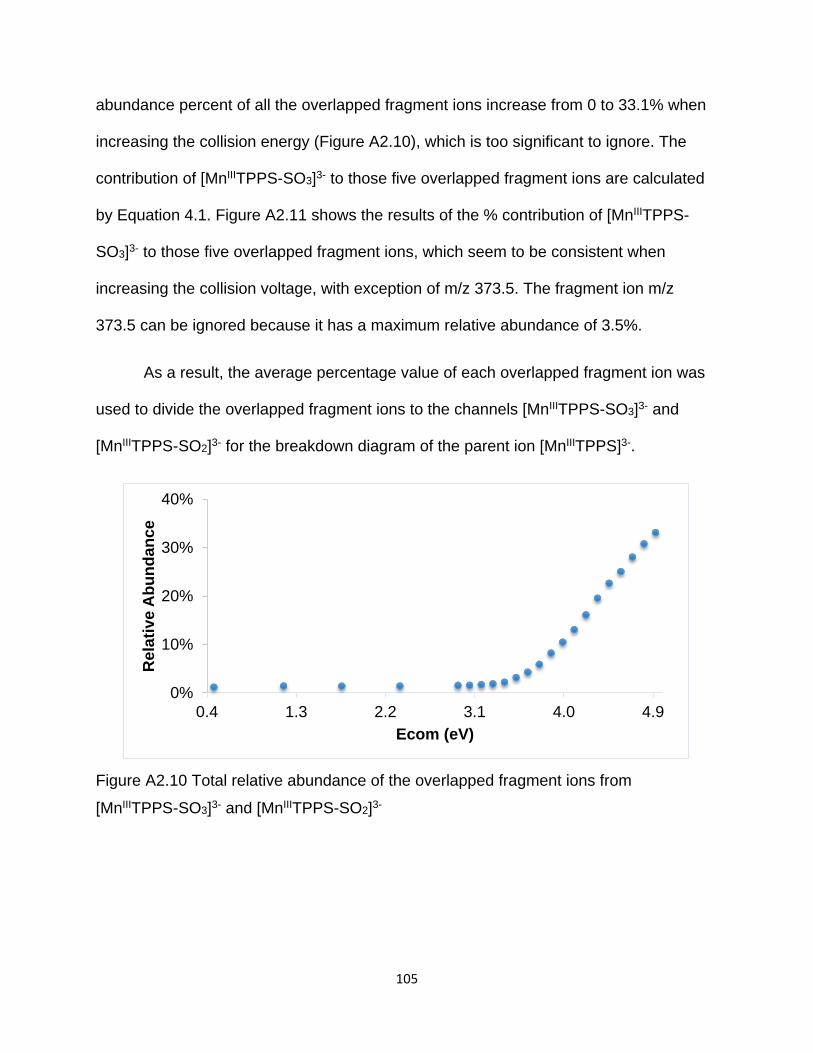
105
abundance percent of all the overlapped fragment ions increase from 0 to 33.1% when
increasing the collision energy (Figure A2.10), which is too significant to ignore. The
contribution of [MnIIITPPS-SO3]3- to those five overlapped fragment ions are calculated
by Equation 4.1. Figure A2.11 shows the results of the % contribution of [MnIIITPPS-
SO3]3- to those five overlapped fragment ions, which seem to be consistent when
increasing the collision voltage, with exception of m/z 373.5. The fragment ion m/z
373.5 can be ignored because it has a maximum relative abundance of 3.5%.
As a result, the average percentage value of each overlapped fragment ion was
used to divide the overlapped fragment ions to the channels [MnIIITPPS-SO3]3- and
[MnIIITPPS-SO2]3- for the breakdown diagram of the parent ion [MnIIITPPS]3-.
Figure A2.10 Total relative abundance of the overlapped fragment ions from
[MnIIITPPS-SO3]3- and [MnIIITPPS-SO2]3-
0%
10%
20%
30%
40%
0.4 1.3 2.2 3.1 4.0 4.9
Rela
tive A
bu
nd
an
ce
Ecom (eV)
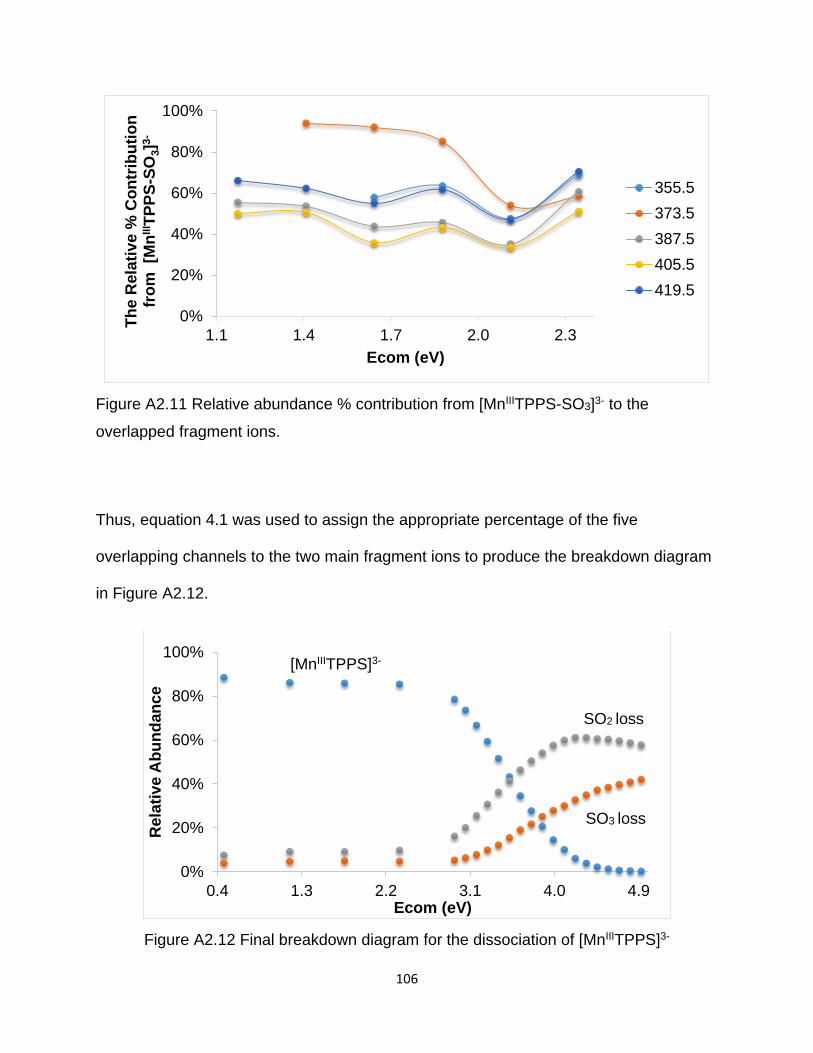
106
Figure A2.11 Relative abundance % contribution from [MnIIITPPS-SO3]3- to the
overlapped fragment ions.
Thus, equation 4.1 was used to assign the appropriate percentage of the five
overlapping channels to the two main fragment ions to produce the breakdown diagram
in Figure A2.12.
Figure A2.12 Final breakdown diagram for the dissociation of [MnIIITPPS]3-
0%
20%
40%
60%
80%
100%
1.1 1.4 1.7 2.0 2.3
Th
e R
ela
tive %
Co
ntr
ibu
tio
n
fro
m [M
nII
I TP
PS
-SO
3]3
-
Ecom (eV)
355.5
373.5
387.5
405.5
419.5
0%
20%
40%
60%
80%
100%
0.4 1.3 2.2 3.1 4.0 4.9
Rela
tive A
bu
nd
an
ce
Ecom (eV)
SO3 loss
SO2 loss
[MnIIITPPS]3-
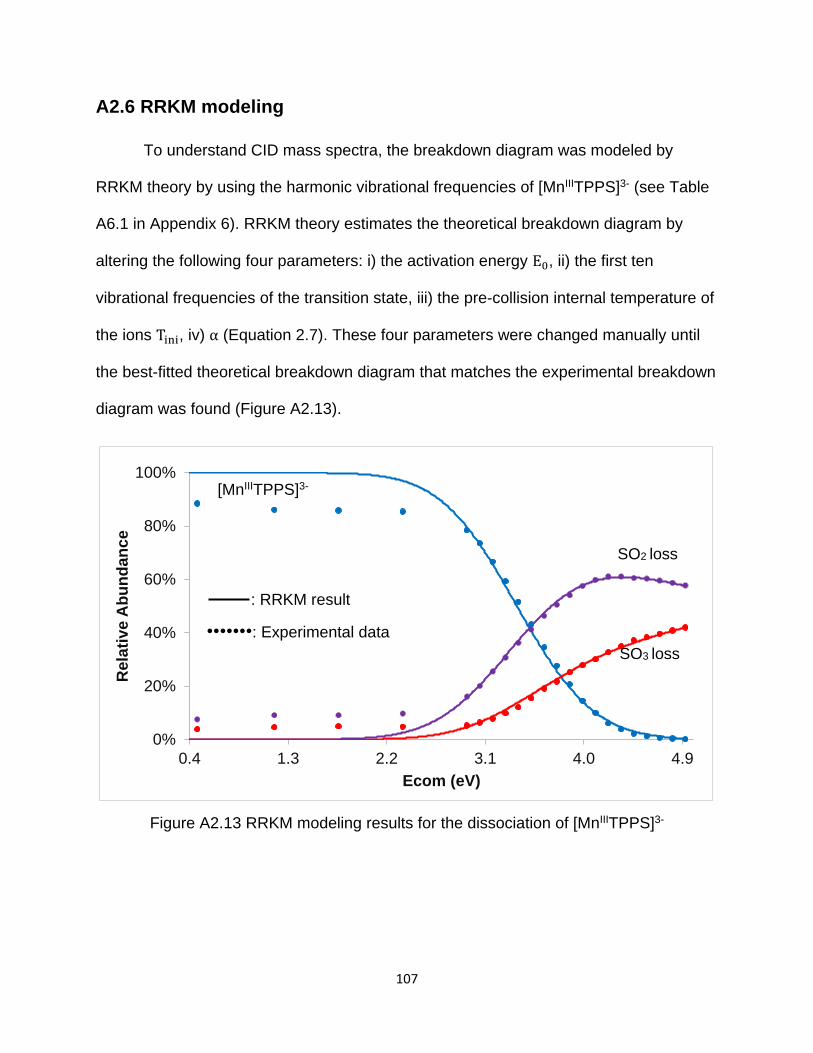
107
A2.6 RRKM modeling
To understand CID mass spectra, the breakdown diagram was modeled by
RRKM theory by using the harmonic vibrational frequencies of [MnIIITPPS]3- (see Table
A6.1 in Appendix 6). RRKM theory estimates the theoretical breakdown diagram by
altering the following four parameters: i) the activation energy E0, ii) the first ten
vibrational frequencies of the transition state, iii) the pre-collision internal temperature of
the ions Tini, iv) α (Equation 2.7). These four parameters were changed manually until
the best-fitted theoretical breakdown diagram that matches the experimental breakdown
diagram was found (Figure A2.13).
Figure A2.13 RRKM modeling results for the dissociation of [MnIIITPPS]3-
0%
20%
40%
60%
80%
100%
0.4 1.3 2.2 3.1 4.0 4.9
Rela
tive A
bu
nd
an
ce
Ecom (eV)
: RRKM result
•••••••: Experimental data
SO3 loss
SO2 loss
[MnIIITPPS]3-
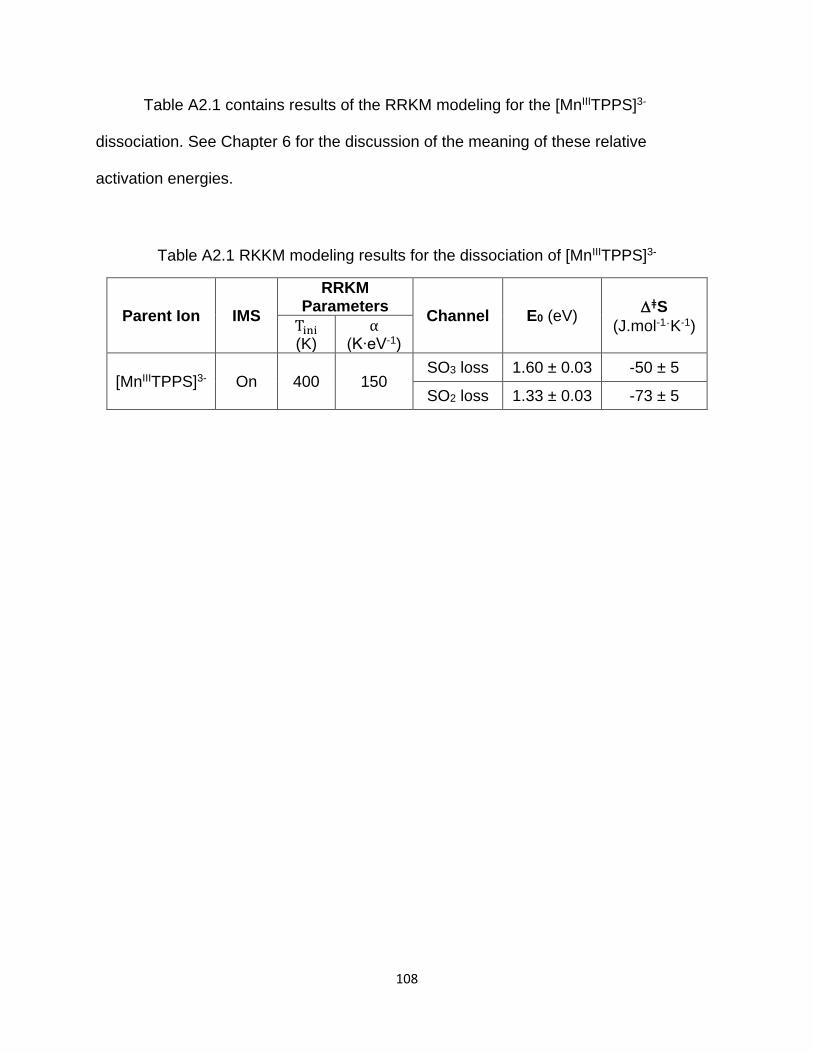
108
Table A2.1 contains results of the RRKM modeling for the [MnIIITPPS]3-
dissociation. See Chapter 6 for the discussion of the meaning of these relative
activation energies.
Table A2.1 RKKM modeling results for the dissociation of [MnIIITPPS]3-
Parent Ion IMS
RRKM Parameters
Channel E0 (eV) ǂS
(J.mol-1ˑK-1) Tini (K)
α (K∙eV-1)
[MnIIITPPS]3- On 400 150 SO3 loss 1.60 ± 0.03 -50 ± 5
SO2 loss 1.33 ± 0.03 -73 ± 5
109
Appendix 3. RRKM modeling for the dissociation of [MnIIITPPS+H]2-
A3.1 ESI-MS of MnIIITPPS
As discussed in section A2.1 of Appendix 2, the mass spectrum of MnIIITPPS
(Figure A2.1) shows there are different charge states of MnIIITPPS in methanol solution,
including [MnIIITPPS+H]2- and [MnIIITPPS+H]2-. At a high concentration (2.5 × 10⁻⁴
mol/L), mass spectrum (MS) shows that m/z 492.0 contains minor monomer
[MnIIITPPS+H]2- and major dimer [(MnIIITPPS+H)2]4- (Figure A3.1). At a low
concentration (1.0 × 10⁻⁵ mol/L), ion mobility spectrometer shows that m/z 492.0
composed of minor monomer [MnIIITPPS]2- and major monomer [MnIIITPPS+H]2- (Figure
A3.2). The primary focus in this chapter is to study monomer [MnIIITPPS+H]2-.
Therefore, a low concentrated MnIIITPPS solution was used for the following ESI-
MS/MS experiment. Since peak m/z 492.0 is a mixture, ion mobility separation (IMS)
has to be turned on to obtain pure [MnIIITPPS+H]2-.
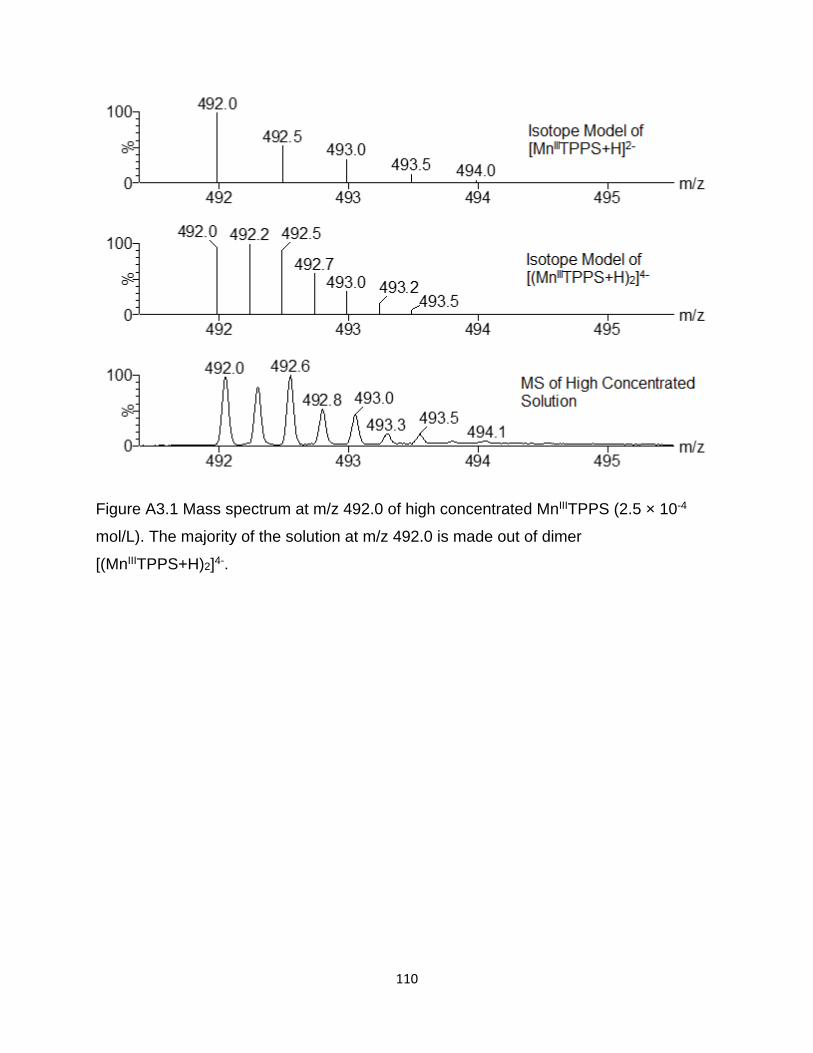
110
Figure A3.1 Mass spectrum at m/z 492.0 of high concentrated MnIIITPPS (2.5 × 10⁻⁴
mol/L). The majority of the solution at m/z 492.0 is made out of dimer
[(MnIIITPPS+H)2]4-.
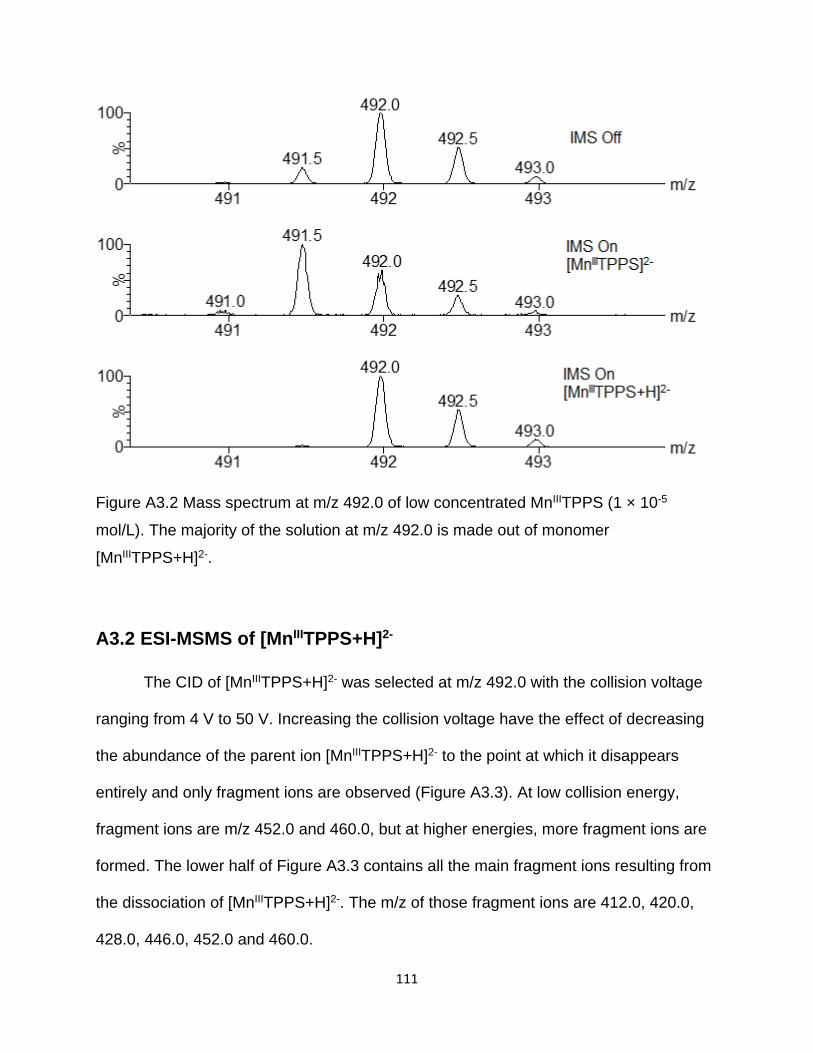
111
Figure A3.2 Mass spectrum at m/z 492.0 of low concentrated MnIIITPPS (1 × 10⁻⁵
mol/L). The majority of the solution at m/z 492.0 is made out of monomer
[MnIIITPPS+H]2-.
A3.2 ESI-MSMS of [MnIIITPPS+H]2-
The CID of [MnIIITPPS+H]2- was selected at m/z 492.0 with the collision voltage
ranging from 4 V to 50 V. Increasing the collision voltage have the effect of decreasing
the abundance of the parent ion [MnIIITPPS+H]2- to the point at which it disappears
entirely and only fragment ions are observed (Figure A3.3). At low collision energy,
fragment ions are m/z 452.0 and 460.0, but at higher energies, more fragment ions are
formed. The lower half of Figure A3.3 contains all the main fragment ions resulting from
the dissociation of [MnIIITPPS+H]2-. The m/z of those fragment ions are 412.0, 420.0,
428.0, 446.0, 452.0 and 460.0.
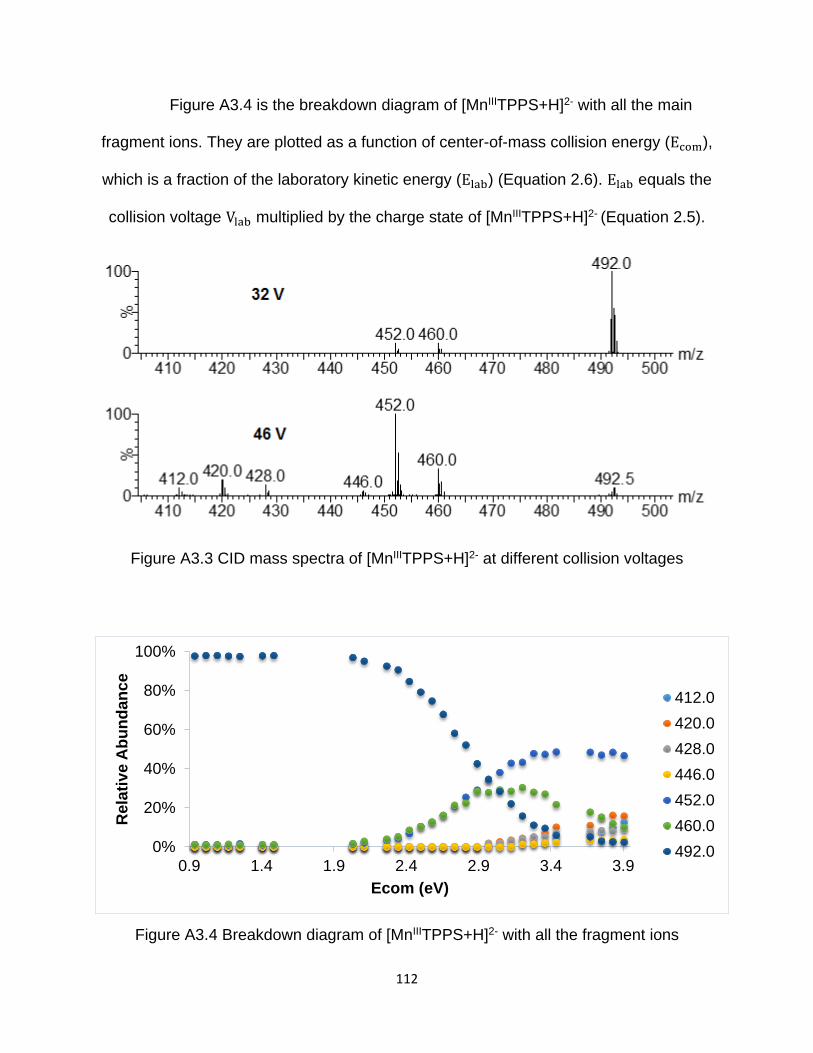
112
Figure A3.4 is the breakdown diagram of [MnIIITPPS+H]2- with all the main
fragment ions. They are plotted as a function of center-of-mass collision energy (Ecom),
which is a fraction of the laboratory kinetic energy (Elab) (Equation 2.6). Elab equals the
collision voltage Vlab multiplied by the charge state of [MnIIITPPS+H]2- (Equation 2.5).
Figure A3.3 CID mass spectra of [MnIIITPPS+H]2- at different collision voltages
Figure A3.4 Breakdown diagram of [MnIIITPPS+H]2- with all the fragment ions
0%
20%
40%
60%
80%
100%
0.9 1.4 1.9 2.4 2.9 3.4 3.9
Re
lati
ve A
bu
nd
an
ce
Ecom (eV)
412.0
420.0
428.0
446.0
452.0
460.0
492.0
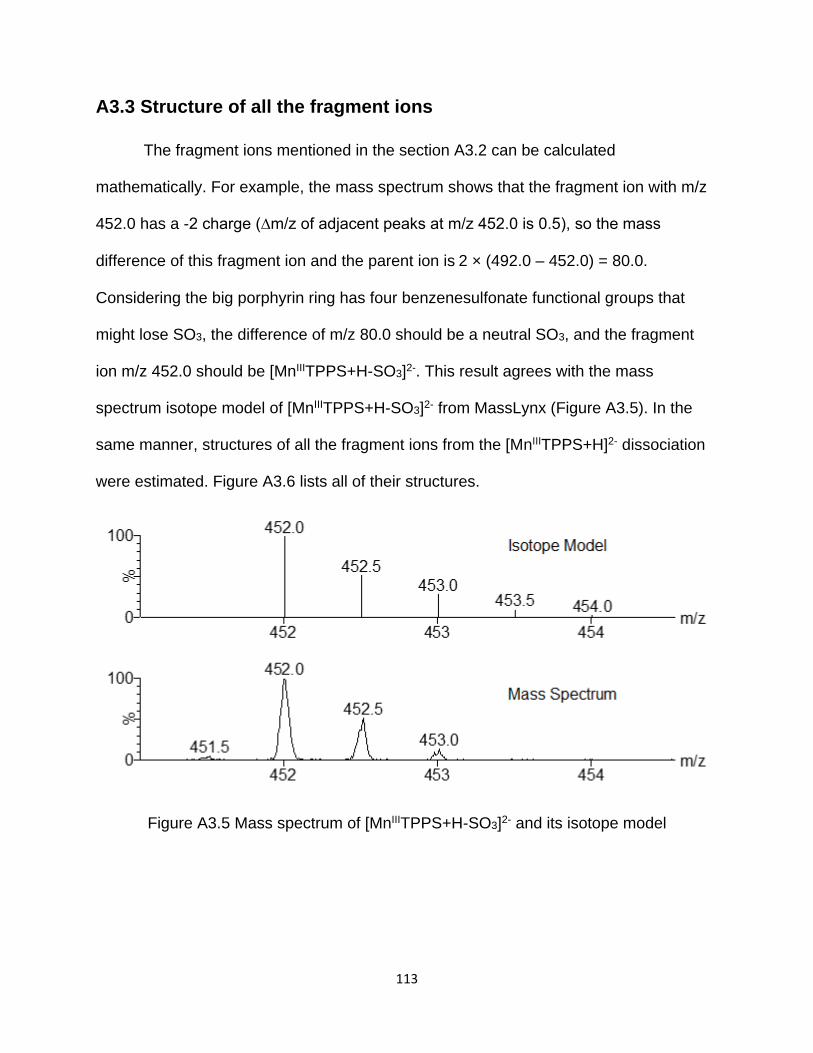
113
A3.3 Structure of all the fragment ions
The fragment ions mentioned in the section A3.2 can be calculated
mathematically. For example, the mass spectrum shows that the fragment ion with m/z
452.0 has a -2 charge (∆m/z of adjacent peaks at m/z 452.0 is 0.5), so the mass
difference of this fragment ion and the parent ion is 2 × (492.0 – 452.0) = 80.0.
Considering the big porphyrin ring has four benzenesulfonate functional groups that
might lose SO3, the difference of m/z 80.0 should be a neutral SO3, and the fragment
ion m/z 452.0 should be [MnIIITPPS+H-SO3]2-. This result agrees with the mass
spectrum isotope model of [MnIIITPPS+H-SO3]2- from MassLynx (Figure A3.5). In the
same manner, structures of all the fragment ions from the [MnIIITPPS+H]2- dissociation
were estimated. Figure A3.6 lists all of their structures.
Figure A3.5 Mass spectrum of [MnIIITPPS+H-SO3]2- and its isotope model
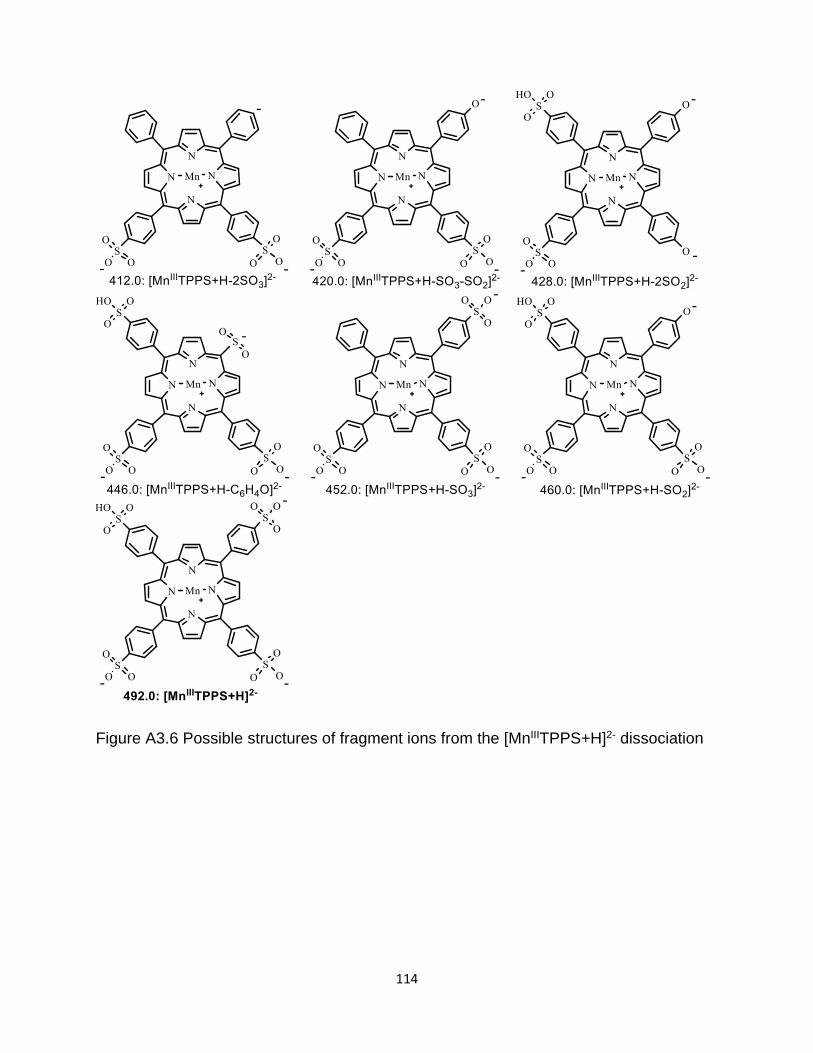
114
Figure A3.6 Possible structures of fragment ions from the [MnIIITPPS+H]2- dissociation
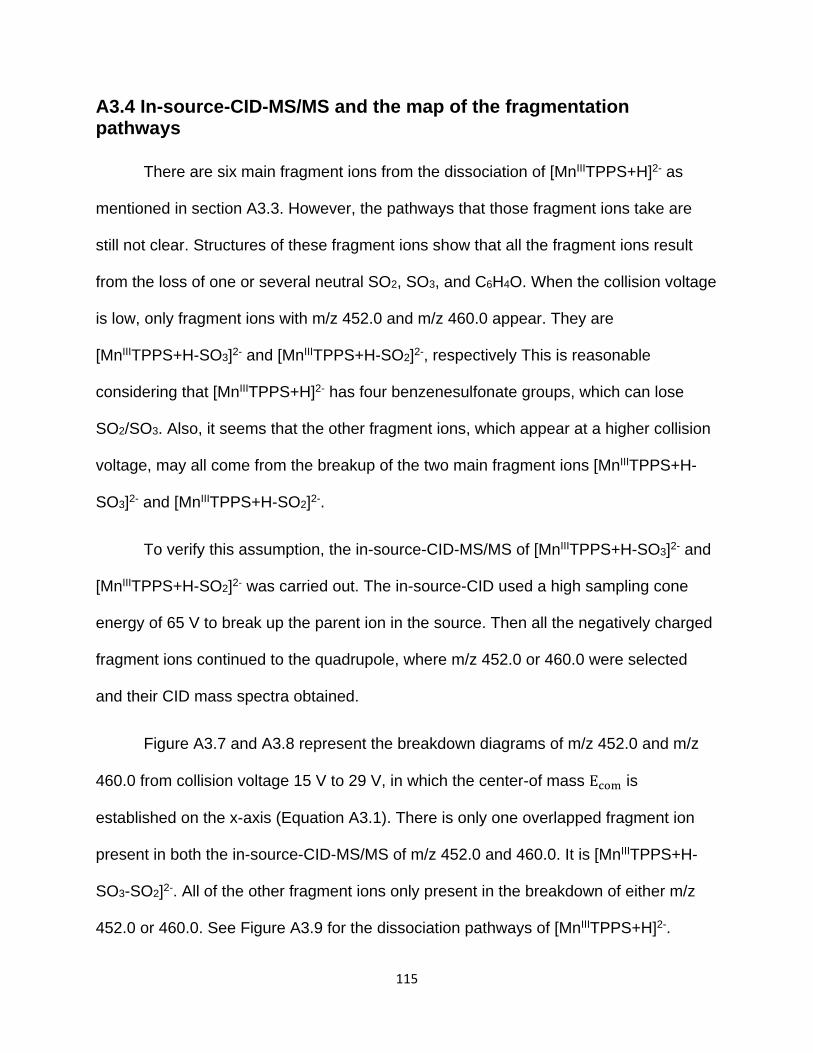
115
A3.4 In-source-CID-MS/MS and the map of the fragmentation pathways
There are six main fragment ions from the dissociation of [MnIIITPPS+H]2- as
mentioned in section A3.3. However, the pathways that those fragment ions take are
still not clear. Structures of these fragment ions show that all the fragment ions result
from the loss of one or several neutral SO2, SO3, and C6H4O. When the collision voltage
is low, only fragment ions with m/z 452.0 and m/z 460.0 appear. They are
[MnIIITPPS+H-SO3]2- and [MnIIITPPS+H-SO2]2-, respectively This is reasonable
considering that [MnIIITPPS+H]2- has four benzenesulfonate groups, which can lose
SO2/SO3. Also, it seems that the other fragment ions, which appear at a higher collision
voltage, may all come from the breakup of the two main fragment ions [MnIIITPPS+H-
SO3]2- and [MnIIITPPS+H-SO2]2-.
To verify this assumption, the in-source-CID-MS/MS of [MnIIITPPS+H-SO3]2- and
[MnIIITPPS+H-SO2]2- was carried out. The in-source-CID used a high sampling cone
energy of 65 V to break up the parent ion in the source. Then all the negatively charged
fragment ions continued to the quadrupole, where m/z 452.0 or 460.0 were selected
and their CID mass spectra obtained.
Figure A3.7 and A3.8 represent the breakdown diagrams of m/z 452.0 and m/z
460.0 from collision voltage 15 V to 29 V, in which the center-of mass Ecom is
established on the x-axis (Equation A3.1). There is only one overlapped fragment ion
present in both the in-source-CID-MS/MS of m/z 452.0 and 460.0. It is [MnIIITPPS+H-
SO3-SO2]2-. All of the other fragment ions only present in the breakdown of either m/z
452.0 or 460.0. See Figure A3.9 for the dissociation pathways of [MnIIITPPS+H]2-.
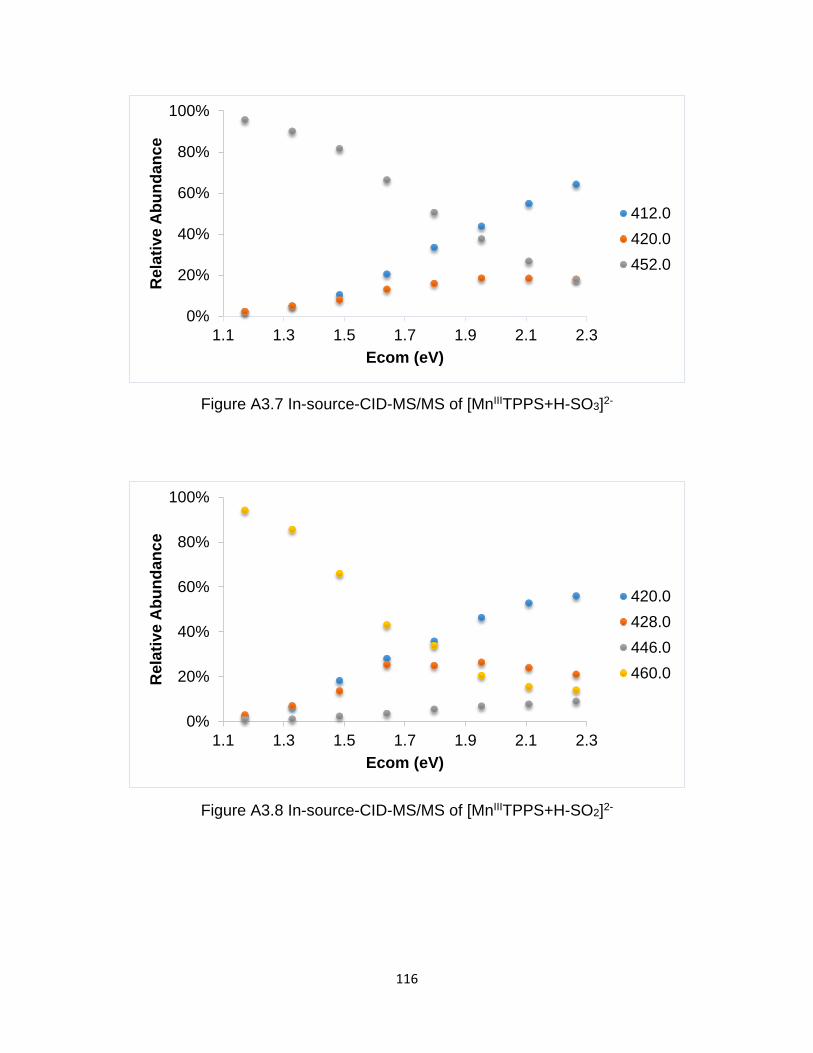
116
Figure A3.7 In-source-CID-MS/MS of [MnIIITPPS+H-SO3]2-
Figure A3.8 In-source-CID-MS/MS of [MnIIITPPS+H-SO2]2-
0%
20%
40%
60%
80%
100%
1.1 1.3 1.5 1.7 1.9 2.1 2.3
Rela
tive A
bu
nd
an
ce
Ecom (eV)
412.0
420.0
452.0
0%
20%
40%
60%
80%
100%
1.1 1.3 1.5 1.7 1.9 2.1 2.3
Rela
tive A
bu
nd
an
ce
Ecom (eV)
420.0
428.0
446.0
460.0
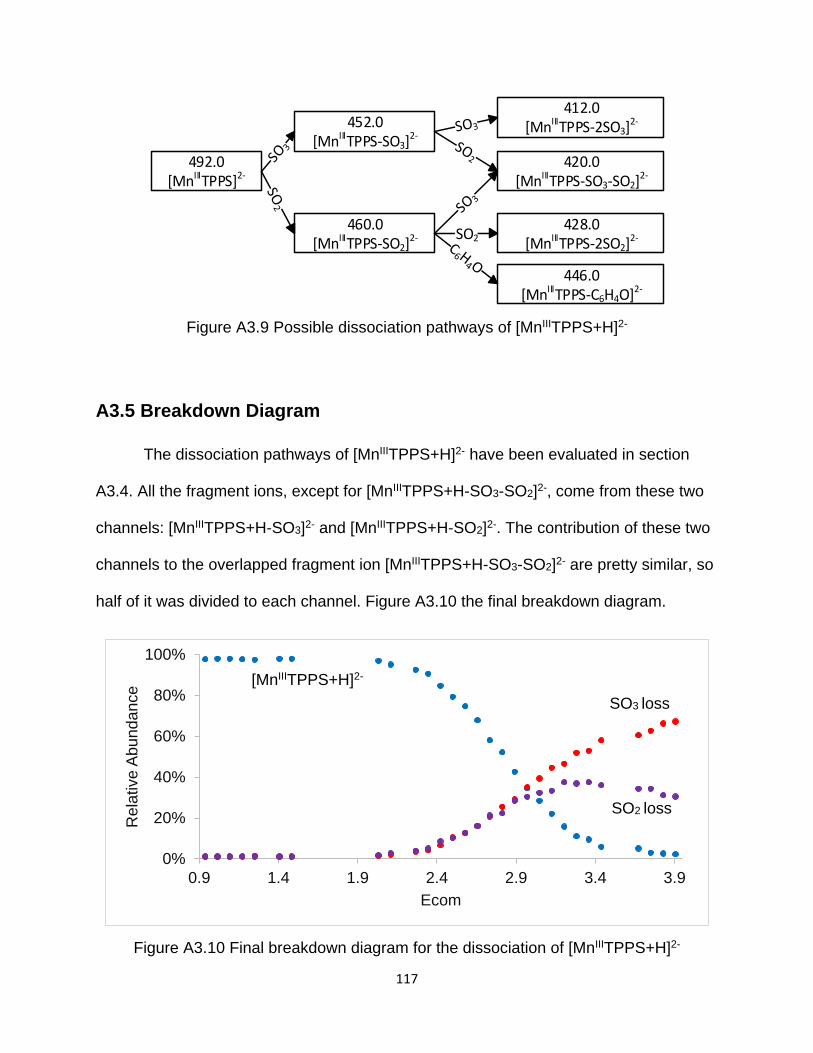
117
492.0[MnIIITPPS]2-
452.0[MnIIITPPS-SO3]2-
428.0[MnIIITPPS-2SO2]
2-460.0
[MnIIITPPS-SO2]2-
446.0[MnIIITPPS-C6H4O]2-
412.0[MnIIITPPS-2SO3]
2-
SO2
420.0[MnIIITPPS-SO3-SO2]
2-
Figure A3.9 Possible dissociation pathways of [MnIIITPPS+H]2-
A3.5 Breakdown Diagram
The dissociation pathways of [MnIIITPPS+H]2- have been evaluated in section
A3.4. All the fragment ions, except for [MnIIITPPS+H-SO3-SO2]2-, come from these two
channels: [MnIIITPPS+H-SO3]2- and [MnIIITPPS+H-SO2]2-. The contribution of these two
channels to the overlapped fragment ion [MnIIITPPS+H-SO3-SO2]2- are pretty similar, so
half of it was divided to each channel. Figure A3.10 the final breakdown diagram.
Figure A3.10 Final breakdown diagram for the dissociation of [MnIIITPPS+H]2-
0%
20%
40%
60%
80%
100%
0.9 1.4 1.9 2.4 2.9 3.4 3.9
Rela
tive A
bundance
Ecom
SO3 loss
SO2 loss
[MnIIITPPS+H]2-
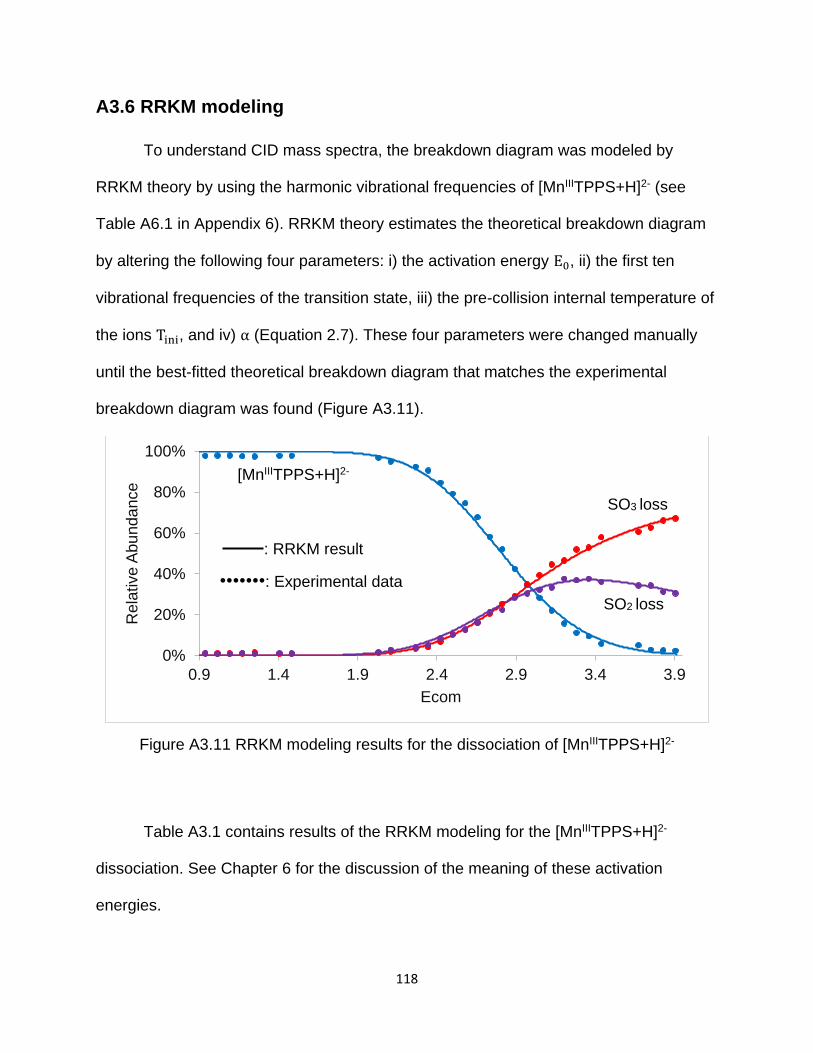
118
A3.6 RRKM modeling
To understand CID mass spectra, the breakdown diagram was modeled by
RRKM theory by using the harmonic vibrational frequencies of [MnIIITPPS+H]2- (see
Table A6.1 in Appendix 6). RRKM theory estimates the theoretical breakdown diagram
by altering the following four parameters: i) the activation energy E0, ii) the first ten
vibrational frequencies of the transition state, iii) the pre-collision internal temperature of
the ions Tini, and iv) α (Equation 2.7). These four parameters were changed manually
until the best-fitted theoretical breakdown diagram that matches the experimental
breakdown diagram was found (Figure A3.11).
Figure A3.11 RRKM modeling results for the dissociation of [MnIIITPPS+H]2-
Table A3.1 contains results of the RRKM modeling for the [MnIIITPPS+H]2-
dissociation. See Chapter 6 for the discussion of the meaning of these activation
energies.
0%
20%
40%
60%
80%
100%
0.9 1.4 1.9 2.4 2.9 3.4 3.9
Rela
tive A
bundance
Ecom
SO3 loss
SO2 loss
[MnIIITPPS+H]2-
: RRKM result
•••••••: Experimental data
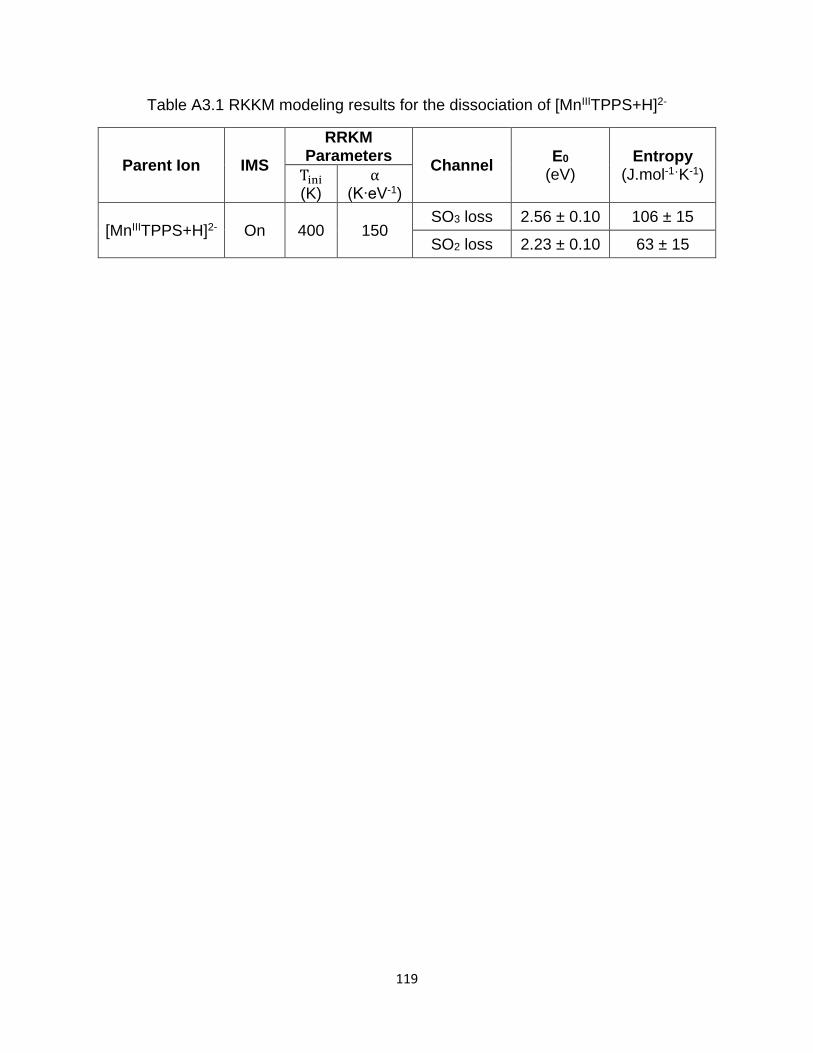
119
Table A3.1 RKKM modeling results for the dissociation of [MnIIITPPS+H]2-
Parent Ion IMS
RRKM Parameters
Channel E0
(eV) Entropy
(J.mol-1ˑK-1) Tini (K)
α (K∙eV-1)
[MnIIITPPS+H]2- On 400 150 SO3 loss 2.56 ± 0.10 106 ± 15
SO2 loss 2.23 ± 0.10 63 ± 15
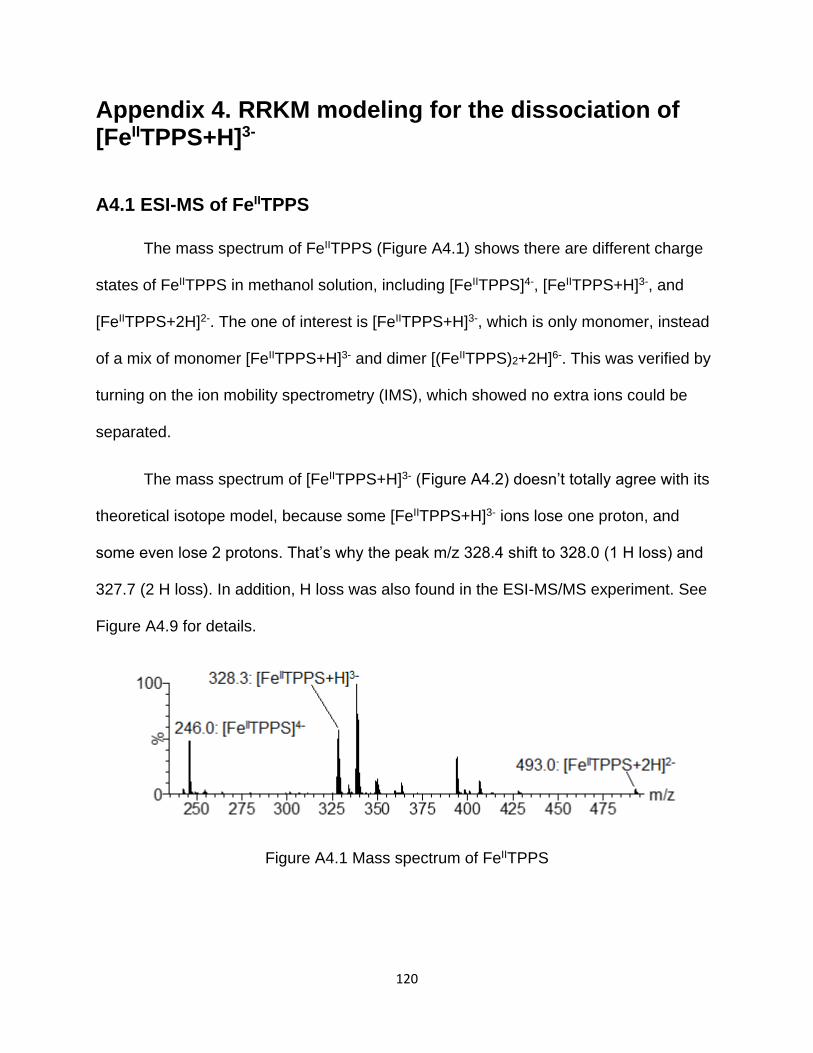
120
Appendix 4. RRKM modeling for the dissociation of [FeIITPPS+H]3-
A4.1 ESI-MS of FeIITPPS
The mass spectrum of FeIITPPS (Figure A4.1) shows there are different charge
states of FeIITPPS in methanol solution, including [FeIITPPS]4-, [FeIITPPS+H]3-, and
[FeIITPPS+2H]2-. The one of interest is [FeIITPPS+H]3-, which is only monomer, instead
of a mix of monomer [FeIITPPS+H]3- and dimer [(FeIITPPS)2+2H]6-. This was verified by
turning on the ion mobility spectrometry (IMS), which showed no extra ions could be
separated.
The mass spectrum of [FeIITPPS+H]3- (Figure A4.2) doesn’t totally agree with its
theoretical isotope model, because some [FeIITPPS+H]3- ions lose one proton, and
some even lose 2 protons. That’s why the peak m/z 328.4 shift to 328.0 (1 H loss) and
327.7 (2 H loss). In addition, H loss was also found in the ESI-MS/MS experiment. See
Figure A4.9 for details.
Figure A4.1 Mass spectrum of FeIITPPS
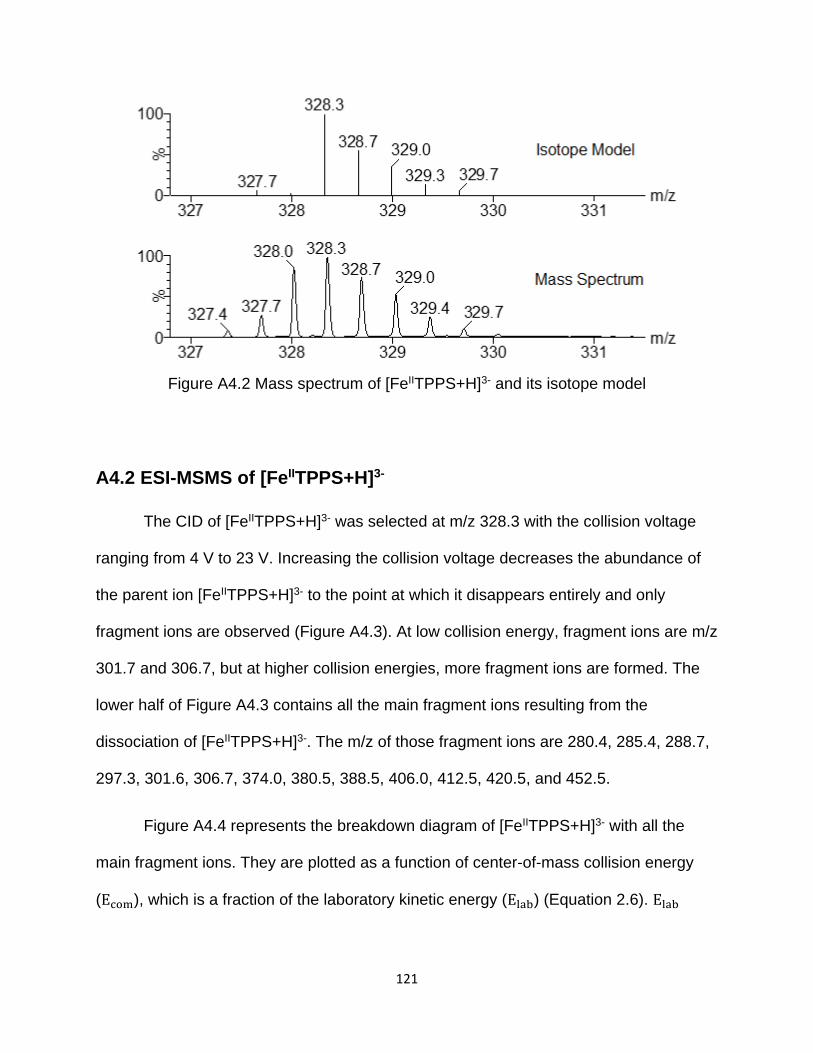
121
Figure A4.2 Mass spectrum of [FeIITPPS+H]3- and its isotope model
A4.2 ESI-MSMS of [FeIITPPS+H]3-
The CID of [FeIITPPS+H]3- was selected at m/z 328.3 with the collision voltage
ranging from 4 V to 23 V. Increasing the collision voltage decreases the abundance of
the parent ion [FeIITPPS+H]3- to the point at which it disappears entirely and only
fragment ions are observed (Figure A4.3). At low collision energy, fragment ions are m/z
301.7 and 306.7, but at higher collision energies, more fragment ions are formed. The
lower half of Figure A4.3 contains all the main fragment ions resulting from the
dissociation of [FeIITPPS+H]3-. The m/z of those fragment ions are 280.4, 285.4, 288.7,
297.3, 301.6, 306.7, 374.0, 380.5, 388.5, 406.0, 412.5, 420.5, and 452.5.
Figure A4.4 represents the breakdown diagram of [FeIITPPS+H]3- with all the
main fragment ions. They are plotted as a function of center-of-mass collision energy
(Ecom), which is a fraction of the laboratory kinetic energy (Elab) (Equation 2.6). Elab
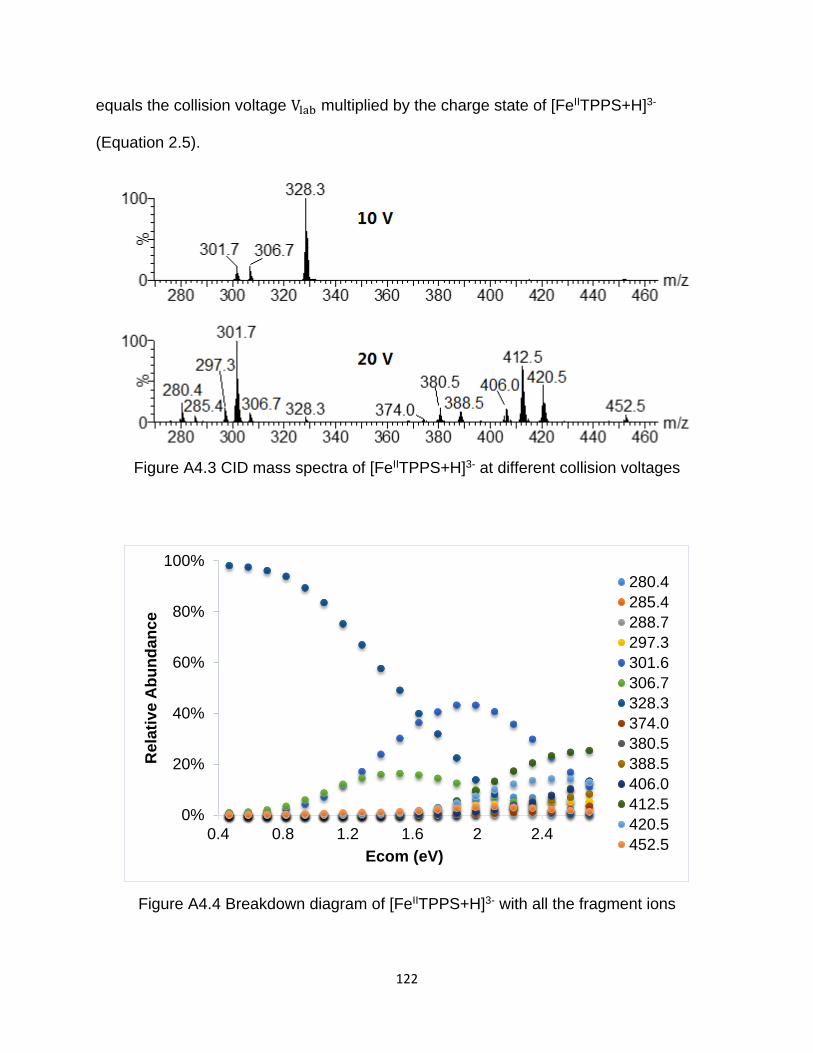
122
equals the collision voltage Vlab multiplied by the charge state of [FeIITPPS+H]3-
(Equation 2.5).
Figure A4.3 CID mass spectra of [FeIITPPS+H]3- at different collision voltages
Figure A4.4 Breakdown diagram of [FeIITPPS+H]3- with all the fragment ions
0%
20%
40%
60%
80%
100%
0.4 0.8 1.2 1.6 2 2.4
Rela
tiv
e A
bu
nd
an
ce
Ecom (eV)
280.4
285.4
288.7
297.3
301.6
306.7
328.3
374.0
380.5
388.5
406.0
412.5
420.5
452.5
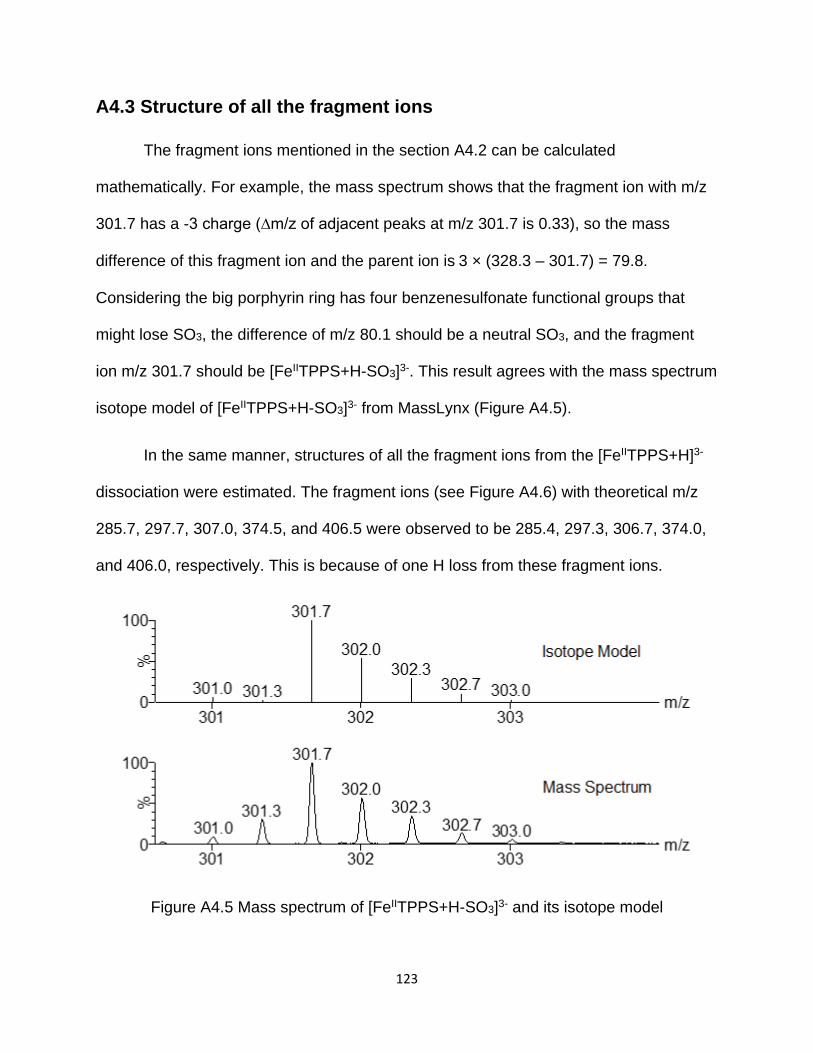
123
A4.3 Structure of all the fragment ions
The fragment ions mentioned in the section A4.2 can be calculated
mathematically. For example, the mass spectrum shows that the fragment ion with m/z
301.7 has a -3 charge (∆m/z of adjacent peaks at m/z 301.7 is 0.33), so the mass
difference of this fragment ion and the parent ion is 3 × (328.3 – 301.7) = 79.8.
Considering the big porphyrin ring has four benzenesulfonate functional groups that
might lose SO3, the difference of m/z 80.1 should be a neutral SO3, and the fragment
ion m/z 301.7 should be [FeIITPPS+H-SO3]3-. This result agrees with the mass spectrum
isotope model of [FeIITPPS+H-SO3]3- from MassLynx (Figure A4.5).
In the same manner, structures of all the fragment ions from the [FeIITPPS+H]3-
dissociation were estimated. The fragment ions (see Figure A4.6) with theoretical m/z
285.7, 297.7, 307.0, 374.5, and 406.5 were observed to be 285.4, 297.3, 306.7, 374.0,
and 406.0, respectively. This is because of one H loss from these fragment ions.
Figure A4.5 Mass spectrum of [FeIITPPS+H-SO3]3- and its isotope model
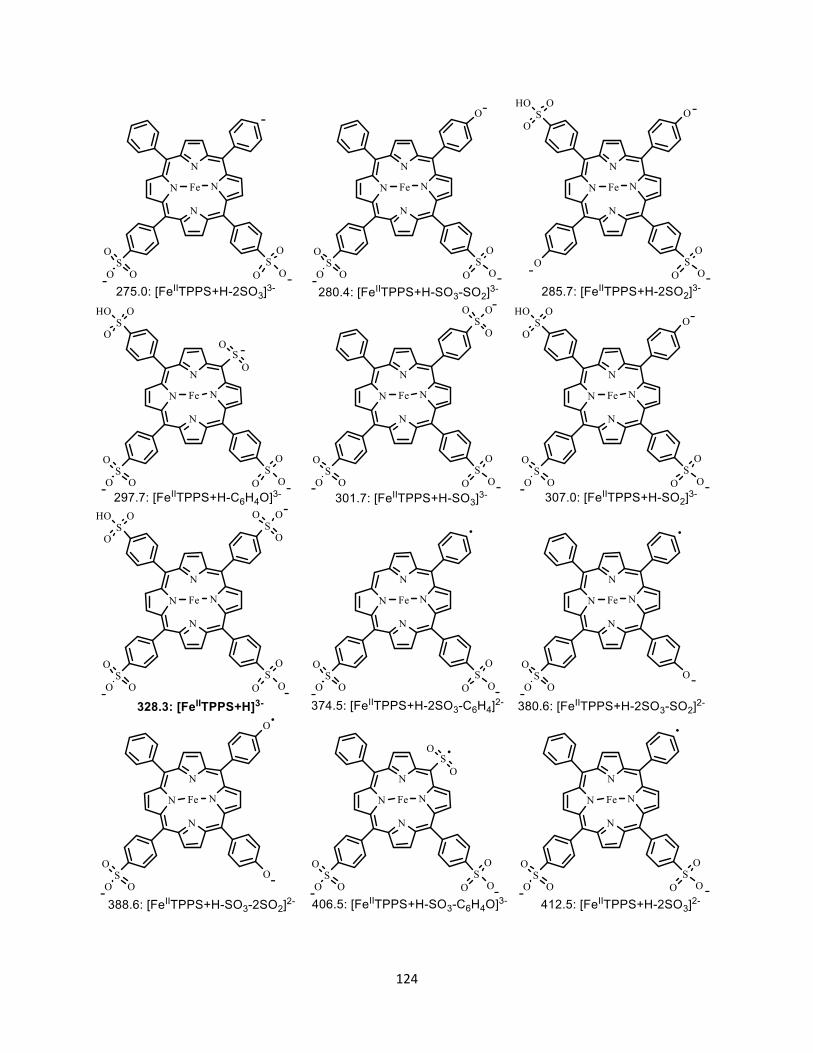
124
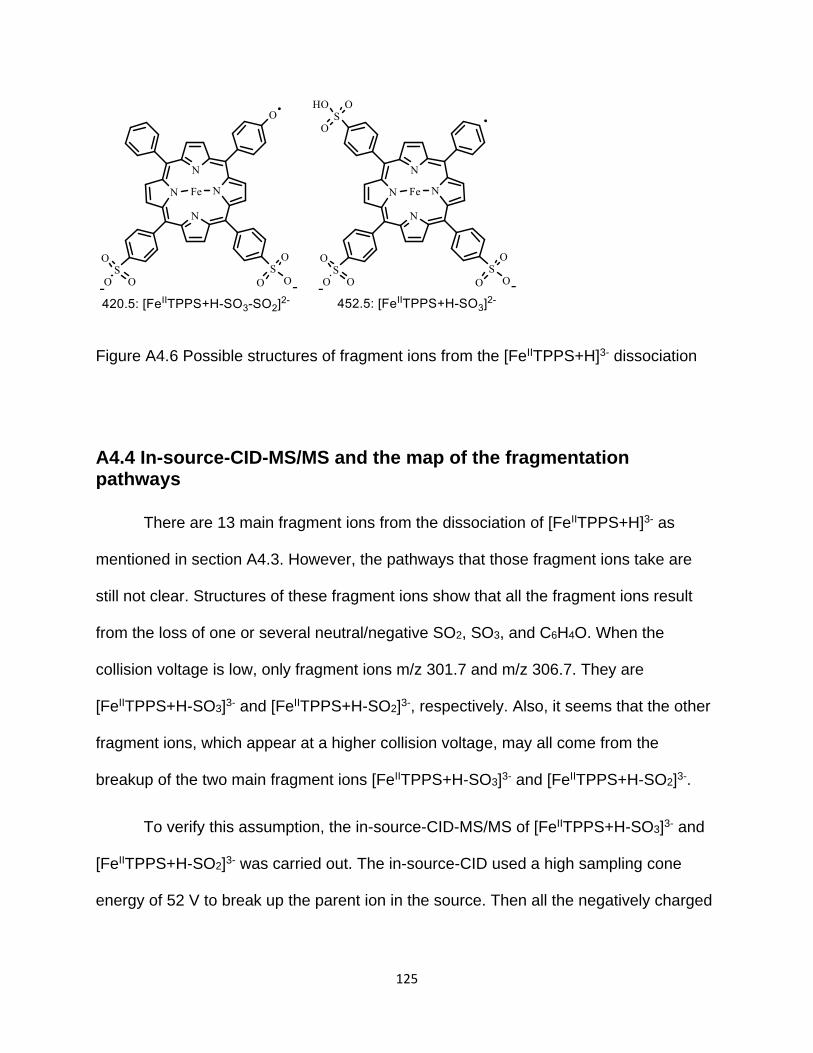
125
Figure A4.6 Possible structures of fragment ions from the [FeIITPPS+H]3- dissociation
A4.4 In-source-CID-MS/MS and the map of the fragmentation pathways
There are 13 main fragment ions from the dissociation of [FeIITPPS+H]3- as
mentioned in section A4.3. However, the pathways that those fragment ions take are
still not clear. Structures of these fragment ions show that all the fragment ions result
from the loss of one or several neutral/negative SO2, SO3, and C6H4O. When the
collision voltage is low, only fragment ions m/z 301.7 and m/z 306.7. They are
[FeIITPPS+H-SO3]3- and [FeIITPPS+H-SO2]3-, respectively. Also, it seems that the other
fragment ions, which appear at a higher collision voltage, may all come from the
breakup of the two main fragment ions [FeIITPPS+H-SO3]3- and [FeIITPPS+H-SO2]3-.
To verify this assumption, the in-source-CID-MS/MS of [FeIITPPS+H-SO3]3- and
[FeIITPPS+H-SO2]3- was carried out. The in-source-CID used a high sampling cone
energy of 52 V to break up the parent ion in the source. Then all the negatively charged
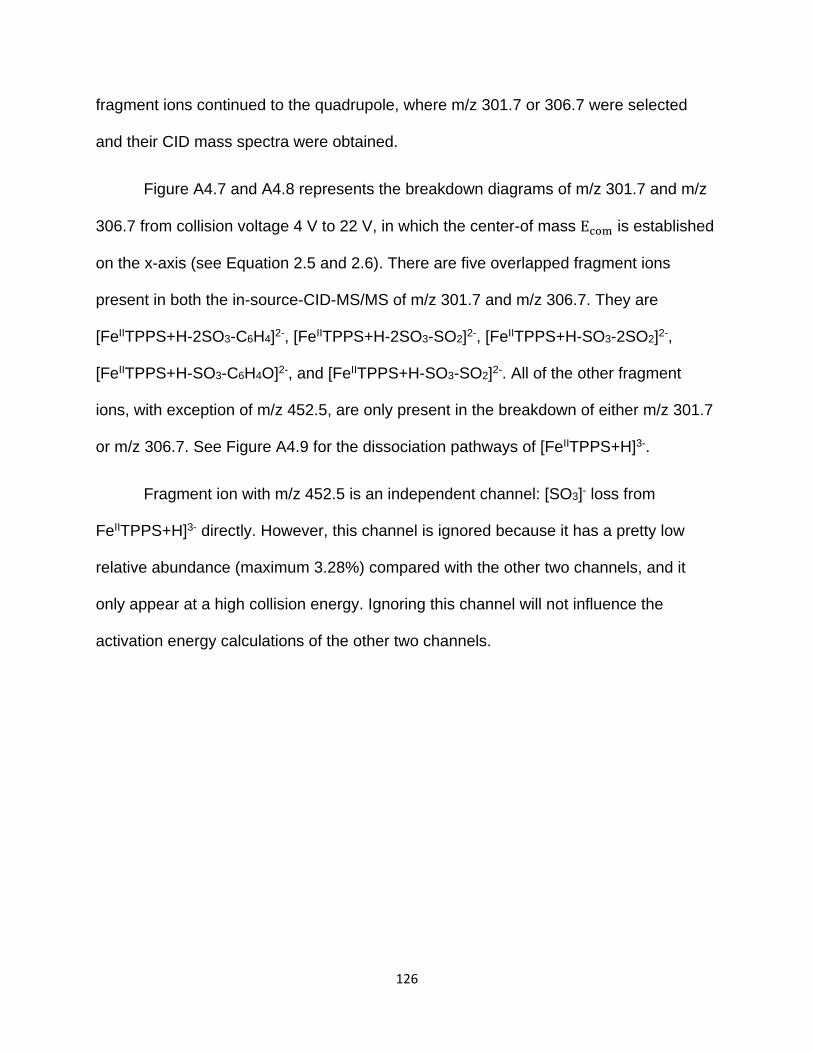
126
fragment ions continued to the quadrupole, where m/z 301.7 or 306.7 were selected
and their CID mass spectra were obtained.
Figure A4.7 and A4.8 represents the breakdown diagrams of m/z 301.7 and m/z
306.7 from collision voltage 4 V to 22 V, in which the center-of mass Ecom is established
on the x-axis (see Equation 2.5 and 2.6). There are five overlapped fragment ions
present in both the in-source-CID-MS/MS of m/z 301.7 and m/z 306.7. They are
[FeIITPPS+H-2SO3-C6H4]2-, [FeIITPPS+H-2SO3-SO2]2-, [FeIITPPS+H-SO3-2SO2]2-,
[FeIITPPS+H-SO3-C6H4O]2-, and [FeIITPPS+H-SO3-SO2]2-. All of the other fragment
ions, with exception of m/z 452.5, are only present in the breakdown of either m/z 301.7
or m/z 306.7. See Figure A4.9 for the dissociation pathways of [FeIITPPS+H]3-.
Fragment ion with m/z 452.5 is an independent channel: [SO3]- loss from
FeIITPPS+H]3- directly. However, this channel is ignored because it has a pretty low
relative abundance (maximum 3.28%) compared with the other two channels, and it
only appear at a high collision energy. Ignoring this channel will not influence the
activation energy calculations of the other two channels.
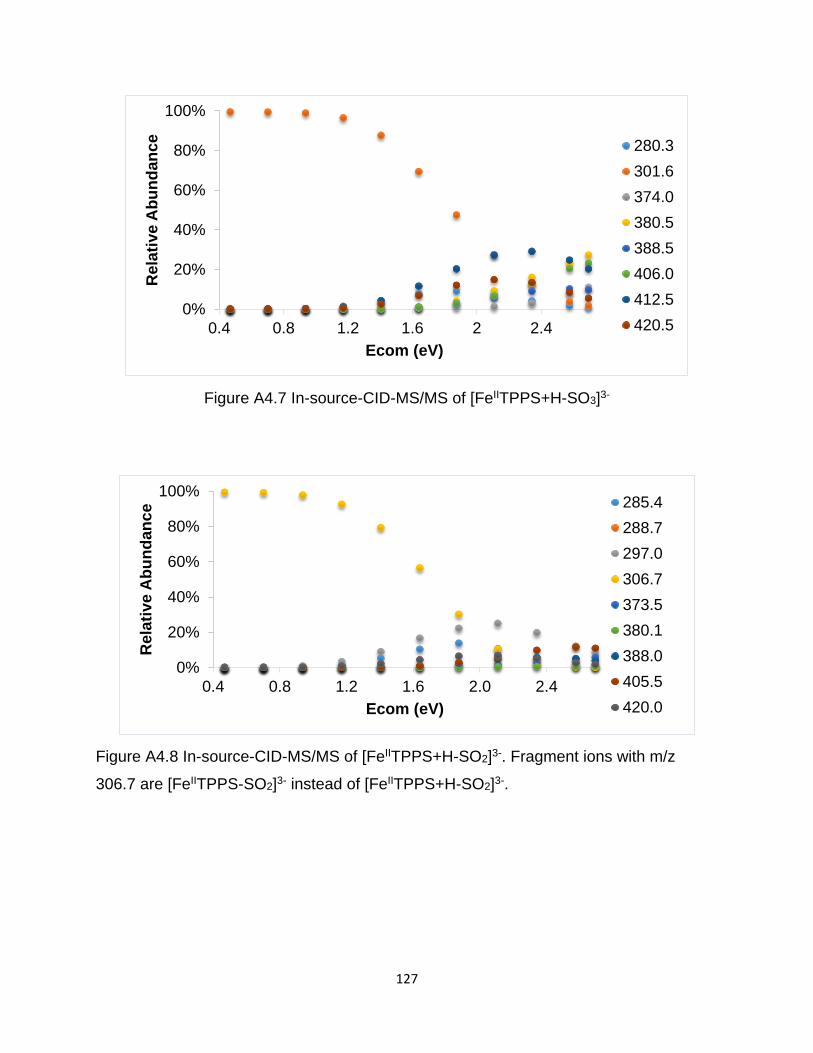
127
Figure A4.7 In-source-CID-MS/MS of [FeIITPPS+H-SO3]3-
Figure A4.8 In-source-CID-MS/MS of [FeIITPPS+H-SO2]3-. Fragment ions with m/z
306.7 are [FeIITPPS-SO2]3- instead of [FeIITPPS+H-SO2]3-.
0%
20%
40%
60%
80%
100%
0.4 0.8 1.2 1.6 2 2.4
Rela
tive A
bu
nd
an
ce
Ecom (eV)
280.3
301.6
374.0
380.5
388.5
406.0
412.5
420.5
0%
20%
40%
60%
80%
100%
0.4 0.8 1.2 1.6 2.0 2.4
Rela
tive A
bu
nd
an
ce
Ecom (eV)
285.4
288.7
297.0
306.7
373.5
380.1
388.0
405.5
420.0
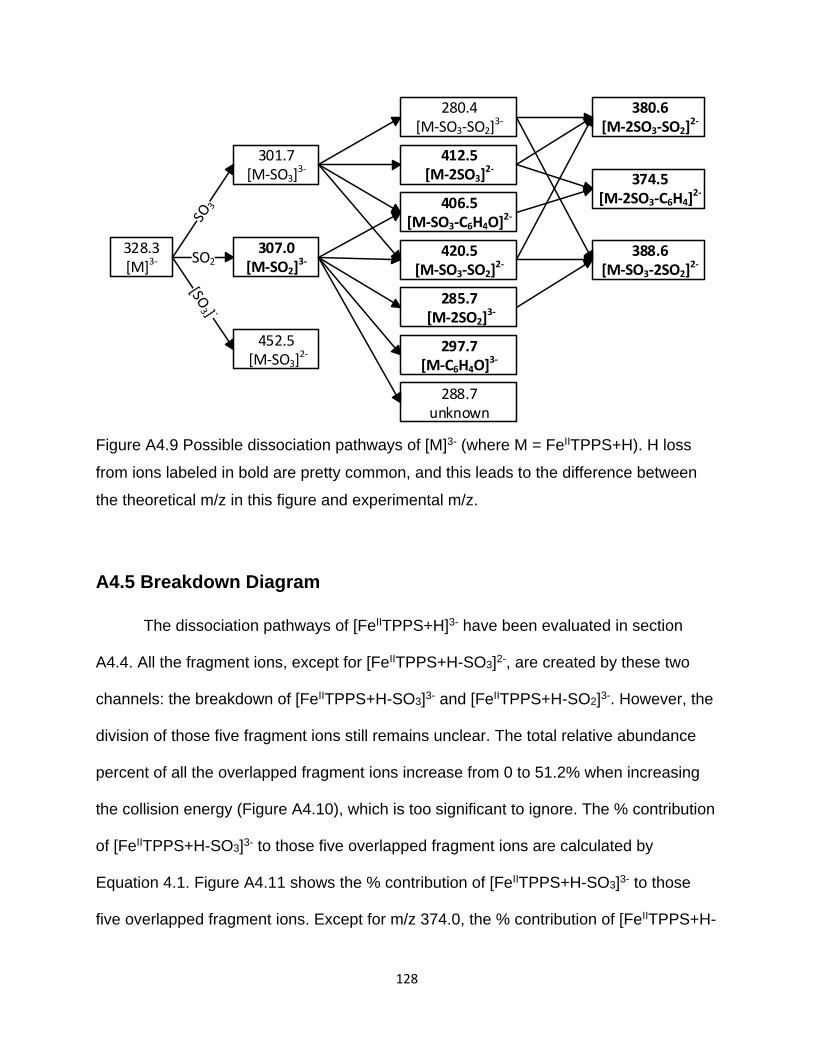
128
328.3[M]3-
301.7[M-SO3]
3-
420.5[M-SO3-SO2]2-
307.0[M-SO2]3-
285.7 [M-2SO2]3-
297.7[M-C6H4O]3-
452.5 [M-SO3]2-
406.5[M-SO3-C6H4O]2-
412.5[M-2SO3]2-
374.5[M-2SO3-C6H4]2-
280.4[M-SO3-SO2]3-
388.6[M-SO3-2SO2]
2-SO2
380.6[M-2SO3-SO2]
2-
288.7unknown
Figure A4.9 Possible dissociation pathways of [M]3- (where M = FeIITPPS+H). H loss
from ions labeled in bold are pretty common, and this leads to the difference between
the theoretical m/z in this figure and experimental m/z.
A4.5 Breakdown Diagram
The dissociation pathways of [FeIITPPS+H]3- have been evaluated in section
A4.4. All the fragment ions, except for [FeIITPPS+H-SO3]2-, are created by these two
channels: the breakdown of [FeIITPPS+H-SO3]3- and [FeIITPPS+H-SO2]3-. However, the
division of those five fragment ions still remains unclear. The total relative abundance
percent of all the overlapped fragment ions increase from 0 to 51.2% when increasing
the collision energy (Figure A4.10), which is too significant to ignore. The % contribution
of [FeIITPPS+H-SO3]3- to those five overlapped fragment ions are calculated by
Equation 4.1. Figure A4.11 shows the % contribution of [FeIITPPS+H-SO3]3- to those
five overlapped fragment ions. Except for m/z 374.0, the % contribution of [FeIITPPS+H-
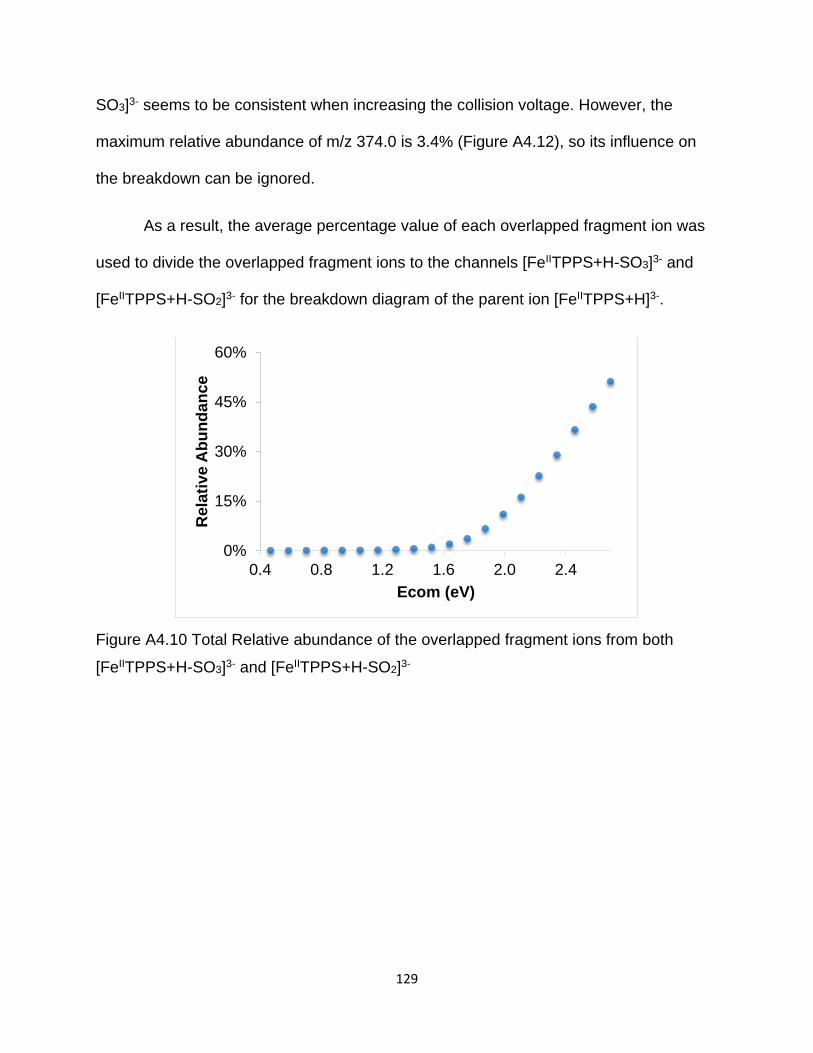
129
SO3]3- seems to be consistent when increasing the collision voltage. However, the
maximum relative abundance of m/z 374.0 is 3.4% (Figure A4.12), so its influence on
the breakdown can be ignored.
As a result, the average percentage value of each overlapped fragment ion was
used to divide the overlapped fragment ions to the channels [FeIITPPS+H-SO3]3- and
[FeIITPPS+H-SO2]3- for the breakdown diagram of the parent ion [FeIITPPS+H]3-.
Figure A4.10 Total Relative abundance of the overlapped fragment ions from both
[FeIITPPS+H-SO3]3- and [FeIITPPS+H-SO2]3-
0%
15%
30%
45%
60%
0.4 0.8 1.2 1.6 2.0 2.4
Rela
tive A
bu
nd
an
ce
Ecom (eV)
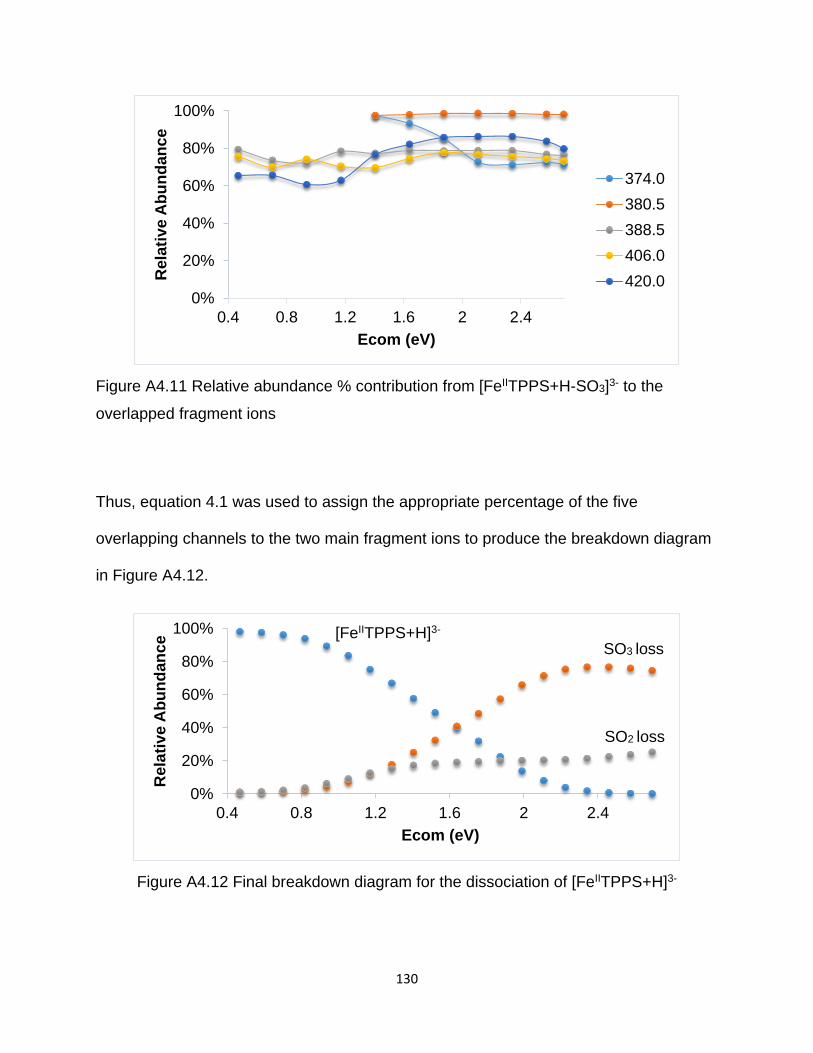
130
Figure A4.11 Relative abundance % contribution from [FeIITPPS+H-SO3]3- to the
overlapped fragment ions
Thus, equation 4.1 was used to assign the appropriate percentage of the five
overlapping channels to the two main fragment ions to produce the breakdown diagram
in Figure A4.12.
Figure A4.12 Final breakdown diagram for the dissociation of [FeIITPPS+H]3-
0%
20%
40%
60%
80%
100%
0.4 0.8 1.2 1.6 2 2.4
Rela
tive A
bu
nd
an
ce
Ecom (eV)
374.0
380.5
388.5
406.0
420.0
0%
20%
40%
60%
80%
100%
0.4 0.8 1.2 1.6 2 2.4
Rela
tive A
bu
nd
an
ce
Ecom (eV)
SO3 loss
SO2 loss
[FeIITPPS+H]3-
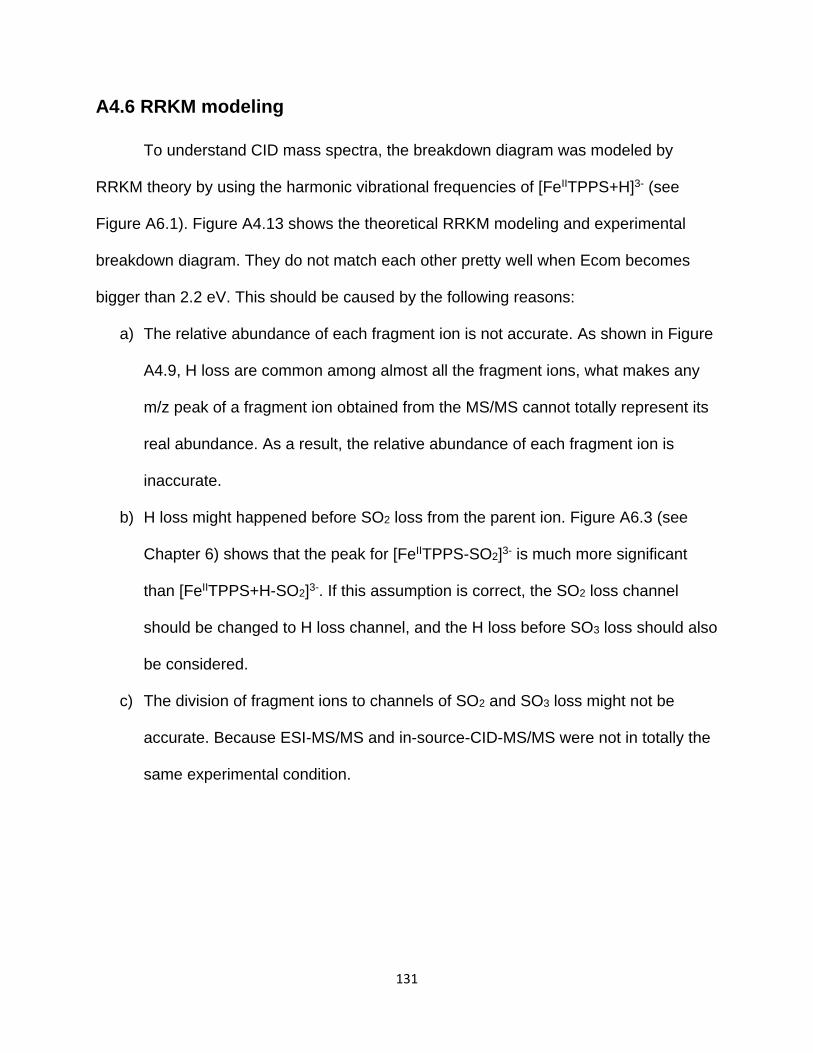
131
A4.6 RRKM modeling
To understand CID mass spectra, the breakdown diagram was modeled by
RRKM theory by using the harmonic vibrational frequencies of [FeIITPPS+H]3- (see
Figure A6.1). Figure A4.13 shows the theoretical RRKM modeling and experimental
breakdown diagram. They do not match each other pretty well when Ecom becomes
bigger than 2.2 eV. This should be caused by the following reasons:
a) The relative abundance of each fragment ion is not accurate. As shown in Figure
A4.9, H loss are common among almost all the fragment ions, what makes any
m/z peak of a fragment ion obtained from the MS/MS cannot totally represent its
real abundance. As a result, the relative abundance of each fragment ion is
inaccurate.
b) H loss might happened before SO2 loss from the parent ion. Figure A6.3 (see
Chapter 6) shows that the peak for [FeIITPPS-SO2]3- is much more significant
than [FeIITPPS+H-SO2]3-. If this assumption is correct, the SO2 loss channel
should be changed to H loss channel, and the H loss before SO3 loss should also
be considered.
c) The division of fragment ions to channels of SO2 and SO3 loss might not be
accurate. Because ESI-MS/MS and in-source-CID-MS/MS were not in totally the
same experimental condition.
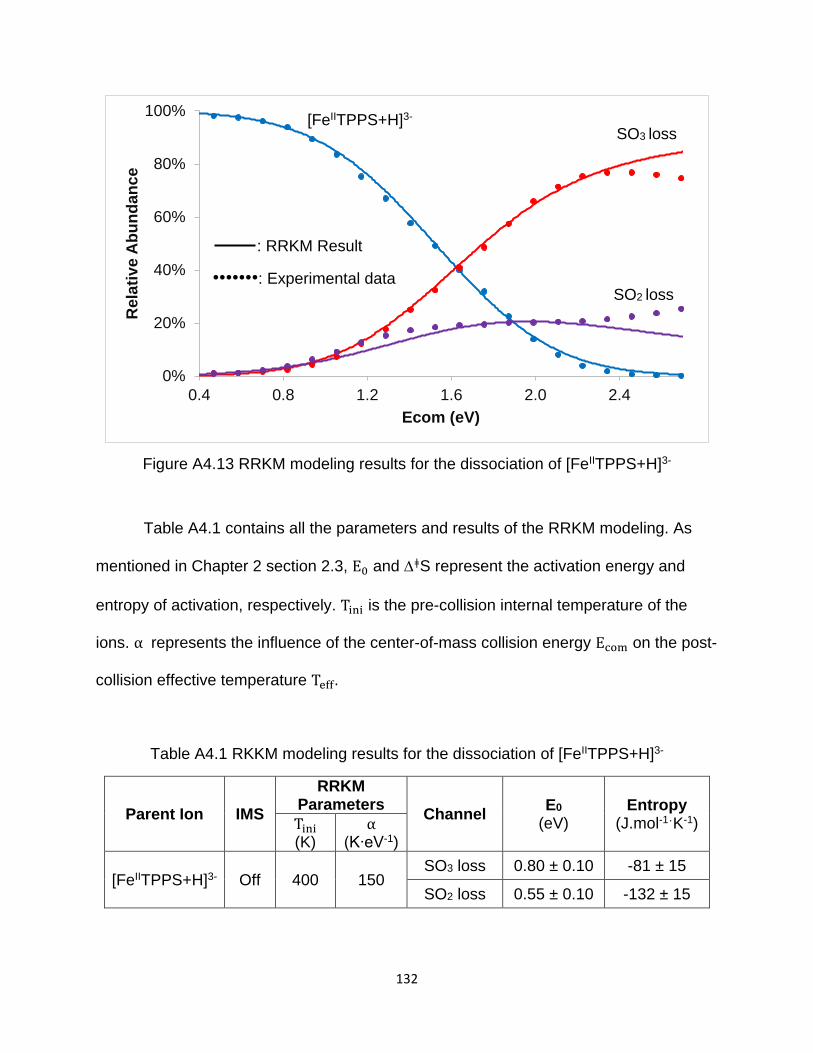
132
Figure A4.13 RRKM modeling results for the dissociation of [FeIITPPS+H]3-
Table A4.1 contains all the parameters and results of the RRKM modeling. As
mentioned in Chapter 2 section 2.3, E0 and ǂS represent the activation energy and
entropy of activation, respectively. Tini is the pre-collision internal temperature of the
ions. α represents the influence of the center-of-mass collision energy Ecom on the post-
collision effective temperature Teff.
Table A4.1 RKKM modeling results for the dissociation of [FeIITPPS+H]3-
Parent Ion IMS
RRKM Parameters
Channel E0
(eV) Entropy
(J.mol-1ˑK-1) Tini (K)
α (K∙eV-1)
[FeIITPPS+H]3- Off 400 150 SO3 loss 0.80 ± 0.10 -81 ± 15
SO2 loss 0.55 ± 0.10 -132 ± 15
0%
20%
40%
60%
80%
100%
0.4 0.8 1.2 1.6 2.0 2.4
Rela
tive A
bu
nd
an
ce
Ecom (eV)
SO3 loss
: RRKM Result
•••••••: Experimental data SO2 loss
[FeIITPPS+H]3-
133
Appendix 5. RRKM modeling for the dissociation of [FeIITPPS+2H]2-
A5.1 ESI-MS of FeIITPPS
As discussed in section A4.1 of Appendix 4, the mass spectrum of FeIITPPS
shows that there are different charge states of FeIITPPS in a methanol solution,
including [FeIITPPS]4-, [FeIITPPS+2H]2-, and a minimal amount of [FeIITPPS+2H]2-. In
this chapter, the primary focus is to study [FeIITPPS+2H]2-. Mass spectrum (MS) (Figure
A5.1) shows that the peak m/z 493.0 is a mix of monomer [FeIITPPS+2H]2- and dimer
[(FeIITPPS)2+4H]4-. When selecting FeIITPPS at m/z 493.0 by quadrupole and then
separating it by ion mobility separation (IMS), IMS shows that m/z 493.0 contains a
large abundance of both monomer and dimer in high concentration (2.5 × 10⁻⁴ mol/L),
but for the vast majority it is composed of monomer at low concentration (0.5 × 10⁻⁵
mol/L) (Figure A5.1).
In order to achieve good concentration of monomer [FeIITPPS+2H]2- all while
protecting the instrument, a low concentrated FeIITPPS solution was used for the
following ESI-MS/MS experiment. Figure A5.2 describes the mass spectrum of
monomer after they were separated by IMS. In general, this figure coincides with its
isotope model pretty well with the exception of the small peak at 492.6 (corresponding
[FeIITPPS+H]2-).
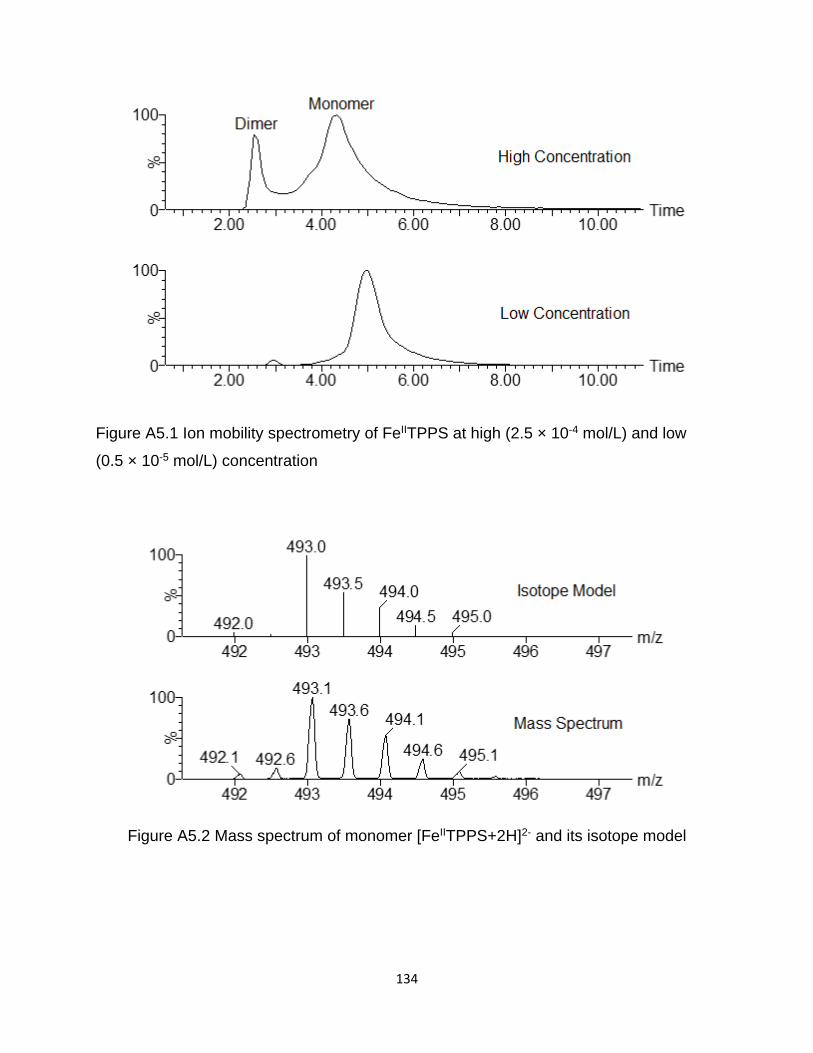
134
Figure A5.1 Ion mobility spectrometry of FeIITPPS at high (2.5 × 10⁻⁴ mol/L) and low
(0.5 × 10⁻⁵ mol/L) concentration
Figure A5.2 Mass spectrum of monomer [FeIITPPS+2H]2- and its isotope model
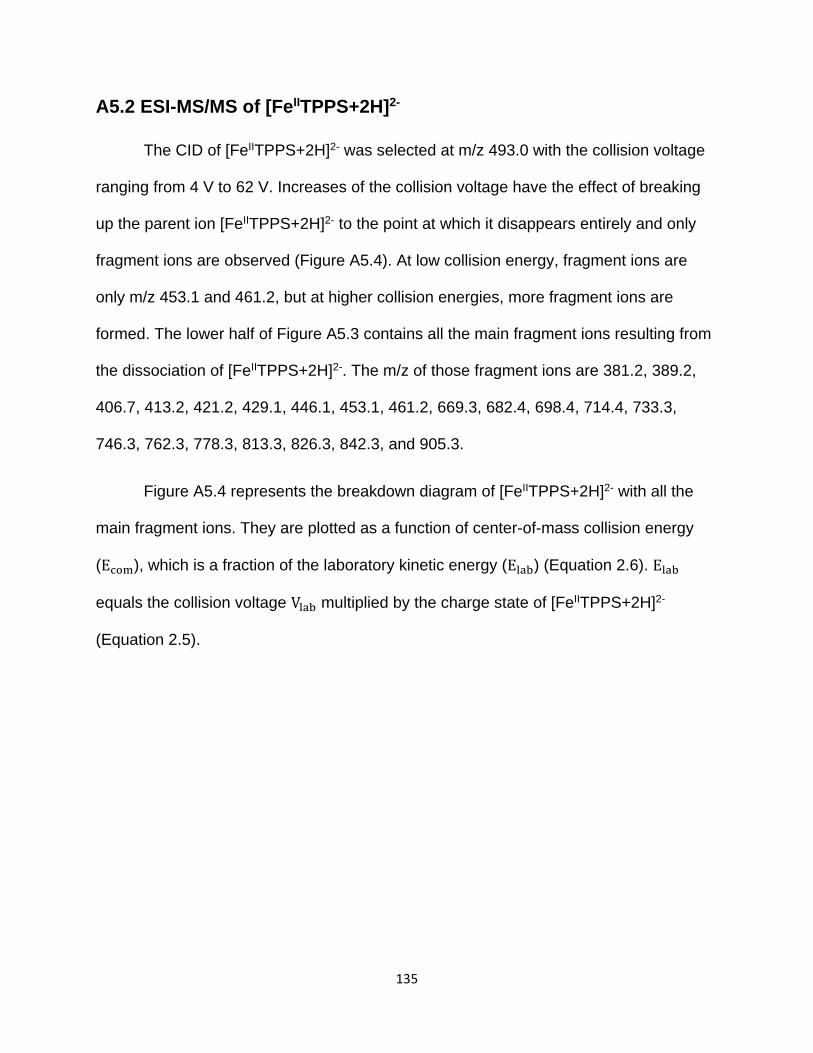
135
A5.2 ESI-MS/MS of [FeIITPPS+2H]2-
The CID of [FeIITPPS+2H]2- was selected at m/z 493.0 with the collision voltage
ranging from 4 V to 62 V. Increases of the collision voltage have the effect of breaking
up the parent ion [FeIITPPS+2H]2- to the point at which it disappears entirely and only
fragment ions are observed (Figure A5.4). At low collision energy, fragment ions are
only m/z 453.1 and 461.2, but at higher collision energies, more fragment ions are
formed. The lower half of Figure A5.3 contains all the main fragment ions resulting from
the dissociation of [FeIITPPS+2H]2-. The m/z of those fragment ions are 381.2, 389.2,
406.7, 413.2, 421.2, 429.1, 446.1, 453.1, 461.2, 669.3, 682.4, 698.4, 714.4, 733.3,
746.3, 762.3, 778.3, 813.3, 826.3, 842.3, and 905.3.
Figure A5.4 represents the breakdown diagram of [FeIITPPS+2H]2- with all the
main fragment ions. They are plotted as a function of center-of-mass collision energy
(Ecom), which is a fraction of the laboratory kinetic energy (Elab) (Equation 2.6). Elab
equals the collision voltage Vlab multiplied by the charge state of [FeIITPPS+2H]2-
(Equation 2.5).
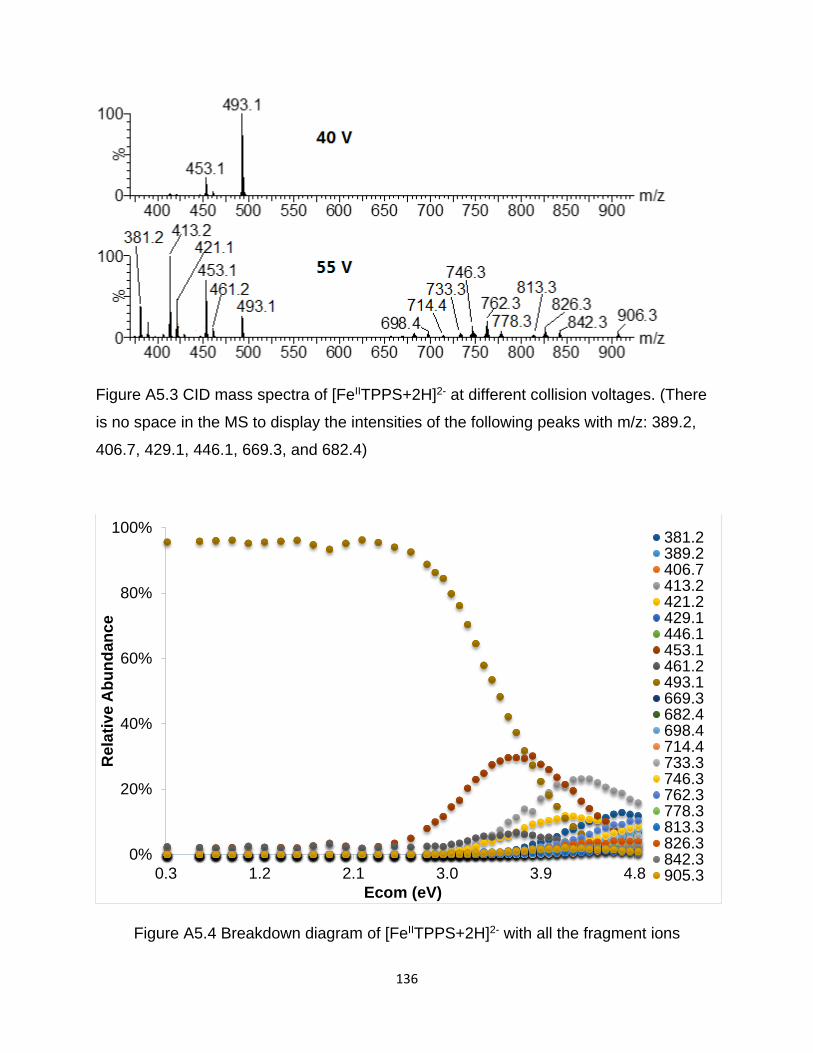
136
Figure A5.3 CID mass spectra of [FeIITPPS+2H]2- at different collision voltages. (There
is no space in the MS to display the intensities of the following peaks with m/z: 389.2,
406.7, 429.1, 446.1, 669.3, and 682.4)
Figure A5.4 Breakdown diagram of [FeIITPPS+2H]2- with all the fragment ions
0%
20%
40%
60%
80%
100%
0.3 1.2 2.1 3.0 3.9 4.8
Rela
tive
Ab
un
dan
ce
Ecom (eV)
381.2389.2406.7413.2421.2429.1446.1453.1461.2493.1669.3682.4698.4714.4733.3746.3762.3778.3813.3826.3842.3905.3
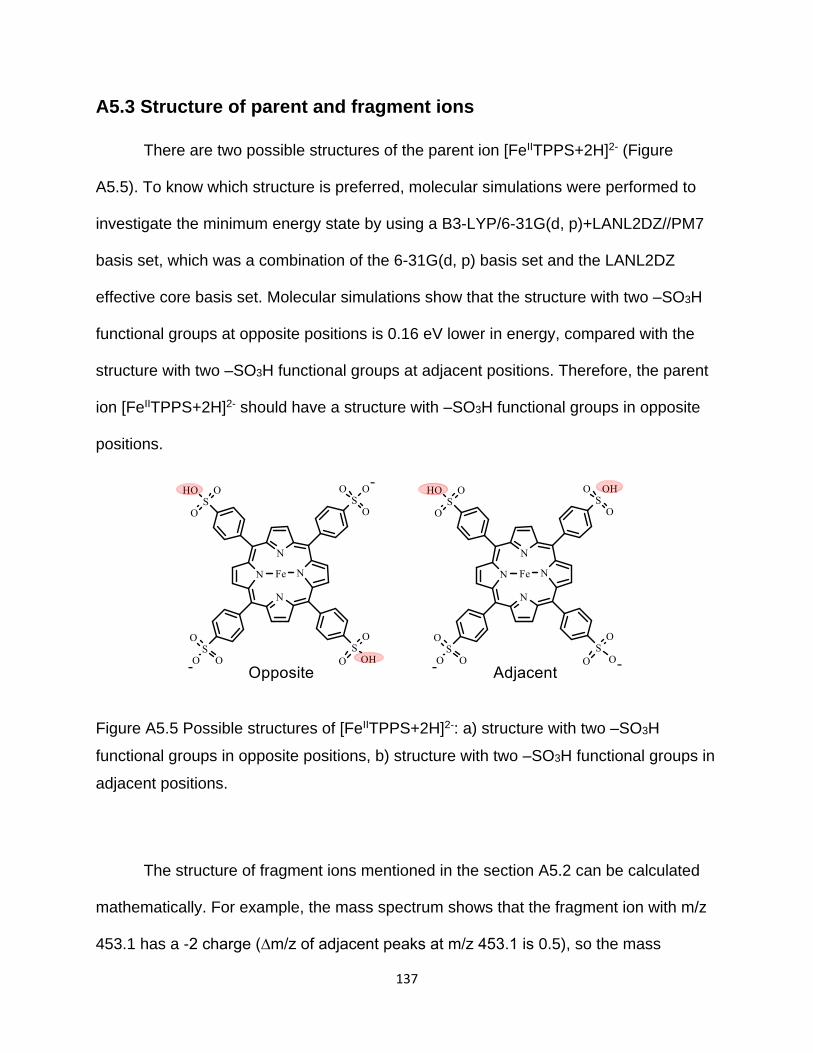
137
A5.3 Structure of parent and fragment ions
There are two possible structures of the parent ion [FeIITPPS+2H]2- (Figure
A5.5). To know which structure is preferred, molecular simulations were performed to
investigate the minimum energy state by using a B3-LYP/6-31G(d, p)+LANL2DZ//PM7
basis set, which was a combination of the 6-31G(d, p) basis set and the LANL2DZ
effective core basis set. Molecular simulations show that the structure with two –SO3H
functional groups at opposite positions is 0.16 eV lower in energy, compared with the
structure with two –SO3H functional groups at adjacent positions. Therefore, the parent
ion [FeIITPPS+2H]2- should have a structure with –SO3H functional groups in opposite
positions.
Figure A5.5 Possible structures of [FeIITPPS+2H]2-: a) structure with two –SO3H
functional groups in opposite positions, b) structure with two –SO3H functional groups in
adjacent positions.
The structure of fragment ions mentioned in the section A5.2 can be calculated
mathematically. For example, the mass spectrum shows that the fragment ion with m/z
453.1 has a -2 charge (∆m/z of adjacent peaks at m/z 453.1 is 0.5), so the mass
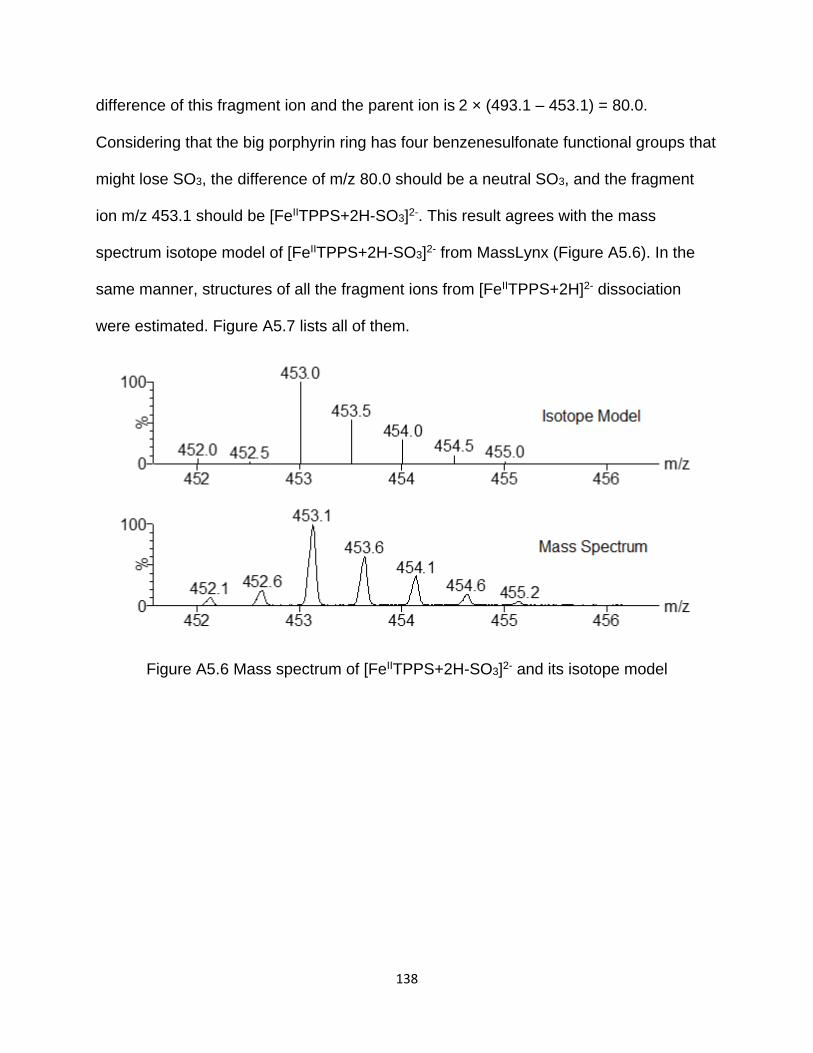
138
difference of this fragment ion and the parent ion is 2 × (493.1 – 453.1) = 80.0.
Considering that the big porphyrin ring has four benzenesulfonate functional groups that
might lose SO3, the difference of m/z 80.0 should be a neutral SO3, and the fragment
ion m/z 453.1 should be [FeIITPPS+2H-SO3]2-. This result agrees with the mass
spectrum isotope model of [FeIITPPS+2H-SO3]2- from MassLynx (Figure A5.6). In the
same manner, structures of all the fragment ions from [FeIITPPS+2H]2- dissociation
were estimated. Figure A5.7 lists all of them.
Figure A5.6 Mass spectrum of [FeIITPPS+2H-SO3]2- and its isotope model
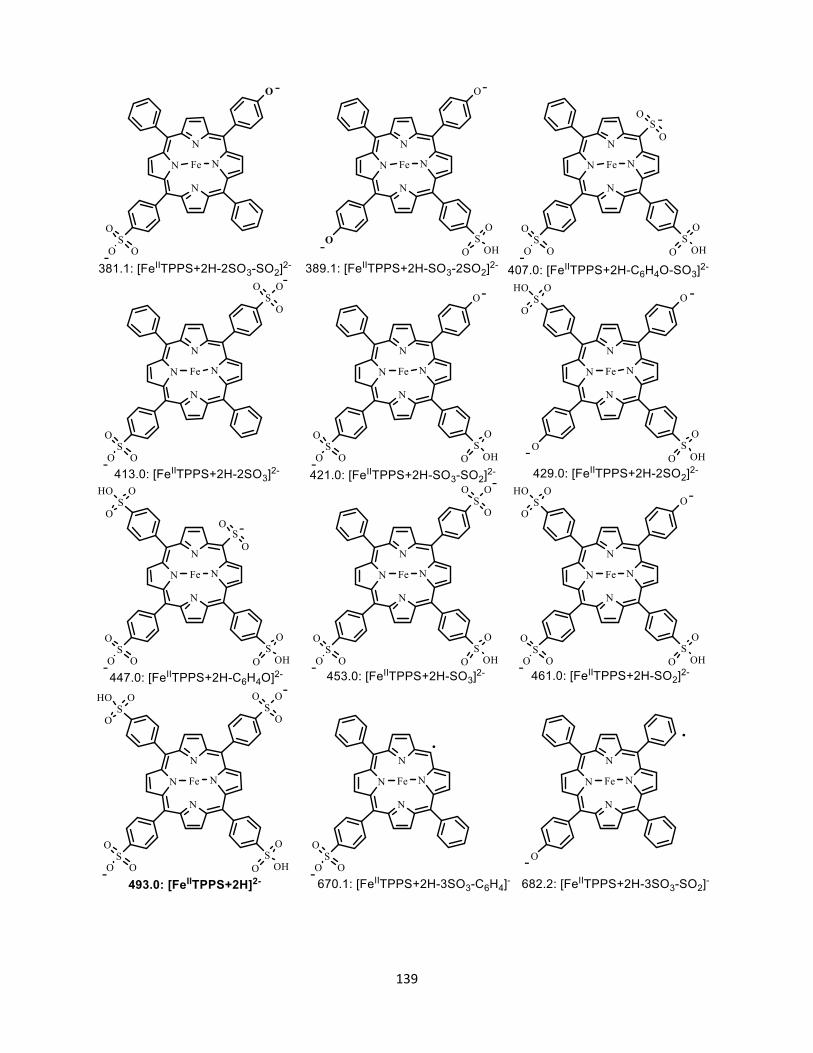
139
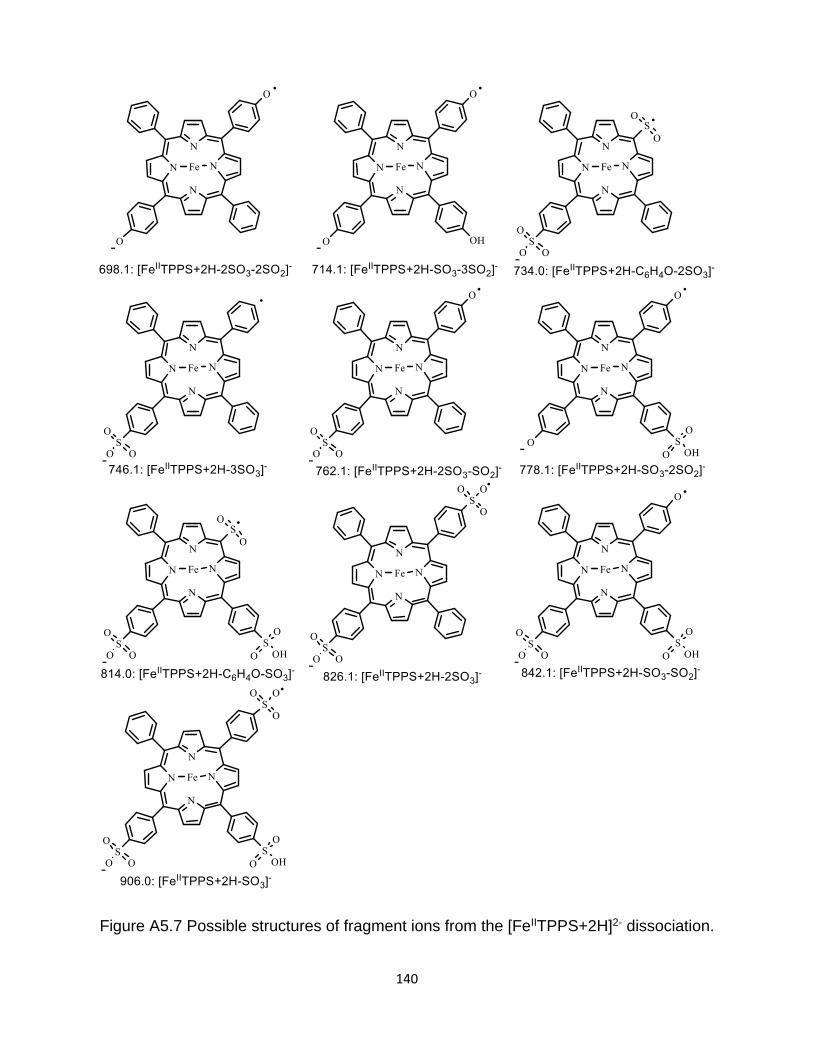
140
Figure A5.7 Possible structures of fragment ions from the [FeIITPPS+2H]2- dissociation.
141
A5.4 In-source-CID-MS/MS and the map of the fragmentation pathways
There are 21 main fragment ions from the dissociation of [FeIITPPS+2H]2- as
mentioned in section A5.3. However, the pathways that these fragment ions take are
still not clear. Structures of these fragment ions shows that all the fragment ions result
from the loss of one or several neutral/negative SO2, SO3, and C6H4O. When the
collision voltage is low, only fragment ions with m/z 453.1 and 493.1 appear. They are
[FeIITPPS+2H-SO3]2- [FeIITPPS+2H-SO2]2-, respectively. This is reasonable considering
that [FeIITPPS+2H]2- has four benzenesulfonate groups, where it can lose SO2/SO3 with
enough energy. Also, it seems that the other fragment ions, which appear at a higher
collision voltage, may all come from the breakup of the two main fragment ions
[FeIITPPS+2H-SO3]2- and [FeIITPPS+2H-SO2]2-.
To verify this assumption, the in-source-CID-MS/MS of [FeIITPPS+2H-SO3]2- and
[FeIITPPS+2H-SO2]2- was carried out. It must be noted that the selected ions should be
m/z 453 and 461, instead of 452.5 and 460.5, for [FeIITPPS+2H]2- (Figure A5.8). The
m/z for [FeIITPPS+2H]2- and [FeIITPPS+H]3- are both correct, so the instrument error
can be ruled out. It should be caused by one hydrogen loss from [FeIITPPS+2H]2- during
the in-source-CID. 65 eV cone voltage in the source might be enough to make H loss
happen.
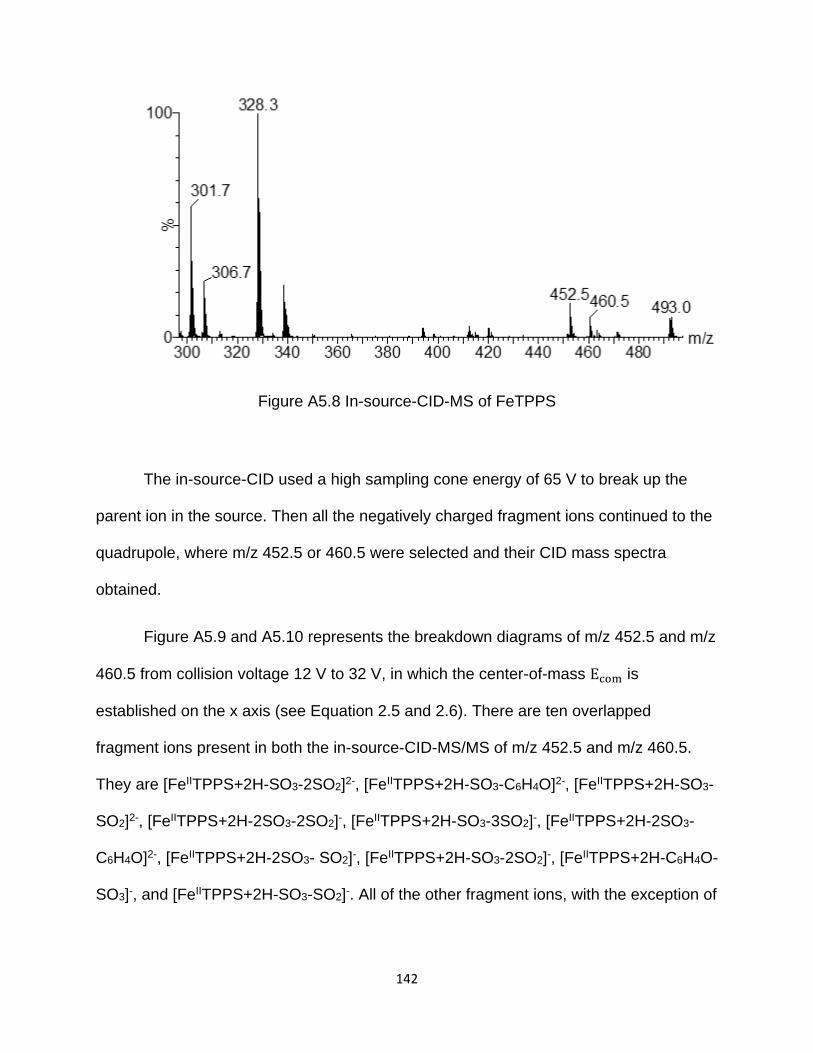
142
Figure A5.8 In-source-CID-MS of FeTPPS
The in-source-CID used a high sampling cone energy of 65 V to break up the
parent ion in the source. Then all the negatively charged fragment ions continued to the
quadrupole, where m/z 452.5 or 460.5 were selected and their CID mass spectra
obtained.
Figure A5.9 and A5.10 represents the breakdown diagrams of m/z 452.5 and m/z
460.5 from collision voltage 12 V to 32 V, in which the center-of-mass Ecom is
established on the x axis (see Equation 2.5 and 2.6). There are ten overlapped
fragment ions present in both the in-source-CID-MS/MS of m/z 452.5 and m/z 460.5.
They are [FeIITPPS+2H-SO3-2SO2]2-, [FeIITPPS+2H-SO3-C6H4O]2-, [FeIITPPS+2H-SO3-
SO2]2-, [FeIITPPS+2H-2SO3-2SO2]-, [FeIITPPS+2H-SO3-3SO2]-, [FeIITPPS+2H-2SO3-
C6H4O]2-, [FeIITPPS+2H-2SO3- SO2]-, [FeIITPPS+2H-SO3-2SO2]-, [FeIITPPS+2H-C6H4O-
SO3]-, and [FeIITPPS+2H-SO3-SO2]-. All of the other fragment ions, with the exception of
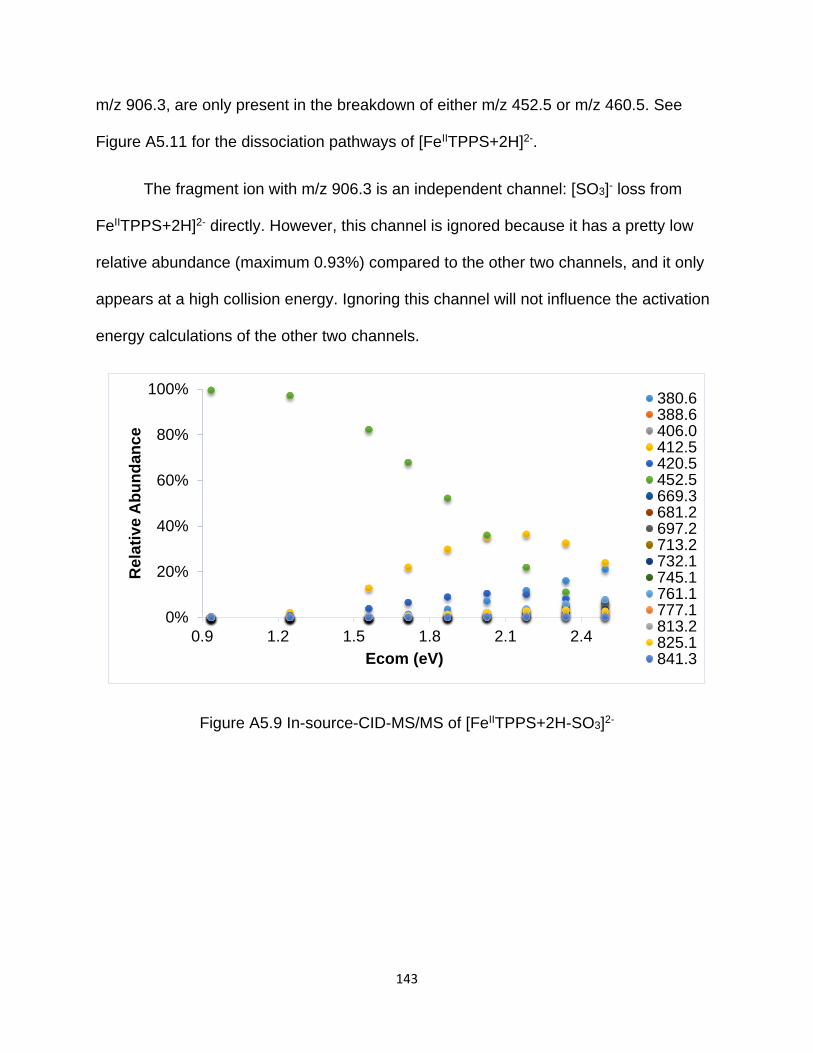
143
m/z 906.3, are only present in the breakdown of either m/z 452.5 or m/z 460.5. See
Figure A5.11 for the dissociation pathways of [FeIITPPS+2H]2-.
The fragment ion with m/z 906.3 is an independent channel: [SO3]- loss from
FeIITPPS+2H]2- directly. However, this channel is ignored because it has a pretty low
relative abundance (maximum 0.93%) compared to the other two channels, and it only
appears at a high collision energy. Ignoring this channel will not influence the activation
energy calculations of the other two channels.
Figure A5.9 In-source-CID-MS/MS of [FeIITPPS+2H-SO3]2-
0%
20%
40%
60%
80%
100%
0.9 1.2 1.5 1.8 2.1 2.4
Rela
tive A
bu
nd
an
ce
Ecom (eV)
380.6388.6406.0412.5420.5452.5669.3681.2697.2713.2732.1745.1761.1777.1813.2825.1841.3
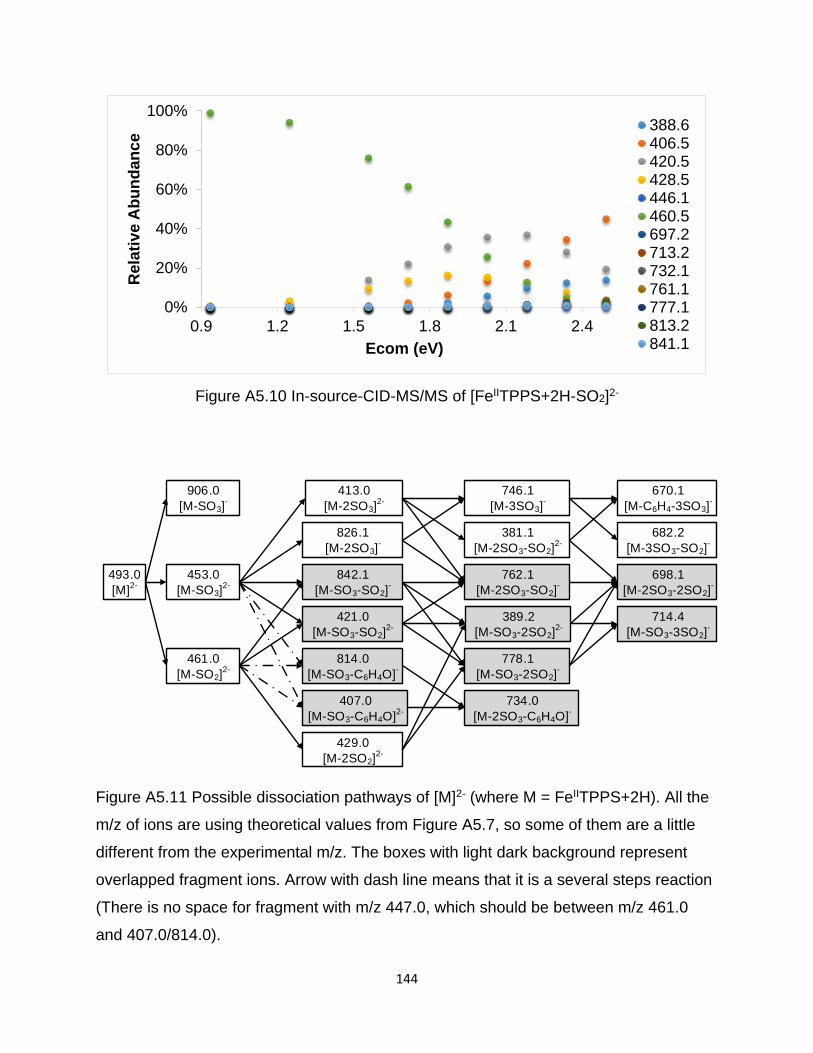
144
Figure A5.10 In-source-CID-MS/MS of [FeIITPPS+2H-SO2]2-
493.0
[M]2-
453.0
[M-SO3]2-
429.0
[M-2SO2]2-
461.0
[M-SO2]2-
842.1
[M-SO3-SO2]-
407.0
[M-SO3-C6H4O]2-
413.0
[M-2SO3]2-
826.1
[M-2SO3]-
381.1
[M-2SO3-SO2]2-
746.1
[M-3SO3]-
778.1
[M-SO3-2SO2]-
421.0
[M-SO3-SO2]2-
762.1
[M-2SO3-SO2]-
389.2
[M-SO3-2SO2]2-
670.1
[M-C6H4-3SO3]-
682.2
[M-3SO3-SO2]-
906.0
[M-SO3]-
698.1
[M-2SO3-2SO2]-
714.4
[M-SO3-3SO2]-
814.0
[M-SO3-C6H4O]-
734.0
[M-2SO3-C6H4O]-
Figure A5.11 Possible dissociation pathways of [M]2- (where M = FeIITPPS+2H). All the
m/z of ions are using theoretical values from Figure A5.7, so some of them are a little
different from the experimental m/z. The boxes with light dark background represent
overlapped fragment ions. Arrow with dash line means that it is a several steps reaction
(There is no space for fragment with m/z 447.0, which should be between m/z 461.0
and 407.0/814.0).
0%
20%
40%
60%
80%
100%
0.9 1.2 1.5 1.8 2.1 2.4
Rela
tive A
bu
nd
an
ce
Ecom (eV)
388.6406.5420.5428.5446.1460.5697.2713.2732.1761.1777.1813.2841.1
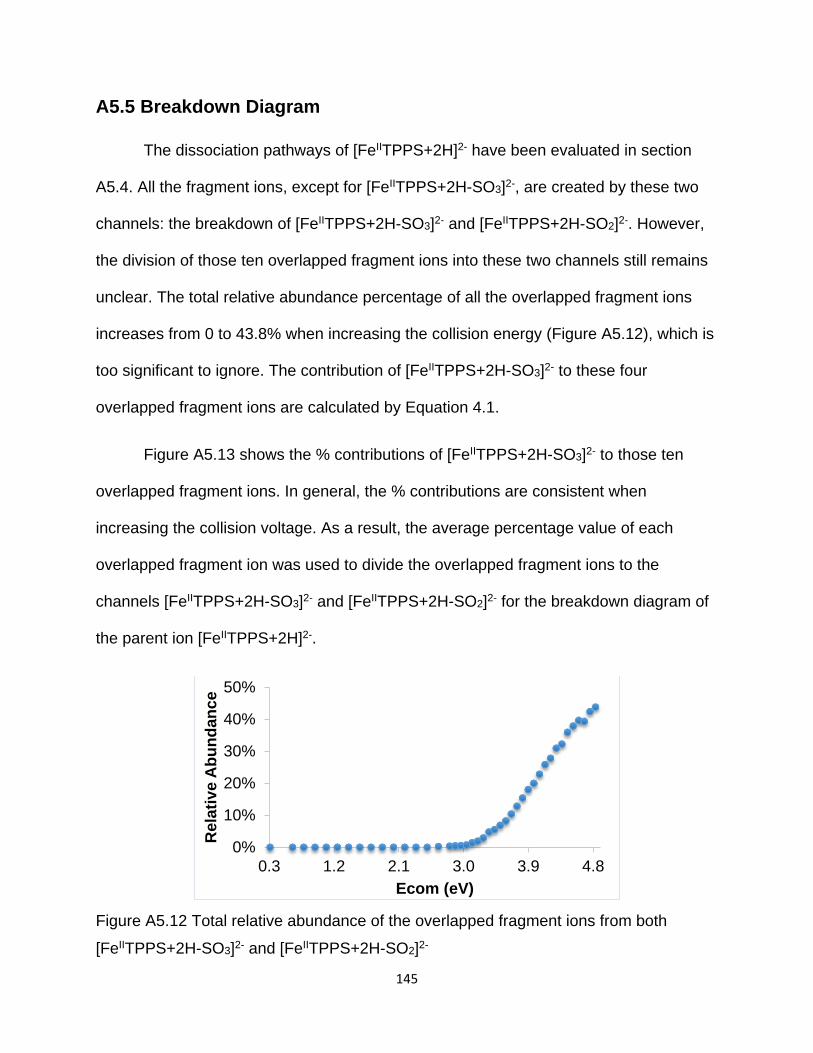
145
A5.5 Breakdown Diagram
The dissociation pathways of [FeIITPPS+2H]2- have been evaluated in section
A5.4. All the fragment ions, except for [FeIITPPS+2H-SO3]2-, are created by these two
channels: the breakdown of [FeIITPPS+2H-SO3]2- and [FeIITPPS+2H-SO2]2-. However,
the division of those ten overlapped fragment ions into these two channels still remains
unclear. The total relative abundance percentage of all the overlapped fragment ions
increases from 0 to 43.8% when increasing the collision energy (Figure A5.12), which is
too significant to ignore. The contribution of [FeIITPPS+2H-SO3]2- to these four
overlapped fragment ions are calculated by Equation 4.1.
Figure A5.13 shows the % contributions of [FeIITPPS+2H-SO3]2- to those ten
overlapped fragment ions. In general, the % contributions are consistent when
increasing the collision voltage. As a result, the average percentage value of each
overlapped fragment ion was used to divide the overlapped fragment ions to the
channels [FeIITPPS+2H-SO3]2- and [FeIITPPS+2H-SO2]2- for the breakdown diagram of
the parent ion [FeIITPPS+2H]2-.
Figure A5.12 Total relative abundance of the overlapped fragment ions from both
[FeIITPPS+2H-SO3]2- and [FeIITPPS+2H-SO2]2-
0%
10%
20%
30%
40%
50%
0.3 1.2 2.1 3.0 3.9 4.8
Rela
tive A
bu
nd
an
ce
Ecom (eV)
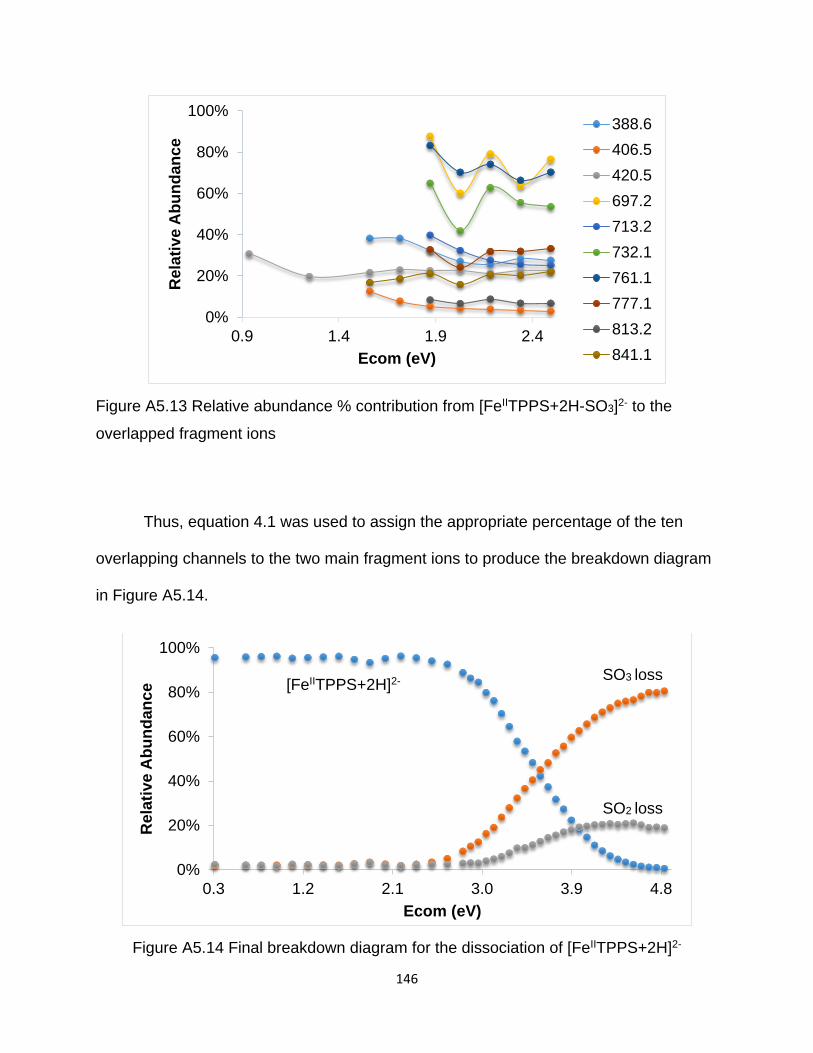
146
Figure A5.13 Relative abundance % contribution from [FeIITPPS+2H-SO3]2- to the
overlapped fragment ions
Thus, equation 4.1 was used to assign the appropriate percentage of the ten
overlapping channels to the two main fragment ions to produce the breakdown diagram
in Figure A5.14.
Figure A5.14 Final breakdown diagram for the dissociation of [FeIITPPS+2H]2-
0%
20%
40%
60%
80%
100%
0.9 1.4 1.9 2.4
Rela
tive A
bu
nd
an
ce
Ecom (eV)
388.6
406.5
420.5
697.2
713.2
732.1
761.1
777.1
813.2
841.1
0%
20%
40%
60%
80%
100%
0.3 1.2 2.1 3.0 3.9 4.8
Rela
tive A
bu
nd
an
ce
Ecom (eV)
SO3 loss
SO2 loss
[FeIITPPS+2H]2-
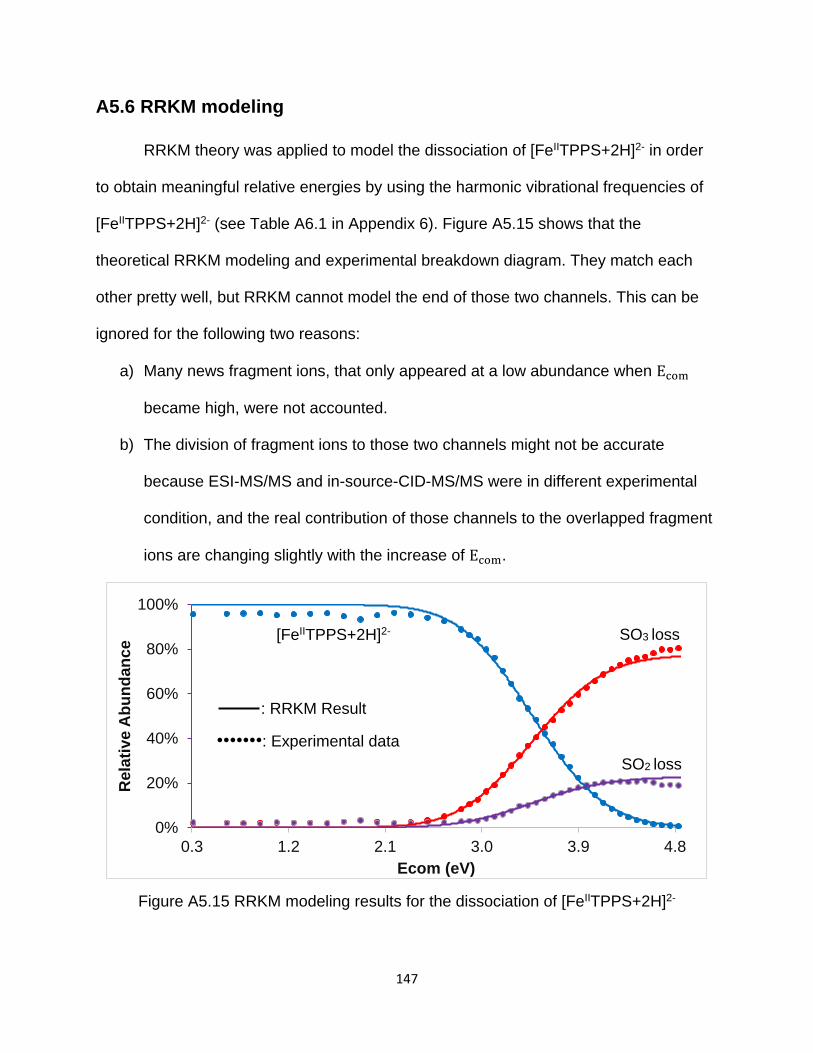
147
A5.6 RRKM modeling
RRKM theory was applied to model the dissociation of [FeIITPPS+2H]2- in order
to obtain meaningful relative energies by using the harmonic vibrational frequencies of
[FeIITPPS+2H]2- (see Table A6.1 in Appendix 6). Figure A5.15 shows that the
theoretical RRKM modeling and experimental breakdown diagram. They match each
other pretty well, but RRKM cannot model the end of those two channels. This can be
ignored for the following two reasons:
a) Many news fragment ions, that only appeared at a low abundance when Ecom
became high, were not accounted.
b) The division of fragment ions to those two channels might not be accurate
because ESI-MS/MS and in-source-CID-MS/MS were in different experimental
condition, and the real contribution of those channels to the overlapped fragment
ions are changing slightly with the increase of Ecom.
Figure A5.15 RRKM modeling results for the dissociation of [FeIITPPS+2H]2-
0%
20%
40%
60%
80%
100%
0.3 1.2 2.1 3.0 3.9 4.8
Rela
tive A
bu
nd
an
ce
Ecom (eV)
: RRKM Result
•••••••: Experimental data
SO3 loss
SO2 loss
[FeIITPPS+2H]2-
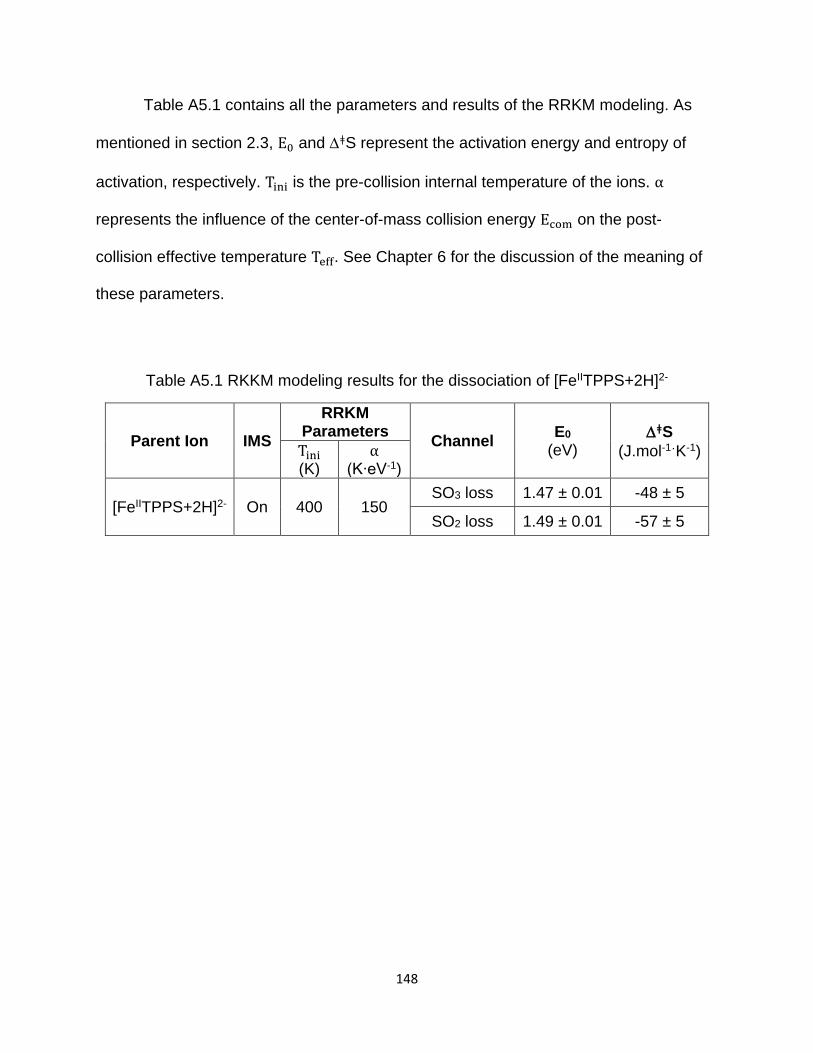
148
Table A5.1 contains all the parameters and results of the RRKM modeling. As
mentioned in section 2.3, E0 and ǂS represent the activation energy and entropy of
activation, respectively. Tini is the pre-collision internal temperature of the ions. α
represents the influence of the center-of-mass collision energy Ecom on the post-
collision effective temperature Teff. See Chapter 6 for the discussion of the meaning of
these parameters.
Table A5.1 RKKM modeling results for the dissociation of [FeIITPPS+2H]2-
Parent Ion IMS
RRKM Parameters
Channel E0
(eV) ǂS
(J.mol-1ˑK-1) Tini (K)
α (K∙eV-1)
[FeIITPPS+2H]2- On 400 150 SO3 loss 1.47 ± 0.01 -48 ± 5
SO2 loss 1.49 ± 0.01 -57 ± 5
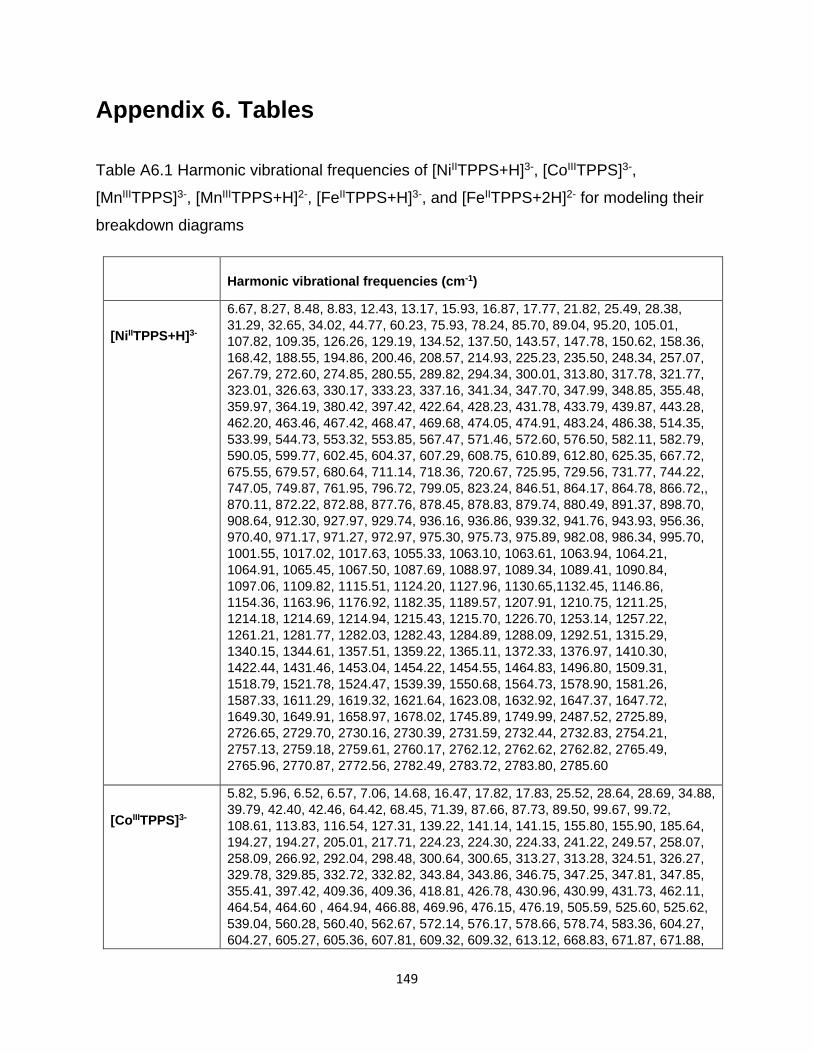
149
Appendix 6. Tables
Table A6.1 Harmonic vibrational frequencies of [NiIITPPS+H]3-, [CoIIITPPS]3-,
[MnIIITPPS]3-, [MnIIITPPS+H]2-, [FeIITPPS+H]3-, and [FeIITPPS+2H]2- for modeling their
breakdown diagrams
Harmonic vibrational frequencies (cm-1)
[NiIITPPS+H]3-
6.67, 8.27, 8.48, 8.83, 12.43, 13.17, 15.93, 16.87, 17.77, 21.82, 25.49, 28.38,
31.29, 32.65, 34.02, 44.77, 60.23, 75.93, 78.24, 85.70, 89.04, 95.20, 105.01,
107.82, 109.35, 126.26, 129.19, 134.52, 137.50, 143.57, 147.78, 150.62, 158.36,
168.42, 188.55, 194.86, 200.46, 208.57, 214.93, 225.23, 235.50, 248.34, 257.07,
267.79, 272.60, 274.85, 280.55, 289.82, 294.34, 300.01, 313.80, 317.78, 321.77,
323.01, 326.63, 330.17, 333.23, 337.16, 341.34, 347.70, 347.99, 348.85, 355.48,
359.97, 364.19, 380.42, 397.42, 422.64, 428.23, 431.78, 433.79, 439.87, 443.28,
462.20, 463.46, 467.42, 468.47, 469.68, 474.05, 474.91, 483.24, 486.38, 514.35,
533.99, 544.73, 553.32, 553.85, 567.47, 571.46, 572.60, 576.50, 582.11, 582.79,
590.05, 599.77, 602.45, 604.37, 607.29, 608.75, 610.89, 612.80, 625.35, 667.72,
675.55, 679.57, 680.64, 711.14, 718.36, 720.67, 725.95, 729.56, 731.77, 744.22,
747.05, 749.87, 761.95, 796.72, 799.05, 823.24, 846.51, 864.17, 864.78, 866.72,,
870.11, 872.22, 872.88, 877.76, 878.45, 878.83, 879.74, 880.49, 891.37, 898.70,
908.64, 912.30, 927.97, 929.74, 936.16, 936.86, 939.32, 941.76, 943.93, 956.36,
970.40, 971.17, 971.27, 972.97, 975.30, 975.73, 975.89, 982.08, 986.34, 995.70,
1001.55, 1017.02, 1017.63, 1055.33, 1063.10, 1063.61, 1063.94, 1064.21,
1064.91, 1065.45, 1067.50, 1087.69, 1088.97, 1089.34, 1089.41, 1090.84,
1097.06, 1109.82, 1115.51, 1124.20, 1127.96, 1130.65,1132.45, 1146.86,
1154.36, 1163.96, 1176.92, 1182.35, 1189.57, 1207.91, 1210.75, 1211.25,
1214.18, 1214.69, 1214.94, 1215.43, 1215.70, 1226.70, 1253.14, 1257.22,
1261.21, 1281.77, 1282.03, 1282.43, 1284.89, 1288.09, 1292.51, 1315.29,
1340.15, 1344.61, 1357.51, 1359.22, 1365.11, 1372.33, 1376.97, 1410.30,
1422.44, 1431.46, 1453.04, 1454.22, 1454.55, 1464.83, 1496.80, 1509.31,
1518.79, 1521.78, 1524.47, 1539.39, 1550.68, 1564.73, 1578.90, 1581.26,
1587.33, 1611.29, 1619.32, 1621.64, 1623.08, 1632.92, 1647.37, 1647.72,
1649.30, 1649.91, 1658.97, 1678.02, 1745.89, 1749.99, 2487.52, 2725.89,
2726.65, 2729.70, 2730.16, 2730.39, 2731.59, 2732.44, 2732.83, 2754.21,
2757.13, 2759.18, 2759.61, 2760.17, 2762.12, 2762.62, 2762.82, 2765.49,
2765.96, 2770.87, 2772.56, 2782.49, 2783.72, 2783.80, 2785.60
[CoIIITPPS]3-
5.82, 5.96, 6.52, 6.57, 7.06, 14.68, 16.47, 17.82, 17.83, 25.52, 28.64, 28.69, 34.88,
39.79, 42.40, 42.46, 64.42, 68.45, 71.39, 87.66, 87.73, 89.50, 99.67, 99.72,
108.61, 113.83, 116.54, 127.31, 139.22, 141.14, 141.15, 155.80, 155.90, 185.64,
194.27, 194.27, 205.01, 217.71, 224.23, 224.30, 224.33, 241.22, 249.57, 258.07,
258.09, 266.92, 292.04, 298.48, 300.64, 300.65, 313.27, 313.28, 324.51, 326.27,
329.78, 329.85, 332.72, 332.82, 343.84, 343.86, 346.75, 347.25, 347.81, 347.85,
355.41, 397.42, 409.36, 409.36, 418.81, 426.78, 430.96, 430.99, 431.73, 462.11,
464.54, 464.60 , 464.94, 466.88, 469.96, 476.15, 476.19, 505.59, 525.60, 525.62,
539.04, 560.28, 560.40, 562.67, 572.14, 576.17, 578.66, 578.74, 583.36, 604.27,
604.27, 605.27, 605.36, 607.81, 609.32, 609.32, 613.12, 668.83, 671.87, 671.88,
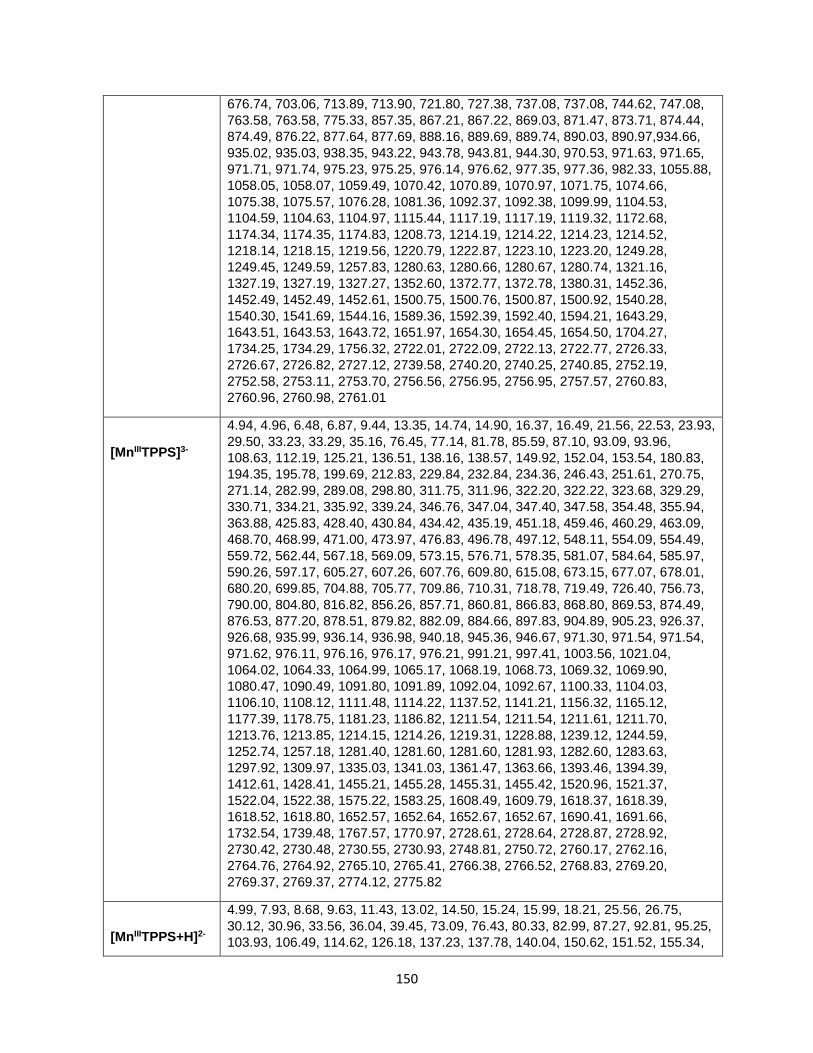
150
676.74, 703.06, 713.89, 713.90, 721.80, 727.38, 737.08, 737.08, 744.62, 747.08,
763.58, 763.58, 775.33, 857.35, 867.21, 867.22, 869.03, 871.47, 873.71, 874.44,
874.49, 876.22, 877.64, 877.69, 888.16, 889.69, 889.74, 890.03, 890.97,934.66,
935.02, 935.03, 938.35, 943.22, 943.78, 943.81, 944.30, 970.53, 971.63, 971.65,
971.71, 971.74, 975.23, 975.25, 976.14, 976.62, 977.35, 977.36, 982.33, 1055.88,
1058.05, 1058.07, 1059.49, 1070.42, 1070.89, 1070.97, 1071.75, 1074.66,
1075.38, 1075.57, 1076.28, 1081.36, 1092.37, 1092.38, 1099.99, 1104.53,
1104.59, 1104.63, 1104.97, 1115.44, 1117.19, 1117.19, 1119.32, 1172.68,
1174.34, 1174.35, 1174.83, 1208.73, 1214.19, 1214.22, 1214.23, 1214.52,
1218.14, 1218.15, 1219.56, 1220.79, 1222.87, 1223.10, 1223.20, 1249.28,
1249.45, 1249.59, 1257.83, 1280.63, 1280.66, 1280.67, 1280.74, 1321.16,
1327.19, 1327.19, 1327.27, 1352.60, 1372.77, 1372.78, 1380.31, 1452.36,
1452.49, 1452.49, 1452.61, 1500.75, 1500.76, 1500.87, 1500.92, 1540.28,
1540.30, 1541.69, 1544.16, 1589.36, 1592.39, 1592.40, 1594.21, 1643.29,
1643.51, 1643.53, 1643.72, 1651.97, 1654.30, 1654.45, 1654.50, 1704.27,
1734.25, 1734.29, 1756.32, 2722.01, 2722.09, 2722.13, 2722.77, 2726.33,
2726.67, 2726.82, 2727.12, 2739.58, 2740.20, 2740.25, 2740.85, 2752.19,
2752.58, 2753.11, 2753.70, 2756.56, 2756.95, 2756.95, 2757.57, 2760.83,
2760.96, 2760.98, 2761.01
[MnIIITPPS]3-
4.94, 4.96, 6.48, 6.87, 9.44, 13.35, 14.74, 14.90, 16.37, 16.49, 21.56, 22.53, 23.93,
29.50, 33.23, 33.29, 35.16, 76.45, 77.14, 81.78, 85.59, 87.10, 93.09, 93.96,
108.63, 112.19, 125.21, 136.51, 138.16, 138.57, 149.92, 152.04, 153.54, 180.83,
194.35, 195.78, 199.69, 212.83, 229.84, 232.84, 234.36, 246.43, 251.61, 270.75,
271.14, 282.99, 289.08, 298.80, 311.75, 311.96, 322.20, 322.22, 323.68, 329.29,
330.71, 334.21, 335.92, 339.24, 346.76, 347.04, 347.40, 347.58, 354.48, 355.94,
363.88, 425.83, 428.40, 430.84, 434.42, 435.19, 451.18, 459.46, 460.29, 463.09,
468.70, 468.99, 471.00, 473.97, 476.83, 496.78, 497.12, 548.11, 554.09, 554.49,
559.72, 562.44, 567.18, 569.09, 573.15, 576.71, 578.35, 581.07, 584.64, 585.97,
590.26, 597.17, 605.27, 607.26, 607.76, 609.80, 615.08, 673.15, 677.07, 678.01,
680.20, 699.85, 704.88, 705.77, 709.86, 710.31, 718.78, 719.49, 726.40, 756.73,
790.00, 804.80, 816.82, 856.26, 857.71, 860.81, 866.83, 868.80, 869.53, 874.49,
876.53, 877.20, 878.51, 879.82, 882.09, 884.66, 897.83, 904.89, 905.23, 926.37,
926.68, 935.99, 936.14, 936.98, 940.18, 945.36, 946.67, 971.30, 971.54, 971.54,
971.62, 976.11, 976.16, 976.17, 976.21, 991.21, 997.41, 1003.56, 1021.04,
1064.02, 1064.33, 1064.99, 1065.17, 1068.19, 1068.73, 1069.32, 1069.90,
1080.47, 1090.49, 1091.80, 1091.89, 1092.04, 1092.67, 1100.33, 1104.03,
1106.10, 1108.12, 1111.48, 1114.22, 1137.52, 1141.21, 1156.32, 1165.12,
1177.39, 1178.75, 1181.23, 1186.82, 1211.54, 1211.54, 1211.61, 1211.70,
1213.76, 1213.85, 1214.15, 1214.26, 1219.31, 1228.88, 1239.12, 1244.59,
1252.74, 1257.18, 1281.40, 1281.60, 1281.60, 1281.93, 1282.60, 1283.63,
1297.92, 1309.97, 1335.03, 1341.03, 1361.47, 1363.66, 1393.46, 1394.39,
1412.61, 1428.41, 1455.21, 1455.28, 1455.31, 1455.42, 1520.96, 1521.37,
1522.04, 1522.38, 1575.22, 1583.25, 1608.49, 1609.79, 1618.37, 1618.39,
1618.52, 1618.80, 1652.57, 1652.64, 1652.67, 1652.67, 1690.41, 1691.66,
1732.54, 1739.48, 1767.57, 1770.97, 2728.61, 2728.64, 2728.87, 2728.92,
2730.42, 2730.48, 2730.55, 2730.93, 2748.81, 2750.72, 2760.17, 2762.16,
2764.76, 2764.92, 2765.10, 2765.41, 2766.38, 2766.52, 2768.83, 2769.20,
2769.37, 2769.37, 2774.12, 2775.82
[MnIIITPPS+H]2-
4.99, 7.93, 8.68, 9.63, 11.43, 13.02, 14.50, 15.24, 15.99, 18.21, 25.56, 26.75,
30.12, 30.96, 33.56, 36.04, 39.45, 73.09, 76.43, 80.33, 82.99, 87.27, 92.81, 95.25,
103.93, 106.49, 114.62, 126.18, 137.23, 137.78, 140.04, 150.62, 151.52, 155.34,
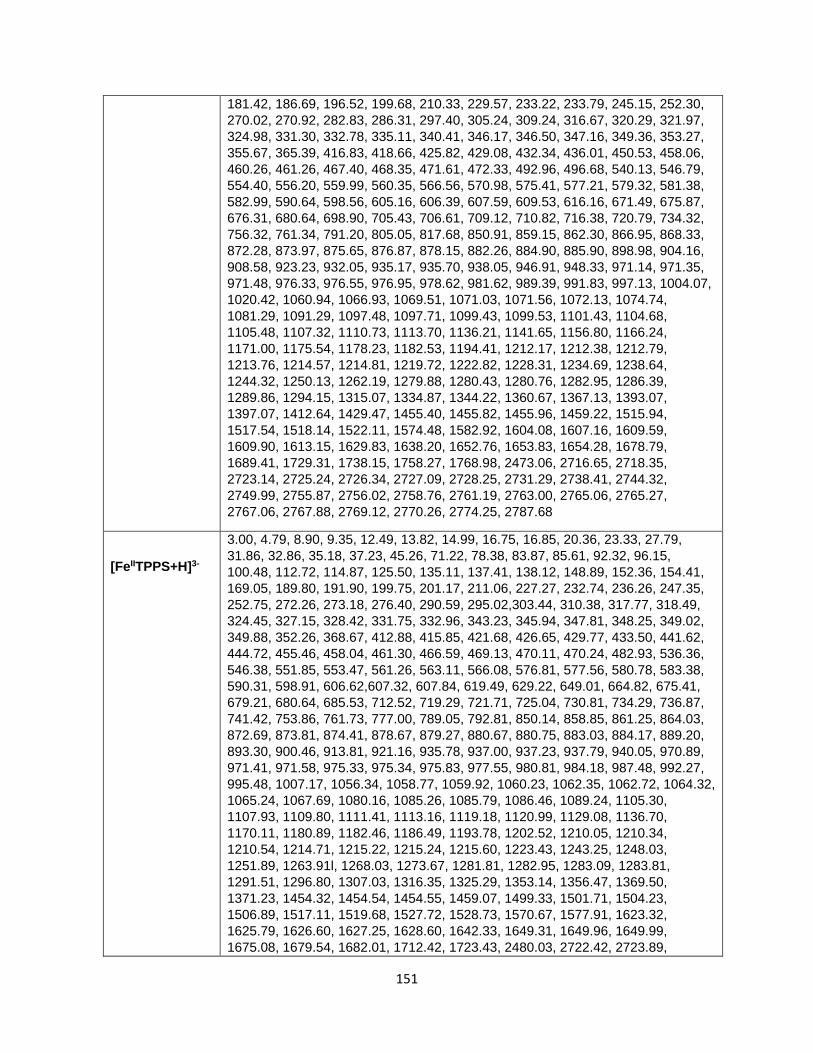
151
181.42, 186.69, 196.52, 199.68, 210.33, 229.57, 233.22, 233.79, 245.15, 252.30,
270.02, 270.92, 282.83, 286.31, 297.40, 305.24, 309.24, 316.67, 320.29, 321.97,
324.98, 331.30, 332.78, 335.11, 340.41, 346.17, 346.50, 347.16, 349.36, 353.27,
355.67, 365.39, 416.83, 418.66, 425.82, 429.08, 432.34, 436.01, 450.53, 458.06,
460.26, 461.26, 467.40, 468.35, 471.61, 472.33, 492.96, 496.68, 540.13, 546.79,
554.40, 556.20, 559.99, 560.35, 566.56, 570.98, 575.41, 577.21, 579.32, 581.38,
582.99, 590.64, 598.56, 605.16, 606.39, 607.59, 609.53, 616.16, 671.49, 675.87,
676.31, 680.64, 698.90, 705.43, 706.61, 709.12, 710.82, 716.38, 720.79, 734.32,
756.32, 761.34, 791.20, 805.05, 817.68, 850.91, 859.15, 862.30, 866.95, 868.33,
872.28, 873.97, 875.65, 876.87, 878.15, 882.26, 884.90, 885.90, 898.98, 904.16,
908.58, 923.23, 932.05, 935.17, 935.70, 938.05, 946.91, 948.33, 971.14, 971.35,
971.48, 976.33, 976.55, 976.95, 978.62, 981.62, 989.39, 991.83, 997.13, 1004.07,
1020.42, 1060.94, 1066.93, 1069.51, 1071.03, 1071.56, 1072.13, 1074.74,
1081.29, 1091.29, 1097.48, 1097.71, 1099.43, 1099.53, 1101.43, 1104.68,
1105.48, 1107.32, 1110.73, 1113.70, 1136.21, 1141.65, 1156.80, 1166.24,
1171.00, 1175.54, 1178.23, 1182.53, 1194.41, 1212.17, 1212.38, 1212.79,
1213.76, 1214.57, 1214.81, 1219.72, 1222.82, 1228.31, 1234.69, 1238.64,
1244.32, 1250.13, 1262.19, 1279.88, 1280.43, 1280.76, 1282.95, 1286.39,
1289.86, 1294.15, 1315.07, 1334.87, 1344.22, 1360.67, 1367.13, 1393.07,
1397.07, 1412.64, 1429.47, 1455.40, 1455.82, 1455.96, 1459.22, 1515.94,
1517.54, 1518.14, 1522.11, 1574.48, 1582.92, 1604.08, 1607.16, 1609.59,
1609.90, 1613.15, 1629.83, 1638.20, 1652.76, 1653.83, 1654.28, 1678.79,
1689.41, 1729.31, 1738.15, 1758.27, 1768.98, 2473.06, 2716.65, 2718.35,
2723.14, 2725.24, 2726.34, 2727.09, 2728.25, 2731.29, 2738.41, 2744.32,
2749.99, 2755.87, 2756.02, 2758.76, 2761.19, 2763.00, 2765.06, 2765.27,
2767.06, 2767.88, 2769.12, 2770.26, 2774.25, 2787.68
[FeIITPPS+H]3-
3.00, 4.79, 8.90, 9.35, 12.49, 13.82, 14.99, 16.75, 16.85, 20.36, 23.33, 27.79,
31.86, 32.86, 35.18, 37.23, 45.26, 71.22, 78.38, 83.87, 85.61, 92.32, 96.15,
100.48, 112.72, 114.87, 125.50, 135.11, 137.41, 138.12, 148.89, 152.36, 154.41,
169.05, 189.80, 191.90, 199.75, 201.17, 211.06, 227.27, 232.74, 236.26, 247.35,
252.75, 272.26, 273.18, 276.40, 290.59, 295.02,303.44, 310.38, 317.77, 318.49,
324.45, 327.15, 328.42, 331.75, 332.96, 343.23, 345.94, 347.81, 348.25, 349.02,
349.88, 352.26, 368.67, 412.88, 415.85, 421.68, 426.65, 429.77, 433.50, 441.62,
444.72, 455.46, 458.04, 461.30, 466.59, 469.13, 470.11, 470.24, 482.93, 536.36,
546.38, 551.85, 553.47, 561.26, 563.11, 566.08, 576.81, 577.56, 580.78, 583.38,
590.31, 598.91, 606.62,607.32, 607.84, 619.49, 629.22, 649.01, 664.82, 675.41,
679.21, 680.64, 685.53, 712.52, 719.29, 721.71, 725.04, 730.81, 734.29, 736.87,
741.42, 753.86, 761.73, 777.00, 789.05, 792.81, 850.14, 858.85, 861.25, 864.03,
872.69, 873.81, 874.41, 878.67, 879.27, 880.67, 880.75, 883.03, 884.17, 889.20,
893.30, 900.46, 913.81, 921.16, 935.78, 937.00, 937.23, 937.79, 940.05, 970.89,
971.41, 971.58, 975.33, 975.34, 975.83, 977.55, 980.81, 984.18, 987.48, 992.27,
995.48, 1007.17, 1056.34, 1058.77, 1059.92, 1060.23, 1062.35, 1062.72, 1064.32,
1065.24, 1067.69, 1080.16, 1085.26, 1085.79, 1086.46, 1089.24, 1105.30,
1107.93, 1109.80, 1111.41, 1113.16, 1119.18, 1120.99, 1129.08, 1136.70,
1170.11, 1180.89, 1182.46, 1186.49, 1193.78, 1202.52, 1210.05, 1210.34,
1210.54, 1214.71, 1215.22, 1215.24, 1215.60, 1223.43, 1243.25, 1248.03,
1251.89, 1263.91l, 1268.03, 1273.67, 1281.81, 1282.95, 1283.09, 1283.81,
1291.51, 1296.80, 1307.03, 1316.35, 1325.29, 1353.14, 1356.47, 1369.50,
1371.23, 1454.32, 1454.54, 1454.55, 1459.07, 1499.33, 1501.71, 1504.23,
1506.89, 1517.11, 1519.68, 1527.72, 1528.73, 1570.67, 1577.91, 1623.32,
1625.79, 1626.60, 1627.25, 1628.60, 1642.33, 1649.31, 1649.96, 1649.99,
1675.08, 1679.54, 1682.01, 1712.42, 1723.43, 2480.03, 2722.42, 2723.89,
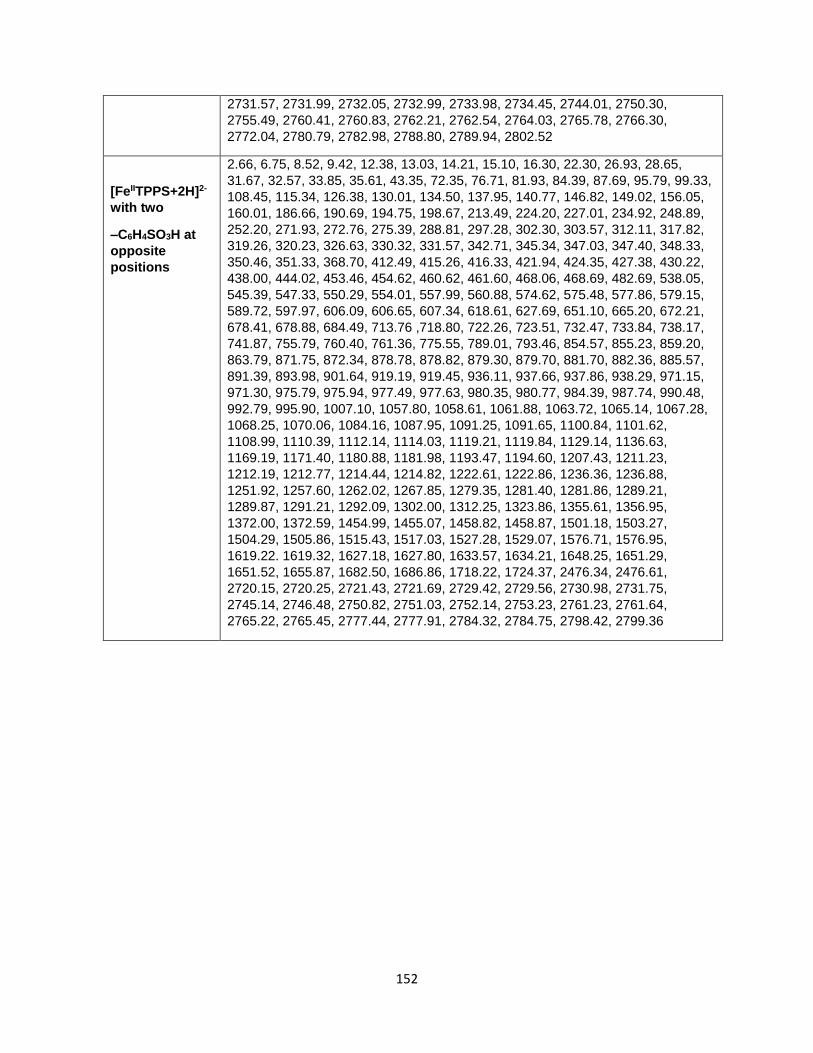
152
2731.57, 2731.99, 2732.05, 2732.99, 2733.98, 2734.45, 2744.01, 2750.30,
2755.49, 2760.41, 2760.83, 2762.21, 2762.54, 2764.03, 2765.78, 2766.30,
2772.04, 2780.79, 2782.98, 2788.80, 2789.94, 2802.52
[FeIITPPS+2H]2-
with two
–C6H4SO3H at
opposite
positions
2.66, 6.75, 8.52, 9.42, 12.38, 13.03, 14.21, 15.10, 16.30, 22.30, 26.93, 28.65,
31.67, 32.57, 33.85, 35.61, 43.35, 72.35, 76.71, 81.93, 84.39, 87.69, 95.79, 99.33,
108.45, 115.34, 126.38, 130.01, 134.50, 137.95, 140.77, 146.82, 149.02, 156.05,
160.01, 186.66, 190.69, 194.75, 198.67, 213.49, 224.20, 227.01, 234.92, 248.89,
252.20, 271.93, 272.76, 275.39, 288.81, 297.28, 302.30, 303.57, 312.11, 317.82,
319.26, 320.23, 326.63, 330.32, 331.57, 342.71, 345.34, 347.03, 347.40, 348.33,
350.46, 351.33, 368.70, 412.49, 415.26, 416.33, 421.94, 424.35, 427.38, 430.22,
438.00, 444.02, 453.46, 454.62, 460.62, 461.60, 468.06, 468.69, 482.69, 538.05,
545.39, 547.33, 550.29, 554.01, 557.99, 560.88, 574.62, 575.48, 577.86, 579.15,
589.72, 597.97, 606.09, 606.65, 607.34, 618.61, 627.69, 651.10, 665.20, 672.21,
678.41, 678.88, 684.49, 713.76 ,718.80, 722.26, 723.51, 732.47, 733.84, 738.17,
741.87, 755.79, 760.40, 761.36, 775.55, 789.01, 793.46, 854.57, 855.23, 859.20,
863.79, 871.75, 872.34, 878.78, 878.82, 879.30, 879.70, 881.70, 882.36, 885.57,
891.39, 893.98, 901.64, 919.19, 919.45, 936.11, 937.66, 937.86, 938.29, 971.15,
971.30, 975.79, 975.94, 977.49, 977.63, 980.35, 980.77, 984.39, 987.74, 990.48,
992.79, 995.90, 1007.10, 1057.80, 1058.61, 1061.88, 1063.72, 1065.14, 1067.28,
1068.25, 1070.06, 1084.16, 1087.95, 1091.25, 1091.65, 1100.84, 1101.62,
1108.99, 1110.39, 1112.14, 1114.03, 1119.21, 1119.84, 1129.14, 1136.63,
1169.19, 1171.40, 1180.88, 1181.98, 1193.47, 1194.60, 1207.43, 1211.23,
1212.19, 1212.77, 1214.44, 1214.82, 1222.61, 1222.86, 1236.36, 1236.88,
1251.92, 1257.60, 1262.02, 1267.85, 1279.35, 1281.40, 1281.86, 1289.21,
1289.87, 1291.21, 1292.09, 1302.00, 1312.25, 1323.86, 1355.61, 1356.95,
1372.00, 1372.59, 1454.99, 1455.07, 1458.82, 1458.87, 1501.18, 1503.27,
1504.29, 1505.86, 1515.43, 1517.03, 1527.28, 1529.07, 1576.71, 1576.95,
1619.22. 1619.32, 1627.18, 1627.80, 1633.57, 1634.21, 1648.25, 1651.29,
1651.52, 1655.87, 1682.50, 1686.86, 1718.22, 1724.37, 2476.34, 2476.61,
2720.15, 2720.25, 2721.43, 2721.69, 2729.42, 2729.56, 2730.98, 2731.75,
2745.14, 2746.48, 2750.82, 2751.03, 2752.14, 2753.23, 2761.23, 2761.64,
2765.22, 2765.45, 2777.44, 2777.91, 2784.32, 2784.75, 2798.42, 2799.36
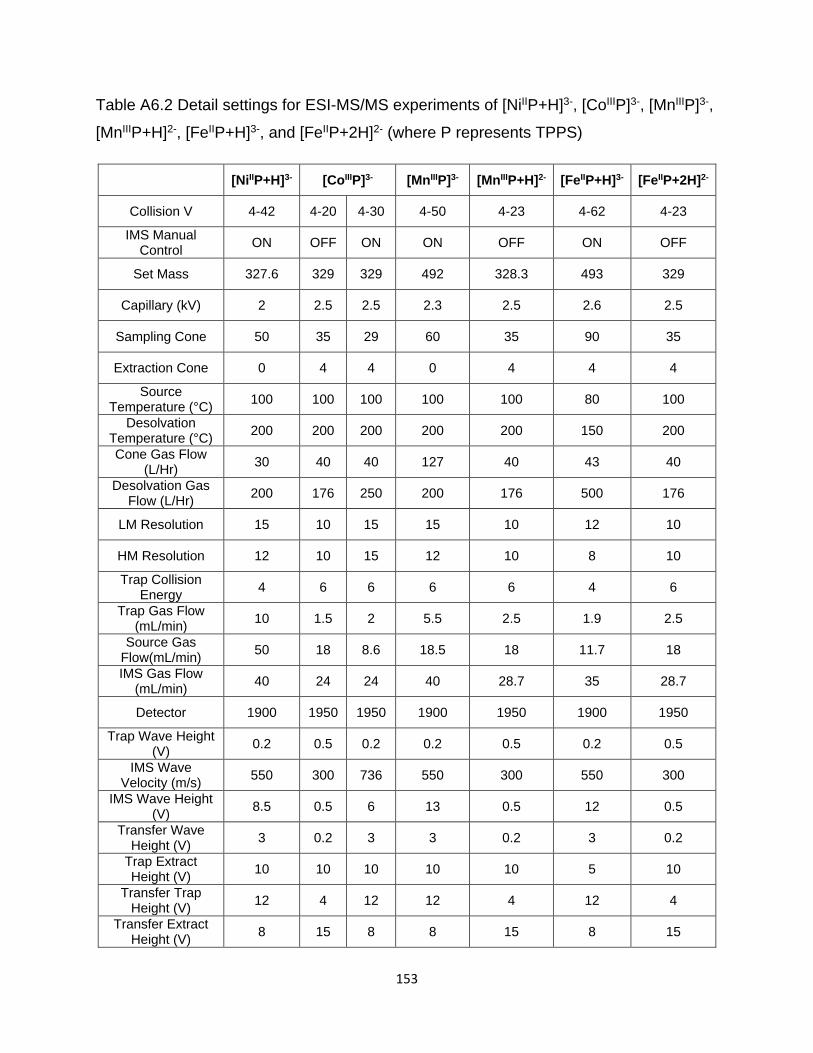
153
Table A6.2 Detail settings for ESI-MS/MS experiments of [NiIIP+H]3-, [CoIIIP]3-, [MnIIIP]3-,
[MnIIIP+H]2-, [FeIIP+H]3-, and [FeIIP+2H]2- (where P represents TPPS)
[NiIIP+H]3- [CoIIIP]3- [MnIIIP]3- [MnIIIP+H]2- [FeIIP+H]3- [FeIIP+2H]2-
Collision V 4-42 4-20 4-30 4-50 4-23 4-62 4-23
IMS Manual Control
ON OFF ON ON OFF ON OFF
Set Mass 327.6 329 329 492 328.3 493 329
Capillary (kV) 2 2.5 2.5 2.3 2.5 2.6 2.5
Sampling Cone 50 35 29 60 35 90 35
Extraction Cone 0 4 4 0 4 4 4
Source Temperature (°C)
100 100 100 100 100 80 100
Desolvation Temperature (°C)
200 200 200 200 200 150 200
Cone Gas Flow (L/Hr)
30 40 40 127 40 43 40
Desolvation Gas Flow (L/Hr)
200 176 250 200 176 500 176
LM Resolution 15 10 15 15 10 12 10
HM Resolution 12 10 15 12 10 8 10
Trap Collision Energy
4 6 6 6 6 4 6
Trap Gas Flow (mL/min)
10 1.5 2 5.5 2.5 1.9 2.5
Source Gas Flow(mL/min)
50 18 8.6 18.5 18 11.7 18
IMS Gas Flow (mL/min)
40 24 24 40 28.7 35 28.7
Detector 1900 1950 1950 1900 1950 1900 1950
Trap Wave Height (V)
0.2 0.5 0.2 0.2 0.5 0.2 0.5
IMS Wave Velocity (m/s)
550 300 736 550 300 550 300
IMS Wave Height (V)
8.5 0.5 6 13 0.5 12 0.5
Transfer Wave Height (V)
3 0.2 3 3 0.2 3 0.2
Trap Extract Height (V)
10 10 10 10 10 5 10
Transfer Trap Height (V)
12 4 12 12 4 12 4
Transfer Extract Height (V)
8 15 8 8 15 8 15

154