the difference makes a difference: team … - sky_schneider_eckl_201607025.pdfthe difference makes a...
TRANSCRIPT

THE DIFFERENCE MAKES A DIFFERENCE:
Team diversity and innovative capacity
Julia Schneider1 and Verena Eckl
Essen, July 29, 2016
To investigate econometrically whether diverse researcher teams boost innovation, we use a micro-level cross-sectional dataset of the research-based German business and enterprise sector that contains rich information on the characteristics of firms’ researcher teams and measures for their innovative capacity. We apply a modified Herfindahl index to measure the degree of diversity in firms’ researcher teams regarding nationality, gender and subject of study. We measure the firm’s innovative capacity in two ways: by future innovativeness proxied by R&D intensity and by innovative efficiency proxied by R&D efficiency. We find that firms that employ researcher teams with a higher degree of diversity, i.e. firms with more foreign and female researchers as well as researchers with more diverse subjects of studies, have a better innovative capacity.
1. Introduction
The source of innovation is invention – an inherently uncertain process of recombining
components, or what Schumpeter calls factors (Schumpeter 1939). Today, the success of
firms depends at least as much on their innovative capacity as 75 years ago. The solution
for firms to be innovative seems simple, then: go and invent! Unfortunately, simple
portfolio strategies are not completely able to rule out inventive uncertainty and the risk
of failure because breakthrough inventions are so extremely rare. However, there seems to
be a possibility for firms to raise the probability for breakthrough inventions and
innovations: to employ inventor teams with a high degree of diversity (Fleming 2001).
This paper asks if diverse researcher teams – as a proxy for inventor teams - can indeed
raise the innovative capacity of firms as suggested by Fleming (2001). We do this by
analyzing the impact of diversity of researchers at the firm level on the innovative
capacity of firms. Ozgen et al. (2013) argue that this is the toughest test of spillover
benefits of diversity on co-workers, since it attempts to empirically identify localized
spillover benefits of workers who are underrepresented in the firm. Easier tests on the
impact of diversity on innovation are, for example, to look if there is more innovation,
1 Corresponding author: Dr. Julia Schneider, [email protected], SV Wissenschaftsstatistik,
Pariser Platz 6, 10117 Berlin.

ceteris paribus, in regions that are more culturally diverse (confirmed by Ozgen et al.
2012) or if foreign knowledge workers are more innovative than native-born knowledge
workers (confirmed by Kerr and Lincoln 2010).
While it is obvious, however, how workers from minorities can benefit from more diversity
in firms – better job and career opportunities, more interesting activities and better pay –
the impact of a diverse staff at the firm level is still under debate. Previous studies show
ambivalent effects on firm performance, depending on the object of study. The varying
results seem to point out that the positive impacts of diversity on a firm’s performance are
likely to emerge in special contexts. Diversity in the workforce seems to increase the
ability to innovate especially in knowledge-intensive industries (see Ozgen et al. 2013 and
the theoretical background below for an overview).
One of the countries with the claim to be among the world’s leading innovators is
Germany. As a percentage of GDP, Germany's R&D investment still trails other countries,
including South Korea, Switzerland and Austria. But research and development spending in
Germany is surging to new heights. In 2014, German industry spent EURO 57 billion ($60.4
million) for R&D, and this amount grew four times faster than GDP did last year (Eckl et al.
2015).
In order to remain among the world’s leading innovators, we would expect the research-
based, knowledge-intensive firms in Germany to employ highly diverse researcher teams if
this helped to increase their ability to innovate. Yet up to date, research-based firms in
Germany seem not convinced that more diverse researcher teams will boost their ability to
innovate. Instead, they continue to rely on a homogenous workforce in their research
departments, being predominantly German, male and engineers (Schneider and Stenke
2016). Does this mean that these firms lose innovative strength?
By analyzing the impact of inventors’ diversity on the innovative capacity of German
research-based firms, we contribute to the previous literature in four ways. Firstly, we
apply a rather tough test of the benefits of diversity on innovative capacity, as Ozgen et
al. (2013) argue, since we aim to empirically identify localized spillover benefits of
workers who are underrepresented in the firm. Hence, an empirically proven positive
relationship between diversity and innovative capacity would be a strong argument pro
diversity at the firm level. Secondly, we perform this test using a recent and unique micro-
level cross-sectional dataset of the research-based German business and enterprise sector
with information not only about their R&D and innovation activities, but also on the
composition of their R&D personnel. For the first time, a large quantitative dataset on
researchers within Germany’s research-based firms available is available for research,
together with information on the firm’s innovative capacity. Thirdly, we use two measures
of innovative capacity to perform the test in order to investigate the impact of diversity on
both the input and the output side of a firm’s innovation process. As a measure for future

innovativeness, we use R&D intensity, and as a measure for innovative efficiency of
researcher teams, we use R&D efficiency. R&D intensity is the R&D expenses, i.e. the input
of a firm in its innovation processes, in proportion to its revenues, so we can rule out
effects, which are determined by sheer size of the R&D activity. R&D efficiency is a new
indicator for the output side of firm’s innovation process, which determines how
efficiently the input in R&D was regarding the later revenues with new and innovative
products. Fourthly, we apply several measures of diversity to perform the test, using a
modified Herfindahl index to measure the degree of diversity in firms’ researcher teams.
As diversity dimensions, we use gender, subject of study and nationality. This enables us to
investigate the impact of different categories of diversity within researcher teams on
innovative capacity.
We find that research-based firms that employ researcher teams with a higher degree of
diversity, i.e. with more foreign and female researchers and researchers with more diverse
subjects of studies, generally show a higher innovative capacity. These firms have higher
levels of future innovativeness (R&D intensity) and innovative efficiency (R&D efficiency),
too. We take this positive relationship as a strong argument pro diversity and conclude that
the recruitment of high-skilled talent can be particularly beneficial for innovation in
knowledge-intensive firms.
The next section provides a brief discussion of the ways in which workforce diversity may
influence innovation. Section 3 outlines how the dataset was constructed and how cultural
diversity has been measured. Section 4 discusses the results of the regression analysis,
while section 6 offers concluding remarks.
2. Theoretical Framework and Hypotheses
Theoretical and empirical results imply that firms that seek technological breakthroughs
should experiment with new combinations of components that are well-known to the
participating inventors (Nelson and Winter 1982). The number of potential combinations
that an individual inventor or a group of inventors is able to simultaneously consider is
limited (Weitzmann 1996). Since the set of potential combinations is infinite, it has
become impossible for individual inventors to “have more than an infinitesimal
understanding of all these potential combinations” (Fleming 2001).
In this context, diverse inventor groups that bring together inventors with deep experience
in different fields can share their knowledge and increase their understanding of
potentially successful combinations of components (Ahuja 2000). Foreign researchers from
other educational systems can add new insights and understanding, for example, as can
researchers with different subjects of study or female researchers who have different life
experiences due to gender. That can lead to better, more creative solutions to problems
and therefore, to more innovations (e.g. Watson et al. 1993, Drach-Zahavi and Somech

2001, Hong and Page 2001, Parotta et al. 2011). Additionally, diverse researcher teams in
terms of mixed nationality, subject of study and gender have a greater pool of knowledge
about markets, needs and tastes - so they can more easily develop target group-specific or
international products which in turn increase the innovative strength of the firm (Osborne
2000, Berliant and Fujita 2008).
On the other hand mixed teams might have greater problems to effectively communicate
and cooperate. Levels of trust may also be lower in mixed teams, due to real and
perceived differences between team members. A diverse team may find it harder to
communicate (Alesina and Ferrara 2005). This means that diversity can also lead to
frictions, as Becker has noted in 1957 (see also Williams and O'Reilly 1998, Zajac et al.
1991, Lazear 1999, Basset-Jones 2005,). These friction costs can be theoretically so high
that they offset the gains from diverse inventor groups.
Given such a mixture of positive and negative effects, it is clear that the overall impact of
diversity of the staff at the firm level on a firm’s ability to innovate is largely an empirical
matter.
One the one hand, successful innovation-driven firms become more and more diverse:
Venture-capital funded Start-ups that succeed in the market have more than twice the
average percentage of female employees than failed start-ups (Dow Jones, 2012). In
addition, the stock market value of innovation-driven firms among the 1,500 largest
publicly traded US firms increases with the number of women in top management (Dezsö
and Ross, 2012).
On the other hand, previous empirical studies on the question if the benefits outweigh the
costs of diversity on innovation are controversial. To our knowledge, there has not been
any research on the diversity of subject of study on firm’s performance, but recent studies
on ethnic diversity found an increased innovative power of diverse firms (Parrotta et al.
2014), measured as the likelihood of patents and the number and broad scope of patent
applications. However this is true only for "white-collar workers" working in mixed teams
and does not apply for teams of "blue-collar workers". Ozgen et al. (2013) found that the
positive impact of ethnical diversity on product or process innovations is greater among
firms in knowledge-intensive sectors and in internationally‐oriented sectors. Garnero et al.
(2014) found that gender diversity lead to higher efficiency in knowledge-intensive
industries but to lower efficiency in traditional industries.
Garnero et al. (2014) summarize the state of research: „Overall, these results suggest that
the benefits of diversity are more likely to outweigh the costs in high-tech/knowledge
intensive sectors than in traditional industries, particularly if the former (latter) are
characterized by complex (routine) tasks, negative (positive) complementarities and
innovative (functional) output.” From the above findings, we develop the following
hypotheses:
a) Since research and development (R&D) performing firms are knowledge-intensive, we
expect a positive effect of diversity of researcher teams on future innovativeness
measured by R&D intensity in our sample.
b) Likewise, we expect a positive effect of diversity of researcher teams on innovative
efficiency measured by R&D efficiency in our sample.
c) We assume that the effects of researcher teams in terms of gender, education
(measured by subject of study) and nationality on R&D intensity and R&D efficiency are
positive but might differ.
The data that we use to test these hypotheses is described in the next section.
3. Data and methods
3.1. Sample
For our analysis, we use an extended version of the official R&D survey of the research-
based German business and enterprise sector. The R&D survey data are collected by the
Wissenschaftsstatistik of the Stifterverband (SV Wissenschaftsstatistik) in a two-year cycle
by means of a questionnaire addressed to all designated R&D-active firms in Germany
(“full survey”). The R&D survey data are part of the official reporting on research,
development and innovation of the Federal Government to the European Union and the
OECD.
The criteria for the identification of R&D-active firms are essentially R&D reports from
previous years, size of enterprise, industry sector, and participation in funding programs,
patent applications, annual reports or press announcements concerning research results.
The reporting unit for enterprises is normally the smallest accounting unit. Consortia,
however, are divided up into business units according to particular economic activities.
The rich dataset resulting from the R&D survey contains information about R&D
expenditures (total, internal, external, financing sources), R&D personnel, R&D strategic
orientation, as well as some basic facts (turnover, employees, industry). The underlying
definitions of R&D indicators are based on internationally standardized rules that have
been set in the "General Guidelines for Surveys on Research and Experimental
Development" (Frascati Manual) of the OECD.
The questions on R&D personnel in the standard questionnaire were extended in 2013 to
include the categories age and freelancers. In addition, an extended part on researcher
collected information about further characteristics of R&D personnel, among other
nationalities, subject of study, scientific degree and entry wages. Further questions went
to the difficulties in recruiting and relevance and success of recruitment strategies.
The gross population for the full survey consists of about 24,000 enterprises and
cooperative research institutes engaging in R&D during the survey period 2013. The
analysis is based on data on researcher of the German business and enterprise sector in the
course of a special survey in 2013. In the special survey the question block on R&D
personnel has been extended to age, nationality, mobility, personnel development, entry-
level wages and recruitment strategies.
The realized population of R&D active firms in 2013 consisted of 13,589 firms. 5,448
answered the main questionnaire, of which 1,873 filled in the extended part of R&D
personnel. We estimate the possible response bias of the sample by a non-response
analysis using probit regression.2 Apart from an overrepresentation of the service/ IT
sector and younger scientist in the full survey, all firm types are well represented in
comparison with the full survey. As a result, no significant distortion in terms firm size,
R&D expenditure or the percentage of women is observed.
3.2. Measures
3.2.1. Dependent variables
Innovative capacity can be measured by a various set of quantitative and dichotomous
(yes/no responses) variables. On the input side of the innovation process, we have
quantitative data on R&D expenditures, the share of R&D expenditures per turnover in
1,000 Euro and dichotomous variables whether firms are R&D active or not. On the output
side we may know if a firm has introduced new products and processes (yes/no) and we
may observe the percentage of sales with innovative (new and improved) products.
There are some reasons to assume that input and output indicators may differ. Not all
firms are equally efficient in turning research efforts into sales, efficiency or profits.
Additionally, firms may have different innovation strategies and technologies of production
(see Dagenais and Mohnen 2002). Nevertheless, numerous investigations of R&D surveys
show that the input indicator R&D expenditures and output indicators, i.e. number of
patents, innovation activity (yes/no) and the sales share of new products, are highly
correlated (Crépon et al. 1996, Brouwer and Kleinknecht 1996). Furthermore a time-lag
between R&D investments and innovation output can be observed (Crépon et al. 1998) –
even though innovation activity is a nonlinear process. For this reason we use current R&D
2 The results can be obtained by the authors on request.
activities in 2013 as a proxy for future innovativeness. Because R&D activities increase
with the business activity we here use the firm’s R&D intensity (R&D per sales share) as a
proxy for future innovativeness. R&D intensity has some shortcomings. Firstly R&D intensity
is no measure for their actual innovation output, i.e. we actually do not know if firms
manage to bring more innovative products on the market in the future. Secondly the
amount of R&D expenditures is not necessarily a quality criterion.
To deal with these shortcomings, we explore a new indicator for firm’s innovative
efficiency: R&D efficiency. R&D efficiency comprises past R&D expenditures of 2011 in
relation to subsequent innovative outcome measured as revenues with new or improved
products in 2013. The R&D efficiency thus is displayed as every R&D Euro spent in 2011 per
every Euro earned with new or improved products in 2013. The outcome measure for
innovative efficiency only holds if we assume that the structure of the R&D teams is stable
over time and was 2011 (not observed) the same as in 2013 (observed). This indicator
reflects the supposition that well-functioning R&D teams are able to achieve a higher
innovation output with steady R&D expenditures. The added value of the indicator is (1)
the direct connection between past R&D activity and subsequent innovative output and (2)
to focus on quality instead of quantity of R&D activity.
3.2.2. Independent variables
The diversity measure used in this paper is a modified Herfindahl index (HI), which
measures not as usual the concentration (with 1 = completely concentrated), but the
diversity (1 – HI-concentration). It combines two important dimensions of diversity: the
“richness”, which refers to the number of defined categories within a firm, and the
“evenness”, which informs on how equally populated such categories are. It can range
from 0 to 1, moving from a highly diverse (1) to completely homogeneous researcher (0)
within a firm. It is computed as 1 minus the sum of squared shares of the possible
categories. Since we use two categories in each diversity dimension, the HI can range from
0 to ½. For example, if a firm has only male researcher, the normalized HI would be 1 –
((100/100)²+0²) = 0, if the share of female and male R&D personnel would be equal the HI
would be 1 – ((½)²+ (½)² = ½.
In our analysis we computed the HI for three different diversity measures of researchers at
the firm level: gender, subject of study and nationality.
Researcher by gender at the firm level: includes the share of women and men of the
researchers in the R&D department.
Researcher by subject of study at the firm level: comprises the percentage of subject or
discipline in which the researchers in the R&D department acquired their degree. Possible
characteristics of the study subject are: engineering, computer science, mathematics,

science, medicine, health sciences, sports, law, economics and social sciences and other
disciplines. We differentiated the subjects in (1) STEM
(science, technology, engineering and mathematics) and (2) non-STEM subjects to
elaborate the substantial diversity matter of the variable.
Researcher by nationality at the firm level: can be differentiated into (1) German
nationality and (2) other nationality of the researchers in the R&D department..
3.2.3. Control Variables
We control for three features of firms which have been shown to have an important impact
on R&D efforts: size, sector of industry and age of a firm (Fagerberg et al. 2006). Larger
firms are more likely to fund R&D due to lower financing constraints, economies of scale
and scope (e.g., Cohen 1995). R&D efforts are mostly affected by sector specific conditions
(e.g., incremental vs. radical innovation, market structure, price cost margin, strategies)
as well as firm age.
4. Analyses and results
4.1. Descriptive statistics
Overall, in 2013, German companies had 371,000 researchers on staff, including 72,000
new hires over the past 10 years. A recent study based on the same dataset showed that
the diversity of firms’ researcher teams – measured at the composition of the researchers
in the R&D departments – is low (Schneider and Stenke 2016).
In table 1, we present descriptive statistics to characterize the sample and the measures
in our study.
Table 1: Summary statistics of the study’s variables
Variable Number of observations Mean Min Max
R&D Intensity 1842 0.14 0.00 1
R&D efficiency 1153 -1.97 -7.39 4.14
Share of female researchers over all firms 1515 0.19 0 1
Share of foreign researchers over all firms 1787 0.05 0 1
Share of non-STEM researchers over all firms 1736 0.17 0 1
Gender diversity 1533 0.30 0 0.5
Nationality diversity 1758 0.06 0 0.5
Subject diversity 1707 0.11 0 0.5

Continued Table 1: Summary statistics of the study’s variables
Variable Number of observations Mean Min Max
Industry (1/0)
Chemical industry 1842 0.05 0 1
pharmaceutical industry 1842 0.02 0 1
electronical industry 1842 0.19 0 1
Mechanical Engineering 1842 0.14 0 1
Automotive industry 1842 0.02 0 1
ICT Sector 1842 0.09 0 1
Knowledge intensive services 1842 0.18 0 1
Firm Size (Share)
< 100 Employees 1842 0.67 0 1
100 -249 Employees 1842 0.14 0 1
> 249 Employees 1842 0.07 0 1
Firm Age 1723 21.61 0 148
Source: Own calculations.
Our sample consists of 1842 research-based firms with information on firm size, sector of
industry, some kind of information on innovative capacity and their R&D personnel and to a
lower degree firm age. Most of them are small firms with up to 100 employees (67%). Their
average age is a bit more than 20 years, though the oldest firms are already 148 years old.
Larger shares of the firms belong to the knowledge-intensive services and the electronical
and mechanical engineering industry, but research-based firms are spread over all
industries.
The descriptive statistics in the table confirm the previous findings that the diversity of
firms’ researcher teams is low. Researchers are primarily male (share of 81%), German
(share of 95%) and have a college degree in the STEM subjects (share of 83%). These
dimensions – gender, subject of study and nationality – form the basis for our diversity
measures (based on the Herfindahl index, HI). For each dimension – gender, subject of
study and nationality – the diversity measures comprise two categories and can range from
a highly diverse (1/2) to completely homogeneous (0) researcher team within a firm. As
implied by the low shares of female, non-German, non-STEM researchers, the HI diversity
measures show that firms are not very diverse – the lowest HI value shows the diversity
measure nationality, followed by the diversity measure subject of study and the diversity
measure gender.
The correlation between the diversity measures is low (table 2). It is interesting to see
that firms that employ diverse researcher teams are not necessarily diverse in every
dimension. Instead, some firms employ more foreign researchers, some more female
researchers and some employ more researchers with different subjects of study. Diversity

with respect to gender is not highly correlated with diversity in nationality or subject of
study, and diversity with respect to nationality is not highly correlated with subject of
study. We therefore waive the calculation of interaction effects.
Table 2: Pairwise Correlation between diversity measures
Gender diversity Subject diversity Nationality diversity
Gender diversity 1.0000
N 1853
Subject diversity 0.0553 1.0000
N 1719 1736
Nationality diversity 0.0691 0.0290 1.0000
N 1769 1717 1787
Source: Own calculations.
Our outcome measures for innovative capacity are future innovativeness measured by R&D
intensity (R&D per revenues) and R&D efficiency (past R&D expenditures of 2011 in
relation to current innovative outcome measured as revenues with new products). For R&D
intensity, we have observations of the full sample. On average, firms have an R&D
intensity of 14% - meaning that the average firm spends 14% of their sales for R&D. For
R&D efficiency, we lose about 700 observations because we need firms to have
participated in the survey in 2011 and information on their revenues with new products in
2013, too, due to the construction of the measure. Firms with information on R&D
efficiency spent on average two R&D Euro in 2011 per every Euro earned with new or
improved products in 2013 – the range, however, tells us that there are indeed firms that
are much less and much more efficient with regards to their R&D.
Table 3: Pairwise correlation between outcome measures
R&D intensity R&D efficiency
R&D intensity 1.0000
R&D efficiency 0.5177 1.0000
N 1153 1153
Source: Own calculations.
We observe a moderate positive correlation between the outcome measures (table 3). This
reflects the different types of the indicators and the time lag between R&D activity and
innovation output. We conclude that it makes sense to use in the analyses both indicators
as dependent variables for a firm’s innovative capacity.
In sum: Our descriptive findings show that German research-based firms show a low
diversity in terms of gender, subject of study and nationality of their researchers. Since
our outcome measures for innovative capacity - R&D efficiency as a measure of innovative

efficiency and R&D intensity as a measure for future innovativeness– are only moderately
correlated we will use both indicators as dependent variables in the analyses for a firm’s
innovative capacity.
4.2. Hypotheses testing
Our descriptive findings show that German research-based firms employ researcher teams
that display low diversity in terms of gender, subject of study and nationality. Does this
mean that firms lose innovative strength? Can we find evidence that those firms with more
diverse researcher teams have a higher innovative capacity? We perform both bivariate
(correlation) and multivariate (multiple regressions) analyses – because they tell us
different things about the relationship between the diversity measures and the innovative
capacity of a firm.
Bivariate analyses tell us about the simple relationships of each diversity measure with the
innovative capacity of a firm (ignoring other factors that have an impact on innovative
capacity). Multiple regressions tell us about the relationship between each diversity
measure and the firm’s innovative capacity that is independent from the other predictors
in the model. Therefore, bivariate and multivariate results for a diversity measure do not
always agree, given on the importance of other predictors in the multivariate model.
Bivariate analysis
The bivariate correlation between the diversity measures and the outcome measures
differs by dimension of diversity. Firms that employ more female researchers have both a
higher R&D intensity and R&D efficiency (see table 4). This is different for firms that
employ more foreign researchers: while these firms have a higher R&D intensity, too, they
show no higher R&D efficiency, the value is negative and near zero. Likewise, employing
more non-STEM researchers show no gains for firms in terms of innovative capacity:
subject diversity is negatively correlated with R&D intensity and R&D efficiency.
Table 4: Pairwise correlation between outcome and diversity measures
R&D intensity R&D efficiency
Gender diversity 0.1525 0.0582
N 1823 1148
Nationality diversity 0.0041 -0.0235
N 1707 1091
Subject diversity 0.0941 0.0016
N 1758 1116
Source: Own calculations.

Multiple regression
In the multiple regressions, we seek to find the relationship between R&D researcher
diversity and innovative capacity, proxied by the two outcomes future innovativeness (R&D
intensity) and innovative efficiency (R&D efficiency). We use robust linear regression to
limit the sensitiveness to outliers and control additionally for firm size, firm age and sector
of industry. To test our hypotheses, we run regressions separately for each outcome and
every diversity measure (subject of study, gender and nationality) and one regression with
all diversity measures included. The results of our analysis on future innovativeness are
shown in table 5.
Indeed, our results confirm a positive relationship between diversity and future innovative
strength proxied by R&D intensity: regression results show positive significant correlations
between R&D intensity of the firm and diversity in researcher teams with respect to
subject of study (column 1), gender (column 2) and nationality (column 3). In our diversity
portfolio, nationality is the most significant and influential diversity measure in correlation
with R&D Intensity as proxy for future innovativeness (column 4).
An examination of diversity and R&D efficiency in table 6 shows that the estimates of
gender diversity in research teams is significant at the 5% significance level. The
magnitude of estimates demonstrates that gender diversity apparently played a
determining role in enhancing the R&D efficiency of our sample firms. The correlation
between R&D efficiency and nationality is not significant in our regression, neither in the
single regression equation (column 3) nor in the equation with all diversity measures
(column 4). This can be explained by the nature of carried out R&D. R&D may consist of
three types that are (1) basic research, (2) applied research and (3) experimental
development. Basic research is experimental or theoretical work undertaken to acquire
new knowledge without any application in view. Applied research is directed towards a
specific aim. Both types of research are undertaken at the beginning of the innovation
process while experimental development is systematic work directed to producing or to
improving new products or processes (OECD 2015).
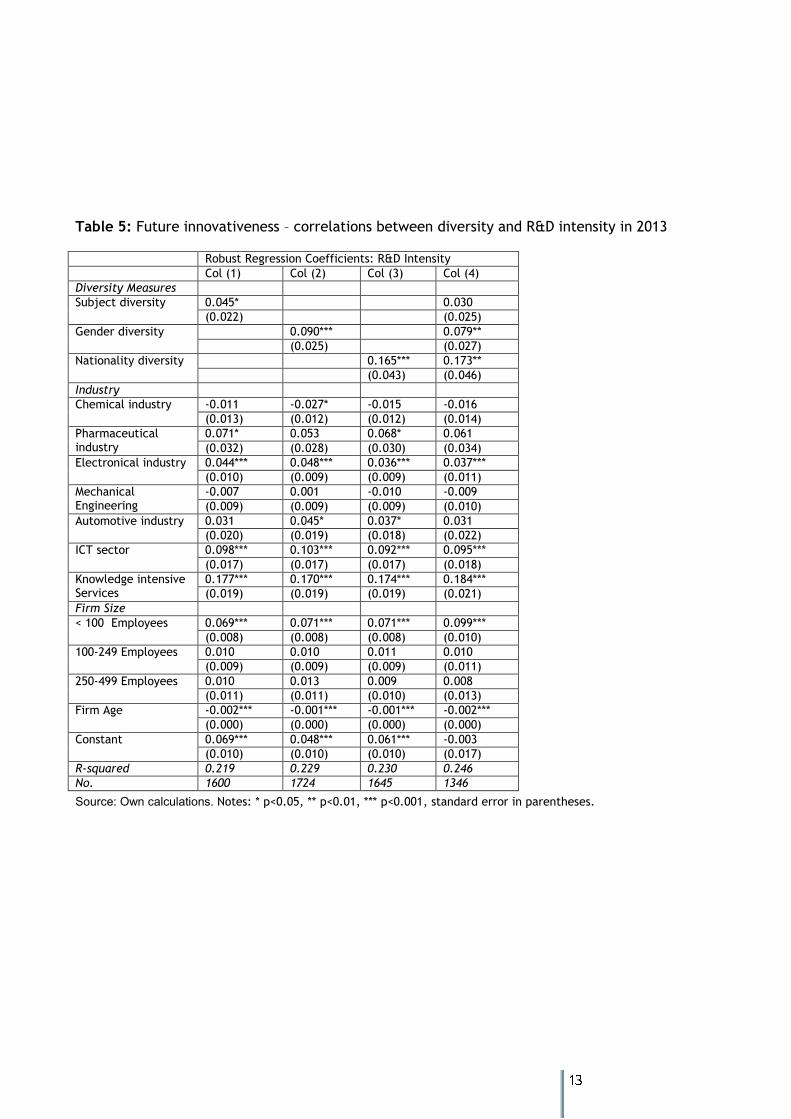
Table 5: Future innovativeness – correlations between diversity and R&D intensity in 2013
Robust Regression Coefficients: R&D Intensity
Col (1) Col (2) Col (3) Col (4)
Diversity Measures
Subject diversity 0.045* 0.030
(0.022) (0.025)
Gender diversity 0.090*** 0.079**
(0.025) (0.027)
Nationality diversity 0.165*** 0.173**
(0.043) (0.046)
Industry
Chemical industry -0.011 -0.027* -0.015 -0.016
(0.013) (0.012) (0.012) (0.014)
Pharmaceutical industry
0.071* 0.053 0.068* 0.061
(0.032) (0.028) (0.030) (0.034)
Electronical industry 0.044*** 0.048*** 0.036*** 0.037***
(0.010) (0.009) (0.009) (0.011)
Mechanical Engineering
-0.007 0.001 -0.010 -0.009
(0.009) (0.009) (0.009) (0.010)
Automotive industry 0.031 0.045* 0.037* 0.031
(0.020) (0.019) (0.018) (0.022)
ICT sector 0.098*** 0.103*** 0.092*** 0.095***
(0.017) (0.017) (0.017) (0.018)
Knowledge intensive Services
0.177*** 0.170*** 0.174*** 0.184***
(0.019) (0.019) (0.019) (0.021)
Firm Size
< 100 Employees 0.069*** 0.071*** 0.071*** 0.099***
(0.008) (0.008) (0.008) (0.010)
100-249 Employees 0.010 0.010 0.011 0.010
(0.009) (0.009) (0.009) (0.011)
250-499 Employees 0.010 0.013 0.009 0.008
(0.011) (0.011) (0.010) (0.013)
Firm Age -0.002*** -0.001*** -0.001*** -0.002***
(0.000) (0.000) (0.000) (0.000)
Constant 0.069*** 0.048*** 0.061*** -0.003
(0.010) (0.010) (0.010) (0.017)
R-squared 0.219 0.229 0.230 0.246
No. 1600 1724 1645 1346
Source: Own calculations. Notes: * p<0.05, ** p<0.01, *** p<0.001, standard error in parentheses.

Table 6: Innovative efficiency – correlation between diversity and R&D efficiency in 2013
Robust Regression Coefficients: R&D efficiency
Col (1) Col (2) Col (3) Col (4)
Diversity Measures
Subject diversity 0.075 -0.067
(0.218) (0.233)
Gender diversity 0.711* 0.846**
(0.314) (0.326)
Nationality diversity -0.121 -0.374
(0.290) (0.325)
Industry
Chemical industry 0.026 0.011 0.025 0.028
(0.198) (0.199) (0.197) (0.201)
Pharmaceutical industry 1.214*** 1.216*** 1.302*** 1.148***
(0.334) (0.313) (0.323) (0.341)
Electronical industry 0.573*** 0.640*** 0.571*** 0.515***
(0.108) (0.119) (0.107) (0.117)
Mechanical Engineering -0.350** -0.184 -0.319** -0.422***
(0.119) (0.136) (0.119) (0.126)
Automotive industry 0.701** 1.218*** 0.796** 0.753**
(0.239) (0.297) (0.278) (0.246)
ICT sector 0.546*** 0.551** 0.572*** 0.637***
(0.157) (0.174) (0.155) (0.165)
Knowledge intensive Services 0.835*** 0.791*** 0.862*** 0.841***
(0.154) (0.167) (0.154) (0.160)
Firm Size
< 100 Employees 0.983*** 0.928*** 0.894*** 0.898***
(0.149) (0.153) (0.148) (0.163)
100-249 Employees 0.222 0.177 0.154 0.142
(0.165) (0.173) (0.166) (0.178)
250-499 Employees -0.148 -0.192 -0.172 -0.093
(0.201) (0.208) (0.197) (0.218)
Firm Age -0.008** -0.009** -0.009** -0.008*
(0.003) (0.003) (0.003) (0.003)
Constant -2.730*** -2.740*** -2.627*** -2.837***
(0.183) (0.199) (0.181) (0.210)
R-squared 0.228 0.223 0.220 0.243
N 1053 906 1074 904
Source: Own calculations. Notes: * p<0.05, ** p<0.01, *** p<0.001, standard error in parentheses.
We observe in our data a positive and significant correlation between our nationality
diversity measure and R&D in basic and applied research. In other words: multinational
teams have a higher probability to conduct basic and applied research that will take more
time to be measured in revenues with new and improved products.
5. Discussion
In order to produce disruptive innovations, firms seek to improve their probability of
breakthrough inventions. One promising solution is to employ groups of inventors with a
high degree of diversity (Fleming 2001). While it has been proven that diversity has
positive effects on the innovativeness of regions and that, for example, foreign knowledge
workers are more innovative than native-born knowledge workers (e.g. Ozgen et al. 2013,
Kerr and Lincoln 2010), the impact of team diversity is still under debate. We provide
empirical evidence on the question if research-based firms in Germany that employ
researcher teams with a higher degree of diversity in terms of gender, subject of study and
nationality had a higher innovative capacity – proxied by future innovativeness (R&D
intensity) and innovative efficiency (R&D efficiency) - in 2013 than their less diverse
competitors.
From the previous literature, we hypothesized a positive effect of diversity on firms’
innovative capacity in our sample since research and development performing firms are
knowledge-intensive. Moreover, we assumed that the effects of diverse researcher teams
in terms of gender, subject of study and nationality on innovative capacity are positive but
might differ.
Our findings confirm both hypotheses. As hypothesized, we find that research-based firms
that employ researcher teams with a higher degree of diversity, i.e. with more foreign and
female researchers and researchers with more diverse subjects of studies, are generally
more innovative. These firms have higher levels of future innovativeness (R&D intensity)
and innovative efficiency (R&D efficiency), too. The effects of researcher teams in terms
of gender, subject of study and nationality on R&D intensity and R&D efficiency are
positive but differ by dimension of diversity. The dimension measure subject of study
seems is positively linked to a firm’s innovative capacity, but to a lower degree than
gender or nationality. Firms that employ many foreign researchers show especially high
values of future innovativeness (R&D intensity); while firms that employ many female
researchers show both high values of future innovativeness (R&D intensity and innovative
efficiency (R&D efficiency).
Our empirical design is a rather tough test for the impact of various forms of diversity on
firm’s innovative capacity and based on unique quantitative information on the researchers
within Germany’s research-based firms together with information on firms innovative
capacity. Therefore, we take our findings as a strong argument pro diversity at the firm
level of knowledge-intensive firms. We conclude that the recruitment of high-skilled
inventors is particularly beneficial for innovation in knowledge-intensive firms.
We close with two research questions that we hope can be addressed in future work. The
positive relationship between diversity of researcher teams and innovative capacity applies
to all diversity metrics with one exception. Firms that employ more foreigners do have a
higher R&D intensity but are not more efficient in terms of R&D as their competitors. We
suppose that the reason is that firms with a higher proportion of foreign researchers
conduct more often basic and applied research instead of product development - which
often does not directly lead to new and innovative, marketable products. Moreover, it may
also reflect the lack of skilled researchers in the area of basic research in Germany
(Schneider and Stenke 2016).
The second research question is a methodological one. As most of the studies in our field
of research, our study cannot identify causalities due to data restrictions. In order to
answer the causality question a better monitoring is needed. Questions on nationality and
college degree should be integrated in the regular questionnaire and tracked over time. To
achieve causality the quantitative analyses needs the transformation event on the firm
level over time, the before and after conditions to investigate the impact of the event
“diversity” and a sufficient time lag to develop influence.

References
Ahuja, Gautam (2000), “Collaboration networks, structural holes, and innovation: A longitudinal
study”, in: Administrative Science Quarterly, 45(3): 425-455.
Alesina, Alberto and Ferrara, Eliana La (2005), "Ethnic Diversity and Economic Performance", in:
Journal of Economic Literature, 43(3): 762-800.
Basset-Jones, Nigel (2005), “The Paradox of Diversity Management, Creativity and Innovation”, in:
Creativity and Innovation Management, 14: 169-75.
Becker, Gary S. (1957), “The Economics of Discrimination”, Chicago.
Berliant, Marcus and Fujita, Masahisa (2008), “Knowledge Creation as a Square Dance on the Hilbert
Cube”, in: International Economic Review, 49: 1251–95.
Brouwer, Eric and Kleinknecht, Alfred (1997), “Measuring the unmeasurable: a country's non-R&D
expenditure on product and service innovation”, in: Research Policy, 25, 8: 1235-1242.
Cohen, Wesley (1995), “Empirical studies of innovative activity”, in: Stoneman, Poul (ed.),
Handbook of the Economics of Innovation and Technical Change, Basil Blackwell, Oxford, Ch. 6.
Crépon, Bruno, Duguet, Emmanuel and Kabla, Isabelle (1998), “Research and Development,
Innovation and Efficiency: An Econometric Analysis at the Firm Level”, in: Economics of Innovation
and New Technology, 7(2): 115-158.
Crépon, Bruno, Duguet, Emmanuel and Kabla, Isabelle (1996), “Schumpeterian conjectures: a
moderate support from various innovation measures”, in: Kleinknecht, Alfred (ed.), Determinants of
Innovation, Mc Millan, London: 63-98.
Dezsö, Cristian L. and Ross, David Gaddis (2012), “Does female representation in top management
improve firm performance? A panel data investigation”, in: Strategic Management Journal, 33(9):
1072–1089.
Dow Jones Venture Source (2012), "Women at the Wheel: Do Female Executives Drive Start-Up
Success?", New York.
Drach-Zahavy, Anat, and Somech, Anit (2001), “Understanding Team Innovation: The Role of Team
Processes and Structures”, in: Group Dynamics: Theory, Research, and Practice, 5(2): 111-123.
Eckl, Verena, Grave, Barbara, Kladroba, Andreas, Kreuels, Bernd, Schneider, Julia and Stenke, Gero
(2015), „a:rәn'di: Analysen 2015 - Forschung und Entwicklung in der Wirtschaft 2013“,
Stifterverband für die Deutsche Wissenschaft, Essen
Fagerberg, Jan, Mowerx, David C. and Nelson, Richard R. (eds.) (2006), “The Oxford Handbook of
Innovation”, Oxford University Press, Oxford.
Fleming, Lee (2001), “Recombinant Uncertainty in Technological Search”, in: Management Science,
47(1): 117-132.
Garnero, Andrea, Kampelmann, Stephan and Rycx, François (2014), “ The Heterogeneous Effects of
Workforce Diversity on Efficiency, Wages, and Profits”, in: Industrial Relations: A Journal of
Economy and Society, 53(3): 430-477.
Hong, Lu and Page, Scott E. (2001), “Problem Solving by Heterogeneous Agents”, in: Journal of
Economic Theory, 97(1): 123-163.
Kerr, William R. and Lincoln, William F. (2010), “The supply side of innovation: H-1B visa reform
and US ethnic invention”, in: Journal of Labor Economics, 28(3): 473-508.
Lazear, Edward P. (1999), “Globalisation and the Market for Team-Mates”, in: The Economic
Journal, 109: 15-40.
Mohnen, Pierre and Dagenais, Marcel (2002), “Towards an Innovation Intensity Index: The Case of
CIS 1 in Denmark and Ireland”, in: Kleinknecht, Alfred and Mohnen, Pierre (Eds.), Innovation and
Firm Performance, Springer: 3-30.
Nelson, Richard R. and Winter, Sidney G. (1982), “An Evolutionary Theory of Economic Change”,
Belknap Press/Harvard University Press: Cambridge.
OECD (2015), Frascati Manual 2015: Guidelines for Collecting and Reporting Data on Research and
Experimental Development, The Measurement of Scientific, Technological and Innovation Activities,
OECD Publishing, Paris.
Osborne, Evan (2000), “The Deceptively Simple Economics of Workplace Diversity”, in: Journal of
Labor Research, 21: 463-475.
Ozgen, Ceren, Nijkamp, Peter and Poot, Jacques (2012), „Immigration and Innovation in European
Regions”, in: Nijkamp, Peter, Poot, Jaques, and Sahin, Mediha (eds.), Migration Impact Assessment:
New Horizons, Edward Elgar Publishing: 261-300.
Ozgen, Ceren, Nijkamp, Peter and Poot, Jacques (2013), “Measuring Cultural Diversity and its
Impact on Innovation: Longitudinal Evidence from Dutch Firms”, IZA Discussion Paper No. 7129.
Parrotta, Pierpaolo, Pozzoli, Dario and Pytlikova, Mariola (2011), “Does Labor Diversity Affect Firm
Efficiency?”, NORFACE MIGRATION Discussion Paper No. 2011-5.
Parrotta, Pierpaolo, Pozzoli, Dario and Pytlikova, Mariola (2014), "The nexus between labor diversity
and firm’s innovation", in: Journal of Population Economics, 27(2): 303-364.
Schneider, Julia and Stenke, Gero (2016), „Männlich – Deutsch – MINT: Diversität als Chance für
Forschung und Entwicklung in Deutschland. Wissenschaftliches Forschungspersonal in der Wirtschaft:
zentrale Ergebnisse der F&E-Sondererhebung 2013“, Stifterverband für die Deutsche Wissenschaft,
Essen.

Schumpeter, Joseph (1939), “Business Cycles: A Theoretical, Historical, and Statistical Analysis of
the Capitalist Process”, Mc Graw-Hill Book Company, New York.
United Nations (1982), “Provisional Guidelines on Standard International Age Classifications”,
Statistical Papers, Series M, 90, United Nations, New York.
Watson, Warren et al, E., Kumar, Kamalesh and Michaelsen, Larry K. (1993), “Cultural Diversity’s
Impact on Interaction Process and Performance: Comparing Homogeneous and Divers Task Groups“,
in: The Academy of Management Journal, 36, 3: 590-602.
Weitzmann, Martin L. (1996), “Hybridizing growth theory”, in: Papers and Proceedings of the 108th
Annual Meeting of the American Economic Association., American Economic Review, 86(2), 207-212.
Williams, Katherine Y. and O’Reilly, Charles A. (1998), “Demography and Diversity in Organizations:
A Review of 40 Years of Research”, in: Research in Organizational Behavior, 20: 77-140.
Zajac, Edward, Golden, Brain R. and Shortell, Stephen M. (1991), “New Organizational Forms for
Enhancing Innovation: The Case of Internal Corporate Joint Ventures”, in: Management Science,
37(2): 170-84.