the determinants of director compensation · the determinants of director compensation ......
TRANSCRIPT
November 18, 2013
The Determinants of Director Compensation*
Viktar Fedaseyeua, James S. Linckb, and Hannes F. Wagnera
aBocconi University and IGIER
Via Roentgen 1 - 20136 Milan, Italy
Tel: +39 02 5836 3528
bEdwin L. Cox School of Business
Southern Methodist University
Dallas, TX 75275, USA
Tel: +1 (214) 768-3933
* We appreciate the comments from Jeff Coles, Francesco Corielli, Tom Chemmanur, Julian Franks, Nicola Gennaioli, Victoria Ivashina, Karl Lins, Lalitha Naveen, Pedro Matos, Urs Peyer, Andrea Sironi, and Phil Strahan, and seminar participants at Bocconi University.

November 18, 2013
The Determinants of Director Compensation
ABSTRACT
While executive compensation has been studied extensively, relatively little is known about
the compensation of outside directors. We attempt to fill this gap by studying the
determinants of outside director compensation using a dataset of over 57,000 board positions
from 2006 to 2010. We show that compensation of outside directors is substantial and varies
significantly across board members, even within the same firm. We find little evidence that
this variation in pay is explained by insider connections that are unrelated to a director’s
duties. Instead, outside director compensation is related to workload, qualifications and
experience. Our findings are consistent with outside director compensation being determined
in a competitive market.
Keywords: Boards of directors, incentives, remuneration, compensation, pay, governance,
corporate boards, agency costs.

1
1. Introduction
Considering financial rewards alone, whether paid in cash or in shares, directors seem to have little reason to break a sweat in the boardroom. (Stout, 2003, p.4)
The role of outside directors on corporate boards and their effect on corporate policies has
received much attention in the literature. However, relatively little is known about how
outside directors are compensated.1 In this paper, we attempt to fill this gap, making two
main contributions. First, we show that compensation of outside directors is substantial and
varies significantly across board members, even within the same firm. Second, we show that
this variation in compensation is consistent with a competitive market for outside directors,
where pay is related to qualifications and experience, rather than insider connections.
To analyze the determinants of outside director compensation, we make use of recent
regulatory changes in disclosure requirements. Until 2006, detailed information on
compensation for individual board members was not available since firms did not have to
disclose board compensation at the individual board member level. In 2006, the SEC adopted
Rule 33-8732a, which requires public companies to disclose compensation of board members
in essentially the same way as executive compensation.
Researchers and pundits have offered alternative views about the determinants of
outside director pay. One view is that boards are an insider system — “an old boys’
network”— that values personal connections over experience (e.g., see Bebchuk and Fried,
2005; Bebchuk, Grinstein and Peyer, 2010). Under this insider system hypothesis, we would
1 Exceptions include Ryan and Wiggins (2004), Yermack (2004), and Farrell, Friesen and Hersch (2008), who provide early analyses of director compensation.

2
expect outside director compensation to be determined by the strength of an individual’s
personal connections rather than by the value of his or her skills and experience. An
alternative view, following Fama (1980) and Fama and Jensen (1983), is that the market for
directors is competitive. Under this competitive market hypothesis, we would expect
compensation to be heterogeneous and determined by the supply and demand for directorship
service.
In order to test these hypotheses, we construct a data set starting with the boards of all
S&P 1,500 firms between 2006 and 2010. For all directors who sit on boards of S&P 1,500
firms, we collect their personal characteristics (e.g., age, gender, and education) and their
specific roles within each board (e.g., chairman of the board, committee memberships and
committee chairmanships). To this we add comprehensive information and other relevant
professional experiences for each individual such as past or current employment or service in
the areas of finance, law, consulting, politics, the military, academia, and management. Our
sample contains 13,376 board members who sit on the boards of 1,846 firms, for a total of
72,517 board positions, of which 57,691 are outside directorships.2 For each outside board
position, we collect detailed compensation data. Since we are interested in pay for
directorship service, we exclude any compensation received by individuals from their
executive positions.3
2 Outside directors are all “non-employee” directors. Inside directors are employees of the firm on whose board they sit. The figure of 13,376 board members includes inside and outside directors. While we do not analyze compensation of inside directors in this paper, we retain inside director positions in order to accurately calculate board size and board composition. Further, since a director can hold both inside and outside director positions across multiple firms, we also use the information on inside positions to help us evaluate outside directors’ executive experience. 3 Presumably, inside directors are also compensated for their board service. However, this compensation is not disclosed separately, and is implicitly included within their executive compensation and thus unobservable. For

3
The average director in our sample receives more than $220,600 annually from all his
or her outside director positions within S&P 1,500 firms. On average, a director holds 1.2
outside director positions in S&P 1,500 firms; thus, the average compensation per outside
directorship is about $180,000. Possibly more striking than the magnitude of compensation is
its variation across individuals. The standard deviation of outside director pay for the sample
is $296,000. Even across directors within the same firm compensation is far from
homogeneous: The standard deviation of outside director pay within the same board is
$63,000, and the spread between the highest and lowest paid outside director on a board
averages $186,000.
Both the level of director compensation and its variability increased substantially over
the last 20 years. In Figure 1 we report the time series of outside director compensation from
1995 to the present by combining results from prior research and extending the time series
using our sample. Prior data on the level of outside director compensation comes from
Yermack (2004), Ryan and Wiggins (2004) and Linck, Netter and Yang (2009). As the graph
shows, mean compensation for an outside directorship rose relatively monotonically from
$70,000 in 1995 to $164,300 in 2006 and $188,600 in 2010.4 Median compensation similarly
increased from $57,000 in 1998 to $150,000 in 2006 to $175,000 in 2010. It is more difficult
to obtain past data on the variance of outside director compensation since it was not reported
simplicity, we will use the terms “director compensation” and “director” that are synonymous with “non-employee or outside director compensation” and “outside director,” respectively. 4 As noted above, outside director compensation prior to 2006 did not have to be disclosed for each director. Therefore, the mapping from pre-2006 to post-2006 data may be imperfect, although the time trend does not suggest a structural break around the disclosure change.

4
for individual directors before 2006. We did obtain the raw data collected by Brickley, Coles
and Linck (1999), and from that data we were able to estimate the standard deviation of per-
position director compensation in their sample from 1991 to 1995. At that time, the standard
deviation was $23,000, compared to $296,000 in our sample. The coefficient of variation –
the ratio of the standard deviation to the mean – increased from 0.5 to 1.7, suggesting a large
relative increase in the variation of pay.5
Outside directors are not all paid the same, and it is difficult to argue their pay is low.
What, then, determines their compensation? Under the competitive market hypothesis,
supply and demand should be the main determinants of outside director compensation.
Alternatively, the insider system hypothesis argues that compensation is determined by
personal connections. We discuss the evidence for both hypotheses in turn.
In a competitive market, the supply of outside directors should largely depend on two
factors: the workload associated with being an outside director, and the value of a director’s
experience and qualifications. Since greater workload means more effort it decreases the
supply of directors. Experience and qualifications also affect supply negatively, as highly
qualified individuals have more valuable outside employment options. At the same time,
qualifications may increase workload: for example, financial experts may be more likely to
5 While the published version of Brickley, Coles and Linck (1999) reports only summary statistics on outside director pay, we obtained their raw data from the interlocking co-author, which covers compensation data for 31 directors holding 81 directorships. While these directors were former CEOs of large (Fortune 500) firms, the directorships held were for public firms of all sizes. For these directorships, mean (median) total outside director pay was $46,000 ($40,000), which consisted of a $24,000 ($24,000) annual retainer, $16,000 ($13,000) for meeting fees and $6,000 ($0) for equity awards (stock and options). The standard deviation of outside director pay across the 81 directorships was $23,000, or roughly half the mean compensation for those directorships.

5
sit on the audit committee further reducing supply.6
While the supply of outside directors is determined by their workload and
qualifications, the demand for outside directors depends on the firm’s needs for the functions
that a board performs, which are generally believed to be advising and monitoring (see
Adams, Hermalin and Weisbach, 2010, for a recent survey). Demand for advising and
monitoring is firm-specific and time-varying.
To empirically test these relations, we construct several “workload variables”,
“experience variables”, and “demand variables”. To capture workload, we determine whether
an individual serves as the chairman of the board or serves on or chairs board committees.
We also consider overall board size since more board members may mean less work per
board member, all else equal. We construct proxies for the value of a director’s qualifications
by collecting each director’s attributes, including education and experience in the areas of
law, consulting, finance, politics, the military, and management. We control for observable
characteristics such as age and gender, and for unobservable characteristics by using director
fixed effects.
We find strong support for the hypothesis that outside directors are compensated for
workload and for their qualifications and experience. Chairing the board increases
compensation by 80 percent. Committee members have 4 to 6 percent higher compensation,
while committee chairs have 10 to 15 percent higher compensation. Larger boards pay their
outside directors less (per director), consistent with the notion that, after controlling for
relevant firm-level characteristics, larger boards demand less work per individual. While 6 We do not attempt to separate the two effects of qualifications on pay as the competitive market hypothesis is consistent with both workload and qualifications positively affecting compensation.

6
firms have always paid their directors differently depending on their roles (such as sitting on
or chairing a committee), we document that this variance has increased significantly over
time.
Qualifications also increase compensation. For example, directors with legal and
consulting experience have 8 percent higher compensation, while those with executive
experience receive 10 percent more. Other qualifications such as having academic or finance
experience are also correlated with higher compensation. In order to address the possibility
that within-firm variation in director pay may be driven solely by workload rather than by
qualifications, we include firm fixed effects and continue to find that qualifications explain
compensation differences even within the same board, and after controlling for workload.
To determine the sensitivity of outside director compensation to the firm’s demand
for monitoring and advising, we construct several “demand variables” that include firm size,
leverage, market-to-book, profitability, stock price volatility, capital expenditures, R&D
spending, firm age, and managerial power. These variables have been shown to determine
board structure and capture a firm’s demand for monitoring and advising services (Boone,
Field, Karpoff and Raheja, 2007; Linck, Netter and Yang, 2008; Coles, Daniel and Naveen,
2008). We find that these measures of demand for directorship service are positively related
to outside director compensation.
To test the insider system hypothesis, we construct four proxies for insider
relationships—whether an outside director has disclosed conflicts of interest, whether
members of the same family hold directorships on the same board, whether an individual has
a connection to an Ivy League academic institution, and the degree of social network
centrality of a director. We do not find evidence that outside director compensation is

7
positively affected by these measures of insider relationships. While personal connections
may be important in obtaining a board seat, we do not find support for the hypothesis that
connections that are presumably unrelated to qualifications or workload significantly affect
compensation. On the contrary, our results suggest that compensation is positively and
significantly related to an individual’s skills and experience. Thus, our results provide
support for the hypothesis that outside director compensation is the outcome of a competitive
market for outside directors, rather than being determined in an “old boys’ network”.
This paper makes several contributions to the literature. We document that
compensation of outside directors is significant and varies substantially across individuals,
boards, and even across individuals who sit on the same board. Further, our analysis goes far
beyond the simple distinction between inside and outside directors, shedding light on other
relevant characteristics of board members. Finally, our results show that a significant amount
of the variation in outside director compensation is explained by supply and demand in a
competitive market for outside directors.
The rest of the paper is organized as follows. In Section 2 we discuss related research
and develop our testable hypotheses. In Section 3 we describe the data and empirical
methodology. Section 4 presents our key findings and their interpretation, as well as
robustness tests. We conclude in Section 5.
2. Prior research and hypotheses
In recent years a large body of research has examined board structure (see Adams, Hermalin
and Weisbach, 2010, for a survey), focusing on the factors that determine the composition of
corporate boards. However, we still know relatively little about how directors are
compensated. An important reason for this may be that, until recently, publicly traded firms

8
did not have to disclose compensation at the individual director level. Thus, research that
examines director pay largely focuses on the overall level of compensation and how much is
cash and equity-based. An exception is Yermack (2004), who studies compensation and
incentives of a sample of individual outside directors from Fortune 500 companies. However,
his focus is different from ours since he does not study the determinants of director
compensation. Time-series data in Farrell, Friesen, and Hersch (2008) and Linck, Netter and
Yang (2009) show that director compensation increased steadily during the late 1990s and
early 2000s, particularly in the wake of the Sarbanes-Oxley Act of 2002 (hereafter, SOX).
This is at least suggestive that the importance of director compensation has increased over
time.
In a competitive market, director compensation should be determined by supply and
demand. The supply of directors is the number of individuals who have the necessary
qualifications and are willing to serve on corporate boards. We argue that supply depends on
the workload associated with being a director and on the value of the individual’s outside
employment options, which we proxy for with a director’s qualifications and experience.
Demand for directors depends on the hiring firm’s needs. Boards are generally believed to
perform two main functions: monitoring and advising top management.7 Therefore, the
demand for directors should reflect a firm’s needs for monitoring and advising.
We begin by considering the demand for outside directors. This demand is
determined by a firm’s needs for monitoring and advising, and is related to firm
7 See Adams, Hermalin, and Weisbach (2010) for a recent survey. Using actual board minutes data, Schwartz-Ziv and Weisbach (2012) document that boards engage in both of these functions but spend most of their time on monitoring.

9
characteristics. Prior research on the determinants of board structure suggests that factors like
firm size and complexity affect the demand for outside directors. Boone, Field, Karpoff, and
Raheja (2007), and Linck, Netter and Yang (2008) document that larger and more complex
firms have larger boards, consistent with the idea that they need more information to
effectively evaluate management.8 Hence, size and complexity should increase the demand
for outside directors. Furthermore, the demand for outside directors should be negatively
related to the magnitude of firm-specific information acquisition costs. This happens because
outside directors need to acquire firm-specific knowledge, which entails acquiring and
processing information, and free-rider costs. Such costs increase with board size and
independence and should, therefore, result in smaller and less independent boards. Thus, the
demand for outside directors should be negatively related to the variables that proxy for
monitoring and advising costs, such as R&D expenditures and stock return volatility (Linck,
Netter and Yang, 2008).
Next, we consider the supply of directors. First, director supply should be negatively
related to the workload of being a director. The workload of corporate directors has increased
significantly in the wake of the SOX and the associated rule changes on the major U.S. stock
exchanges (Linck, Netter, and Yang, 2009). Higher workload, all else equal, should lower the
willingness of an individual to accept a director position, reducing supply. Adams (2003)
argues that board committee memberships are good proxies for director workload. We expect
8 The determinants of board structure literature cited herein largely focuses on the demand for inside vs. outside directors. We do not have a one-to-one mapping with that literature since we are focused on the demand for outside directors only (due to our focus on director compensation). However, the literature is relevant as it highlights the characteristics which drive demand for outside directors, which is where we focus, and what we draw from that literature.

10
workload to be higher for those serving on a committee and for those chairing a committee.
We also expect workload to be related to board size: after controlling for other firm
characteristics, a larger board translates into less work for each individual since the duties are
split across more individuals.
Second, director supply should be negatively related to the director’s experience and
qualifications. These characteristics increase the value of an individual’s outside options and
may also increase workload if highly qualified directors are assigned more demanding
directorship roles, thus decreasing supply. At the same time, experience and qualifications
also increase demand to the extent that they are relevant for improving an individual’s ability
to monitor and advise management. Thus, holding everything else constant, relevant director
experience and qualifications both reduces supply and increases demand, therefore increasing
director pay.
We consider a wide range of qualifications and experience that have been argued to
be relevant in a business setting. We draw from prior research that shows that relevant
experience and qualifications may come from higher education (e.g. Becker (1975)),
financial expertise (De Fond, et al. (2005)), military experience (Benmelech and Fydman
(2011), and Lin, et al (2011)), political experience (e.g. Agrawal and Knoeber (2001), Faccio
(2006)), academic experience (e.g. Audretsch and Lehmann (2006), Jiang and Murphy
(2007)), legal or consulting experience (e.g. Agrawal and Knoeber (2001)), and executive
experience (e.g. Fich (2005), Fahlenbrach, Low and Stulz (2010)). We discuss our measures
in detail in the data section.
An alternative view, as described previously, is that supply and demand for directors
are primarily driven by an insider system that values personal connections over experience. A

11
significant body of research suggests that personal connections create powerful networks that
affect business outcomes. While insider relationships may both enhance firm value (e.g.,
Cohen, Frazzini, and Malloy (2008, 2010); Engelberg, Gao, and Parson (2009)), or reduce it
(e.g. Duchin and Sosyura (2012)), in either case we would expect them to be positively
related to compensation.
An important issue that is beyond the scope of this paper is whether director
compensation is efficient.9 While we cannot address the issue of efficiency directly, any
evidence that we find that director compensation is driven by the competitive forces outlined
above will lend support for the notion that compensation is not purely due to opportunistic
behavior.
3. Sample selection and data
3.1 Sample
The main data source for our analysis is Standard & Poor’s Capital IQ People Intelligence
database (hereafter, Capital IQ). It covers over 4.5 million professionals globally, including
private and public company executives, board members, and investment professionals. It
contains data on current and past employment, compensation, and personal characteristics
such as education. It also includes extensive biographies for individuals within a text field.
Further, Capital IQ assigns each individual a unique identifier, making it possible to reliably
9 In Hermalin and Weisbach’s (1998) theoretical analysis, boards are endogenously determined in a bargaining game between directors and the CEO. In that setting, powerful and well-performing CEOs can establish a weak system of corporate governance that may persist for a long time, in essence creating a board whose incentives are closely aligned with those of the management, and not necessarily the shareholders. Bebchuk, Grinstein, and Peyer (2010) find evidence of opportunistic timing of outside directors’ option grants and show that this timing is correlated with opportunistic timing of executives’ option grants.

12
track all positions of an individual director. We complement Capital IQ with data from
ExecuComp, Riskmetrics, CRSP, and COMPUSTAT.
To analyze the determinants of director compensation, we need detailed
compensation data for all the individual’s director positions. Before 2006, public companies
were not required to disclose director compensation for each individual board member;
instead, only narrative disclosure of director compensation was required. In 2006, the SEC
adopted Rule 33-8732a, which required public companies to disclose compensation of
outside board members in essentially the same way as compensation of executives. Public
companies are required to provide a Director Compensation Table in their annual proxy
statements filed with the SEC. Capital IQ collects compensation data directly from these
statements.
We first identify all individuals who sit on the board of at least one S&P 1,500
company from 2006 through 2010. For all such individuals, we identify all of their board
positions. We retain only board positions in S&P 1,500 firms, excluding board positions in
non-S&P 1,500 firms, private firms and foreign firms. We collect four types of data: i) the
amount and type (e.g., cash, equity, etc.) of compensation each individual receives for each
board seat they hold; ii) whether the position is an executive or non-executive position; iii)
the individual’s educational background, professional experience and personal characteristics
such as gender, and age; and iv) whether the director serves as chairman of the board or as a
chair or member of any board committees.
While boards include both inside and outside directors, we are only interested in
outside director compensation (compensation for serving as a director, not an executive).
Thus, we exclude compensation of inside directors (reported as executive compensation). We

13
do retain an individual’s executive positions to accurately calculate board size and
composition and to determine an outside director’s relevant executive experience.
3.2 Director compensation
Table 1, Panel A provides summary statistics for director compensation in our sample. The
mean total compensation per directorship is $178,500, with a standard deviation of $296,200.
Most of that compensation comes from cash fees ($69,700) and stock awards ($66,300), with
the rest split between option awards ($31,200) and other compensation ($11,300). Because
some directors hold multiple directorships, position-level compensation understates the level
and variation of compensation that an individual receives for outside director service. On
average, a director in our sample holds 1.2 outside directorships in S&P 1,500 firms. The
average compensation an individual receives for all S&P 1,500 outside directorships is
$220,600 per year, with a standard deviation of $352,900.
3.3 Monitoring and advising needs of the firm
At the firm level, the demand for outside directors depends on the firm’s needs for
monitoring and advising. We follow prior work and proxy for this with an array of firm
characteristics that include firm size, R&D spending, profitability, leverage, investment,
market-to-book, stock price volatility, board size, percentage of outsiders on the board and
whether the roles of CEO and Chairman are combined (Linck, Netter and Yang, 2008;
Boone, Field, Karpoff and Raheja, 2007, Coles, Daniel and Naveen, 2008). Additionally, we
consider managerial power by including a version of the Gompers, Iishi, Metric (2003) index
(hereafter GIM) as an additional control variable. Managerial power replicates the original
GIM index using 11 governance provisions that are covered by Riskmetrics pre- and post-

14
2006, with higher values indicating more managerial power. All variables are as defined in
the Appendix A.
From Table 1, panel D, the average firm in our sample has total assets of $21 billion
and a market capitalization of $9 billion. R&D expenses are 2 percent of total assets,
profitability (ROA) is 13 percent, and leverage is 18 percent. Firms invest about 4 percent of
total assets annually and have a market-to-book ratio of 1.7 on average. The average board in
our sample consists of 10 directors, of which 80 percent are outside directors, and 65 percent
of firms combine the role of CEO and Chairman of the Board.
3.4 Director workload
We expect workload to be an important determinant of director compensation. Most of the
work of boards is done in committees; thus, committee membership is a natural proxy for
workload.10 Workload is also related to the difficulty of performing specific committee roles.
For example, chairing a committee likely requires more work than serving on a committee,
and certain committees likely have a higher time commitment than others, such as the audit
committee. Chairing the board also likely entails a relatively high workload. We collect
chairs and members of the nominating and governance committee, the audit committee, the
compensation committee and the thirty other most frequent committees that we find in our
sample firms.11 Three percent of the outside directors in our sample hold the position of the
Chairman of the board, 54 percent are on the nominating and governance committee, 51
10 Adams (2003) notes that “a company is run by and large by its committees. The full board only deals with exceptional circumstances.” In earlier work, Lorsch and MacIver (1989, p. 59) cite a corporate director as saying: “In my experience, I have observed that the work of the board is done in committees.” 11 Committee membership is non-exclusive and an individual may sit on multiple committees.

15
percent are on the audit committee, 52 percent are on the compensation committee, and 33
percent sit on other committees.
3.5 Director characteristics, qualifications and experience
As we argue above, director qualifications determine the value of their outside employment
options and also increase the demand for their services. For each individual, we identify a
wide range of personal characteristics and relevant experience. We provide summary
statistics for experience variables in Panel B of Table 1, and describe them in detail below.12
We first consider the person’s age and gender. We expect age to matter since valuable
experience accumulates with age. As for gender, if firms demand gender-diverse boards or
there is a wage differential between males and females, then we might expect director
compensation to be related to gender. The average director in our sample is 61 years old, and
15 percent are female.13
We also expect education to be an important determinant of director pay since it
provides qualifications and increases the value of human capital (e.g. Becker (1975)). Sixty-
eight percent of the directors in our sample have an undergraduate degree, 50 percent have an
advanced degree, 27 percent of which have an MBA.
Further, we expect financial expertise to affect director compensation. SOX increased
the board’ accountability on financial matters. Finance experience may also matter because
many of the board’s strategic functions involve financial decisions, such as mergers and
12 Table A1 in Appendix A lists all variables with their definitions and data sources. Further, to illustrate the characteristics and experiences that we identify for each director, we provide three detailed examples in Appendix B. 13 The future version of the paper will include director tenure as an additional control variable.

16
acquisitions (De Fond, et al. (2005)). We collect prior and current finance experience
(including Chartered Financial Analyst (CFA™) credentials), and those who hold the title of
a Certified Public Accountant (CPA), or a Chartered Accountant (CA), the Canadian
equivalent. 53 percent of our sample directors have finance experience and 8 percent are
CPAs.
Military experience can develop personal traits that are useful in a corporate setting,
such as resilience and ability to perform in distress (e.g., Benmelech and Frydman, (2009);
Lin, et al (2011)). Thus, we expect military experience to positively affect director
compensation. We identify individuals with military experience by relevant prior or current
employment, service, or consulting experience with the U.S. Department of Defense, its
divisions, or the U.S. Department of Homeland Security.14 Directors with military experience
hold 6 percent of directorships in our sample.
Political experience may affect compensation given the connections it provides (e.g.
Agrawal and Knoeber (2001), Faccio (2006)). We identify individuals with political
experience by prior or current employment, service or consulting experience with any
Presidential Administration since President Lyndon B. Johnson, and members of Congress
and Senators. Such individuals hold 4 percent of directorships in our sample.
Academics will be valued as board members if they improve the board’s ability to
advise and monitor management. Academics may add a different perspective, critical 14 The divisions of the Department of Defense with at least 5 individuals in the sample are, in declining order: Army, Navy, Air Force, Marine Corps, National Guard, Coast Guard, National Security Agency (NSA), National Reconnaissance Office, Pacific Command, European Command, Central Command, Defense Advanced Research Projects Agency (DARPA), Industrial College of Armed Forces, National Defense University, Army Corps of Engineers, Military Academy (West Point), Defense Intelligence Agency, and Missile Defense Agency. We do not consider positions with the Central Intelligence Agency (CIA) as military experience.

17
thinking, and increase board independence (e.g. Audretsch and Lehmann (2006), Jiang and
Murphy (2007)). We identify individuals with academic experience by prior or current
employment by an academic institution or a Ph.D. degree. Academics hold 11 percent of
positions in our sample.
We expect directors with legal or consulting experience to have higher compensation
given the unique advice they can offer (e.g. Agrawal and Knoeber (2001)). We identify
individuals with legal or consulting experience by prior or current employment as a
consultant, lawyer, attorney, or judge. Fifteen percent of the directorships in our sample are
held by individuals who have legal or consulting experience.
Finally, we expect executive experience to be a valuable trait for a board member
since executives, and CEOs in particular, may better understand the challenges faced by
management. Thus, we expect them to be better monitors and advisors (see, e.g., Perry and
Peyer (2005), Fich (2005), Fahlenbrach, Low and Stulz (2010)). We identify executive
experience by concurrent or past executive positions, including current and retired CEOs.
Directors with executive experience hold 28 percent of positions in our sample.
3.6 Insider relationships
In order to test the insider system hypothesis, we construct four proxies for insider
relationships. The first proxy is whether an outside board member can be classified as gray.
Following Shivdasani and Yermack (1999), gray directors are retired employees or relatives
of the CEO, or those that have other disclosed conflicts of interest, such as a business
relationship with the firm. Gray directors by definition have a closer relationship with the
firm’s insiders than other outside directors. Gray directors hold 6 percent of board seats in
our sample. The second proxy is whether members of the same family hold directorships on

18
the same board. If an outside director has higher compensation because another family
member sits on the board, all else equal, this wage differential is likely to capture nepotism
and not ability. Directors with family connections hold about 1 percent of board seats in our
sample. The third proxy is whether a director has a connection to an Ivy League institution.
We include connections originating from degrees, employment, and other functions at Ivy
League institutions.15 Having a personal connection to an Ivy League institution, controlling
for the level of education, should indicate a stronger personal network, other things equal.
Eighteen percent of directorships in our sample are held by individuals with an Ivy League
connection. Finally, we construct the degree of social network centrality of a director, i.e. the
number of first-degree links a director has to other board members.16 This variable measures
the deepness of a director’s social network. On average, directors in our sample have direct
links to 13.7 other board members.
4. Director compensation and its determinants
In this section, we analyze the level, variation and determinants of director compensation.
We find that director compensation is substantial and varies significantly across individual
directors, and has increased dramatically over time (both in terms of its level and variation).
Director compensation varies substantially across industries, across firms and even across
15 Several prior paper use a narrower definition according to which outside directors would be considered as connected to each other if they have attended the same (Ivy League) school. Our variable of Ivy League connection just implies a connection to the school and tries to capture an individual’s ability to access these schools’ deep alumni networks. It is difficult to quantify the depth of an institution’s network, and therefore an Ivy League connection in our sample may proxy for unobservable factors as well as insider relationships. 16 We compute the number of first-degree links by counting the number of other directors in our sample with whom a particular director sits together on at least one board.

19
directors within the same firm. We then investigate how supply and demand determine
director pay and test the competitive market and the insider system hypotheses.
4.1 Level and variation of director compensation
We construct several aggregates of director compensation, and report them in Table 2. In
Panel A we provide four metrics that capture the level of director compensation. Our first
metric, Compensation per position whole sample (CPY), is the annual compensation for a
director position. This averages $178,500 per year, with a standard deviation of $296,200.
For our second metric we sum the compensation an individual receives for all the
directorships held in S&P 1,500 firms in a given year, Compensation a director receives from
all pos. (CADY). Earlier we reported that the average director in our sample holds 1.2
outside directorships in S&P 1,500 firms. On average, directors receive $220,600 per year
from all their S&P 1,500 board seats, with a standard deviation of $352,900.
Our third metric, Compensation that a firm pays to an average director (CFY), is the
average compensation that a firm pays each director. We compute CFY by dividing the total
amount that a firm pays its board in a given year by the number of outside board members
that year. The standard deviation of CFY captures cross-sectional differences in pay across
firms. For our sample, firms pay on average $176,500 per director with a standard deviation
of $196,300. Finally, we report Total compensation that a firm pays to its directors (CTFY).
The average firm spends $1.43 million on outside director pay, with a standard deviation of
$1.26 million. Overall, the univariate analysis suggests that director compensation is both
large and varies quite substantially across firms and individuals.
In Panel B we report the time series for our four measures of director pay. Director
pay decreased slightly during the 2007-2008 financial crisis and then rose substantially in

20
2010. This time series pattern matches the dip and consequent recovery in executive
compensation for the same time period shown by Gabaix, Landier and Sauvagnat (2013).
In Panel C we provide additional statistics on the variation of director pay within
firms. Based on CPY, the average standard deviation of annual board pay within a firm is
$62,600 and the spread between the highest and lowest paid director on a board averages
$186,000. This variation is substantial compared to the average compensation of $178,500.
That is, even within the same board, compensation varies significantly across directors. This
variation is even more pronounced when we compare, within the same board, Compensation
a director receives from all pos. (CADY). For this measure, the average standard deviation is
$123,200 and the spread between the highest and lowest paid director on a board is $327,000.
In Table 3, we consider how director compensation varies across industries. If
directors were homogenous and unimportant, we would expect little variation in director pay
across industries. Instead, Table 3 shows considerable variation in director pay across the
Fama-French industries. In the highest-paying industry, construction, an average director
receives $376,100 per year, while in the lowest-paying industry, rubber, a director receives
$119,200 per year, a difference of over $250,000. Neither board nor firm size explain much
of the industry-level variation in director pay. Highly regulated industries tend to be highly
paid (energy, tobacco, pharmaceuticals, telecoms, health) but there are exceptions (banks).
Thus far, our analysis suggests that director compensation is significant, that it varies
substantially across industries, across firms, and across individuals. We now turn to
multivariate analysis to examine the determinants of director pay.

21
4.2 Demand for directors
We first consider the demand for outside directors, which depends on a firm’s need for
monitoring and advising, using the following specification:
( )it it c t i itLog DirectorCompensation Xα φ λ λ λ ε′= + × + + + + (1)
where the dependent variable is the log of annual compensation received from an individual
directorship, Xit refers to a set of firm characteristics (which include (log of) sales, leverage,
market-to-book, profitability, stock price volatility, investment, R&D expenses, firm age, and
managerial power), are industry fixed effects, are year fixed effects, and iλ are firm
fixed effects. Further, since a director may hold multiple directorships in any given year and
the same directorship across different years, observations are not independent. Thus, we
cluster standard errors by individual.
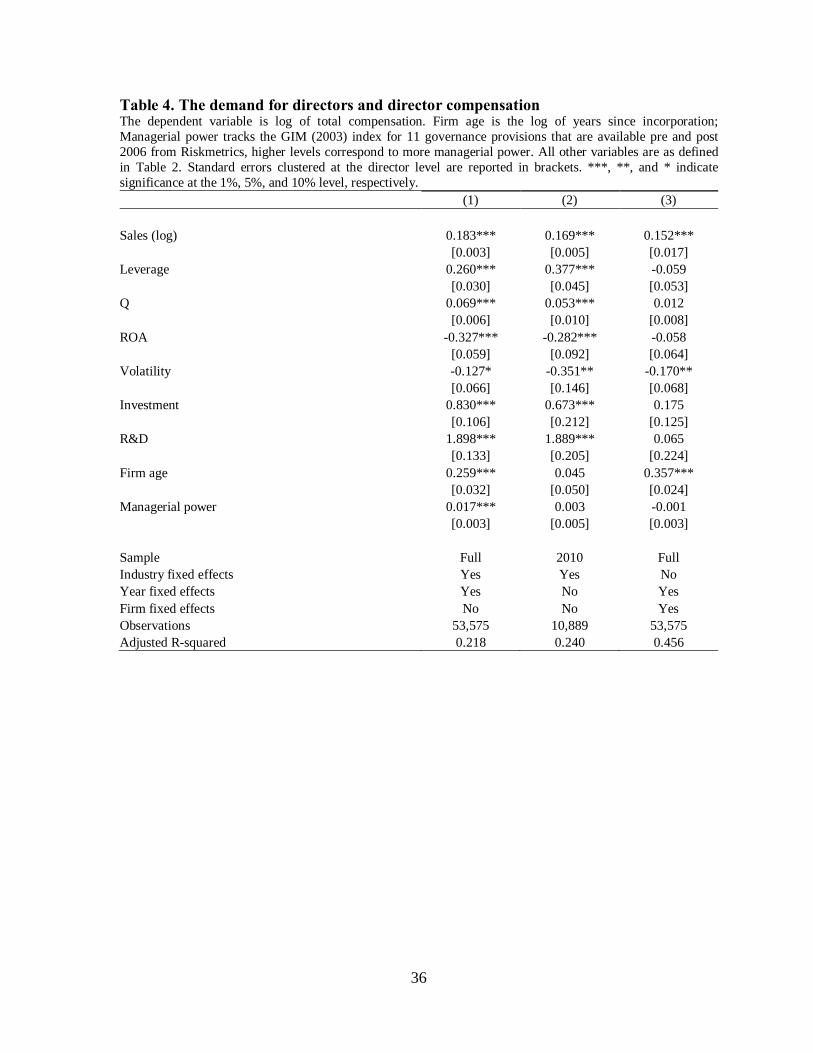
Table 4 reports the results. In column 1, we include the full sample. In column 2 we
restrict the sample to 2010 only as a simple test to assess whether autocorrelation affects our
results in significant way. In column 3, we include firm fixed effects. Our results show that
larger firms pay their directors more, as do firms with higher leverage, higher market-to-book
and higher investment. These results are consistent with our expectations as these
characteristics increase demand for corporate directors, increasing their compensation.
Compensation is decreasing in stock return volatility and profitability, consistent with the
hypothesis that these variables increase the information acquisition, processing, and free
riding costs borne by the firm, reducing the demand for corporate directors. Higher R&D
expenditures result in higher compensation, which is contrary to the idea that R&D intensive
firms should have lower demand for outside directors. Consistent with the idea that
monitoring becomes more valuable with powerful executives, we find that higher managerial
cλ tλ

22
power is positively related to director pay. Including firm fixed effects diminishes statistical
significance of many of the firm-level explanatory variables (with the exception of sales,
leverage, and age). This is unsurprising, because the needs for monitoring and advising are
unlikely to have significant within firm time series variation.
4.3 Director workload
We estimate the effect of director workload on compensation as follows:
(2)
where the dependent variable is the log of annual compensation received from an individual
directorship, Xit refers to the set of firm characteristics described in specification (1), Yit
refers to the set of workload proxies (including whether a director is Chairman of the Board
(COB), a member or Chairman of the nominating/governance committee, the audit
committee, the compensation committee, or another committee, and board size), and ,
and are industry fixed effects, year fixed effects, and director or director-firm fixed
effects, respectively. We report the results in Table 5. Column 1 shows the results for the
entire sample, while column 2 restricts the sample to 2010 only. In column 3 we add director
fixed effects to control for unobserved time-invariant characteristics of individual directors.
Column 4 includes director-firm fixed effects, as a robustness check. Adjusted R-squared is
high in all three specifications. The model that does not include director fixed effects
explains 26 percent of total variation in pay, while adding director fixed effects roughly
doubles the R-squared to 52 percent.
All variables that capture a director’s expected workload positively affect
compensation. We focus on column 1 for our discussion of economic significance. For
( )it it it c t i itLog DirectorCompensation X Yα φ γ λ λ λ ε′ ′= + × + × + + + +
cλ tλ
iλ

23
example, serving on the nominating/governance committee increases compensation by about
6 percent (0.058=e0.056-1). Audit committee members receive compensation that is on
average 5 percent (0.053=e0.052-1) higher than that of director who does not sit on the audit
committee. Compensation is also larger for committee chairs. Audit committee chairs, for
example, get 15 percent (0.153=e0.142-1) higher compensation. Being Chairman of the board
leads to 80 percent (0.799=e0.587-1) higher compensation.
Larger boards pay their directors less, consistent with our conjecture that larger
boards result in a lower workload per director, all else equal, with work divided among more
individuals. However, the effect of board size is economically small: an increase in board
size by one director is associated with a 1.8 percent (-0.018=e-0.018-1) drop in compensation
for an individual director.
Including director-firm fixed effects does not alter the qualitative nature of our
results. In fact, almost all of our workload variables retain their sign and significance. The
only exceptions are the variables that indicate service and chairmanship committees
classified as “other,” which retain their positive sign but lose statistical significance. Thus,
compensation is positively related to workload both across firms and also within the same
firm.
4.4 Director qualifications, experience and insider relationships
Next, we analyze whether a director’s qualifications, experience and insider relationships
drive compensation, using the following specification:
(3)
where the dependent variable is the log of annual compensation received from an individual
directorship, Xit refers to the set of firm characteristics described in specification (1), Zit
( )it it it c t i itLog DirectorCompensation X Zα φ κ λ λ λ ε′= + × + × + + + +

24
refers to the set of director characteristics (including educational achievement, age, gender,
work experience in the areas of finance, politics, the military, academia, law, consulting, and
executive functions, Ivy League connections, gray director status, and family board
connections), and , and are industry fixed effects, year fixed effects, and director or
director-firm fixed effects, respectively.
Table 6 reports the results. Column 1 shows results for the entire sample, column 2
restricts the sample to 2010 only, column 3 adds director fixed effects, and column 4 adds
director-firm fixed effects, as a robustness check.17 In all specifications, we control for firm-
level characteristics and industry and year fixed effects as in previous tables, and include
director fixed effects in column 3. Again, adjusted R-squared is high in all three
specifications; it is 23 percent in the model without director fixed effects, and increases to 51
percent in the model with director fixed effects.
In discussing the results, we focus on the specification in column 1, but results are
similar across all specifications Director qualifications’ proxies are statistically significant
and positively related to director compensation. Legal and consulting experience, academic
experience, finance experience, education, and executive experience are all positively related
to compensation. For example, having legal or consulting experience is associated with 8
percent (0.082=e0.079-1) higher compensation from an average directorship. For those with
executive, finance and academic experience, the increase is 10 percent (0.102=e0.097-1), 5
percent (0.049=e0.048-1), and 2 percent (0.021=e0.021-1), respectively. The compensation of
17 Note that some director characteristics such as gender, education and military experience are not time varying; therefore, we exclude them when we include director fixed effects.
cλ tλ iλ

25
Chairs who are also former CEOs of the company whose board they chair is higher by a
further 169 percent (1.694=e0.991-1). This increase is large and consistent with the evidence in
Brickley, Linck, and Coles (1999), who document that post-retirement board service of a
CEO is an important source of managerial incentives.
Contrary to our expectations, political experience is not significantly associated with
higher compensation when we control for other firm and workload variables, and military
experience is marginally negatively associated with compensation. Also, three of the four
variables that we use to proxy for personal relationships — Ivy League connection, gray
director status and family connection — are not significant.18 The fourth variable, network
centrality, is significant in only one specification (but has a negative sign). Thus, while it
seems plausible that political and military experience (and other personal relationships) are
useful in obtaining a board seat, they do not appear to lead to higher compensation. The
results on whether pay is related to gender is mixed: gender enters significantly negative in
one specification and insignificant in the other. Overall, the results suggest that director pay
is sensitive only to those characteristics that we expect enable directors to perform their
duties better.19
As before, including director-firm fixed effects does not alter the qualitative nature of
our results. All of our qualifications and experience variables retain their sign and
significance. Thus, compensation of outside directors is related to their qualifications even
18 We also interact Ivy League with our education variable and find that this interaction, which might capture a higher ability of Ivy League graduates, is similarly not significant. 19 In untabulated results we confirm that our results are robust to the potential concern of multicollinearity. We re-run Table 6 and add all additional independent variables capturing director workload from Table 5. All coefficients retain their sign and their magnitude remains comparable to the previously reported estimates in Tables 5 and 6.

26
within the same firm. Therefore, it is not just workload, but also skills and experience that
determine outside director pay.
5. Conclusion
We conduct a comprehensive examination of the determinants of director compensation. We
find that director compensation is significant, and that it varies substantially across firms,
individuals, and even across individuals within the same firm. Further, we find that this
compensation is determined by workload as well as qualifications and experience of
individual directors.
Our analysis is based on the view that director compensation is determined by supply
and demand in a competitive market. A firm’s demand for directors is driven by its needs for
monitoring and advising and is determined by firm-level characteristics. The supply of
corporate directors is driven by their willingness to perform directorship duties, which is
determined by their workload and the value of their outside employment options.
We find that director pay is positively related to firm-level variables that increase
demand for directors. In particular, larger firms pay their directors more, as do firms with
higher leverage, higher Market-to-Book, higher R&D expenditures, and higher investment.
Director pay is negatively related to variables that reduce demand for corporate directors. For
example, higher stock return volatility and ROA lead to lower director compensation,
consistent with the idea that these variables proxy for increases in information acquisition,
processing, and free riding costs borne by the firm.
Variables that influence director supply also affect their compensation. Starting with
workload, we show that directors that have higher workload have higher compensation.
Serving on a committee leads to 4% to 6% more compensation, while chairing a committee

27
translates to 10% to 15% more pay. Chairing the board also leads to 80% higher
compensation, on average. Larger boards pay their directors less, consistent with the idea that
larger boards spread the workload across more individuals, translating into less work for each
individual director.
Finally, we show that qualifications that are likely to be valuable for serving as a
director positively affect compensation, while characteristics unrelated to directorship duties
do not appear to effect compensation. Directors with legal and consulting experience have
8% higher compensation, while those with executive experience receive 10% more. Other
qualifications, such as having academic or finance experience, similarly increase
compensation. Importantly, we find no evidence that insider connections affect
compensation. Overall, our evidence is consistent with the hypothesis that director pay is
determined in a market that rewards qualifications and workload.

28
References
Adams, Renée, 2003. What Do Boards Do? Evidence from Board Committee and Director Compensation Data. Working paper, University of Queensland.
Adams, Renée, Benjamin E. Hermalin, and Michael S. Weisbach, 2010. The Role of Boards of Directors in Corporate Governance: A Conceptual Framework and Survey. Journal of Economic Literature 48, 58-107.
Agrawal, Anup, and Charles R. Knoeber, 2001. Do Some Outside Directors Play a Political Role? Journal of Law and Economics 44, 179-198.
Audretsch, D.B., and E. Lehmann, E., 2006. Entrepreneurial access and absorption of knowledge spillovers: Strategic board and managerial composition for competitive advantage. Journal of Small Business Management 44, 155–166.
Bebchuk, Lucian A., and Jesse M. Fried, 2005. Pay without Performance: The Unfulfilled Promise of Executive Compensation, Harvard University Press, Cambridge, MA.
Bebchuk, Lucian A., Yaniv Grinstein, and Urs Peyer, 2010. Lucky CEOs and Lucky Directors. Journal of Finance 65, 2362-2401.
Becker, Gary S., 1975. Human Capital: A Theoretical and Empirical Analysis, with Special Reference to Education, 2nd ed, National Burea of Economic Research, Cambridge, MA.
Benmelech, Efraim, and Carola Frydman, 2010. Military CEOs. Working paper, Northwestern University.
Black, Bernard, Brian Cheffins, and Michael Klausner, 2006. Outside Director Liability. Stanford Law Review 58, 1055-1159.
Boone, Audra L., Laura Casares Field, Jonathon M. Karpoff, and Charu G. Raheja, 2007. The determinants of corporate board size and composition: an empirical analysis. Journal of Financial Economics 85, 66–101.
Brickley, James A., James S. Linck, and Jeffrey L. Coles, 1999. What Happens To CEOs After They Retire? New Evidence on Career Concerns, Horizon Problems, and CEO Incentives. Journal of Financial Economics 52, 341-377.
Coles, Jeffrey L., Naveen D. Daniel, and Lalitha Naveen, 2008. Boards: does one size fit all? Journal of Financial Economics 87, 329–356.

29
DeFond, Mark L, Rebecca N. Hann, and Xuesong Hu, 2005. Does the market value financial experience on audit committes of board of directors? Journal of Accounting Research 43, 153-193.
Duchin, Ran, and Denis Sosyura, 2012. Divisional Managers and Internal Capital Markets, Journal of Finance, forthcoming.
Fama, Eugene F., 1980. Agency problems and the theory of the firm. Journal of Political Economy 88, 288-307.
Fama, Eugene F., and Michael C. Jensen, 1983. Separation of Ownership and Control. Journal of Law and Economics 26(2), 301-325.
Farrell, K. A., G. C. Friesen, and P. L. Hersch. 2008. How Do Firms Adjust Director Compensation? Journal Corporate Finance 14, 153–62.
Gabaix, Xavier, Augustin Landier, and Julien Sauvagnat, 2013. CEO Pay and Firm Size: an Update after the Crisis, NBER Working paper 19078.
Gompers, Paul, Joy Ishii, and Andrew Metrick, 2003. Corporate Governance and Equity Prices. Quarterly Journal of Economics 118. 107-156.
Hermalin, Benjamin E., and Michael S. Weisbach, 1998. Endogenously Chosen Boards of Directors and Their Monitoring of the CEO. American Economic Review 88, 96-118.
Hermalin, Benjamin E., and Michael S. Weisbach, 2003. Boards of Directors as an Endogenously Determined Institution: A Survey of the Economic Literature. Federal Reserve Bank of New York Economic Policy Review, 9(1): 7–26.
Jiang, Bin, and Patrick J. Murphy, 2007. Do business school professors make good executive managers? Academy of Management Perspectives 21, 29-51.
Lin, Chen, Yue Ma, Micah S. Officer, and Hong Zou, , 2011. CEOs’ Military Experience and Acquisition Decisions. Working paper, Chinese University of Hong Kong.
Linck, James S., Jeffry M. Netter, and Tina Yang, 2008. The determinants of board structure. Journal of Financial Economics 87, 308–328.
Linck, James S., Jeffry M. Netter, and Tina Yang, 2009. The effects and unintended consequences of the Sarbanes-Oxley Act on the supply and demand for directors. Review of Financial Studies 22, 3287-3328.
Lorsch, Jay W. and Elizabeth MacIver 1989. Pawns or potentates: The reality of America’s corporate boards. Harvard University Press, Cambridge, MA.

30
Ryan, Harley E., and Roy A. Wiggins III, 2004. Who is in whose pocket? Director Compensation, board independence, and barriers to effective monitoring. Journal of Financial Economics 73, 497-524.
Schwartz-Ziv, Miriam, and Michael S. Weisbach, 2013. What do boards really do? Evidence from minutes of board meetings. Journal of Financial Economics 108, 349-366.
Stout, Lynn, 2003. On the proper motives of corporate directors (or, why you don’t want to invite homo economics to join your board). Delaware Journal of Corporate Law 28, 1-25. Yermack, David L., 2004. Remuneration, Retention, and Reputation Incentives for Outside
Directors. Journal of Finance 59, 2281-2308.

31
Time-series of director compensation Compensation from 2006 onwards is from our sample. Average compensation for 1995 is from Yermack (2004), and average compensation for 1996 is from Ryan and Wiggins (2004). Median compensation from 1998 to 2005 is from Linck et al. (2009).
5000
010
0000
1500
0020
0000
Tota
l com
pens
atio
n in
$
1995 2000 2005 2010year
Per position, medianPer position, average

32
Table 1. Descriptive statistics Summary statistics for the main variables used in subsequent regression analyses. In Panel A, Total compensation is the yearly amount in thousands of dollars paid to an outside director, and consists of cash fees, stock awards, option awards, and other items (non-equity incentive payments, bonuses, changes in pension plans, and other payments). In Panel B, members (chairmen) of the following committees are indicated by the respective variable: corporate governance committee, nominating committee, audit committee, compensation committee, and other committee. In Panel C, Education variables indicate each of the following types of degrees: Undergraduate, Graduate, and MBA; Finance experience indicates prior or current finance experience or Chartered Financial Analyst credentials; CPA indicates the Certified Public Accountant qualification; Military experience indicates prior or current employment, service, or consulting experience with the U.S. Department of Defense, one of the divisions of the U.S. Department of Defense (U.S. Army, U.S. Navy, Marine Corps, U.S. Air Force, National Guard, DARPA, NSA, West Point Military Academy, and others), or the U.S. Department of Homeland Security; Political experience indicates prior or current employment, service or consulting experience with a U.S. Presidential Administration (since the Lyndon B. Johnson Administration), and members of U.S. Congress and U.S. Senators; Academic experience indicates prior or current employment by an academic institution or a Ph.D. degree; Legal/Consulting experience indicates prior or current employment as a consultant, lawyer, attorney or judge; Executive experience indicates prior employment in an executive position (including CEO). Ivy League indicates a prior or current connection to an Ivy League institution. Gray director indicates a retired employee or relative of the CEO, or a director with other disclosed conflicts of interest such as a business relationship with the firm. Family connection indicates whether members of the same family hold directorships on the same board. Network centrality is the degree of network centrality of a director, i.e. the number of first-degree links to other board members. In Panel D, total assets and market capitalization are in millions of US$; R&D is the ratio of research and development expenses to total assets; ROA is the ratio of operating income over assets; Leverage is the ratio of long-term debt over total assets; Investment is the ratio of capital expenditures to total assets; market-to-book is the market value of equity plus the book value of assets minus the book value of equity and deferred taxes, all divided by book assets; Volatility is the standard deviation of the monthly stock return over the previous fiscal year. Board size is the total number of board members. Outsiders is the percentage of non-executive directors on the board. CEO/Chairman indicates the CEO being Chairman of the Board.

33
Panel A: Director compensation (Position years)
Variable N Mean 25th Pctl. Median 75th Pctl. Std. Dev. Total compensation 57,689 178.5 100.9 155.5 214.3 296.2 of which cash fees 57,689 69.7 44.0 65.0 88.5 50.2 of which stock awards 57,689 66.3 3.9 50.1 98.5 108.4 of which option awards 57,507 31.2 0.0 0.0 34.5 118.9 of which other compensation 57,689 11.3 0.0 0.0 1.4 152.4
Panel B: Director workload (Position years) Chairman of the board 57,689 0.032 0.000 0.000 0.000 0.177 Nominating/governance committee 57,689 0.538 0.000 1.000 1.000 0.499 Audit committee 57,689 0.514 0.000 1.000 1.000 0.500 Compensation committee 57,689 0.517 0.000 1.000 1.000 0.500 Other committee 57,689 0.331 0.000 0.000 1.000 0.470 Chair nom./gov. comm. 57,689 0.142 0.000 0.000 0.000 0.349 Chair audit comm. 57,689 0.139 0.000 0.000 0.000 0.346 Chair compensation comm. 57,689 0.139 0.000 0.000 0.000 0.346 Chair other comm. 57,689 0.083 0.000 0.000 0.000 0.275
Panel C: Director characteristics (Position years) Age 57,689 61.230 56.000 62.000 67.000 8.180 Female 57,689 0.146 0.000 0.000 0.000 0.353 Education: Undergraduate 57,689 0.677 0.000 1.000 1.000 0.468 Education: Graduate 57,689 0.499 0.000 0.000 1.000 0.500 Education: MBA 57,689 0.265 0.000 0.000 1.000 0.441 Finance experience 57,689 0.531 0.000 1.000 1.000 0.499 CPA 57,689 0.079 0.000 0.000 0.000 0.269 Military experience 57,689 0.064 0.000 0.000 0.000 0.244 Political experience 57,689 0.040 0.000 0.000 0.000 0.196 Academic experience 57,689 0.107 0.000 0.000 0.000 0.310 Legal/Consulting experience 57,689 0.153 0.000 0.000 0.000 0.360 Executive experience 57,689 0.281 0.000 0.000 1.000 0.450 Ivy League 57,689 0.184 0.000 0.000 0.000 0.387 Gray director 57,689 0.062 0.000 0.000 0.000 0.240 Family connection 57,689 0.012 0.000 0.000 0.000 0.107 Network centrality 57,689 13.667 8.000 10.000 17.000 8.978
Panel D: Firm characteristics (Firm years) Total assets 7,205 21,269 908.5 2,696 8,835 118,558 Market capitalization 7,198 9,255 799.4 2,138 6,374 26,879 R&D 7,190 0.0231 0 0 0.0246 0.0463 ROA 6,999 0.127 0.0733 0.121 0.176 0.105 Leverage 7,182 0.182 0.028 0.152 0.285 0.166 Investment 7,189 0.0441 0.0119 0.0282 0.0577 0.0522 Market-to-book 7,205 1.703 1.069 1.379 1.972 0.983 Volatility 7,140 0.112 0.0676 0.0963 0.138 0.0668 Board size 7,216 10.05 8 10 12 3.245 Outsiders 7,216 0.795 0.727 0.8 0.875 0.107 CEO/Chairman 7,216 0.652 0 1 1 0.476

34
Table 2. Director compensation Sample statistics of outside director compensation. Panel A shows compensation statistics at the position-year level, at the director-year level, and at the firm-year level. Panel B shows compensation by year. Panel C shows compensation variation.
Panel A: Compensation levels Unit of
observation N Mean 25th Pctl. Median 75th Pctl. Std. Dev.
Compensation per position, whole sample (CPY)
Position-year 57691 178,499 100,937 155,506 214,255 296,152
Compensation a director receives from all pos. (CADY)
Director-year 46680 220,604 102,969 165,000 255,400 352,904
Compensation that a firm pays to an average director (CFY)
Firm-year 7216 176,523 105,891 154,114 208,583 196,314
Total compensation that a firm pays to its directors (CTFY)
Firm-year 7216 1,427,077 704,165 1,194,489 1,843,377 1,263,788
Panel B: Compensation levels by year
Year CPY CADY CFY CTFY 2006 181,150 222,485 184,934 1,473,807 2007 175,695 219,582 172,613 1,407,426 2008 176,593 219,102 173,516 1,408,306 2009 172,199 212,408 169,480 1,367,787 2010 187,787 230,179 183,862 1,489,156
Panel C: Compensation variation Unit of
observation N Mean 25th Pctl. Median 75th Pctl.
Within board Std. Dev. of director compensation (based on CPY)
Firm-year 7120 62,558 12,303 28,971 57,455
Within board [Max-Min] spread of director compensation (based on CPY)
Firm-year 7216 186,960 32,935 84,752 172,702
Within board Std. Dev. of total director compensation (based on CADY)
Firm-year 7022 123,177 30,431 83,096 148,208
Within board [Max-Min] spread of director compensation (based on CADY)
Firm-year 7131 326,635 74,811 212,005 390,723

35
Table 3. Industry average compensation
Industries sorted by compensation that a firm pays to an average director (CFY), averaged across firms and years within an industry. Equity-based compensation is the sum of stock awards and option awards. Average market capitalization is in $ billion. Rank FF48 Compensation per position (CFY) Avg.
market cap Total board
compensation (CTFY)
Board size Number of firms
Total % Cash % Equity %Other
1 cnstr 376,123 0.39 0.54 0.07 2.73 1,978,632 9.35 1032 enrgy 281,720 0.36 0.59 0.05 22.71 2,196,569 9.81 2933 smoke 249,234 0.42 0.54 0.04 52.38 2,048,332 10.67 184 drugs 246,835 0.36 0.61 0.03 20.58 2,050,177 10.17 2505 mines 237,333 0.45 0.47 0.08 8.37 2,130,641 11.47 326 telcm 217,233 0.49 0.46 0.05 24.73 2,099,414 11.05 1507 gold 216,303 0.48 0.46 0.06 23.72 2,422,722 13.40 58 comps 206,954 0.37 0.61 0.02 13.12 1,498,157 9.00 5849 hlth 192,498 0.44 0.53 0.03 2.24 1,372,602 9.17 13810 fun 186,749 0.41 0.55 0.04 3.23 1,461,797 10.19 5411 steel 184,805 0.55 0.40 0.05 4.54 1,374,499 9.39 9312 clths 183,329 0.48 0.49 0.03 3.23 1,327,764 9.16 12513 coal 183,182 0.61 0.37 0.02 6.60 1,720,259 10.92 2414 chips 179,659 0.40 0.58 0.02 7.66 1,235,664 8.57 28815 aero 178,503 0.51 0.43 0.06 20.40 1,759,680 10.56 5016 insur 176,182 0.50 0.46 0.04 9.56 1,619,559 11.19 34317 soda 175,756 0.45 0.52 0.02 21.03 1,694,581 11.08 8018 medeq 174,364 0.38 0.60 0.03 5.21 1,311,036 9.36 22319 hshld 172,736 0.49 0.46 0.05 12.14 1,414,692 10.80 14620 rlest 171,167 0.36 0.59 0.05 3.54 1,165,301 9.25 2021 agric 168,240 0.32 0.58 0.10 13.31 1,224,511 8.38 1622 persv 167,825 0.43 0.53 0.04 2.30 1,238,307 9.40 7023 trans 167,624 0.48 0.48 0.04 7.72 1,371,055 10.14 18824 ships 167,269 0.41 0.58 0.01 2.11 1,356,164 10.44 925 toys 165,791 0.46 0.52 0.02 2.34 1,306,655 9.59 3926 fin 163,631 0.45 0.52 0.03 7.50 949,794 6.23 35527 rtail 162,220 0.45 0.52 0.02 8.91 1,286,570 9.93 49028 misc 162,111 0.50 0.45 0.05 31.55 1,474,113 10.58 5729 food 160,731 0.48 0.49 0.03 7.68 1,516,646 11.43 8630 labeq 160,239 0.44 0.52 0.04 4.98 1,221,884 9.10 17431 chem 159,783 0.48 0.46 0.06 6.08 1,373,834 10.52 16132 whlsl 159,438 0.50 0.48 0.02 2.86 1,227,213 9.92 23033 guns 157,733 0.61 0.35 0.04 8.05 1,513,376 9.93 4634 meals 156,503 0.44 0.54 0.02 5.85 1,241,276 9.61 14235 elceq 155,796 0.46 0.52 0.02 3.88 1,195,373 9.21 18736 util 155,385 0.52 0.43 0.05 7.90 1,547,257 12.24 40637 bussv 154,533 0.46 0.52 0.02 2.28 1,157,472 9.12 31538 mach 153,898 0.46 0.51 0.03 5.51 1,295,471 9.77 26939 boxes 142,209 0.58 0.36 0.06 3.02 1,259,138 10.67 2440 bldmt 136,144 0.48 0.46 0.06 3.41 1,110,340 9.51 10141 paper 134,900 0.52 0.42 0.06 6.95 1,246,168 10.45 10842 books 132,370 0.49 0.48 0.04 3.65 1,269,148 11.37 5243 fabpr 128,486 0.55 0.40 0.05 0.81 907,266 9.50 2644 banks 127,566 0.59 0.33 0.09 12.06 1,408,832 13.48 51745 autos 124,689 0.59 0.35 0.06 4.90 1,141,185 11.03 7246 txtls 122,154 0.53 0.46 0.00 2.04 936,043 10.15 2047 rubbr 119,234 0.57 0.41 0.02 1.55 1,034,591 10.24 37
36
Table 4. The demand for directors and director compensation The dependent variable is log of total compensation. Firm age is the log of years since incorporation; Managerial power tracks the GIM (2003) index for 11 governance provisions that are available pre and post 2006 from Riskmetrics, higher levels correspond to more managerial power. All other variables are as defined in Table 2. Standard errors clustered at the director level are reported in brackets. ***, **, and * indicate significance at the 1%, 5%, and 10% level, respectively. (1) (2) (3) Sales (log) 0.183*** 0.169*** 0.152*** [0.003] [0.005] [0.017] Leverage 0.260*** 0.377*** -0.059 [0.030] [0.045] [0.053] Q 0.069*** 0.053*** 0.012 [0.006] [0.010] [0.008] ROA -0.327*** -0.282*** -0.058 [0.059] [0.092] [0.064] Volatility -0.127* -0.351** -0.170** [0.066] [0.146] [0.068] Investment 0.830*** 0.673*** 0.175 [0.106] [0.212] [0.125] R&D 1.898*** 1.889*** 0.065 [0.133] [0.205] [0.224] Firm age 0.259*** 0.045 0.357*** [0.032] [0.050] [0.024] Managerial power 0.017*** 0.003 -0.001 [0.003] [0.005] [0.003] Sample Full 2010 Full Industry fixed effects Yes Yes No Year fixed effects Yes No Yes Firm fixed effects No No Yes Observations 53,575 10,889 53,575 Adjusted R-squared 0.218 0.240 0.456

37
Table 5. Workload and director compensation The dependent variable is log of total compensation, regressed on explanatory variables that capture the expected workload of a director, and control variables. All variables are as defined in Table 2. Control variables are as in Table 4. Standard errors clustered at the director level are reported in brackets. ***, **, and * indicate significance at the 1%, 5%, and 10% level, respectively. (1) (2) (3) (4) Nominating/governance committee 0.056*** 0.048*** 0.079*** 0.108*** [0.008] [0.012] [0.011] [0.018] Audit committee 0.052*** 0.069*** 0.083*** 0.107*** [0.009] [0.013] [0.012] [0.017] Compensation committee 0.037*** 0.054*** 0.086*** 0.125*** [0.008] [0.013] [0.011] [0.018] Other committee 0.046*** 0.038*** 0.032** 0.094 [0.009] [0.014] [0.014] [0.156] Chair nom./gov. comm. 0.092*** 0.084*** 0.083*** 0.062*** [0.011] [0.017] [0.013] [0.022] Chair audit comm. 0.142*** 0.144*** 0.112*** 0.082*** [0.011] [0.015] [0.016] [0.025] Chair compensation comm. 0.106*** 0.097*** 0.069*** 0.074*** [0.011] [0.015] [0.014] [0.020] Chair other comm. 0.104*** 0.120*** 0.120*** 0.630 [0.015] [0.020] [0.021] [0.674] Chairman of the board 0.587*** 0.544*** 0.498*** 0.406*** [0.028] [0.033] [0.029] [0.047] Board size -0.018*** -0.019*** -0.018*** -0.024*** [0.002] [0.003] [0.002] [0.003] Sample Full 2010 Full Full Control variables Yes Yes Yes Yes Industry fixed effects Yes Yes Yes No Year fixed effects Yes Yes Yes Yes Director fixed effects No No Yes No Director-firm fixed effects No No No Yes Observations 56,451 11,150 56,451 56,451 Adjusted R-squared 0.256 0.284 0.522 0.486

38
Table 6. Qualifications, insider connections, and director compensation The dependent variable is log of total compensation, regressed on explanatory variables that include the qualifications and experience of a director, and the directors’ insider connections. All variables are as defined in Table 2. Control variables are as in Table 4. Standard errors clustered at the director level are reported in brackets. ***, **, and * indicate significance at the 1%, 5%, and 10% level, respectively. (1) (2) (3) (4) Legal/Consulting experience 0.079*** 0.079*** 0.092*** 0.097*** [0.011] [0.014] [0.019] [0.019] Academic experience 0.021* 0.018 0.060* 0.079** [0.011] [0.017] [0.034] [0.037] Finance experience 0.048*** 0.051*** 0.086*** 0.086*** [0.008] [0.012] [0.028] [0.029] CPA 0.032** 0.052*** [0.014] [0.018] Executive experience 0.097*** 0.094*** 0.080*** 0.077*** [0.009] [0.013] [0.013] [0.014] Political experience -0.003 -0.008 -0.056 0.098 [0.019] [0.026] [0.167] [0.161] Military experience -0.028* -0.036 [0.015] [0.023] Education (UG, G, MBA) 0.019*** 0.027*** [0.004] [0.006] Age 0.004*** -0.000 0.044*** 0.042*** [0.001] [0.001] [0.003] [0.005] Female -0.019* -0.012 [0.010] [0.015] Chair former CEO 0.991*** 0.804** 0.560* 1.027*** [0.185] [0.361] [0.320] [0.307] Ivy League 0.008 0.003 [0.011] [0.015] Gray director -0.009 -0.019 -0.001 -0.015 [0.018] [0.024] [0.026] [0.028] Family connection 0.037 0.002 0.094 0.123 [0.058] [0.086] [0.114] [0.176] Network centrality 0.001 -0.000 -0.006*** -0.000 [0.000] [0.001] [0.001] [0.001] Sample Full 2010 Full Full Control variables Yes Yes Yes Yes Industry fixed effects Yes Yes Yes No Year fixed effects Yes Yes Yes Yes Director fixed effects No No Yes No Director-firm fixed effects No No No Yes Observations 56,280 11,103 56,280 56,280 Adjusted R-squared 0.230 0.258 0.507 0.588

39
Appendix A Table A1. Variable definitions and data sources
Variable Definition Source of Data Total compensation Yearly amount in thousands of dollars paid to an
outside director, consisting of cash fees, stock awards, option awards, and other items (non-equity incentive payments, bonuses, changes in pension plans, and other payments)
Capital IQ
Chairman of the board Indicates the position in which the director is Chairman of the board
Capital IQ; Riskmetrics
Nominating/corporate governance committee
Indicates membership of the nominating/corporate governance committee
Capital IQ; Riskmetrics
Audit committee Indicates membership of the audit committee Capital IQ; Riskmetrics Compensation committee Indicates membership of the compensation
committee Capital IQ; Riskmetrics
Other committee Indicates membership of the any other committee Capital IQ; Riskmetrics
Chair nom./gov comm. Indicates chairmanship of the nominating/corporate governance committee
Capital IQ; Riskmetrics
Chair audit comm. Indicates chairmanship of the audit committee Capital IQ; Riskmetrics Chair compensation comm. Indicates chairmanship of the compensation
committee Capital IQ; Riskmetrics
Chair other comm. Indicates chairmanship of any other committee Capital IQ; Riskmetrics
Education: Undergraduate Indicates that the director has an undergraduate degree
Capital IQ
Education: Graduate Indicates that the director has a graduate degree Capital IQ Education: MBA Indicates that the director has an MBA Capital IQ Honorary doctorate Indicates that the director has an honorary doctorate
from an institution of higher education Capital IQ
Ivy League Indicates a prior or current connection to an Ivy League institution
Capital IQ
Gray director Indicates a retired employee or relative of the CEO, or a director with other disclosed conflicts of interest such as a business relationship with the firm.
Capital IQ, Riskmetrics
Family connection Indicates whether members of the same family hold directorships on the same board.
Capital IQ, manual data collection
Network centrality Degree of network centrality of a director, i.e. the number of first-degree links a director has to other board members.
Capital IQ
CPA Indicates the Certified Public Accountant qualification
Capital IQ
Age Director’s age Capital IQ; Riskmetrics; manual data collection
Female Indicates that the director is female Capital IQ; Riskmetrics; manual data collection

40
Military experience Indicates prior or current employment, service, or consulting experience with the U.S. Department of Defense, one of the agencies of the U.S. Department of Defense (U.S. Army, U.S. Navy, Marine Corps, U.S. Air Force, National Guard, DARPA, NSA, West Point Military Academy, Joint Chiefs of Staff, Unified Combatant Commands, and others), or the U.S. Department of Homeland Security
Capital IQ
Political experience Indicates prior or current employment, service or consulting experience with a U.S. Presidential Administration (since the Lyndon B. Johnson Administration), and members of U.S. Congress and U.S. Senators
Capital IQ
Legal/Consulting experience Indicates prior or current employment as a consultant, lawyer, attorney or judge
Capital IQ; Riskmetrics
Academic experience Indicates prior or current employment by an academic institution or a Ph.D. degree
Capital IQ; Riskmetrics
Finance experience Indicates prior or current finance experience or Chartered Financial Analyst credentials
Capital IQ; Riskmetrics
Executive experience Indicates prior employment in an executive position (including CEO)
Capital IQ; Riskmetrics; Execucomp
Total assets Firm’s book value of total assets COMPUSTAT Market capitalization Firm’s market capitalization CRSP R&D The ratio of research and development expenses to
total assets COMPUSTAT
ROA The ratio of operating income over assets COMPUSTAT Leverage The ratio of long-term debt over total assets COMPUSTAT Investment The ratio of capital expenditures to total assets COMPUSTAT Q The market value of equity plus the book value of
assets minus the book value of equity and deferred taxes, all divided by book assets
COMPUSTAT, CRSP
Volatility The standard deviation of the monthly stock return over the previous fiscal year
COMPUSTAT
Board size The total number of board members (insiders and outsiders)
Capital IQ
Outsiders The percentage of non-executive directors on the board
Capital IQ
CEO/Chairman Indicates the CEO being Chairman of the Board Capital IQ Managerial power Managerial power tracks the GIM (2003) index for
the 11 governance provisions that are available pre and post 2006 (Blank check preferred stock, Classified board, Limit ability to call special meeting, Limit ability to act by written consent, Limit ability to amend bylaws, Limit ability to amend charter, Cumulative voting, Unequal voting rights, Fair price, Poison pill, Golden parachute), higher levels correspond to more managerial power
Riskmetrics

41
Appendix B: Examples of individuals in our sample
Below we list three examples of directors in our sample. The examples are stratified from all sample individuals in the highest 5 percent by average total compensation per year received for directorship services, to demonstrate the coverage and variation in our variables that capture compensation, personal characteristics, experience and qualifications. Albert Arnold Gore, Jr., serves on one S&P 1,500 board, Apple Inc., during our sample period. His total compensation per year ranges from $360,000 to $1,300,000. He has an undergraduate degree from Harvard University, but no graduate degree and no MBA. Because of his undergraduate degree he has an Ivy League connection. He does not hold a CPA qualification. He is not Chairman of the board of Apple. In 2007, when he enters our sample, he was 59 years old. He is a member of the compensation committee and chairman of the nominating/governance committee of Apple. He is a non-gray independent director. He has military experience from serving with the U.S. Army during the Vietnam War. He has political experience from multiple roles, including as a Senator and as Vice President during the Clinton Administration. He does not have legal, consulting or academic experience (we ignore visiting positions at academic institutions). He has finance experience from being a partner at Kleiner, Perkins, Caufield & Byers, a venture capital firm. He does not have executive experience in S&P 1,500 firms and there is no member of his family on the board of Apple. His social network of outside board members includes up to 6 directors.
William W. George serves on two S&P 1,500 boards, Exxon Mobil Corp. and The Goldman Sachs Group, Inc., during our sample period. His total compensation per year ranges from $330,000 to 1,070,000. He has an undergraduate degree from Georgia Institute of Technology and a graduate degree (an MBA) from Harvard University. Because of his MBA degree and because of his academic experience (discussed further down) he has an Ivy League connection. He does not hold a CPA qualification. He is not Chairman of the board at Exxon or Godman. In 2006, when he enters our sample, he was 63 years old. He is a member of the auditing committee of Goldman Sachs, a member of the compensation committee of Goldman Sachs and chairman of the compensation committee of Exxon Mobil, and member of other board committees of Goldman Sachs and Exxon Mobil (finance and executive committees). He is a non-gray independent director of Exxon Mobil. From 2007 onwards he is an independent director, and from 2009 onwards a gray director of Goldman Sachs. He has military experience from working in the U.S. Department of Defense. He does not have political, legal or consulting experience. He has academic experience from full-time employment at multiple higher education institutions, including Harvard Business School. He does not have executive experience in S&P 1,500 firms and there is no member of his family on the boards of Exxon Mobil or Goldman Sachs. His social network of outside board members includes up to 21 directors.
John M. Deutch serves on several S&P 1,500 boards during our sample period, Schlumberger Limited, Raytheon Co., Cummins Inc., and Citigroup, Inc.. His total compensation per year ranges from $240,000 to $1,030,000. He has an undergraduate degree and a graduate degree, both from MIT, but no MBA. He does not have a connection to an Ivy League institution and does not hold a CPA qualification. He is not chairman of the board in any of the sample firms. In 2006, when he enters our sample, he was 67 years old. He is a member of the audit committee in Citigroup and chair of that committee in 2009, he is a compensation committee member in Raytheon, nominating/governance committee member in Raytheon, Citigroup, and chairs that committee in Raytheon, and member of other committees in Cummins and Citigroup (executive and risk committees). He is a gray director in Raytheon and a non-gray independent director in all other firms. He has no military experience (we do not consider experience with the CIA, of which Mr. Deutch was Director from 1995-1996, as military experience). He has no political experience and no legal or consulting experience. He has academic experience from full-time employment at MIT and from a Ph.D. degree. He has finance experience from being a director of Citigroup Inc and predecessors of the firm. He does not have executive experience in S&P 1,500 firms and there is no member of his family on the boards of Schlumberger, Raytheon, Cummins or Citigroup. His social network of outside board members includes up to 44 directors.