the determinants of capital structure among smes in...
TRANSCRIPT
Proceedings International Conference of Technology Management, Business and Entrepreneurship 2012
(ICTMBE2012),
Renaissance Hotel, Melaka, Malaysia 18-19 Dec 2012
132
THE DETERMINANTS OF CAPITAL STRUCTURE AMONG
SMES IN MALAYSIA
Shafie Mohamed Zabri
Faculty of Technology Management and Business
Universiti Tun Hussein Onn Malaysia
86400 Parit Raja Batu Pahat Johor
Malaysia
ABSTRACT
At present there is limited number of studies into capital structure among small and medium sized
enterprises (SMEs). Most theoretical and empirical studies of this topic are focused on large corporations.
However, increasing importance of economic contributions of SMEs around the world, particularly in
developing countries necessitates better understanding of capital structure decisions among SMEs. This
research investigates the determinants of capital structure among SMEs in Malaysia, among SMEs within
the list of Enterprise 50 award winners from 1998 to 2010. Electronic surveys were conducted with a
response rate of 29.5%. Result shows that the average debt-to-equity ratio among these SMEs is 57 to 43.
Factors determining firm’s capital structure are investigated through selected firm’s characteristic which
focuses on the possible association between these characteristics with firm’s capital structure. Overall,
three out of seven selected firm’s characteristics were found to have statistically significant relationship
with firm’s capital structure, and all these three variables were also found to have an ability in explaining
variations in the firm’s capital structure. Bivariate and multiple regression analysis revealed that non-debt
tax shields, tangibility of assets and firm’s level of liquidity to have a statistically significant relationship
with (and an ability to explains) firm’s capital structure. This research enhances the existing body of
knowledge of financial practices of SMEs, particularly within the context Malaysian SMEs by providing
the information on determinants of firm’s capital structure.
Keywords: Capital Structure; SMEs, Malaysia
INTRODUCTION
SMEs are important to almost all economies in the world, but especially to those in developing countries.
SMEs in total constitute a large proportion of the economic activity and considered to be an engine of
growth in both developed and developing countries (Boocock and Shariff, 2005). In developing countries,
concern on the role of SMEs in the development process continues to be in the forefront of policy debates
(Cook, 2001) as they comprise a majority of the business population in most countries and therefore play
a crucial role in the economy (Mitchell and Reid, 2000). Mac an Bhaird (2010) added that the realization
of the significant economic contribution of SMEs has resulted in increased attention focused on the sector
from policy makers as well as academics. The economic potential of the SME sector makes SME
development as an important Government agenda. Their contribution is crucial and remains as an integral
part of economic development of the country. The role of SMEs in promoting endogenous sources of
Proceedings International Conference of Technology Management, Business and Entrepreneurship 2012
(ICTMBE2012),
Renaissance Hotel, Melaka, Malaysia 18-19 Dec 2012
133
growth and strengthening the infrastructure for enhanced economic expansion and development in
Malaysia has been acknowledged (Aris, 2007).
SMEs FINANCING
The role of finance has been viewed as a critical element for the development of SMEs (Cook, 2001). As
is widely recognized, lack of sufficient finance and access to credit are often cited as major handicaps to
the development of SMEs in many parts of the world (UNDP, 2007). In the case of Malaysia, SMEs
generally face difficulties in obtaining financing with lack of collateral, insufficient documents to support
loan application and lack of financial track record being the constraints faced by Malaysian SMEs in
accessing financing (Aris, 2007). Study by Ab. Wahab and Buyong (2008) on financing practices and
challenges among technology based SMEs in Malaysia revealed that 84.3% of respondent had
experienced difficulties in obtaining external financing. Within this figures, duration of loan offered was
too short, insufficient amount of finance and difficulty in providing collateral are among difficulties faced
by Malaysian SMEs.
The availability of financing for Malaysian SMEs is not an issue as the sources of finance seems
abundant, however the main issue is the accessibility and adequacy of those funds which were found to be
limited and fragmented (Abdullah and Ab. Manan, 2009). Accessibility to finance is a major factor
affecting the growth and success of SMEs (Hall, 2003). Consequently, adequate access to financing is
critical to enable SMEs to contribute to the economic development of the nation with initiatives have been
developed in addressing the financing gaps (BNM Annual Report, 2008). Given the importance of finance
and the existence of constraints related to the access to financing among Malaysian SMEs, it is crucial to
investigate the financial practices among SMEs to increase a better understanding of their financing
behavior. Another concern that motivated the investigation on the topic of financial practices among
SMEs particularly in Malaysia is the paucity of research into the topic of financing preferences and
capital structure among SMEs. General studies on SME financing were primarily conducted by related
institutions, either domestic or international, and focused mainly on the issues of provision of funds for
SMEs. Mac an Bhaird (2010) indicates that early studies investigating SME financing are predominantly
comprised government-sponsored surveys and reports which concentrating largely on potential
deficiencies and obstacles to the sustainability and development of the sector.
Existing literatures on Malaysian SMEs mainly captures development of SMEs in general (includes issue
and challenges faced by SMEs) while those which related to the financial practices of SMEs in Malaysia
are particularly focuses on financing issues, and sources and uses of funds employed throughout the
business (see Saleh and Ndubisi, 2006; Aris, 2007; Hassan, 2008; Hall, 2003; Rozali et al, 2006). The
topic of financing preferences and capital structure among SMEs in Malaysia are still understudied and
thus open up for an opportunity to gauge into this area which will enhance better understanding on this
topic, consequently. Cook (2001) point out that the theoretical insights into the fields of finance and
SMEs have largely been confined to studies undertaken in the US and the UK. Although considerable
amount is known about the characteristics and behavior of SMEs, this knowledge continues to be
imperfect and a large number of questions remain unanswered in relation to finance and SME
development in developing countries. He added that in developing countries, research on both the supply
and demand for finance among SMEs has been empirically based and pre-occupied with gathering
Proceedings International Conference of Technology Management, Business and Entrepreneurship 2012
(ICTMBE2012),
Renaissance Hotel, Melaka, Malaysia 18-19 Dec 2012
134
information on the characteristics of SMEs and lending institutions rather than on testing theoretical
proportions that would improve understanding of the relationship between finance and SMEs.
Cook (2001) point out some weaknesses and gaps in knowledge concerning the relation between finance
and SME development, and suggested the followings four elements of research into SME financing that
will contribute to a better understanding of the financing needs of SMEs and the ways to deliver financial
services to them:
1. The forms of finance used by SMEs and made available by lending institutions and investors.
2. The relation between different financial forms and firm-level performance.
3. The behavior of SMEs with different forms of finance.
4. Supply side of finance
This study incorporates two of his suggestions in contributing to a better understanding of SME financing
behaviors. Focuses are on the behavior of SMEs with different forms of finance and the forms of finance
used by SMEs. These two areas are studied by investigating the capital structure of SMEs which reflects
the forms of finance used by them. These investigations would also incorporated general theory on SME
financing and selective financial theory relates to firm’s capital structure.
Greater financial accessibility is believed to be achieved by enhancing the understanding of financial
practices among SMEs. This will ensure the correct measures were taken in strengthening the existing
infrastructure, and enabling a more effective channeling of funds to SMEs. In addition to that, it is also
hoped to improved provision of financial advisory support and enhancing awareness of financial products
and assistance programmes available to SMEs. Therefore, given the significant role of SMEs and the
existence of financing gaps as well as gaps in the literature, this research aims to investigate the financial
practices of SMEs in Malaysia particularly within the scope of financing preferences and capital structure.
These are believed will further enhance understanding of financial behavior and practices among SMEs in
Malaysia which in turn will provide better channeling of funds. The financing gaps would then be
reduced, and subsequently will increase the accessibility and adequacy of financing to the SMEs. Given
the existence of financing-related challenges faced among SMEs in general and in particular Malaysian
SMEs, there is an avenue for further studies on financial practices among SMEs in Malaysia to enhance
better understanding of their financial behavior. This is hoped to add to the existing knowledge on
financial practices among SMEs in general, and especially within the context of Malaysia.
FIRM’S CAPITAL STRUCTURE
The study of capital structure attempts to explain the mix of securities and financing sources used by
corporations to finance real investment. Most of the research on capital structure has focused on the
proportions of debt versus equity observed on the right-hand sides of corporations’ balance sheets (Myers,
2001). There is no consensus theory that explains a firm’s capital structure but, finance theory offers two
broad competing models: trade-off theory and pecking order theory (Tong and Green, 2005) and these
theories appear to have the most support (Seifert and Gonenc, 2008). Theories of optimal capital structure
differ in their relatives emphases on certain factors. The trade-off theory emphasizes taxes, the pecking
order theory emphasizes differences in information, and the free cash flow theory emphasizes agency
costs (Myers, 2001). Empirically, distinguishing between these hypotheses has proven difficult (Booth,
Proceedings International Conference of Technology Management, Business and Entrepreneurship 2012
(ICTMBE2012),
Renaissance Hotel, Melaka, Malaysia 18-19 Dec 2012
135
Aivazian et al., 2001; Tong and Green, 2005). In cross-sectional tests, variables that describe one theory
can be classified as others and vice versa (Booth, Aivazian et al. 2001). Trade-off did better in one case
(large equity issues of low-leverage firms) and pecking order in the other (the negative impact of
profitability on leverage) (Tong and Green, 2005).
In Trade-off Theory (TOT, hereafter), firms seek debt levels that balance the tax advantages of additional
debt against the costs of possible financial distress (Myers, 2001). Optimal capital structure is achieved by
balancing the benefits of debt (tax and reduction of free cash flow problems) with the costs of debt
(bankruptcy and agency costs between stockholders and bondholders) (Seifert and Gonenc (2008). Firm is
viewed as setting a target debt-to-equity ratio and gradually moving towards it. This implies that some
form of optimal capital structure exists that can maximize the firm value while simultaneously
minimizing external claims to the cash flow stream. Such claims include taxes, bankruptcy costs, and
agency costs (Kjellman and Hansen, 1995). A value-maximizing firm will pursue an optimal capital
structure by considering the marginal costs and benefits of each additional unit of financing, and then
choosing the form of financing that equates these marginal costs and benefits. Benefits of debt include its
tax advantage and the reduced agency costs of free cash flow; costs include the increased risk of financial
distress and increased monitoring and contracting costs associated with higher debt levels (Tong and
Green, 2005). Applicability of the trade-off theory to the SME has been the focus of a number of studies
as the debt tax shield is as relevant for SME as it is for publicly quoted firms (Mac an Bhaird, 2010).
The pecking order theory or hypothesis of capital structure (POH, hereafter), is among the most
influential theories of corporate leverage (Frank and Goyal, 2003). It contrasts the static trade-off theory
with a competing popular story based on a financing pecking order. Firms are said to prefer internal to
external financing and debt to equity if it issues securities. In the pure pecking order theory, the firm has
no well-defined target debt-to-value ratio (Myers, 1984).The pecking order hypothesis describes a
hierarchy of financial choices firms make. According to the pecking order hypothesis, internally
generated financing is preferred first, followed by debt (safe and then risky), and lastly outside equity
(Seifert and Gonenc, 2008). The firm will borrow, rather that issuing equity, when internal cash flow is
not sufficient to fund capital expenditures. Thus the amount of debt will reflect the firm’s cumulative
need for external funds (Myers, 2001).
A fundamental issue in corporate finance involves understanding how firms choose their capital structure
(Seifert and Gonenc, 2008) and what determines the optimal capital structure is still an ongoing and
complex matter (Esparanca, Gama et al. 2003). Researchers are still puzzled by how firms choose the
debt, equity or hybrid securities they issue (Kjellman and Hansen, 1995). Theories of capital structure
suggest how some of the factors might be correlated with leverage (Rajan and Zingales, 1995). There
have been many empirical studies attempting to test the explanatory power of capital structure models on
corporate behavior in developed countries, particular in a U.S. setting. Most of the work has been to
identify the determinants of capital structure. The main determinants of capital structure tested include
profitability, size, growth opportunity, asset structure, costs of financial distress, and tax shields effects
(Chen, 2004). In the case of capital structure, however, the set of features one must include in such a
general model is so large and complicated that the resulting structure would not yield clear insights.
Based on theoretical capital structure studies, firm’s capital structure emerges from three sources: firm
specific, country institutional and macroeconomic factors. There is empirical evidence for the importance
of all three—firm, institutional, and macroeconomic—factors in determining firm capital structure.
Proceedings International Conference of Technology Management, Business and Entrepreneurship 2012
(ICTMBE2012),
Renaissance Hotel, Melaka, Malaysia 18-19 Dec 2012
136
However, there is still a lack of studies spanning a large number of countries and different firm types
simultaneously (Joeveer, 2005).
Previous studies among large firms’ shows some factors that seem to have influences on capital structure
decisions among them. This particular study incorporates those factors namely profitability, firm’s size,
asset tangibility, firm’s growth, firm’s age, non-debt tax shields and liquidity. Reviews on these studies
are used to support the decision on selecting those factors to be tested in this study. Analysis of factors
used in investigating into capital structure decisions among SMEs shows that factors selected in this study
were among the factors that mostly included in the previous studies concerning the determinants of
capital structure among SMEs. Interestingly, firm’s size was included in all selected studies. This might
be an important factor in differentiating financial practices among SMEs as most definitions of SME
divided SME into different groups such as micro, small and medium enterprises. The next factor that
usually included when studying the determinants of capital structure among SMEs is firm’s growth.
Profitability and asset tangibility or structure were included in thirteen studies while firm’s age, non-debt
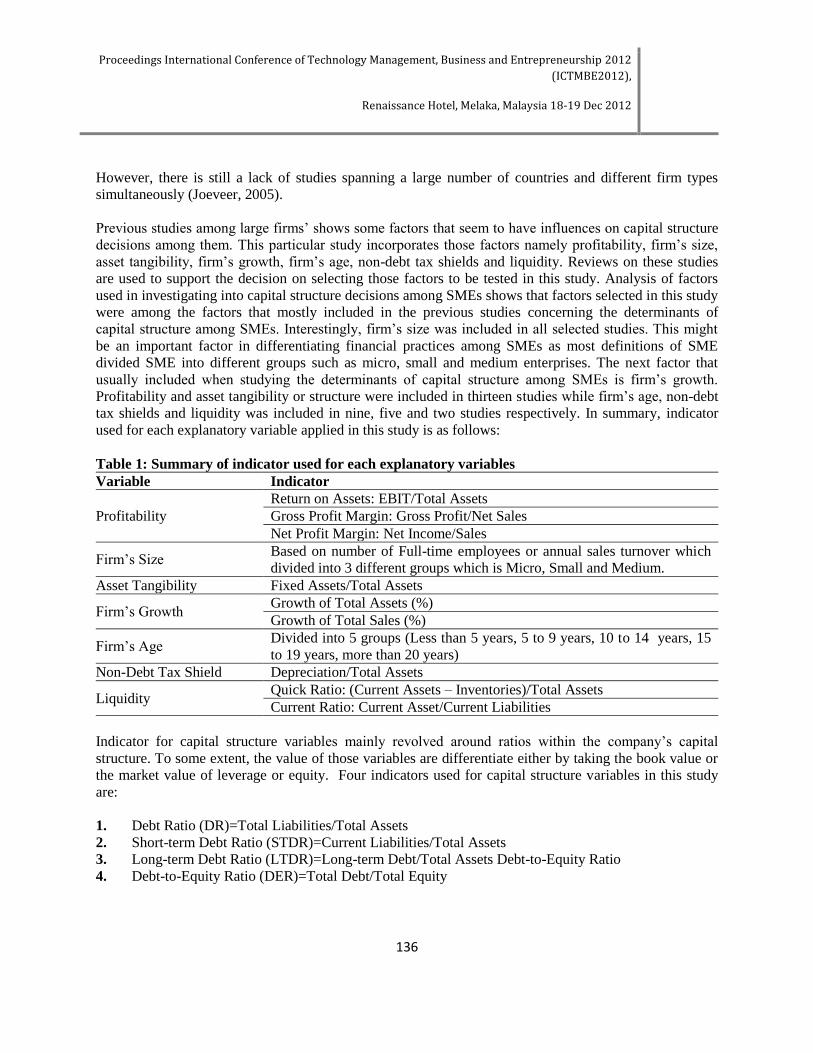
tax shields and liquidity was included in nine, five and two studies respectively. In summary, indicator
used for each explanatory variable applied in this study is as follows:
Table 1: Summary of indicator used for each explanatory variables
Variable Indicator
Profitability
Return on Assets: EBIT/Total Assets
Gross Profit Margin: Gross Profit/Net Sales
Net Profit Margin: Net Income/Sales
Firm’s Size Based on number of Full-time employees or annual sales turnover which
divided into 3 different groups which is Micro, Small and Medium.
Asset Tangibility Fixed Assets/Total Assets
Firm’s Growth Growth of Total Assets (%)
Growth of Total Sales (%)
Firm’s Age Divided into 5 groups (Less than 5 years, 5 to 9 years, 10 to 14 years, 15
to 19 years, more than 20 years)
Non-Debt Tax Shield Depreciation/Total Assets
Liquidity Quick Ratio: (Current Assets – Inventories)/Total Assets
Current Ratio: Current Asset/Current Liabilities
Indicator for capital structure variables mainly revolved around ratios within the company’s capital
structure. To some extent, the value of those variables are differentiate either by taking the book value or
the market value of leverage or equity. Four indicators used for capital structure variables in this study
are:
1. Debt Ratio (DR)=Total Liabilities/Total Assets
2. Short-term Debt Ratio (STDR)=Current Liabilities/Total Assets
3. Long-term Debt Ratio (LTDR)=Long-term Debt/Total Assets Debt-to-Equity Ratio
4. Debt-to-Equity Ratio (DER)=Total Debt/Total Equity
Proceedings International Conference of Technology Management, Business and Entrepreneurship 2012
(ICTMBE2012),
Renaissance Hotel, Melaka, Malaysia 18-19 Dec 2012
137
In conclusion, firm’s capital structure was studied through selected firm’s characteristics. These would
enable clear views on the associations and influences between these characteristics with firm’s capital
structure.
RESEARCH METHODOLOGY
Research objectives
Desired outcome need to be reflected when stating research objectives. It is viewed as the starting point of
rigorous research in that they demonstrate the potential legitimacy of the research project in far stronger
terms than a statement of the research idea (Hair, 2007). The objectives of this study are:
1. To investigate the capital structure among SMEs in Malaysia,
2. To determine if there are any significant associations between selected firm characteristics with the
firm’s capital structure among SMEs in Malaysia, and
3. To determine factors affecting firm’s capital structure among SMEs in Malaysia.
These specific objectives are accomplished through gathering of specific data among chosen sample of
Enterprise 50 award winners to gauge the issue of choice of capital structure, and factors influencing their
decisions on their firm’s capital structure.
Data collection, response rate and analysis
Accomplishing of the research objectives was dependent on the reliable analysis of responses received
from a large number of respondents. Therefore, survey research was considered to be the suitable and
appropriate data collection method for achieving the objectives of this study. Availability of the internet
in recent years overcomes some drawbacks of traditional ways of postal surveys especially the one
relating to cost of postal questionnaire. For that reason, electronic survey was chose to be the appropriate
and reliable instrument in supporting the accomplishment of data collection process, not only for
increasing the response rates but also increasing a reliable analysis and findings of research objectives.
This method involves dissemination of self-administered electronic surveys through e-mail, the World
Wide Web, Interactive Voice Response and touch-tone data entry (Dillman, 2000). Web survey is chose
to be used in this study as this particular type of electronic survey have more refined appearance and have
a flexibility to provide survey capabilities far beyond the e-mail and paper surveys (Dillman, 2000; Hair
et al. 2007).
As questionnaire is the sole survey instrument to be used in this study, it was very clear that detailed and
careful planning should be undertaken to develop a reliable instrument. After considering the comments
and suggestions received from the pre-testing and pilot testing the first draft of the questionnaire, the final
version of the questionnaire was constructed involving four different parts and accessible via designated
link. The link for the final version of the questionnaire was sent via e-mail to the selected sample upon
satisfactory results of pilot testing. A list of Enterprise 50 winners from 1998 to 2010 were formed to
guides the overall process of data collection. SMEs listed on the list were classified based on alphabetical
Proceedings International Conference of Technology Management, Business and Entrepreneurship 2012
(ICTMBE2012),
Renaissance Hotel, Melaka, Malaysia 18-19 Dec 2012
138
orders and the distributions of e-mails were made on the basis of completing the list. Telephone contacts
were also made in the case where direct e-mail contact is not available mainly to get direct e-mail address
of designated person in charge which in turn hoped to increase the response rate. In the pilot study, the
overall contactable SMEs were 47 (out of 50 SMEs). Two SMEs refuse to participate and excluded in
determining the overall response rate of 28 % [13/ (50-3-2)]. This rate was deemed to be appropriate as
the average response rate for surveys among SMEs in Malaysia was 15.6%. As this study employ an e-
mail surveys, it was thought that this instrument was yet to be tested within Malaysian context especially
among SMEs and anticipated to open a new way of researching SMEs in Malaysia. The actual surveys
which took almost six month to complete resulting in a total of 120 responses received. This figure is
used to determining the response rate received for this survey. A total of 423 SMEs were contactable and
out of this, 17 of them were not interested and refused to participate. After all these were taken into
consideration, the overall response rate for this study was determined as follows:
Response rate = [120/ (444-21-17)] = 29.5%
Upon satisfactory of responses received data analyses were performed on the basis of 120 responses.
Descriptive, bivariate and multivariate analyses were involved to accommodate different functions mainly
to achieve the research objectives. Parametric and non-parametric analyses were used based on the type of
data collected. All parametric assumptions was fulfilled and justified before the parametric analyses were
used. The following section will discusses the results of these analyses.
RESULTS
SMEs capital structure
Focus on the studies of firm’s capital structure was motivated by an objective to increase an
understanding on firm’s capital structure used by SMEs in Malaysia within the chosen sample and issues
related to it. Descriptive results indicate that generally SMEs depends more on debt over equity-sources
of financing. This is proven by the descriptive results which shows that overall Debt-to-Equity ratio
(DER) was found to be approximately 57 to 43. This figure proves that firms mainly seek for external
debt-sources of financing over internal funds. Proportion of debt financing also found to be equally
divided into short and long-term debt financing which shows that firms generally use both types of debts
in financing their business activity.
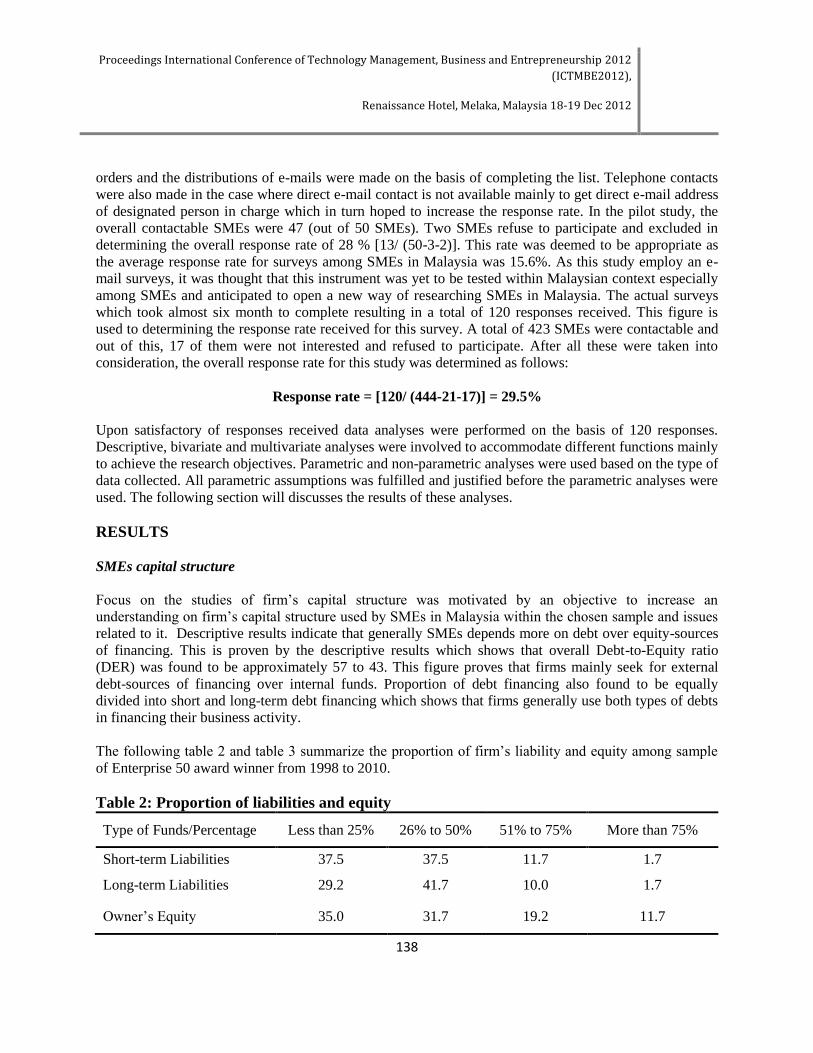
The following table 2 and table 3 summarize the proportion of firm’s liability and equity among sample
of Enterprise 50 award winner from 1998 to 2010.
Table 2: Proportion of liabilities and equity
Type of Funds/Percentage Less than 25% 26% to 50% 51% to 75% More than 75%
Short-term Liabilities 37.5 37.5 11.7 1.7
Long-term Liabilities 29.2 41.7 10.0 1.7
Owner’s Equity 35.0 31.7 19.2 11.7
Proceedings International Conference of Technology Management, Business and Entrepreneurship 2012
(ICTMBE2012),
Renaissance Hotel, Melaka, Malaysia 18-19 Dec 2012
139
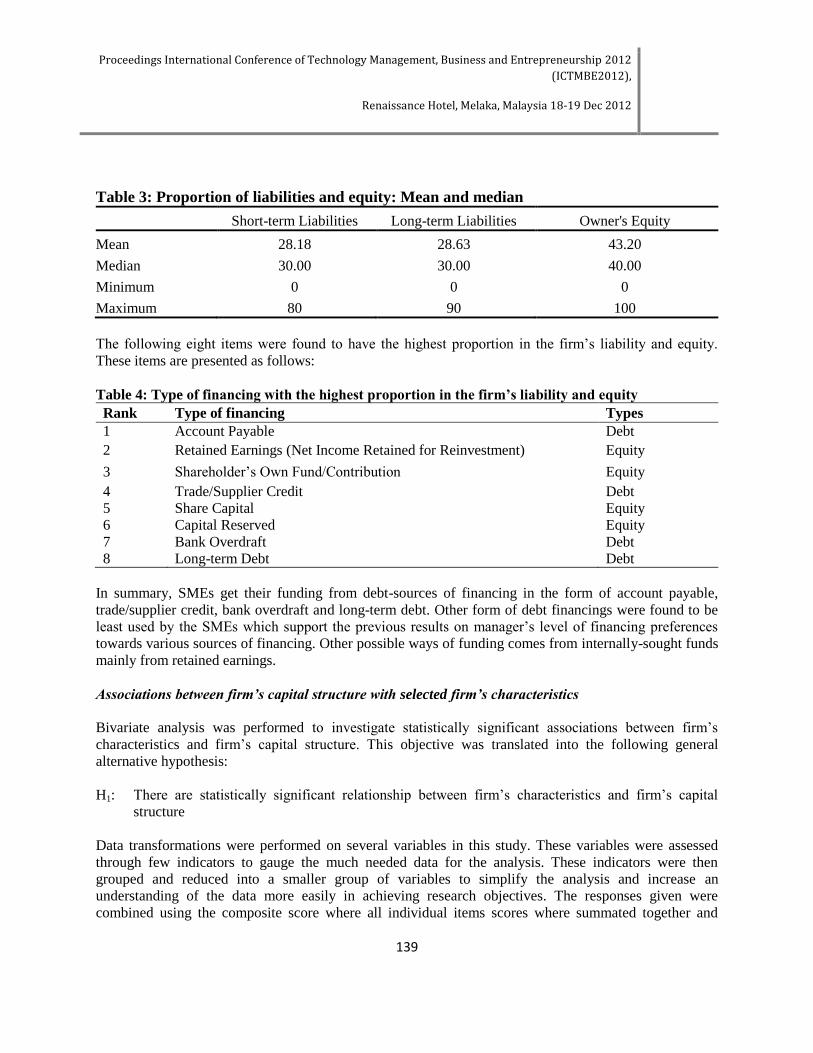
Table 3: Proportion of liabilities and equity: Mean and median
Short-term Liabilities Long-term Liabilities Owner's Equity
Mean 28.18 28.63 43.20
Median 30.00 30.00 40.00
Minimum 0 0 0
Maximum 80 90 100
The following eight items were found to have the highest proportion in the firm’s liability and equity.
These items are presented as follows:
Table 4: Type of financing with the highest proportion in the firm’s liability and equity
Rank Type of financing Types
1 Account Payable Debt
2 Retained Earnings (Net Income Retained for Reinvestment) Equity
3 Shareholder’s Own Fund/Contribution Equity
4 Trade/Supplier Credit Debt
5 Share Capital Equity
6 Capital Reserved Equity
7 Bank Overdraft Debt
8 Long-term Debt Debt
In summary, SMEs get their funding from debt-sources of financing in the form of account payable,
trade/supplier credit, bank overdraft and long-term debt. Other form of debt financings were found to be
least used by the SMEs which support the previous results on manager’s level of financing preferences
towards various sources of financing. Other possible ways of funding comes from internally-sought funds
mainly from retained earnings.
Associations between firm’s capital structure with selected firm’s characteristics
Bivariate analysis was performed to investigate statistically significant associations between firm’s
characteristics and firm’s capital structure. This objective was translated into the following general
alternative hypothesis:
H1: There are statistically significant relationship between firm’s characteristics and firm’s capital
structure
Data transformations were performed on several variables in this study. These variables were assessed
through few indicators to gauge the much needed data for the analysis. These indicators were then
grouped and reduced into a smaller group of variables to simplify the analysis and increase an
understanding of the data more easily in achieving research objectives. The responses given were
combined using the composite score where all individual items scores where summated together and
Proceedings International Conference of Technology Management, Business and Entrepreneurship 2012
(ICTMBE2012),
Renaissance Hotel, Melaka, Malaysia 18-19 Dec 2012
140
aggregated for hypotheses testing. The data transformations were used on creating summated scores for
the proportions of firm’s capital structure which includes Short-term Financing (STF), Long-term
Financing (LTF) and Equity Financing (EF), and average changes on firm’s characteristics-variables
involving three different variables: Liquidity (LIQ), Profitability (PROF) and firm’s growth (GROWTH).
Determination of the analysis for hypothesis testing generally involves two broad classes of inferential
statistical significance tests: parametric and nonparametric test (Cooper and Emory, 1995; Saunders et al.,
2009; Collis and Hussey, 2009). The former tests were used with continuous data which make certain
assumptions about the distributional characteristics of the population under investigation whilst the latter
are designed to be used when data are not normally distributed and often used with categorical data.
Hence, in order to determine whether the bivariate association test for this study fall under parametric or
non-parametric, the type of data used are analyzed, and type of tests to be applied are then determined.
Table 5: Type of bivariate tests
Area of study DV IV Bivariate test of association
Determinants of
firm’s capital
structure
DR,
STDR,
LTDR,
DER
LIQ, PROF, TANG, NDTS, GROWTH Pearson’s correlation
Firm’s Age Spearman's correlation
Firm’s Size Biserial correlation
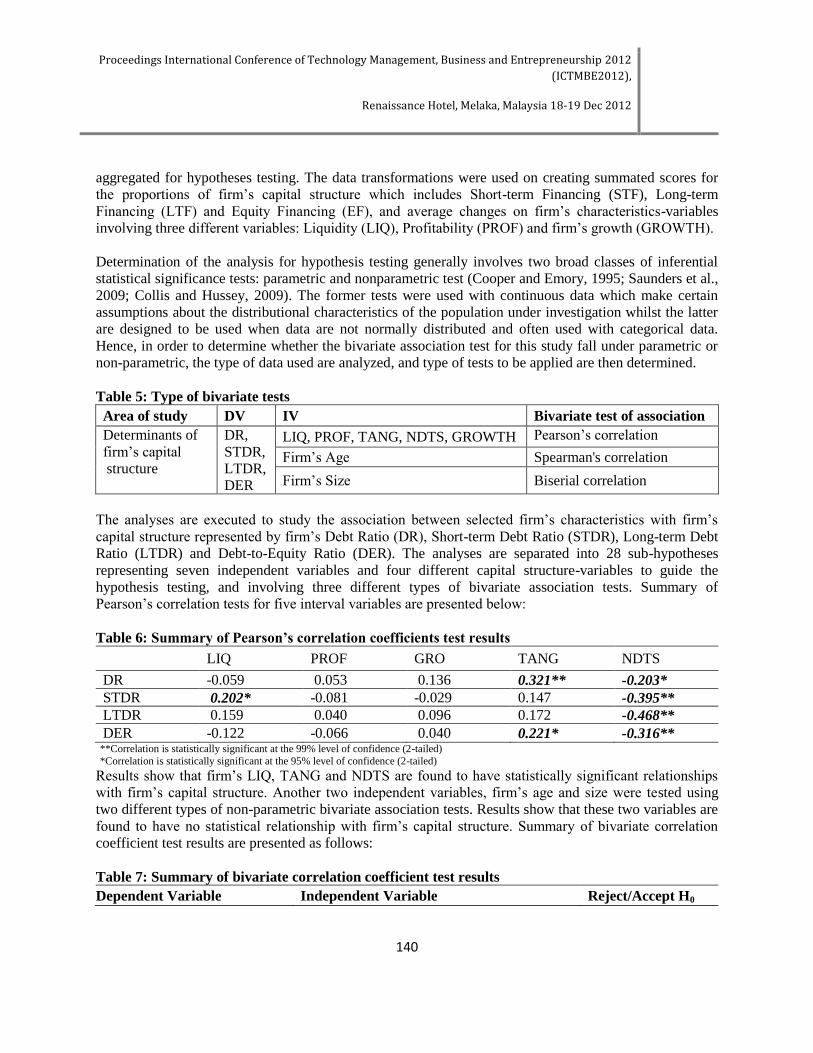
The analyses are executed to study the association between selected firm’s characteristics with firm’s
capital structure represented by firm’s Debt Ratio (DR), Short-term Debt Ratio (STDR), Long-term Debt
Ratio (LTDR) and Debt-to-Equity Ratio (DER). The analyses are separated into 28 sub-hypotheses
representing seven independent variables and four different capital structure-variables to guide the
hypothesis testing, and involving three different types of bivariate association tests. Summary of
Pearson’s correlation tests for five interval variables are presented below:
Table 6: Summary of Pearson’s correlation coefficients test results
LIQ PROF GRO TANG NDTS
DR -0.059 0.053 0.136 0.321** -0.203*
STDR 0.202* -0.081 -0.029 0.147 -0.395**
LTDR 0.159 0.040 0.096 0.172 -0.468**
DER -0.122 -0.066 0.040 0.221* -0.316** **Correlation is statistically significant at the 99% level of confidence (2-tailed)
*Correlation is statistically significant at the 95% level of confidence (2-tailed) Results show that firm’s LIQ, TANG and NDTS are found to have statistically significant relationships
with firm’s capital structure. Another two independent variables, firm’s age and size were tested using
two different types of non-parametric bivariate association tests. Results show that these two variables are
found to have no statistical relationship with firm’s capital structure. Summary of bivariate correlation
coefficient test results are presented as follows:
Table 7: Summary of bivariate correlation coefficient test results
Dependent Variable Independent Variable Reject/Accept H0
Proceedings International Conference of Technology Management, Business and Entrepreneurship 2012
(ICTMBE2012),
Renaissance Hotel, Melaka, Malaysia 18-19 Dec 2012
141
Debt Ratio (DR)
LIQ(H3-1), PROF(H3-5), GROWTH(H3-13),
SIZE(H3-25), AGE(H3-21) Accept H0
TANG (H3-9), NDTS (H3-17) Reject H0
Short-term Debt Ratio (STDR)
PROF(H3-6), GROWTH(H3-14), SIZE (H3-26),
AGE (H3-22), TANG (H3-10) Accept H0
LIQ (H3-2), NDTS(H3-18) Reject H0
Long-term Debt Ratio (LTDR)
LIQ (H3-3), PROF(H3-7), GROWTH(H3-15),
SIZE(H3-27), AGE(H3-23), TANG (H3-11) Accept H0
NDTS (H3-19) Reject H0
Debt-to-Equity Ratio (DER)
LIQ (H3-4), PROF (H3-8), GROWTH (H3-16),
SIZE (H3-1), AGE(H3-28) Accept H0
TANG (H3-12), NDTS (H3-20) Reject H0
In summary, NDTS was the only variable that has a statistically significant relationship with firm’s
capital structure. Firm’s profitability, growth, age and size are found to not have any relationships with
firm’s capital structure. Tangibility on the other hand, has statistically significant relationships only with
firm’s DR and DER, while liquidity is found to have a statistically significant relationship with firm’s
STDR.
Determinants of SME’s Capital Structure
Multiple regression analysis was performed to establish models predicting the capital structure among
SMEs within the samples of Enterprise 50 winners. Four different capital structure ratios were used to
represent the capital structure of SMEs namely DR, STDR, LTDR and DER. Seven firm’s characteristics
were chose and tested whether they have the ability in predicting the firm’s capital structure. Predictor
variables were arranged primarily based on the results of bivariate correlation analysis presented in the
previous chapter. NDTS was found to be significantly correlated with all outcome variables, while TANG
and LIQ was found to be significantly correlated with DR and DER, and STDR, respectively. Out of
seven predictor variables, one predictor (AGE) involves the use of dummy variables as this predictor was
measured on categorical scale with more than two categories. Four dummy variables were created to
represent five different categories of firm’s age. Regression analysis involves two stages of analysis
where hierarchical and forced entry regression method are used in the first stage, and forward stepwise is
used in the second stage.
Regression model is developed as follows:
CS= α + β1NDTSi + β2TANGi + β3LIQi + β4PROFi + β5GROi + β6SIZEi + β6AGEi + ε
Where;
CS= Firm’s capital structure (DR, STDR, LTDR, DER)
α= Model’s intercept
Proceedings International Conference of Technology Management, Business and Entrepreneurship 2012
(ICTMBE2012),
Renaissance Hotel, Melaka, Malaysia 18-19 Dec 2012
142
Β1-7= Regression coefficients associated with variable 1 to 7
NDTS= Non-Debt Tax Shields
TANG= Firm’s assets structure (tangibility)
LIQ= Firm’s liquidity
PROF= Firm’s profitability
GRO= Firm’s growth
SIZE= Firm’s Size
AGE= Firm’s age
ε=Residual term
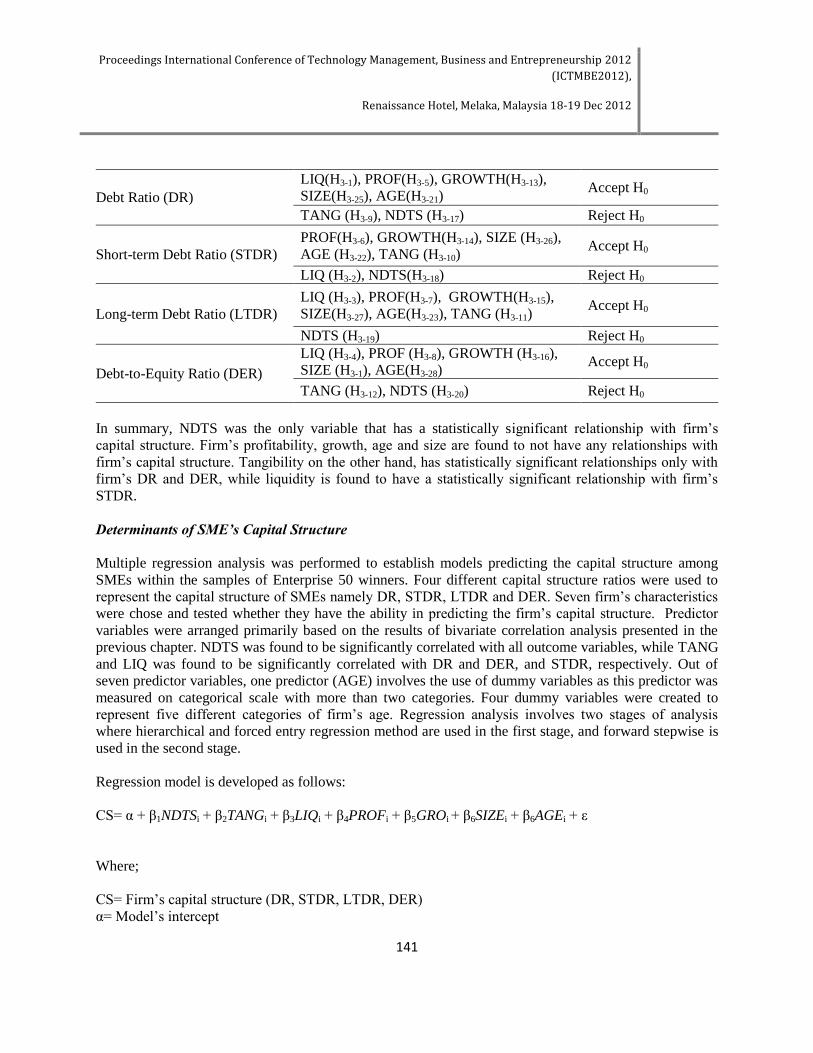
The following tables summarize the results of regression test performed in determining factors affecting
SMEs’ capital structure.
Table 8: Summary of linear regression analysis test results with firm’s capital structure
A. Summary of linear regression analysis test results for determinants of firm’s DR
Model Summaryb
Model R
R
Square
Adjusted R
Square
Std. Error of
the Estimate
Change Statistics
Durbin-
Watson
R Square
Change
F
Change df1 df2
Sig. F
Change
1 .321a .103 .095 .839 .103 13.517 1 118 .000 1.373
Coefficientsa
Model
Unstandardized Coefficients Standardized Coefficients
t Sig. B Std. Error Beta
1 (Constant) 2.246 .283 7.925 .000
TANG .317 .086 .321 3.677 .000
a. Predictors: (Constant), TANG
b. Dependent Variable: Debt Ratio: Total Liabilities/Total Assets
B. Summary of linear regression analysis test results for determinants of firm’s STDR
Model Summaryb
Model R
R
Square
Adjusted R
Square
Std. Error of
the Estimate
Change Statistics
Durbin-
Watson
R Square
Change
F
Change df1 df2
Sig. F
Change
1 .395a .156 .149 .797 .156 21.875 1 118 .000 1.813
Coefficientsa
Model
Unstandardized Coefficients Standardized Coefficients
t Sig. B Std. Error Beta
1 (Constant) 4.326 .298 14.525 .000
NDTS -.449 .096 -.395 -4.677 .000
a. Predictors: (Constant), NDTS
Proceedings International Conference of Technology Management, Business and Entrepreneurship 2012
(ICTMBE2012),
Renaissance Hotel, Melaka, Malaysia 18-19 Dec 2012
143
A. Summary of linear regression analysis test results for determinants of firm’s DR
Model Summaryb
Model R
R
Square
Adjusted R
Square
Std. Error of
the Estimate
Change Statistics
Durbin-
Watson
R Square
Change
F
Change df1 df2
Sig. F
Change
1 .321a .103 .095 .839 .103 13.517 1 118 .000 1.373
Coefficientsa
Model
Unstandardized Coefficients Standardized Coefficients
t Sig. B Std. Error Beta
1 (Constant) 2.246 .283 7.925 .000
TANG .317 .086 .321 3.677 .000
b. Dependent Variable: Short-term Debt Ratio: Current Liabilities/Total Assets
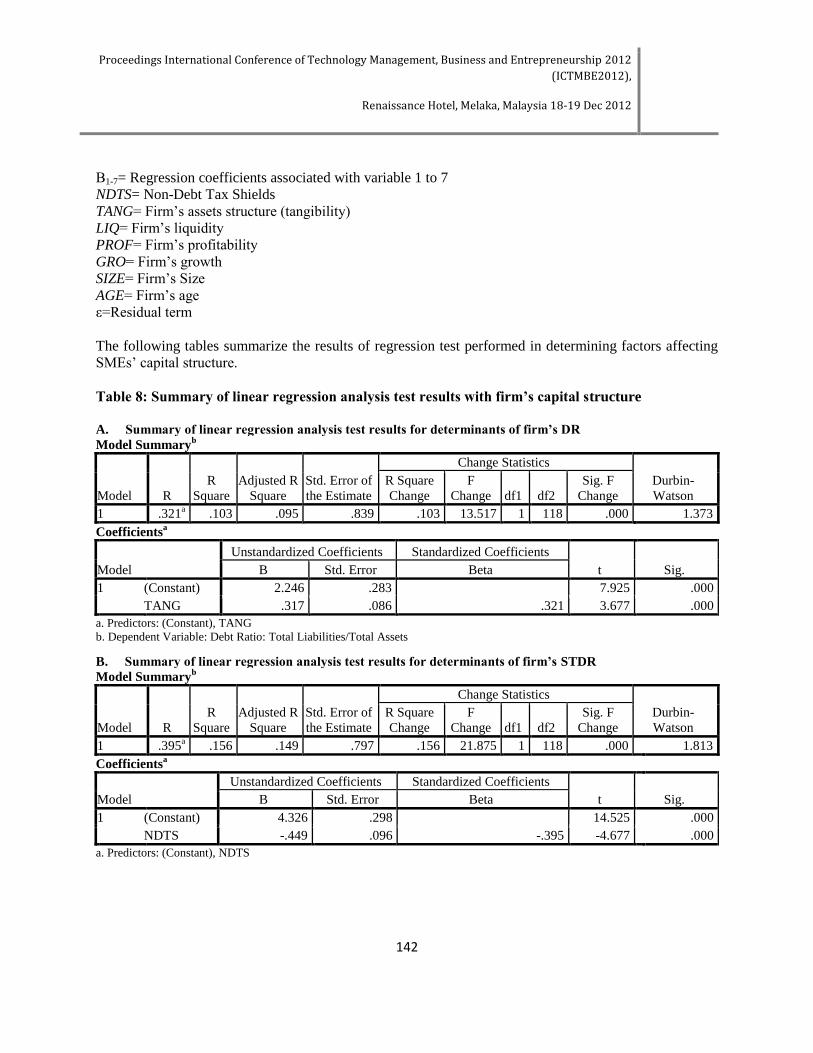
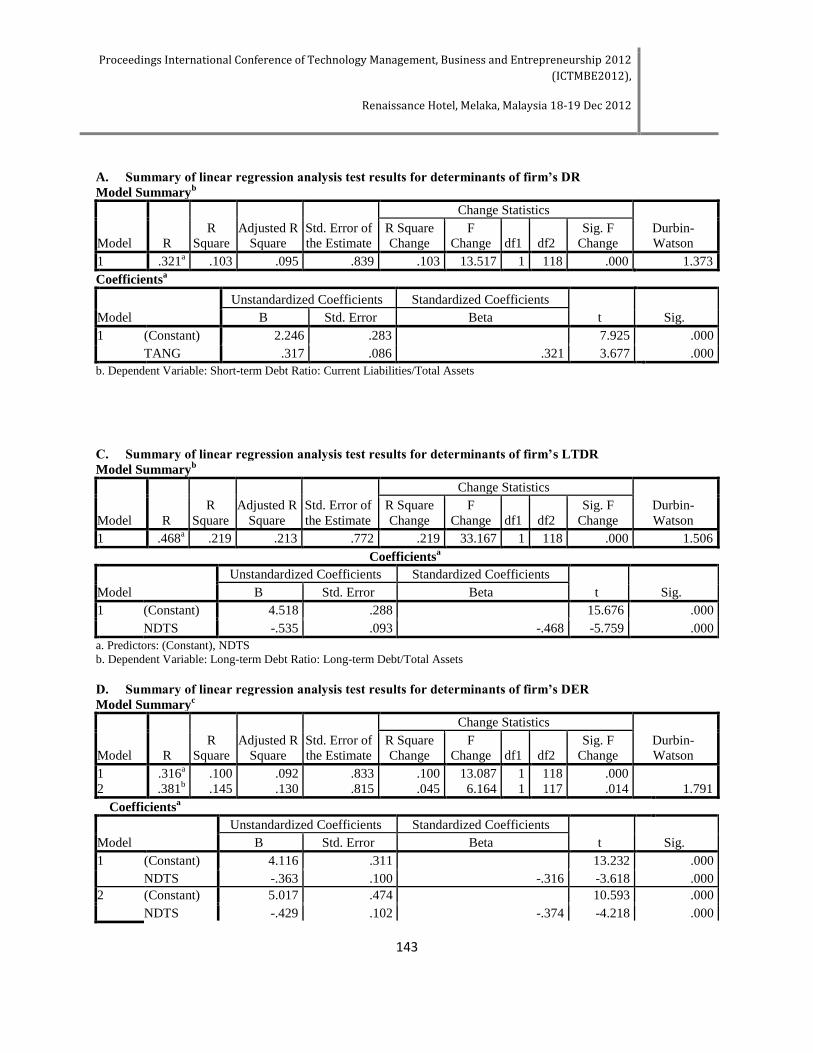
C. Summary of linear regression analysis test results for determinants of firm’s LTDR
Model Summaryb
Model R
R
Square
Adjusted R
Square
Std. Error of
the Estimate
Change Statistics
Durbin-
Watson
R Square
Change
F
Change df1 df2
Sig. F
Change
1 .468a .219 .213 .772 .219 33.167 1 118 .000 1.506
Coefficientsa
Model
Unstandardized Coefficients Standardized Coefficients
t Sig. B Std. Error Beta
1 (Constant) 4.518 .288 15.676 .000
NDTS -.535 .093 -.468 -5.759 .000
a. Predictors: (Constant), NDTS
b. Dependent Variable: Long-term Debt Ratio: Long-term Debt/Total Assets
D. Summary of linear regression analysis test results for determinants of firm’s DER
Model Summaryc
Model R
R
Square
Adjusted R
Square
Std. Error of
the Estimate
Change Statistics
Durbin-
Watson
R Square
Change
F
Change df1 df2
Sig. F
Change
1 .316a .100 .092 .833 .100 13.087 1 118 .000
2 .381b .145 .130 .815 .045 6.164 1 117 .014 1.791
Coefficientsa
Model
Unstandardized Coefficients Standardized Coefficients
t Sig. B Std. Error Beta
1 (Constant) 4.116 .311 13.232 .000
NDTS -.363 .100 -.316 -3.618 .000
2 (Constant) 5.017 .474 10.593 .000
NDTS -.429 .102 -.374 -4.218 .000

Proceedings International Conference of Technology Management, Business and Entrepreneurship 2012
(ICTMBE2012),
Renaissance Hotel, Melaka, Malaysia 18-19 Dec 2012
144
LIQ -.222 .089 -.220 -2.483 .014
a. Predictors: (Constant), NDTS
b. Predictors: (Constant), NDTS, LIQ
c. Dependent Variable: Debt-to-Equity Ratio: Total Debt/Total Equity
Within the context of firm’s capital structure, three predictor variables were found to be statistically
significant. These predictors are TANG, NDTS and LIQ. Other predictors are found to be not significant
and do not have any effects on firm’s capital structure.
Firm’s DR is the first outcome variable under studies. Out of seven selected predictors, only one predictor
is found to be statistically significant in predicting firm’s DR. TANG is found to have a statistically
significant positive relationship with the outcome variable. Where there is an increase in firm’s level of
asset tangibility, firm’s DR also increase. This tells that the availability of tangible assets, which
commonly associated with the ability of firm in providing collateral for debt funding, will eventually
increase the use of debt financing (preferably long-term financing). The availability of tangible assets
would support debt financing needed by the firm. In the case of SMEs, fund providers are believed to
require back-up in the form of collateral to support the loan application. Availability of tangible asset
would ease the loan application made by SMEs.
NDTS is found to be statistically significant in predicting the remaining firm’s capital structure ratios. It
is also found that this particular predictor is negatively correlated with firm’s STDR, LTDR and DER.
These thus indicate that there will be a decrease in the firm’s use of debt when there is an increase in
NDTS. This results show that as firm is having an increase in the tax shield from other sources that debt,
they will eventually reduce the use of debt in financing their business. In this study, NDTS were
represented by the depreciation expenses over total assets. One of the motivations for the use of debt was
the tax shields effect which is the benefit of using debt. Interest paid or the costs of debt are tax-
deductible, which in turn would reduce the overall firm’s tax expenses. Firm is believed to try to
maximize the benefit of using debt for this particular motivation. However, within the sample used in this
study, results show that as firm is having an increase in the tax benefits from other sources than debt, they
would eventually reduce the use of debt in funding the business. Depreciation expenses are an example of
deductible expenses in determining firm operating income or EBIT. These expenses reduce the taxable
income for the firm and would eventually decrease the overall firm’s tax expenses.
Firm’s DER is also found to be significantly predicted by LIQ, in addition to the NDTS. Both predictors
were found to be negatively correlated in the model predicting firm’s DER. This shows that increases in
firm’s liquidity would reduce firm use of debt particularly on the short-term financing. Increases in firm’s
liquidity as measured by Quick and Current ratios indicate that firms would be able to use the liquid asset
in financing it funding requirement which will reduces their need for debt financing. These conditions
will eventually reduce the overall use of debt financing reflected by lower DER.
In summary, it can be concluded that firm’s capital structure is affected by firm level of asset tangibility,
non-debt tax shields and liquidity. Other factors (profitability, growth, firm’s age, firm’s size) are found
to be not statistically significant in predicting the firm’s capital structure.
CONCLUSION

Proceedings International Conference of Technology Management, Business and Entrepreneurship 2012
(ICTMBE2012),
Renaissance Hotel, Melaka, Malaysia 18-19 Dec 2012
145
SMEs play a very important role in a nation’s economy and become one aspect of the national agenda
where the government has embarked on the concerted effort to improve SME stages of business
development. Increased understanding on financial practices among Malaysian SMEs would create better
awareness on factors influencing their financing decisions. Better understanding of financial practices of
SMEs in Malaysia may assist policymakers in providing enhanced financing environment to the SMEs
which may focuses on accessible and adequacy of financing which will meet the demand side of SMEs,
with regards to the evidence on SMEs financing preferences and capital structure.
REFERENCE
Ab. Wahab, I. and Buyong, S. Z. (2008) “Financing Technology-Bases SMEs in Malaysia: Practices and
Problems”. Paper presented at 5th SMEs in a Global Economy Conference, August 2
nd- 3
rd, Senshu
University, Kandajimbocho, Tokyo, Japan.
Abdullah, M. A. and Ab. Manan, S. K. (2009) “Adequacy of Financial Facilities for Small-Medium
Businesses: Empirical Findings from Malaysia”, International Review of Business Research Papers
Volume 6. No.4, pp. 535 – 548.
Aris, N.M. (2007) “SMEs: Building Blocks for Economic Growth”, Journal of Department of Statistics,
Department of Statistic, Malaysia, Vol. 1.
Bank Negara Malaysia (2008) “ Annual Report 2008.
Boocock, G., & Shariff, M. N. M. (2005) “Measuring the Effectiveness of Credit Guarantee Schemes:
Evidence from Malaysia.” International Small Business Journal, Vol. 23 (4), pp 427-454
Booth, L. and Aivazian, V. (2001) “Capital Structures in Developing Countries”, The Journal of Finance,
Vol. 56, No. 1, pp. 87-130.
Chen, J. J. (2004). "Determinants of capital structure of Chinese-listed companies." Journal of Business
Research (Issue 57): pp. 1341-1351.
Collis, J. and Hussey, R. (2009) Business Research: A Practical Guide for Undergraduate and
Postgraduate Students, 3rd
edition, London, Palgrave Macmillan.
Cook, P. (2001) “Finance and Small and Medium-Sized Enterprise in Developing Countries”, Journal of
Developmental Entrepreneurship, Vol. 6, No. 1, pp. 17-40.
Cooper, D. R. and Emory, C. W. (1995) “Business Research Methods” 5th Ed, Irwin, U.S.A.
Dillman, D. A. (2000) Mail and Internet Surveys, 2nd
edition, New York, John Wiley & Sons, Inc.
Esparanca, J. P. and Gama, A. P. M. (2003) “Corporate debt policy of small firms: an empirical
(re)examination”, Journal of Small Business and Enterprise Development, Vol. 10, No. 1, pp. 62-80.
Frank, M. Z. and Goyal, V. K. (2003) “Testing the pecking order theory of capital structure”, Journal of
Financial Economics, Vol. 67, pp. 217-248.
Hair, J. F., Money, H. A., Samouel, P. and Page, M. (2007) “Research Methods for Business”, England:
John Wiley and Sons Ltd.
Hall, C. (2003). The SME policy framework in ASEAN and APEC: Benchmark comparisons and
analysis. A 16th Annual Conference of Small Enterprise Association ofAustralia and New Zealand
Hassan, Z. (2008). Entrepreneurship Development for competitive SMEs: A Malaysian comparative
analysis. UITM, Malaysia
Joeveer, K. (2005) “What Do We Know about the Capital Structure of Small Firms?” Working Paper
Series, Prague, Center for Economic Research and Graduate Education, Charles University, pp. 1-38.
Kjellman, A. and Hansen, S. (1995) “Determinants of Capital Structure: Theory vs. Practice”,
Scandinavian Journal of Management, Vol.11, No. 2, pp. 91-102.
Proceedings International Conference of Technology Management, Business and Entrepreneurship 2012
(ICTMBE2012),
Renaissance Hotel, Melaka, Malaysia 18-19 Dec 2012
146
Mac an Bhaird, C. (2010) “The Modigliani–Miller proposition after fifty years and its relation to
entrepreneurial finance”, Strategic Change, 19: 9–28.
Myers, S.C. (1984) “The Capital Structure Puzzle”, Journal of Finance, Vol. 39, pp. 575-592.
Mitchell, F. and Reid, G. (2000), “Problems, Challenges and Opportunities: Small Business as a Setting
for Management Accounting Research”, Management Accounting Research, 11 (4): pp. 385 – 390.
Myers, S. C. (2001) “Capital Structure”, Journal of Economic Perspectives, Vol. 15, No.2, pp. 81-102.
Norton, Edgar (1991). “Capital structure and small growth firms.” The Journal of Small Business Finance
1 (2), 161-177.
Rajan, R. G. and Zingales, L. (1995) “What Do We Know about the Capital Structure? Some Evidence
from International Data”, The Journal of Finance, Vol. 50, No. 5, pp. 1421-1460.
Rozali, M. B., Taib, H., Latiff, R. A. and Salim, M. (2006) “Small Firms’ Demand for Finance in
Malaysia”, Proceeding of International Conference on Business and Information (BAI) July 12-14,
2006, Pan Pacific Hotel, Singapore Volume 3, ISSN 1729-9322, 2006.
Saleh, A. S. and Ndubisi, N. O. (2006) “SME Development in Malaysia: Domestic and Global
Challenges”, Economics Working Paper Series, University of Wollongong.
Saleh, A. S. and Ndubisi, N. O. (2006) “An Evaluation of SME Development in Malaysia”, International
Review of Business Research Papers, Vol. 2, No. 1, pp. 1-14.
Saunders, M., Lewis, P., and Thornhill, A., (2009) “Research Methods for Business Students”, 5th Ed.,
England: Pearson.
Seifert, B. and Gonenc, H. (2008) “The international evidence on the pecking order hypothesis”. Journal
of Multinational Financial Management, Vol. 18, pp. 244-260.
Storey, D. J. (1994) “The role of legal status in influencing bank financing and new firm growth”,
Applied Economics, 26, 129-136.
Tong, G. and Green, J. (2005) “Pecking order or trade-off hypothesis? Evidence on the capital structure of
Chinese companies”, Applied Economics, Vol. 37, No. 19, pp. 2179-2189.
United Nations Development Programme (UNDP) (2007) “Malaysia Small and Medium Enterprises:
Building an Enabling Environment”.