the design processes of engineering educators: thick descriptions
TRANSCRIPT
The Design Processes of Engineering Educators:Thick Descriptions and Potential Implications
Cynthia J. Atman, Jennifer Turns, Monica E. Cardella and Robin S.Adams
The goal of this paper is to shed light on the design strategies of engineeringfaculty. While there already exists a large body of research in understanding thedesign processes of students and practicing engineers, less work has been doneto understand the design processes of engineering educators. However, theengineering educators offer students their first introduction to engineering design.By examining the design processes of engineering faculty members, we can gaina new perspective on engineering design practices in addition to insight intostudents’ learning of design. Here we present both quantitative and qualitativedata concerning the design processes of four engineering faculty members. Theresults suggest that faculty designers’ processes are very diverse. We offer someimplications of the variety in educators’ design processes with an emphasis onpossible teaching opportunities and challenges suggested by the data.
nyone who has been involved in design education realizes thecomplexity entailed. We can start to unpack this complexity byturning to relevant research in education. Such research suggests
that the effectiveness of educational interventions is influenced by factorssuch as the varied difficulties learners experience when learning in aspecific domain, the demands associated with gaining particular types ofknowledge, the variety of potential learning outcomes in a domain, thechallenges students often have in moving from one conception of asubject matter to another, the resources available to support theinstruction, and the conditions under which different teaching strategieswork (e.g., Sinatra and Pintrich 2003; Bransford et al. 1999). In thecontext of design, these observations point to the importance ofunderstanding a) the strategies and knowledge expert designers drawupon, b) what the development of such strategies and knowledge lookslike, and c) when different types of instructional approaches such asstudio teaching or project-based teaching are appropriate. The designcommunity is already exploring these issues and other related issues(e.g., Cross and Clayburn Cross 1998, Newstetter and McCracken 2001,Goldschmidt 2002).
Teacher knowledge is another factor that impacts the effectiveness ofeducational interventions. Recent research has drawn attention to thetypes of knowledge that educators bring to their teaching and the impactof this knowledge on the effectiveness of the teaching. For example,some researchers have compared the strategies used by expert andnovice teachers in order to illustrate the types of unique knowledge thatexperts bring (e.g., Livingston and Borko 1989). Other researchers have
A
Cynthia J. Atman, Jennifer Turns, Monica E. Cardella and Robin S. Adams
focused specifically on pedagogical content knowledge—an educator’sknowledge about the difficulties students encounter when learningsomething and the teaching strategies that can be used to address thedifficulties (Shulman 1987, Bullough 2001). Still other researchers havelooked at the beliefs that educators have about the subject matter andstudents they are teaching (Wideen, Mayer-Smith and Moon, 1998).
These observations on the importance of teacher knowledge suggest thatit might be beneficial for the design research community to explore theknowledge of its design educators. One starting approach would be tocharacterize the design processes of design educators. We could then usethis information to explore how the educators’ design processes comparewith the design processes of their students, of design experts, and even ofthe textbooks that they use for teaching. For example, previous studies ofentering and graduating students’ design processes have suggested thatstudent processes are quite variable (Atman and Turns 2001). Does thisfinding apply also to design educators, or do the educators have morestandardized approaches to design? In order to ask this question andother potential questions, it would be useful to have educator designprocesses characterized in a manner that is consistent with acharacterization of students and also characterized in some detail.
In this paper, we begin a discussion of the design knowledge of designeducators, guided by the factors mentioned above.Overall, through the paper, we seek to address three questions:
1. What do the design processes of engineering educators look like?Specifically, are the design processes consistent across theeducators, or are they highly variable, as are the students in theprevious studies?
2. What teaching ideas or teaching challenges are suggested by theseresults?
3. What additional research is suggested by these results?
Specifically, we report on the design processes of four engineeringeducators who completed a design task under laboratory circumstances.Because this task was the basis for an earlier experiment exploring thedesign processes of entering and graduating engineering students, theeducator and student results are directly comparable. In ourpresentation, we characterize the design processes of the educators alonga wide variety of dimensions, in order to provide a thick description oftheir activities.
1. Methods
In this study we asked four educators to design a playground for afictitious neighborhood. This problem was a variation of a problemdeveloped for a term project in an engineering course (Dally and Zhang1993). The instructions for the problem are presented in Figure 1. At anypoint during the solution process, the educators were able to ask theexperiment administrator for information about the neighborhood, budget,materials, safety and many other factors relevant to playground design.

The Design Processes of Engineering Educators:Thick Descriptions and PotentialImplications
In some instances, however, the participants requested pieces ofinformation beyond the scope of the administrator’s box of information.
The four educators represented three engineering departments: industrialengineering, mechanical engineering and nuclear engineering. Three werein their early 30s—32, 34 and 35—while the fourth was 62. Three of thedesigners were male and one was female. Three of the educators hadexperience working in industry.
Figure 1: Problem text
Three of the educators solved the problem in a laboratory setting at auniversity and one solved the problem in a private home setting. Theeducators were asked to think aloud as they solved the problem (Ericssonand Simon 1993, Atman and Bursic 1998). They solved two problems topractice thinking aloud before solving the three-hour playground designproblem. If they fell silent during the experiment, the experimentadministrator encouraged them to keep talking. After they completedtheir design, they read and commented on a description of the designprocess and completed a questionnaire. All four educators wereaudiotaped while solving the problem, and the educators who solved theproblem in the laboratory setting were also videotaped. These sameprocedures were used in a previous study investigating students’ design
You live in a mid-size city. A city resident has recently donated a corner lot fora playground. You are an engineer who lives in the neighborhood. You have beenasked by the city to design equipment for the playground.
You estimate that the children who usually use the equipment will range inage from 1 to 10 years. However, occasionally some adults will also use thisequipment. From the amount of space you have in the park, you estimate that youshould design equipment to keep 12 children busy at any one time. You would alsolike to have at least three different types of activities for the children. The equipment must:• be safe for the children• remain outside all year long• not cost too much• comply with the Americans for Disabilities Act, so handicapped children will beable to play also
The neighborhood does not have the time or money to buy ready madeequipment pieces. Your design should use material that is available at anyhardware or lumber store. The equipment must be constructed in under 2 months.
Please explain your solution as clearly and completely as possible. From yoursolution, someone should be able to build your playground without any questions.The administrator has more information and tools to help you address this problemif you need them. You must be specific in your requests. For example, if youwould like a diagram of the corner lot for the playground equipment, you may askfor it now. If you think of any more information you need as you solve theproblem, please ask.
Remember, you have approximately 3 hours to develop a complete solution.The administrator will inform you about how much time is left as you work.
Cynthia J. Atman, Jennifer Turns, Monica E. Cardella and Robin S. Adams
behavior (Atman et al 1999); we will mention some results of the study ofthe students in the discussion section.
Transcripts of the tapes then form the data with which we performed averbal protocol analysis (VPA) to identify and describe the designprocesses the educators used. Each transcript was segmented into smallunits of text that could be coded with four predetermined coding schemes.Both segmenting and coding were performed by two independentanalysts, and all differences were resolved. The four codes categorizeaspects of the design processes that were employed, including designstep, activity, information processed (e.g., budget, material costs, etc.)and object (e.g., slide, benches, landscaping, etc.). A description of thecodes for design step and activity is presented in Table 1. The codedsegments were then used as a basis for describing the design processes ofthe educators in terms of amount of time per code and transitionsbetween codes. As shown in Table 1, the design steps were grouped intothree design stages (Problem Scoping, Developing Alternative Solutionsand Project Realization); this allowed us to also measure amounts of timeper stage and transitions between stages.
Table 1: Design step and activity coding scheme
Design Step DescriptionProblem Scoping:
Identifying a Need Identify basic needs (purpose, reason for design)Problem definition (PD) Define what the problem really is, identify the
constraints, identify criteria, reread problem statementor information sheets, question the problem statement
Gathering information (GATH) Search for and collect informationDeve l op i ng A l t e rna t i v eSolutions:
Generating ideas (GEN) Develop possible ideas for a solution, brainstorm, listdifferent alternatives
Modeling (MOD) Describe how to build an idea, measurements,dimensions, calculations
Feasibility Analysis (FEAS) Determine workability, does it meet constraints,criteria, etc.
Evaluation (EVAL) Compare alternatives, judge options, is one better,cheaper, more accurate
Project Realization:Decision (DEC) Select one idea or solution among alternativesCommunication (COM) Communicate the design to others, write down a
solution or instructionsImplementation Produce or construct a physical device, product or
systemActivity Description
Read Read either the problem statement or information thathas been gathered
Constraints Identify, deal with or meet problem constraintsAssumptions Make implicit or explicit assumptionsCalculate Make calculationsOther Perform another design activity, such as request
information that is unavailable
Finally, the educators’ solutions were scored for quality of solution. Thequality of solution score is comprised of three elements. The first was aset of forty criteria that each solution should meet. The first seven criteria
The Design Processes of Engineering Educators:Thick Descriptions and PotentialImplications
were based on the specific constraints given in the problem statement,and the remaining criteria were based on design criteria that allplayground designs should meet, as outlined in Play for All (Moore,Goltsman and Iacofano 1992). The second part of the quality score isbased on whether the designer met additional criteria that wereappropriate for the participant’s particular design. The final part of thescore was based on ratings for diversity of activities, aesthetics, protectionfrom injury, uniqueness and technical feasibility. These ratings werescored on a scale from one to five.
2. Results from educators
A detailed description of the data from these four subjects is available in atechnical report (Cardella et al. 2003). In this section we present a subsetof the data that allows us to richly characterize the design processes ofthese four educators. We present this data through five windows: 1)quantitative data presented in Table 2, 2) qualitative data gathered fromthe participants’ transcripts, 3) design activity timelines presented inFigure 2, 4) cumulative time charts presented in Figure 3 and 5) three-dimensional bar charts showing the intersections of design activities inFigure 4.
2.1 Window 1: quantitative data
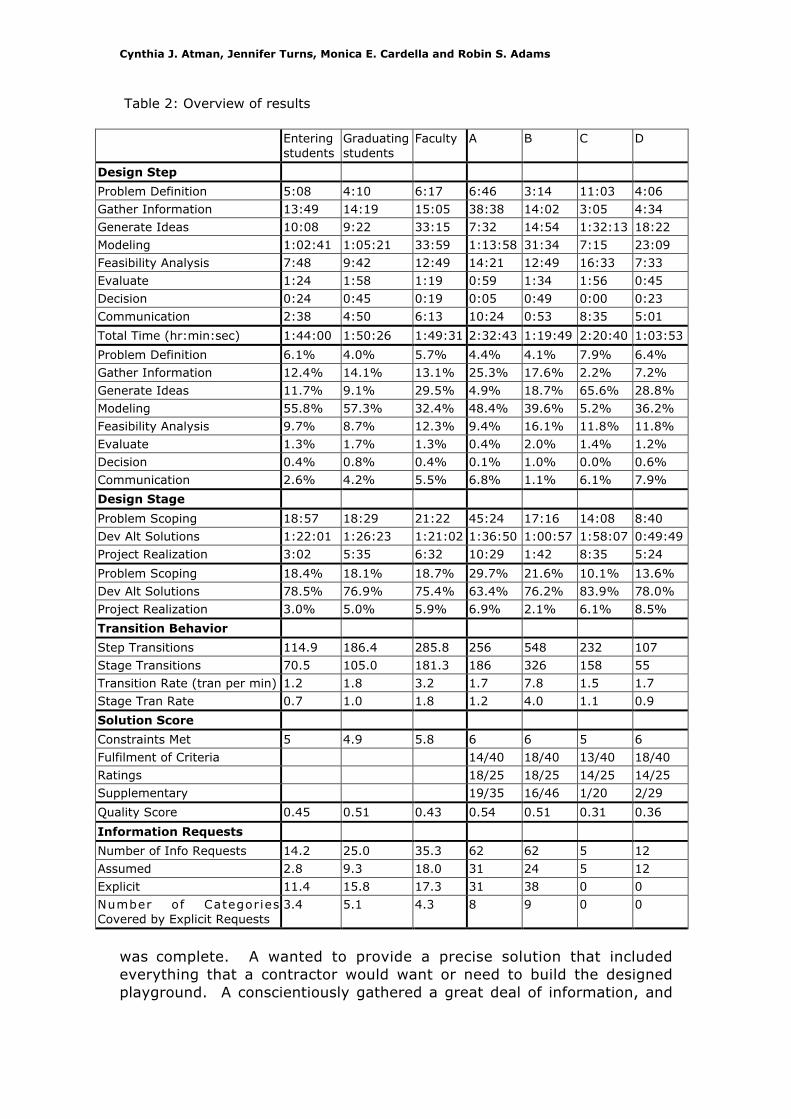
Table 2 presents summary statistics for the faculty and student designersas well as the outcomes for each individual faculty participant. FromTable 1 we see that the four faculty participants spent strikingly differentamounts of time solving the problem, ranging from 1 hour 3 minutes to 2hours 32 minutes. Participant B transitioned between design activities ata much faster rate (7.81 transitions per minute) than the other threeparticipants (1.67, 1.45, 1.67 transitions per minute). We also see thatparticipants A and B each requested 62 pieces of information while Cgathered only 5 pieces of information and D requested 12 pieces.Additionally, C and D did not explicitly request this information from theexperiment administrator—instead, C and D made assumptions about theinformation that they needed (for example, instead of asking theadministrator if supervision is available, C assumed that there would bepeople around to supervise play).
2.2 Window 2: qualitative data from transcripts
In this section, we present qualitative data from each participant’scomplete transcript, which includes the protocol for the playground designas well as each educator’s reflection on the design process. Additionally,we have incorporated data from the educators’ questionnaires.
Participant A: Methodical and ComprehensiveParticipant A was a 32-year-old female faculty member in an industrialengineering department. A had worked as a systems analyst for nineyears before beginning the faculty position. This participant used the fullthree hours and would have liked more time; even so, A’s final solution
Cynthia J. Atman, Jennifer Turns, Monica E. Cardella and Robin S. Adams
Table 2: Overview of results
Enteringstudents
Graduatingstudents
Faculty A B C D
Design Step
Problem Definition 5:08 4:10 6:17 6:46 3:14 11:03 4:06
Gather Information 13:49 14:19 15:05 38:38 14:02 3:05 4:34
Generate Ideas 10:08 9:22 33:15 7:32 14:54 1:32:13 18:22
Modeling 1:02:41 1:05:21 33:59 1:13:58 31:34 7:15 23:09
Feasibility Analysis 7:48 9:42 12:49 14:21 12:49 16:33 7:33
Evaluate 1:24 1:58 1:19 0:59 1:34 1:56 0:45
Decision 0:24 0:45 0:19 0:05 0:49 0:00 0:23
Communication 2:38 4:50 6:13 10:24 0:53 8:35 5:01
Total Time (hr:min:sec) 1:44:00 1:50:26 1:49:31 2:32:43 1:19:49 2:20:40 1:03:53
Problem Definition 6.1% 4.0% 5.7% 4.4% 4.1% 7.9% 6.4%
Gather Information 12.4% 14.1% 13.1% 25.3% 17.6% 2.2% 7.2%
Generate Ideas 11.7% 9.1% 29.5% 4.9% 18.7% 65.6% 28.8%
Modeling 55.8% 57.3% 32.4% 48.4% 39.6% 5.2% 36.2%
Feasibility Analysis 9.7% 8.7% 12.3% 9.4% 16.1% 11.8% 11.8%
Evaluate 1.3% 1.7% 1.3% 0.4% 2.0% 1.4% 1.2%
Decision 0.4% 0.8% 0.4% 0.1% 1.0% 0.0% 0.6%
Communication 2.6% 4.2% 5.5% 6.8% 1.1% 6.1% 7.9%
Design Stage
Problem Scoping 18:57 18:29 21:22 45:24 17:16 14:08 8:40
Dev Alt Solutions 1:22:01 1:26:23 1:21:02 1:36:50 1:00:57 1:58:07 0:49:49
Project Realization 3:02 5:35 6:32 10:29 1:42 8:35 5:24
Problem Scoping 18.4% 18.1% 18.7% 29.7% 21.6% 10.1% 13.6%
Dev Alt Solutions 78.5% 76.9% 75.4% 63.4% 76.2% 83.9% 78.0%
Project Realization 3.0% 5.0% 5.9% 6.9% 2.1% 6.1% 8.5%
Transition Behavior
Step Transitions 114.9 186.4 285.8 256 548 232 107
Stage Transitions 70.5 105.0 181.3 186 326 158 55
Transition Rate (tran per min) 1.2 1.8 3.2 1.7 7.8 1.5 1.7
Stage Tran Rate 0.7 1.0 1.8 1.2 4.0 1.1 0.9
Solution Score
Constraints Met 5 4.9 5.8 6 6 5 6
Fulfilment of Criteria 14/40 18/40 13/40 18/40
Ratings 18/25 18/25 14/25 14/25
Supplementary 19/35 16/46 1/20 2/29
Quality Score 0.45 0.51 0.43 0.54 0.51 0.31 0.36
Information Requests
Number of Info Requests 14.2 25.0 35.3 62 62 5 12
Assumed 2.8 9.3 18.0 31 24 5 12
Explicit 11.4 15.8 17.3 31 38 0 0
Number of CategoriesCovered by Explicit Requests
3.4 5.1 4.3 8 9 0 0
was complete. A wanted to provide a precise solution that includedeverything that a contractor would want or need to build the designedplayground. A conscientiously gathered a great deal of information, and
The Design Processes of Engineering Educators:Thick Descriptions and PotentialImplications
then proceeded with the design. The designer rarely backtracked orchanged a decision.
Two main themes guided A’s design: user-centered and precision. Beforeeven considering any playground equipment, A gathered information onthe types of activities the user group (children and parents) wanted. Allthroughout the process of designing the playground, A thought aboutwhat the contractor would need in order to build the playground. As forprecision, A spent a great deal of time determining dimensions and costs.A also used a matrix to check problem requirements and prioritize andarrange equipment. The designer rarely designed at a more abstractlevel—considering various thematic arrangements for the playground, orconsidering different configurations or collections of activities.
A’s final solution consisted of a scaled layout diagram, costs for each pieceof equipment (for example, A’s swings cost $93.71 each) as well as abreakdown of the costs for each of the elements of each piece ofequipment, plans showing dimensions for each piece of equipment and aschedule showing when each piece of equipment would be built. For thefinal layout, A cut out pieces of paper to represent the different pieces ofequipment and then arranged the cut-outs within the lot space. Thedesign does not include many elements beyond the list from theneighborhood survey (the user survey was one of the pieces ofinformation that the participant could request; it listed the six mostpopular pieces of playground equipment). However, A conscientiouslysought to meet the users’ needs throughout the design process.Participant A wanted to provide a precise solution that included everythingthat a contractor would want or need to build the designed playground.
Participant B: Information-Gathering IteratorParticipant B was a 34-year-old male professor of mechanical engineeringwith experience working in industrial departments at four differentcompanies. Unlike the other three faculty participants, B solved theproblem at home rather than a laboratory setting. B interpreted the taskas requiring a detailed, precise solution.
Like A, B was an implementer who gathered extensive amounts ofinformation at the beginning of the design process and then continuouslymodeled solutions. B in particular operated under an overarching strategyof information optimization. This faculty member began the designprocess by asking for 56 pieces of information (including both informationthat was and information that was not available) on the surrounding area,the playground lot, and the environmental conditions before saying:
Okay, let’s see, I’m about ready to design this…
B then used the information to define the problem as opposed to creatingB’s own problem definition. This participant started off trying to establishthen re-establish the design constraints and interpret the rules.

Cynthia J. Atman, Jennifer Turns, Monica E. Cardella and Robin S. Adams
Additionally, this participant was very concerned with understanding theenvironment, and used this as a second main strategy. Finally, B notedearly on in the design process:
…it’s going to be very iterative.
In fact, B made more than twice as many transitions among designactivities (548) than the other participants (256 for A, 232 for C and 107for D) and B had a much higher transition rate (7.81 transitions perminute) than the other faculty participants (1.67, 1.54, 1.67 transitionsper minute).
B continued working until detailing a final design. Like A, B included ascale on the diagram. Participant B produced a neat, organized design.
Participant C: Idea GeneratorParticipant C was a 35-year-old male assistant professor of MechanicalEngineering. He related the problem to his experiences with his 2 year-oldchild. This designer spent 2 hours, 20 minutes solving the problem butstopped before producing a detailed design.
Early in the design process, C requested a piece of information that wasnot available; this was the only time that C requested information. Thisfirst interaction possibly led C to believe:
…there’s a lot of information that was inaccessible… for example,price information and material.
C generated many ideas and then invested only 7 minutes in modeling thedesign alternatives.
C displayed one of Goel and Pirolli’s traits of expert designers: reversingthe direction of transformation (Goel and Pirolli 1992). C wanted toinclude the buildings that surrounded the lot in the design of theplayground. Once C realized this desire, C manipulated the problem to tryto incorporate the surrounding buildings.
Another distinguishing characteristic about C’s design process was theintroduction of additional constraints. From the beginning of the protocol,C wanted to design more than an ordinary playground—C wanted alearning experience in which children would learn to become participatingmembers of society, co-operate with each other to accomplish goals andchallenge themselves both cognitively and physically. C wanted to designa community experience where children of all ages played and learnedtogether. C met many of the problem’s stated requirements, butextended much more time trying to meet the requirements he himselfdeveloped.
Finally, C’s process was very structured, and C expressed awareness ofdecisions to engage in specific activities. For example, early in the designprocess, C referred to the constraints C needed to meet and the processof acquiring materials and said,

The Design Processes of Engineering Educators:Thick Descriptions and PotentialImplications
…again, I think this is something I’ll work on a little later.
A few minutes later C decided:
Okay, so, well, I’ve picked out a starting place for myself. I’mgoing to, as I’m talking, as I write, I’m going to continue to glanceback and forth at the map.
In the end, this faculty member did not produce a very detailed finaldesign. C thought of equipment ideas but did not specify how to build theequipment. This led to a low quality score, since C did not fulfill thesupplementary criteria, which were based on equipment specifications.However, Participant C’s design did include playground equipment andactivities that deviated from the user-defined list, such as a post officewhere children can write letters and then deliver them to mailboxes.
Participant D: Rich Life ExperiencesParticipant D was a 63-year-old male practitioner who taught somenuclear engineering courses. This participant commented on havingparticipated in neighborhood playground projects and also describedqualities of four different playgrounds while debriefing the designexperience with the administrator. D completed the playground design injust over one hour and chose not to provide complete design details. Dknew where he would have gone if he had continued to design (to CAD orconstruction paper models), but consciously decided not to do this.
The designer focused primarily on one solution, and drew upon some veryclear domain knowledge (e.g., what is required in a building permit), butdid not explicitly request much information. The experimentadministrator’s explanation for this is that the participant was:
very familiar with many things in the box [of information]: drew alot from his expertise.
Like C, D displayed a self-awareness of the activities that he chose toengage in:
…let’s go back through and see now, we’ve got, we’ve got thegeneral design done, we haven’t now, sat down and actually laidout in, in detail…
The designer addressed a collection of boundary/interface issues—whatwould make the design buildable by the community (and what could beassumed about the community’s building ability), supporting additionalfund raising, and thinking about the fence around the property. Theparticipant visualized safety issues and accounted for them whiledesigning.
The designer also gave a great deal of attention to costs—but did not endup meeting the cost requirement for the quality coding. However, D didtalk about how to meet cost if the final solution was over budget. D alsotalked about the cost of construction, about hiring a contractor, about the
Cynthia J. Atman, Jennifer Turns, Monica E. Cardella and Robin S. Adams
potential need for fundraising. However, this designer missed somepoints for his quality score because he did not devise a final budget orestimate the costs of specific pieces of equipment. The designer’sdecision to stop before producing detailed design specifications alsocontributed to a low quality score.
Participant D designed at a higher level of abstraction, rarely getting downto the level of dimensions/costs. In contrast, A rarely designed at anabstract level (i.e. considering different configurations or collections ofactivities). While C and D can be characterized as idea generatorsoperating on an abstract level, both A and B were implementers whogathered extensive amounts of information at the beginning of the designprocess and then continuously modeled solutions.
2.3 Window 3: design step timelines
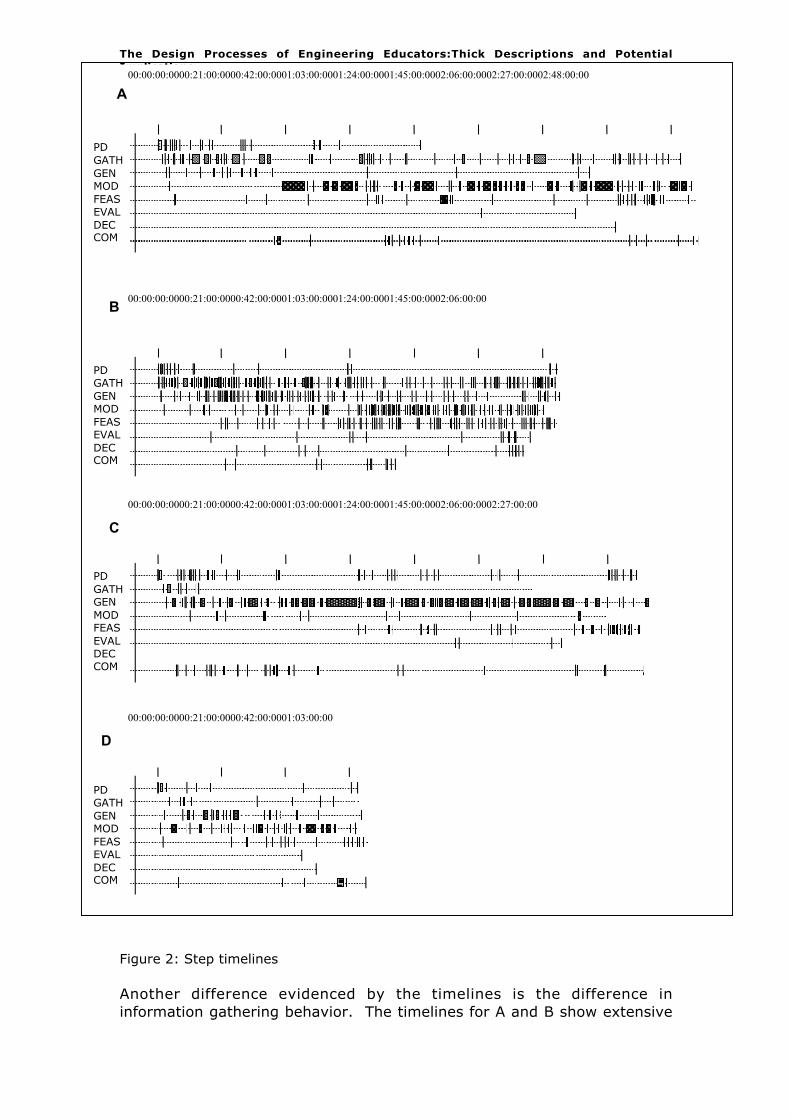
As the previous section suggests, one striking result was in the variabilityof the design processes across the participants. The design step timelinesin this section provide additional insight on this variability—they displayeach participant’s allocation of time throughout the design process. Thetimelines were created using MacSHAPA (Sanderson et al. 1994). Time ispresented from left to right, and time spent in each design step isindicated horizontally. As a participant spent time in a design step, ablock is placed on the line for that step. The width of the block representsthe amount of uninterrupted time that the participant spent in the step.Wider blocks suggest that the participant stayed in one step rather thantransitioning between steps.
The step timelines (see Figure 2) show that for the most part, all fourfaculty participants spent time in each step all throughout the designprocess. This is in contrast to some of the student designers who failed tospend any time in the activities of Evaluation (EVAL), Decision Making(DEC) or Communication (COM). While the faculty participants spent lesstime in these steps as they did in the other five steps, the facultyparticipants did spend some time in these activities. Most notably thefaculty participants spent time in communication throughout their designprocesses. Returning to Table 1 we also see that the faculty spent ahigher average amount of time in Communication than did the students.
The timelines also show that the faculty participants often transitionedbetween steps. This is notable since our previous studies with studentdesigners have shown that transition behavior is correlated with quality ofsolution. Most of the tick marks are narrow, showing that a small amountof time was spent on this activity before the faculty participanttransitioned to a different activity. One exception is noticeable in C’stimeline: C often spent long periods of time Generating Ideas (GEN). Thatis, C would start to generate ideas and would continue to do so for anappreciable amount of time before switching to a different activity. Thenoticeable chunks of time devoted to generating ideas in C’s timelines alsodraw attention to the fact that C spent far more time generating ideasthan in the other seven steps.
The Design Processes of Engineering Educators:Thick Descriptions and PotentialImplications
Figure 2: Step timelines
Another difference evidenced by the timelines is the difference ininformation gathering behavior. The timelines for A and B show extensive
PDGATHGENMODFEASEVALDECCOM
D
C
PDGATHGENMODFEASEVALDECCOM
PDGATHGENMODFEASEVALDECCOM
A
PDGATHGENMODFEASEVALDECCOM
B
00:00:00:0000:21:00:0000:42:00:0001:03:00:0001:24:00:0001:45:00:0002:06:00:0002:27:00:0002:48:00:00
00:00:00:0000:21:00:0000:42:00:0001:03:00:0001:24:00:0001:45:00:0002:06:00:00
00:00:00:0000:21:00:0000:42:00:0001:03:00:0001:24:00:0001:45:00:0002:06:00:0002:27:00:00
00:00:00:0000:21:00:0000:42:00:0001:03:00:00
Cynthia J. Atman, Jennifer Turns, Monica E. Cardella and Robin S. Adams
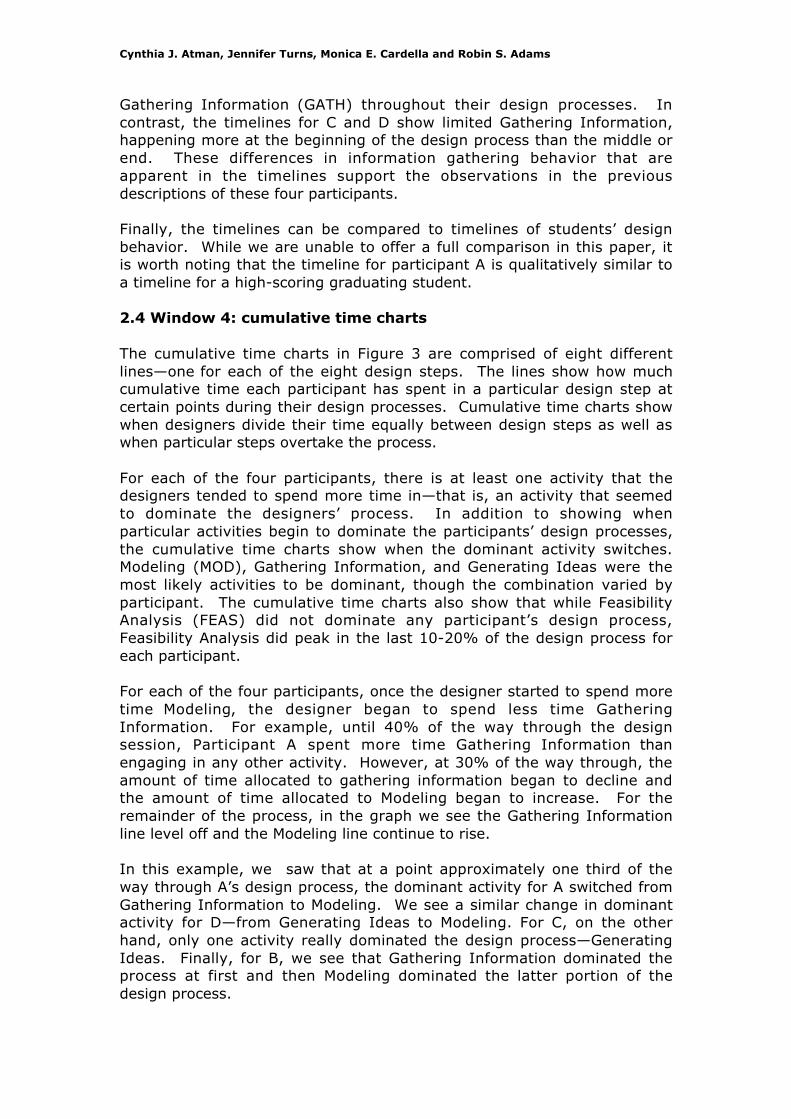
Gathering Information (GATH) throughout their design processes. Incontrast, the timelines for C and D show limited Gathering Information,happening more at the beginning of the design process than the middle orend. These differences in information gathering behavior that areapparent in the timelines support the observations in the previousdescriptions of these four participants.
Finally, the timelines can be compared to timelines of students’ designbehavior. While we are unable to offer a full comparison in this paper, itis worth noting that the timeline for participant A is qualitatively similar toa timeline for a high-scoring graduating student.
2.4 Window 4: cumulative time charts
The cumulative time charts in Figure 3 are comprised of eight differentlines—one for each of the eight design steps. The lines show how muchcumulative time each participant has spent in a particular design step atcertain points during their design processes. Cumulative time charts showwhen designers divide their time equally between design steps as well aswhen particular steps overtake the process.
For each of the four participants, there is at least one activity that thedesigners tended to spend more time in—that is, an activity that seemedto dominate the designers’ process. In addition to showing whenparticular activities begin to dominate the participants’ design processes,the cumulative time charts show when the dominant activity switches.Modeling (MOD), Gathering Information, and Generating Ideas were themost likely activities to be dominant, though the combination varied byparticipant. The cumulative time charts also show that while FeasibilityAnalysis (FEAS) did not dominate any participant’s design process,Feasibility Analysis did peak in the last 10-20% of the design process foreach participant.
For each of the four participants, once the designer started to spend moretime Modeling, the designer began to spend less time GatheringInformation. For example, until 40% of the way through the designsession, Participant A spent more time Gathering Information thanengaging in any other activity. However, at 30% of the way through, theamount of time allocated to gathering information began to decline andthe amount of time allocated to Modeling began to increase. For theremainder of the process, in the graph we see the Gathering Informationline level off and the Modeling line continue to rise.
In this example, we saw that at a point approximately one third of theway through A’s design process, the dominant activity for A switched fromGathering Information to Modeling. We see a similar change in dominantactivity for D—from Generating Ideas to Modeling. For C, on the otherhand, only one activity really dominated the design process—GeneratingIdeas. Finally, for B, we see that Gathering Information dominated theprocess at first and then Modeling dominated the latter portion of thedesign process.

The Design Processes of Engineering Educators:Thick Descriptions and PotentialImplications
Figure 3: Cumulative time charts
D
0
5
1015
20
25
010
%20
%30
%40
%50
%60
%70
%80
%90
%10
0%cum
mu
lati
ve m
inu
tes PD
GATHGENMODFEASEVALDECCOM
GEN
MOD
F E A S
C
020406080
100120
010
%20
%30
%40
%50
%60
%70
%80
%90
%10
0%cum
mu
lati
ve m
inu
tes PDGATHGENMODFEASEVALDECCOM
GEN
A
0
20
40
60
80
010
%20
%30
%40
%50
%60
%70
%80
%90
%10
0%cum
mu
lati
ve m
inu
tes PD
GATHGENMODFEASEVALDECCOM
MOD
GATH
B
0
10
20
30
40
010
%20
%30
%40
%50
%60
%70
%80
%90
%10
0%cum
mu
lati
ve m
inu
tes PD
GATHGENMODFEASEVALDECCOM
GATH
MOD
GEN
F E A S
Cynthia J. Atman, Jennifer Turns, Monica E. Cardella and Robin S. Adams
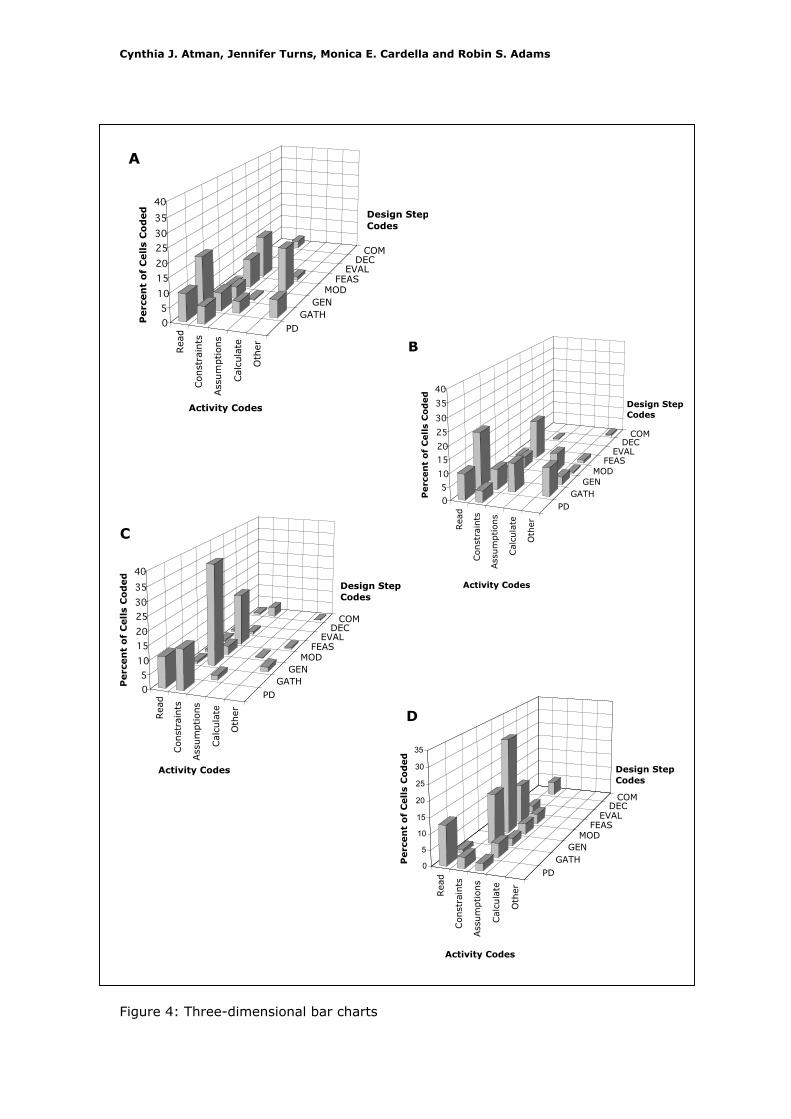
Figure 4: Three-dimensional bar charts
Rea
d
Const
rain
ts
Ass
um
ptions
Cal
cula
te
Oth
er
PDGATH
GENMOD
FEASEVAL
DECCOM
05
10152025303540
Perc
en
t o
f C
ell
s C
od
ed
Activity Codes
A
Design Step Codes
Rea
d
Const
rain
ts
Ass
um
ptions
Cal
cula
te
Oth
er
PDGATH
GENMOD
FEASEVAL
DECCOM
05
10152025303540
Perc
en
t o
f C
ells
Co
ded
C
Activity Codes
Design Step Codes
Rea
d
Const
rain
ts
Ass
um
ptions
Cal
cula
te
Oth
er
PDGATH
GENMOD
FEASEVAL
DECCOM
05
10152025303540
Perc
en
t o
f C
ells
Co
ded
Activity Codes
B
Design Step Codes
Rea
d
Const
rain
ts
Ass
um
ptions
Cal
cula
te
Oth
er
PDGATH
GEN MOD
FEAS EVAL
DEC COM
0
5
10
15
20
25
30
35
Perc
en
t o
f C
ell
s C
od
ed
Activity Codes
D
Design Step Codes
The Design Processes of Engineering Educators:Thick Descriptions and PotentialImplications
2.5 Window 5: three-dimensional bar charts
The three-dimensional bar charts represent a detailed matrix of designprocess variables (Figure 4). Episodes of time spent in each design stepare shown divided among design activities. Each bar representspercentage of total time spent at the intersection of a design step and adesign activity. Further discussion of each of these representations can befound in Chimka and Atman (1998).
The three-dimensional bar charts show that each educator coveredapproximately half of the possible intersections of design steps and designactivities. Across the four faculty designers, Modeling and FeasibilityAnalysis co-occurred with each of the five design activities. ProblemDefinition (PD), Gathering Information and Generating Ideas co-occurredwith most of the design activities—all except Calculate. However, thethree dimensional bar charts also show that there are some consistentgaps. For example, few activities co-occur with Calculate. Additionally,Decision only co-occurred with Constraints. Perhaps most surprising is thefinding that Assumptions was largely limited to Gathering Information.Only D makes assumptions while engaged in Problem Definition, Modelingand Feasibility Analysis.
The three-dimensional bar charts also illustrate the differences in thefaculty designers’ approaches. We see relatively uniform coverage fordesigners A and B, with percentages (represented by bars) that areapproximately the same magnitude. For C and D, however, we see thatsome percentages are much greater and some percentages are muchsmaller than others, suggesting that C and D concentrated their time inspecific step and activity combinations. Specifically, C spent a largeamount of time Generating Ideas while dealing with constraints while Dspent much time Modeling while dealing with constraints. While these twodesigners spent a large amount of time dealing with constraints, they didnot spend any time Gathering Information while dealing with constraints.Returning to A and B, the notable time spent in Constraints is at theintersection with Feasibility Analysis. From this we see an overalldifference between the two pairs (A&B and C&D) in how they allocatedtheir time as well as a difference in the way that the two pairs dealt withthe problem constraints.
3. Discussion
In this paper, we have sought to characterize the design processes ofengineering educators. This information can contribute to the discussionof teaching of design as well as opportunities for research on design.Specifically, we have provided detailed descriptions of the designprocesses of four designers, and compared these processes using fivewindows. In this discussion, we return to the questions guiding thispaper:
1. What do the design processes of engineering educators look like?Specifically, are the design processes consistent across the
Cynthia J. Atman, Jennifer Turns, Monica E. Cardella and Robin S. Adams
educators, or are they highly variable, as are the students in theprevious studies?
2. What teaching ideas or teaching challenges are suggested by theseresults?
3. What additional research is suggested by these results?The responses to these questions serve to summarize our results andpoint to future opportunities.
3.1 What do educators’ design processes look like?
In the results section, we characterized the design products and designprocesses of four engineering faculty. The products of these designerswere varied, ranging from a conceptual solution to a detailed solution withcost estimates. The detailed process descriptions draw attention to a widevariety of issues in design: prioritizing criteria (e.g., innovative vs. costeffective vs. fun), stopping rules (e.g., deciding what counts as a solution,a conceptual solution vs. a detailed solution), extent to which individualdesigners explore alternatives, and determining how to bound a designepisode (e.g., Participant D seemed to have been designing playgroundsin his mind for some time).
While the thick descriptions provided us with an opportunity to drawattention to very distinctive qualities of these design processes andproducts, the representations make it easier to compare the fourdesigners. The step timelines draw attention to the extent of transitioningbehavior, which ranges from minimal for one subject to extensive foranother. The cumulative time charts permit us to see the dominantactivities and when particular activities emerge as dominant. We find thatthe activities of Modeling, Gathering Information and Generating Ideas togenerally represent dominant activities, but not consistently across thedesigners. Additionally, we find that some activities, such as FeasibilityAnalysis, were not dominant for any of the designers. Finally, the three-dimensional bar charts make it possible for us to characterize moreprecisely how time is allocated across various combinations of activities.From this representation, we note that two designers seemed to distributetime somewhat equally across a wide number of efforts while the othertwo designers seemed to spend more time in a smaller number of efforts.
The bottom line from these characterizations is that the faculty membershave diverse design processes. Just like engineering students, faculty arenot monolithic.
3.2 What teaching opportunities/challenges are suggested by thedata?
These observations about faculty design processes provide food forthought concerning their teaching implications and lead to variousadditional research questions and hypotheses. For example, we saw thatdesigners C and D were aware of the processes while A and B did notexhibit an awareness of their design processes. We wonder about theextent to which educators in general understand their own designprocesses. It seems that there may be benefits to be gained by helping

The Design Processes of Engineering Educators:Thick Descriptions and PotentialImplications
educators have a deeper understanding of their processes. We also findthat the variability in faculty design processes raises the question, what isthe effect of the alignment between faculty design processes and studentdesign processes? In our earlier study on student design processes, fiftyengineering students (26 entering students and 24 graduating students)solved the playground problem. Analysis of that data showed thatalthough on average the graduating students spent an equivalent amountof time solving the problem as the entering students, they had higherquality designs and had several interesting differences with respect totheir design process variables. The graduating students a) gathered moreinformation, b) with the information covering more categories, c)considered more alternative solutions, d) transitioned more frequently, e)had more iterations, and f) progressed further into the steps of the designprocess. Additionally, the design processes of the students varied, ratherthan following a single optimal strategy. The full details of that study canbe found elsewhere (Atman et al. 1999, Adams 2001).
We now return to our question on the effect of the alignment betweenfaculty design processes and student design processes. The data suggestthat there were faculty members who exhibited design processesresembling the processes of graduating students receiving high qualityscores (e.g., large number of transitions, high transition rate, and timespent in all steps including decision and communication), that there werefaculty who exhibited design processes resembling the processes of agroup of entering students that received low quality scores (e.g., effortconcentrated on problem definition, information gathering and generatingsteps and no progression to the Modeling step), and that there werefaculty who exhibited design processes resembling the archetypal enteringstudent (e.g., low transition rate, time concentrated on modeling).
What would happen in the cases where educators teach students whohave processes that are similar to the faculty members’ design process?Would this facilitate the giving of feedback? Would this facilitate thefaculty member’s being able to understand what the student is trying todo? One can also ask the opposite question, what happens when facultywork with students who exhibit design processes that are different incharacter to the faculty members’ design processes? In such cases ofmismatch, would the faculty member have greater difficulty understandingwhat the student is doing? Would he/she have greater difficulty inproviding advice/guidance? In such cases, do students tend to get lowergrades? In general, it seems possible that educators who are particularlysuccessful at teaching design may also be the educators who are attunedto such mismatches and have strategies for dealing with the potentiallyvaried circumstances.
3.3 What additional research opportunities are suggested by thedata?
As the preceding comments suggest, this study gives rise to a number offuture research question and opportunities. For example, the researchsuggests ideas for exploring expertise in teaching design. In addition tounderstanding educators’ design processes, we would like to understand
Cynthia J. Atman, Jennifer Turns, Monica E. Cardella and Robin S. Adams
educators’ teaching processes. Additionally, given that this studyexplored the design processes of four faculty members, one can askwhether the four processes are representative of engineering faculty as awhole. One can also ask about the extent to which the design processesof engineering faculty members are constant, or vary with problem,context, and knowledge.
Another question raised by this research is how faculty and student designprocesses compare to the design processes of expert engineeringdesigners—the types of designers we would like our engineering studentsto become. In this case, we are currently conducting a follow-on study toexplore this specific question. We are gathering data from approximately24 expert designers representing diverse engineering backgrounds anddifferent levels of expertise related to the problem (i.e., expertise inplayground design). The data from this study will shed light on thisquestion.
4. Conclusion
In this paper, we analyzed design behavior of designeducators—instructors who are representative of the types of instructorsfor the students who participated in our previous study. We found thatthe faculty members’ design behavior, like the students’ design behavior,varied considerably. However, we also discovered some design patterns;for example, Participants C and D both chose to stop designing theplayground before reaching detailed designs. In contrast, A and B chose astopping rule that prompted them to stop work on the problem only afterfinishing detailed designs. From this study, we have a betterunderstanding of how engineering educators address design problems.Additionally, we have raised questions about possible implications forengineering design education. Finally, this study provides a foundation forfuture exploration of engineering design expertise.
Acknowledgements
We would like to thank Karen Bursic, Justin Chimka, Stefanie Lozito,Heather Nachtmann and Mary Besterfield-Sacre who assisted with thisresearch. We would also like to thank Eddie Rhone for his assistance withthe analysis and for his careful reading of our manuscript and theundergraduate students who segmented and coded the transcripts.Finally, we would like to thank the engineering educators who participatedin our study. This research was made possible in part by National ScienceFoundation grants RED-9358516 and ROLE-0125547 as well as grantsfrom the Ford Motor Company and the GE Fund.
References
Adams R. (2001) Cognitive processes in iterative design behavior, Dissertation:University of Washington.
Atman, C. J. and Turns J. (2001) Studying Engineering Design Learning: FourVerbal Protocol Analysis Studies in McCracken, M., Newstetter, W. and Eastman,
The Design Processes of Engineering Educators:Thick Descriptions and PotentialImplications
C. (eds.) Design Knowing and Learning: Cognition in Design Education, NewJersey, Lawrence Erlbaum, pp 37-60.
Atman, C. J., Chimka J. R., Bursic K.M. and Nachtmann H. (1999) A Comparisonof Freshman and Senior Engineering Design Processes, Design Studies, 20, pp131-152.
Atman, C. and Bursic K. M. (1998) Verbal Protocol Analysis as a Method toDocument Engineering Student Design Processes, Journal of EngineeringEducation, 87, pp 121-131.
Bransford, J. D., Brown A. L., et al., eds. (1999) How People Learn: Brain, Mind,Experience, and School, Washington, D.C., National Academy Press.
Bullough, R. V. (2001) Pedagogical content knowledge circa 1907 and 1987: Astudy into the history of an idea, Teaching and Teacher Education, 17, pp 655-666.
Cardella, M. E., Turns, J., Atman, C. J., Adams, R. and Rhone E. (2003) DetailedDescriptions of The Design Processes of Four Engineering Educators, CELTTechnical Report CELT-03-01, Center for Engineering Learning and Teaching,University of Washington, Seattle, WA.
Chimka, J. R. and Atman, C. J. (1998) Graphical Representations of EngineeringDesign Behavior in Proceedings of the Frontiers in Engineering Conference, AZ.
Cross, N. and Clayburn Cross, A. (1998) Expertise in Engineering Design,Research in Engineering Design, 10, pp 141-149.
Dally, J.W. and Zhang, G.M. (1993) A freshman engineering design course,Journal of Engineering Education, 82, pp 83-91.
Durling, D. and Shackleton, J., Eds. (2002) Common Ground: Proceedings of theDesign Research Society Conference at Brunel University, Staffordshire UniversityPress, Stoke on Trent, UK.
Ericsson K. A. and Simon H. A. (1993) Protocol Analysis: Verbal Reports as Data,Cambridge, Massachusetts, The MIT Press.
Goel, V. and Pirolli, P. (1992) The Structure of Design Problem Spaces, CognitiveScience, 16, pp 395-429.
Goldschmidt, G. (2002) One-on-one: A Pedagogical Basis for Design Instruction inthe Studio, in D. Durling and J. Shakleton (eds.) Common Ground: Proceedings ofthe Design Research Society Conference at Brunel University, Stoke on Trent, UK,Staffordshire University Press, pp. 430-439.
Livingston, C. and Borko, H. (1989) Expert-Novice Differences in Teaching: ACognitive Analysis and Implications for Teacher Education, Journal of TeacherEducation, 40, pp 36-42.
Moore, R.C., Goltsman, S.M. and Iacofano, D.S., eds. (1992) Play for AllGuidelines: Planning, Design and Management of Outdoor Play Settings for AllChildren, Berkeley, CA, MIG Communications, Second Edition.
Newstetter, W. and M. McCracken (2001). Novice Conceptions of Design:Implications for the Design of Learning Environments, in McCracken, M.,Newstetter, W., and Eastman, C. (eds.) Design Knowing and Learning: Cognitionin Design Education, New Jersey, Lawrence Erlbaum, pp. 63-77.
Sanderson P. M., Scott J. J. P., Johnston T., Mainzer J., Watanabe L. M., andJames J. M. (1994) MacSHAPA and the enterprise of Exploratory Sequential DataAnalysis (ESDA), International Journal of Human-Computer Studies, 41, pp 633-681.
Shulman, L. S. (1987) Knowledge and teaching: Foundations of a new reform,Harvard Educational Review, 57, pp 1-22.

Cynthia J. Atman, Jennifer Turns, Monica E. Cardella and Robin S. Adams
Sinatra, G. M. and Pintrich, P. R., Eds. (2003) Intentional conceptual change,Mahwah, N.J., L. Erlbaum.
Wideen, M., Mayer-Smith, J., and Moon, B. (1998) A Critical Analysis of theResearch on Learning to Teach: Making the Case for an Ecological Perspective onInquiry, Review of Educational Research, 68, pp. 130-178.